Article

Assessing Groundwater Level Declination in Dhaka City and Identifying Adaptation Options for Sustainable Water Supply

Institute of Water and Flood Management, Bangladesh University of Engineering and Technology, Dhaka 1000, Bangladesh
*
Author to whom correspondence should be addressed.
Sustainability 2022, 14(3), 1518; https://doi.org/10.3390/su14031518
Submission received: 2 January 2022 / Revised: 23 January 2022 / Accepted: 26 January 2022 / Published: 28 January 2022
(This article belongs to the Special Issue Prospects in Sustainable Water Management)

Abstract

:
Dhaka city, having a population of about 18 million, depends heavily on groundwater as a source of quality water. However, the city is encountering a rapid depletion of groundwater, and its groundwater-based water supply is at risk of failure. This study was carried out to analyze the groundwater depletion scenarios occurring from 1970 to 2019 in the city and to find suitable options to sustain its water supply. The trends in groundwater levels (GWLs) were quantified by the non-parametric Sen’s slope and their significances were assessed by the modified Mann-Kendall test. Contour maps of GWL were generated to develop the contemporary GWL scenario in the city. Key informant interviews (KIIs) with the Dhaka Water Supply and Sewerage Authority (DWASA) officials, groundwater experts and researchers, in addition to semi-structured interviews with the DWASA consumers were conducted to assess current adaptation practices and to develop potential adaptation options. The effectiveness of the options was assessed by strengths, weaknesses, opportunities and threats (SWOT) analysis and the options were ranked through a normalization process of the weights given by the KIIs for future adaptabilities. The GWLs were found to be decreasing all over the city, varying from 0.6–2.4 m/year. The contour maps demonstrated that the groundwater of the central area had depleted more than the peripheral areas. The locations vulnerable to severe groundwater depletion were identified to be the Khilgaon, Sobujbagh, Motijheel, Dhanmondi, and Sutrapur areas and some parts of the Cantonment and Mirpur areas. Potential options identified were adopting more surface water treatment plants, rainwater harvesting, implementing a block tariff system, reducing non-revenue water, metering water consumption, and promoting public awareness. Spatially-varying adaptation strategies were also suggested for different zones. Some measures adopted by DWASA were not supported by the respondents.

1. Introduction

Dhaka city is the economic, administrative and educational center of Bangladesh, and the city has evolved into one of the largest megacities in the world over the past decades [1]. The city is dependent mainly on groundwater for its water supply. However, rapid, unplanned expansion of the city and uncontrolled drilling of wells have caused immense pressure on its vital water source [2,3]. The Dhaka Water Supply and Sewerage Authority (DWASA) is solely responsible for supplying piped water in the city for domestic and commercial purposes and currently supplies about 68% of its water from the underground sources [4]. The total estimated abstraction is about 5.9 million m3/d, of which DWASA supplies around 2.75 million m3/d from approximately 920 deep tubewells [4]. This colossal pumping, however, has caused groundwater levels (GWL) to drop more than 60 m over the last half-century, and the GWLs are currently declining at a rate of more than 3 m per year in the city center [5,6].
As the city is located adjacent to the tributaries/distributaries of the gigantic Ganges-Brahmaputra-Meghna river system, it should ensure induced recharge through the beds of the rivers surrounding the city [7]. However, the subsurface geology of the city consists of Madhupur clay in the upper layer, which is an aquitard. This layer is 6 to 12 m-thick in most parts of the city, which retards vertical recharge from rainwater infiltration and horizontal recharge from riverbed seepage [2,8,9,10]. Hence, the Dhaka aquifer gains most of its recharge through underground horizontal inflow, which is not sufficient to maintain groundwater balance given the rate of abstraction [11]. To meet the growing water demand of the city, the DWASA, along with private users, accelerated the rate of abstraction by installing more and more deep tubewells, as abstraction is not directly regulated or priced in the city and involves only pumping costs. The users also did not meter the volume of water usage from their tubewells [12]. Furthermore, the rechargeable areas are being reduced gradually due to the expansion of urban areas and infrastructures, and as a result, the natural water recharge to the aquifers could not keep pace with water withdrawal in the last two decades [13].
If such declination continues and the conditions of insufficient recharge of groundwater persists, the average static water level in the city would decline by 161 m by the year 2050 [13]. Many deep tubewells would become inoperative by that time. The water abstraction cost would increase and many people, particularly the poor, might be left out of formal water services. This has health, gender, social and economic ramifications. Thus, the groundwater-based present water supply in the city faces a future threat of an acute water crisis. Moreover, the fundamental policy and legal frameworks of the country, the National Water Policy (1999) and Bangladesh Water Act (2013), lag to provide effective guiding principles on permission and extraction limit of groundwater, monitoring and protecting quality water, and suggesting water-harvesting procedures and recharge mechanisms of the aquifer [12]. To avoid groundwater resource overrun, land subsidence due to hydrostatic pressure reduction, takeover by the market of basic water supplies and social inequity arising out of poor water services, etc., in Dhaka city, locally grounded, integrated and sustainable water management strategies are needed.
Countries that have experienced similar situations for various reasons have undertaken many strategies to ensure a sustainable water supply. The farmers and other stakeholders of East Anglia, UK, adopted groundwater management practices at different scales (national to farm) for developing adaptive capacity within groundwater abstraction management systems vulnerable to a changing climate [14]. India started practicing Managed Aquifer Recharge (MAR) in many areas for irrigation and the recharging of groundwater [15,16,17]. Australia has diversified the water supplies for some cities by adding reuse, groundwater, and desalination sources [18]. To limit groundwater overexploitation in South India, a participatory approach of building adaptation scenarios with stakeholders was applied and two policies, using ponds to harvest runoff water and drip irrigation to conserve water, were identified as consensual [19]. The key challenges involved in the development of an adaptive and sustainable groundwater management system in South Africa were identified through conducting interviews with experts [20]. The key challenges included the undervaluation of groundwater importance and significance, the need for expertise and information at all scales, and others. Household water consumption patterns and management practices were investigated based on a questionnaire survey in Jaffna district, Northern Sri Lanka [21]. The effectiveness of different water management interventions, such as increasing recharge, reducing per capita consumption, having additional water sources, reducing non-revenue water, and installing a water treatment plant, to meet future water demand were compared. In Rawalpindi, Pakistan, the groundwater level was decreasing at a rate of 1.38 m per year due to urbanization [22]. Preservation of green areas, control of excessive water use through volumetric pricing, wastewater reclamation for non-potable uses, etc., were suggested as potential measures in the study.
Though many studies are available on water management in cities, the studies available on Dhaka city are only a few. Ahsan [23] examined some water sector adaptation strategies where new and potential opportunities and strategies were proposed for Dhaka and also for Ankara. The author suggested small- and large-scale surface water treatment plants as supply-side adaptation strategies, and the use of technologies such as auto-switching pump controllers, water metering systems and freshwater automated teller machine booths, along with long-term behavioral changes as demand-side adaptation strategies to reduce water consumption by users. Hossain and Bahauddin [24] recommended developing an Integrated Water Resource Management system to overcome water-related problems in Dhaka and recognized approaches such as groundwater recharge, rainwater harvesting (RWH), effective water pricing, and water recycling and reuse as alternate supply and demand management tools. In a recent study [25], compliance with the Bangladesh Water Act (2013), allocation of resources to relevant government organizations, regulation of groundwater withdrawal, finding of alternate water sources, and MAR are suggested as potential options to arrest groundwater declination. The above studies on adaptation options for Dhaka are based on secondary data or information, and the suggestions provided therein to solve water supply problems are without adequate assessment of their applicability and acceptability.
To sustain the water supply system for Dhaka, updated information on groundwater depletion and a closer examination of the declination trends are needed. It is also essential to find out potential options based on local perceptions and experiences to meet the future water demand of the city. To alleviate the pressure on the city’s groundwater sources and to meet water demand immediately, several adaptation actions are being practiced by DWASA. However, these adaptation practices mostly focus on supply-oriented management, and demand-oriented management has not received due attention. Moreover, collation and assessment of the effectiveness of these practices had not been performed yet. This study attempts to fill in these gaps by identifying suitable options to manage the water supply of Dhaka. The specific objectives were to determine the trends in groundwater level decline and to identify suitable adaptation options in managing the water supply of Dhaka.

2. Materials and Methods
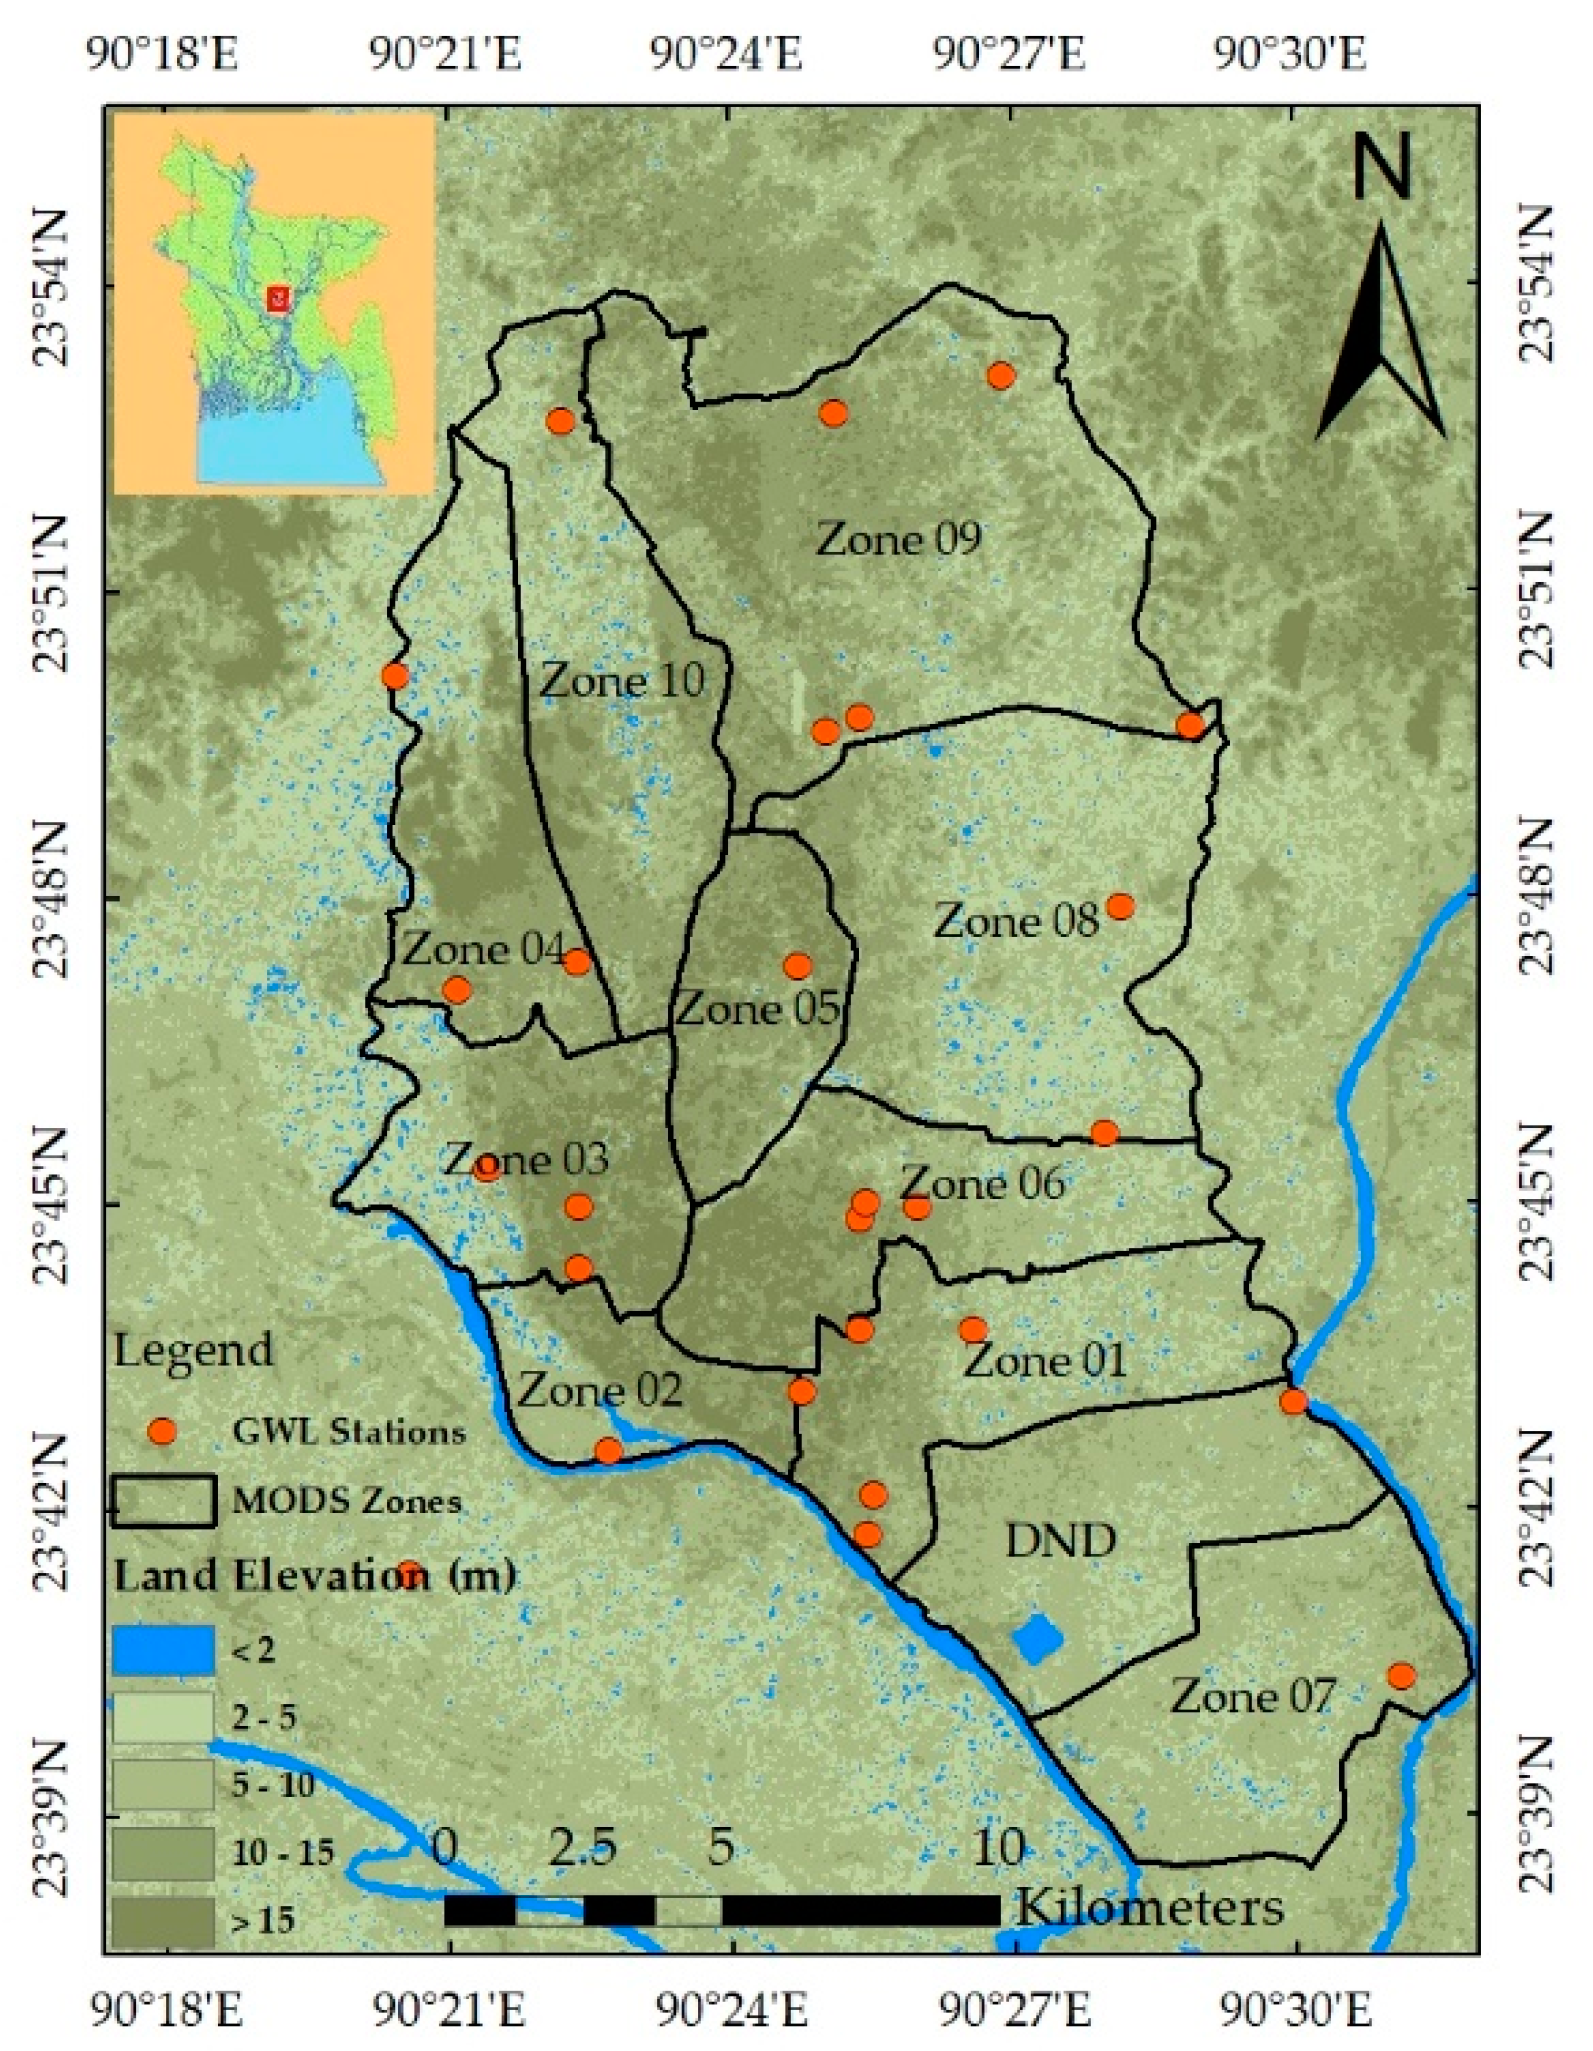
2.1. Study Area

The geographical area of this study includes the Dhaka Metropolitan City and the Dhaka-Narayanganj-Demra (DND) areas. The target area is surrounded by the Tongi Khal to the north, the Turag-Buriganga river system to the west, the Balu River to the east, and the Sitalakhya River to the south (Figure 1). The northern and central parts of Greater Dhaka are occupied by the southern part of the Madhupur Tract. The rest of the area is covered by the floodplains of the major rivers. Ground elevation of the city varies from 0.5 m to 12 m above the Public Works Datum [26]. The DWASA has divided the area into 10 Maintenance Operation Distribution Services (MODS) Zones and Narayanganj MODS to cater the water supply, sewerage and stormwater drainage services to the dwellers.
The aquifer system in the Dhaka area is the Pilo-Pleistocene Dupi Tila formation. This unconsolidated sediment has four aquifer layers from the surface to a depth of 364 m with variable thicknesses [4]. The groundwater recharge condition of Dhaka is not similar to that of other parts of the country. During the wet season in other parts, the unconfined to semi-confined types of aquifer layers gain most recharge through vertical percolation from precipitation and surface runoff. However, in Dhaka, the aquifer layers are covered by a thick Pleistocene clay layer, and the top surface area is also covered with impervious surfaces, such as roads and buildings, which are man-made in general. The clay layer and impervious surfaces restrict or retard vertical percolation. With the development of the city, wide roads and other paved areas, the unpaved areas, natural depressions and agricultural lands were replaced. In many cases, natural drainage canals and open water bodies were filled up for the development works. Unequal urbanization in the country and the concentration of urban services, employment and business opportunities in Dhaka has transformed it into a megacity [27]. The absence of adequate parks, open water bodies, and drainage systems has degraded the quality of living in the city in many ways.

2.2. Data Collection

Secondary data on groundwater levels were collected from the Bangladesh Water Development Board (BWDB) and DWASA for assessing and mapping groundwater level declination trends. The severely depleted groundwater zones were identified from the contour map. The Ground Water Hydrology Directorate of BWDB has a groundwater level-monitoring network of 1250 piezometers throughout the country. Twenty-one of these piezometric observation wells are within the Dhaka city area and were considered to assess the declining long-term trend in shallow aquifer groundwater level. The DWASA has 19 twin monitoring wells in the Dhaka city area, which were considered to assess the short-term changes in shallow and deep-aquifer GWLs. The piezometric head distribution in the aquifer system from the twin wells provides valuable information on the patterns of groundwater fluctuations and reflects the availability and sustainability of the groundwater resources. The time series data spanned from 1970 to 2019. Other secondary information on water production, number of deep tubewells, water tariff, etc., were collected from the relevant governmental and non-governmental organizations.
Primary data were collected for assessing adaptation options to reduce groundwater level declination and for better water management in Dhaka. These data were collected from Key Informant Interviews (KIIs) and Semi-structured Interviews (SSIs) using pre-tested checklists. A total of 17 KIIs were conducted in 2020 and the respondents included the directors of different projects of the BWDB and DWASA, academicians from two public universities based in Dhaka (the University of Dhaka and Bangladesh University of Engineering and Technology), and professionals from different non-governmental organizations. A total of 165 SSIs with consumers of the DWASA from the severely groundwater-depleted areas of Dhaka were conducted in 2020 and 2021 to compare the overall water-supply scenarios.

2.3. Statistical Method for Groundwater Level Trend Analysis

The trend in groundwater levels at each observation well was estimated by a nonparametric technique called Sen’s slope estimator. The Modified Mann-Kendal (MMK) test was used to assess the significance level of the trend as a nonparametric test. The significance assessment required the computations of the Normalized Test Statistic (Z), the Mann-Kendall Statistic (S) and the variance of S . The test was conducted at a 5% significance level. If the p-value was less than 0.05, it was concluded that there was a significant trend in the groundwater level of that particular observation well.

2.3.1. Sen’s Slope Estimator

If a linear trend is present in a time series, then the slope (change per unit of time) can be estimated using a simple nonparametric procedure suggested in Sen [28]. It is widely used for determining the magnitude of the trend in hydro-meteorological time series [29,30]. In this method, the slope estimates of N pairs of data are first calculated using the following expression:
Q i = X j     X k j     k   for   i = 1 ,   2 ,   3 ,   . ,   n
where, X j   and X k are the data values at times j and k (j > k), respectively. The median of these n values of Q i is the Sen’s estimator of slope which is calculated as:
β = { Q ( n   + 1 ) / 2   n   is   odd 1 2   ( Q n / 2 + Q ( n   + 2 ) / 2 )   n   is   even }
A positive value of β indicates an upward (increasing) trend and a negative value indicates a downward (decreasing) trend in the time series data.

2.3.2. Modified Mann-Kendal Test

The Mann-Kendall (MK) test [31,32] does not require the data to be distributed normally. The advantage of the test is its low sensitivity to abrupt breaks due to inhomogeneous time series [29]. The MK test has been widely used to assess the significance of trends in hydrological and meteorological time series [33,34,35,36].
The test starts with the evaluation of the MK statistic, S, defined as:
S = i = 1 n   1 j = i + 1 n sgn ( X j   X i   )
where, X1, X2, X3…………., Xn represent n data points with X j representing the data point at time j in the time series, and X j X i   = θ.
sgn θ = { 1   if   θ   >   0 0   if   θ = 0 1   if   θ   <   0   }
Under the assumption that the data are independent and identically distributed, the mean, E ( S ) , and the variance of the S statistic, Var ( S ) , are given as:
E(S) = 0
Var   ( S ) = n   ( n     1 ) ( 2 n + 5 ) i = 1 m t i ( t i   1 ) ( 2 t i + 5 ) 18
where, m is the number of groups of tied ranks, each with t i tied observations.
Equation (5) has also been modified based on the assumption that data are autocorrelated, and therefore the autocorrelation is to be estimated from the data [37]. When the data are actually independent, the assumption of autocorrelation may lead, in some cases, to failure to identify true trends, thus reducing the power of the test. This is due to the uncertainties in evaluating the autocorrelation in the data, especially with small samples. In the Modified Mann-Kendal (MMK) test, the effect of all significant autocorrelation coefficients is removed from a data set [37]. It is robust in the presence of autocorrelation in the data. In the MMK test, a modified variance of S, denoted as Var(S)*, is used as follows:
Var   ( S ) * = V   ( S ) n n *
where, n* is the effective sample size. The n/n* ratio is computed using the following equation [37]:
n n * = 1 + 2 n ( n     1 ) ( n     2 ) i = 1 n = 1 ( n   1 ) ( n     i     1 ) ( n     i     2 ) ri
where, n is the actual number of observations and ri is the lag-i significant autocorrelation coefficient of rank i of the time series. Once the Var(S)* is computed from Equation (6), the Z value and the corresponding significance level (p-value) of the one-tailed test are computed as:
Z = { S   -   1 Var   ( S ) *   If   S   >   0   0   If   S = 0 S + 1 Var   ( S ) *   If   S   <   0 }
p = 0 . 5   -   ( | Z | )
( | Z | ) = 1 2 π 0 | Z | e t 2 2   dt
The Z values are approximately normally distributed. A positive Z value larger than 1.96 (based on a table of the normal probability distribution) denotes an increasing trend at a significance level of 0.05, whereas a negative Z value lower than −1.96 indicates a decreasing trend. To denote the exact significance level of the trend, the p-value is used. If the p-value is small enough (<0.05), the trend in the time series is quite unlikely to be caused by random sampling. The estimation of the Sen’s slope and the testing of its significance were carried out with the Statistical Software for Excel (XLSTAT), version 2021.4.

2.4. Mapping of Groundwater Level Depletion Trend

After determining the depletion rate, the contour map of groundwater levels was plotted to spot the rapidly depleting area. From the groundwater level data of BWDB, the long-term trends in the annual maximum, minimum and median groundwater levels were estimated. Then, with these trend values, the contour maps of the maximum, minimum and median groundwater level trends were prepared using the Arc-GIS 10.3 software. Firstly, a geospatial raster surface was created from the individual groundwater levels of the observation wells by the inverse distance weighted interpolation technique. This method interpolates values based on the measured values at nearby locations weighted by distance from the interpolation location. Then, the contour map was created from the raster file with a contour interval of 0.1 m/year. Using the available short-period twin monitoring well data of DWASA, the contour maps of the maximum and minimum depths to groundwater levels in both the shallow and deep aquifers were prepared.

2.5. Identification of Potential Adaptation Options

Severely water-stressed areas in respect to groundwater depletion were identified from the trend analysis and the contour maps. After that, the KIIs and SSIs were conducted, which provided information about future potential adaptation options. These options were ranked according to the importance given by the respondents and through the normalization process. The normalization method was applied to avoid the problem of influences among the variables as practiced in [38,39]. The normalization process transforms the dataset to a range of 0 to 1 from a multivariate scale, where different ranges of variance are present in the variables [40]. Each adaptation strategy was given a score of 9, 7, 5, 3, or 1 for its potentiality, as a key informant strongly agreed, agreed, remained neutral, disagreed, and strongly disagreed, respectively, for its future adaptability. The remaining even numbers represented intermediate levels of preference. Then, the normalized value of each adaptation strategy was calculated by the following equation:
X n = X i X max
where, X n   = normalized value, X i   = relative score given by the key informant, and X max   = maximum score given by the key informant.
Adding the normalized score, the potential adaptation options were ranked by their effectiveness as forms of water supply management to reduce groundwater depletion. By interviewing key experts and studying relevant reports on various projects, the current practices adopted by the DWASA were identified. Later, by using SWOT (Strengths, Weaknesses, Opportunities and Threats) analysis, each practice was assessed to stand for future adaptability.

3. Results

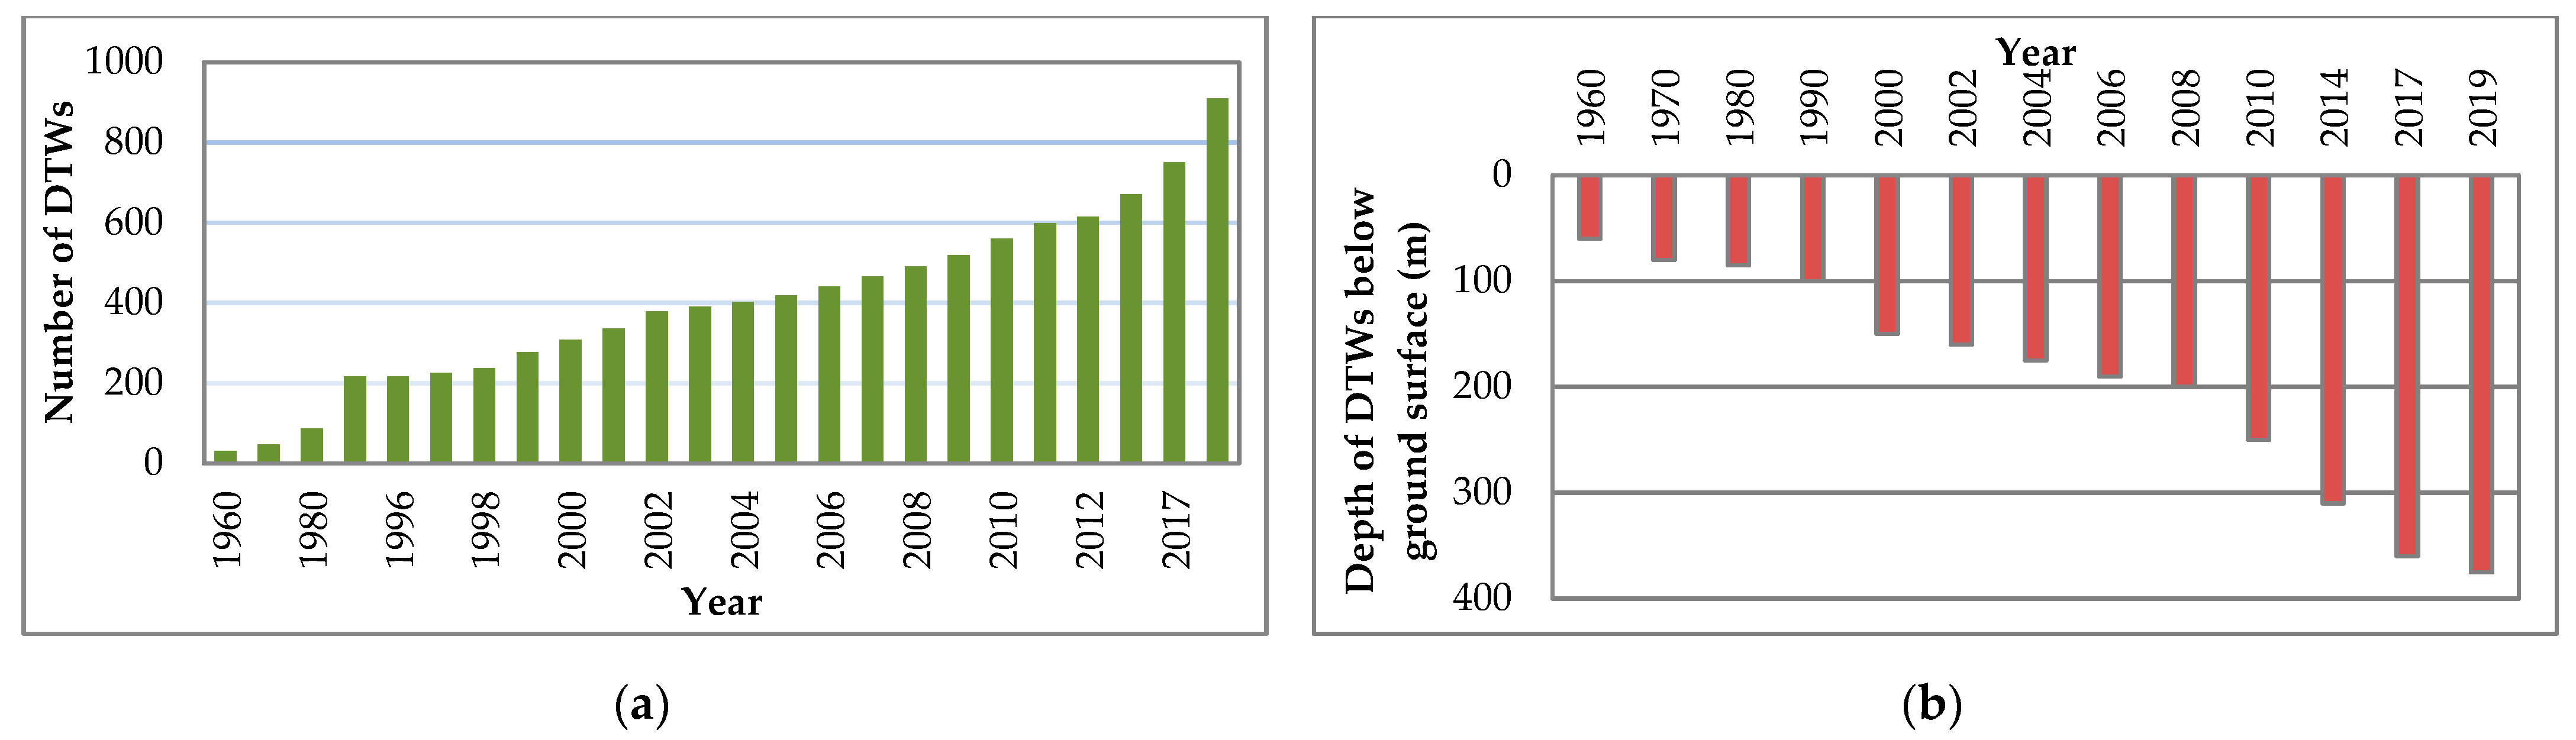
3.1. Present Situation of Deep Tubewell and Groundwater Extraction Level

Over the years, the number of DTWs in Dhaka has increased enormously. Every year, new DTWs were installed to meet the growing demand of the city. The trend in the number of DTWs installed by the DWASA in the Dhaka city area is given in Figure 2a. The number of DTWs was only 30 in 1960, but had increased to 909 in 2018. This overdependence on groundwater resulted in its gradual mining. This is evident in Figure 2b which shows the average depth of DTWs below the ground surface. The depth of the DTW indicates the groundwater extraction level within the tubewell. The groundwater was extracted from 60 m below the ground surface in 1960, but this had grown to 375 m in 2019. Thus, groundwater mining occurred throughout the period.

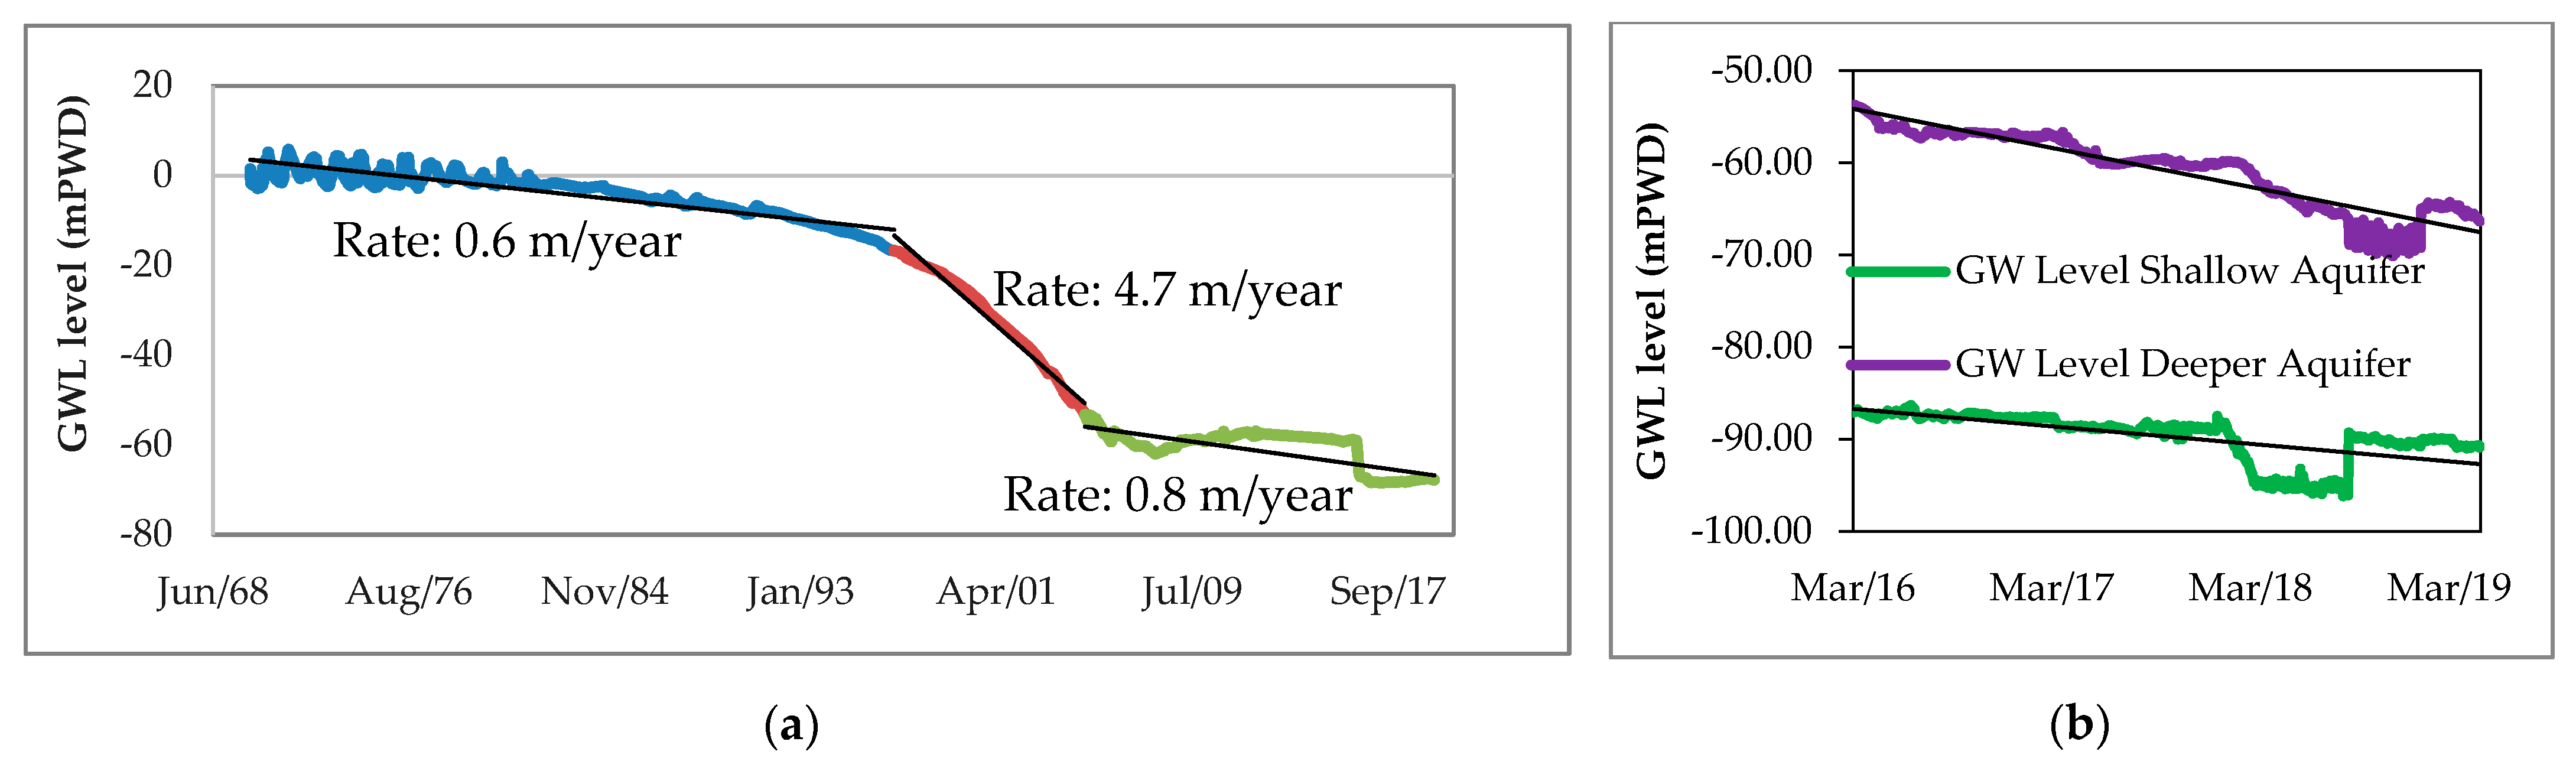
3.2. Long-Term Declination in Shallow Aquifer Groundwater Level

3.2.1. Rate of Declination

The nonparametric trend in the annual average groundwater levels at each observation well was estimated using the Sen’s slope. The results are given in Table 1. Out of 21 observation wells, 19 wells show a negative trend, and the remaining two wells show a positive trend. The magnitude of the trend varies from −2.40 m/year for the Well ID: GT2654014 at South Khilgaon to 0.03 m/year for the Well ID: 2614003 at Dhamrai. The Z-statistic also indicates a declining trend at 19 locations and a rising trend at two locations. The lowest Z-statistic was found for the Well ID: 2648012 at Sultangonj, Mohammadpur, and the highest for the Well ID: 2614003 at Dhamrai and the Well ID: 2662016 at Paragram, Nawabganj. According to the p-value, the declining trends are statistically significant at a 5% level of significance (p-value < 0.05) at 17 locations, out of 19. The rising trends found at the two wells (Well ID: 2614003 and 2662016) were found not to be significant at a 5% level of significance. Thus, almost all the wells are showing a significant decreasing trend, which means the groundwater level is declining in Dhaka due to overextraction of groundwater.

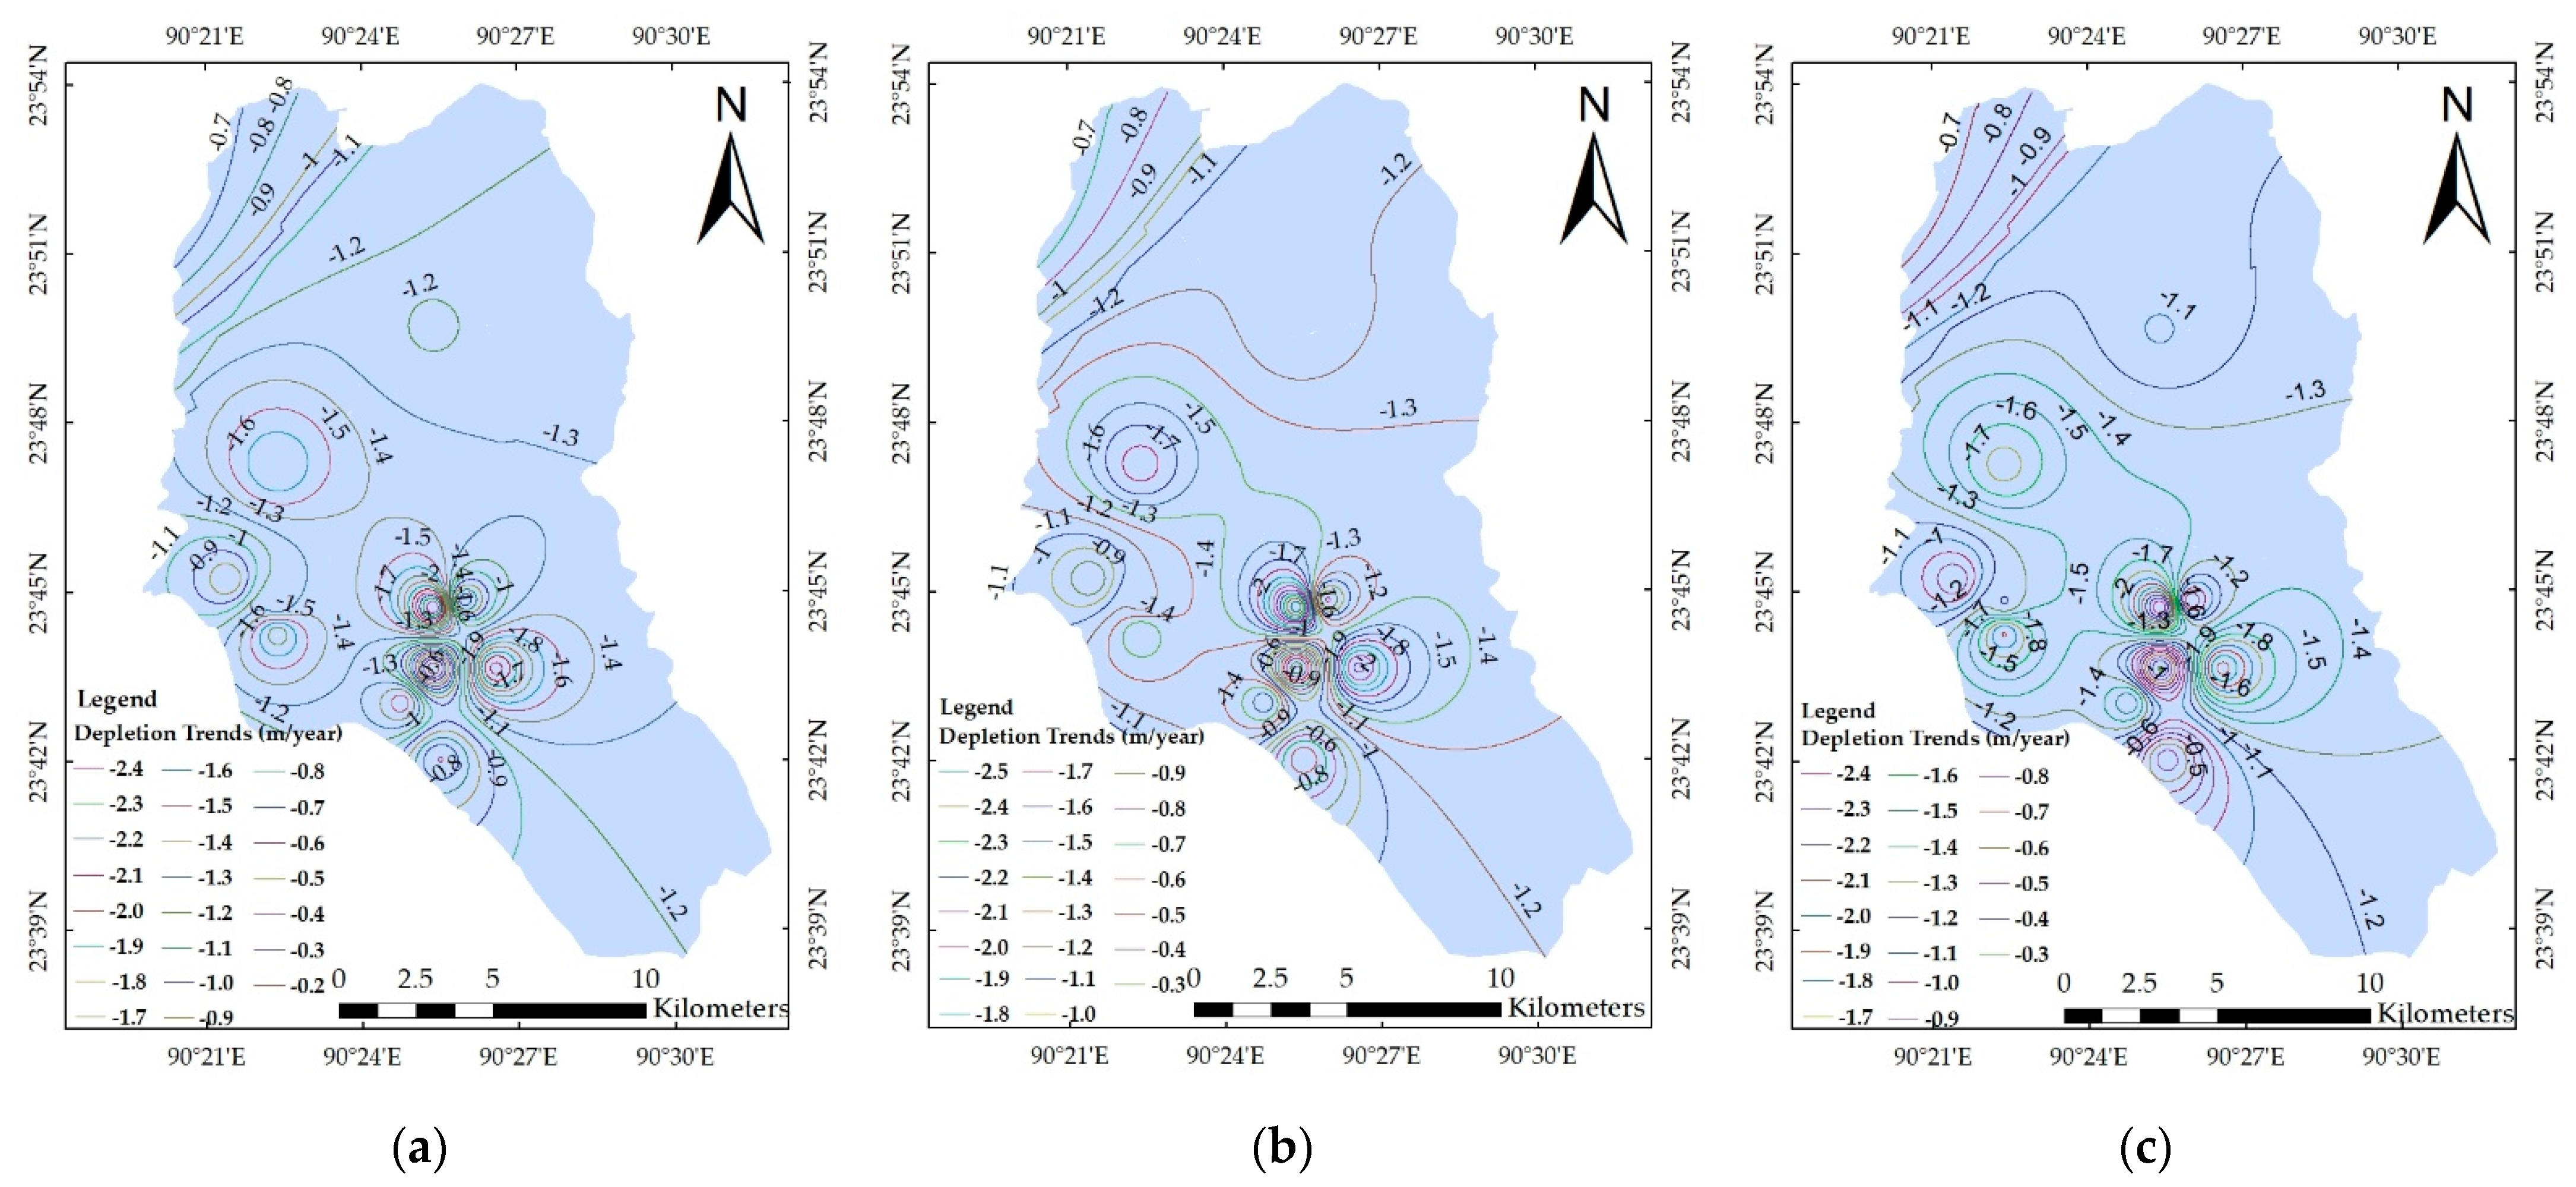
3.2.2. Contour Maps of Long-Term Declination Trends

Contour maps of the annual maximum, minimum and median groundwater level trends are shown in Figure 3. The three maps exhibit a similar pattern in the long-term groundwater level declination rates in the study area. All the contour maps illustrate that the central area of Dhaka, mostly the southern central area, has experienced the highest rate of declination. As the rates of declination are almost the same for the maximum and minimum groundwater levels, there is little or no further potential for natural groundwater recharge either from rainfall or from flooding during the monsoon season. All areas of Dhaka are undergoing a total groundwater level decline varying from 0.6–2.4 m/year.
The cone of depression, with an annual maximum and minimum groundwater level declination rate of 2.4 m/year, is found in the vicinity of the Motijheel area. The annual maximum groundwater level declination rate is 2.2 m/year in the Khilgaon area and, for the minimum, the rate is the same for both the Khilgaon and Sobujbag areas. Moderate declination rates of about 1.6–2.0 m/year were found near the Dhanmondi and Mohammadpur areas. The lateral extent and magnitude in the declination rates of the Motijheel, Khilgaon and Sobujbag areas are larger than that of the Dhanmondi and Mohammadpur areas. The declination trend was increasing with time and the cone of depression was both increasing laterally and deepening.

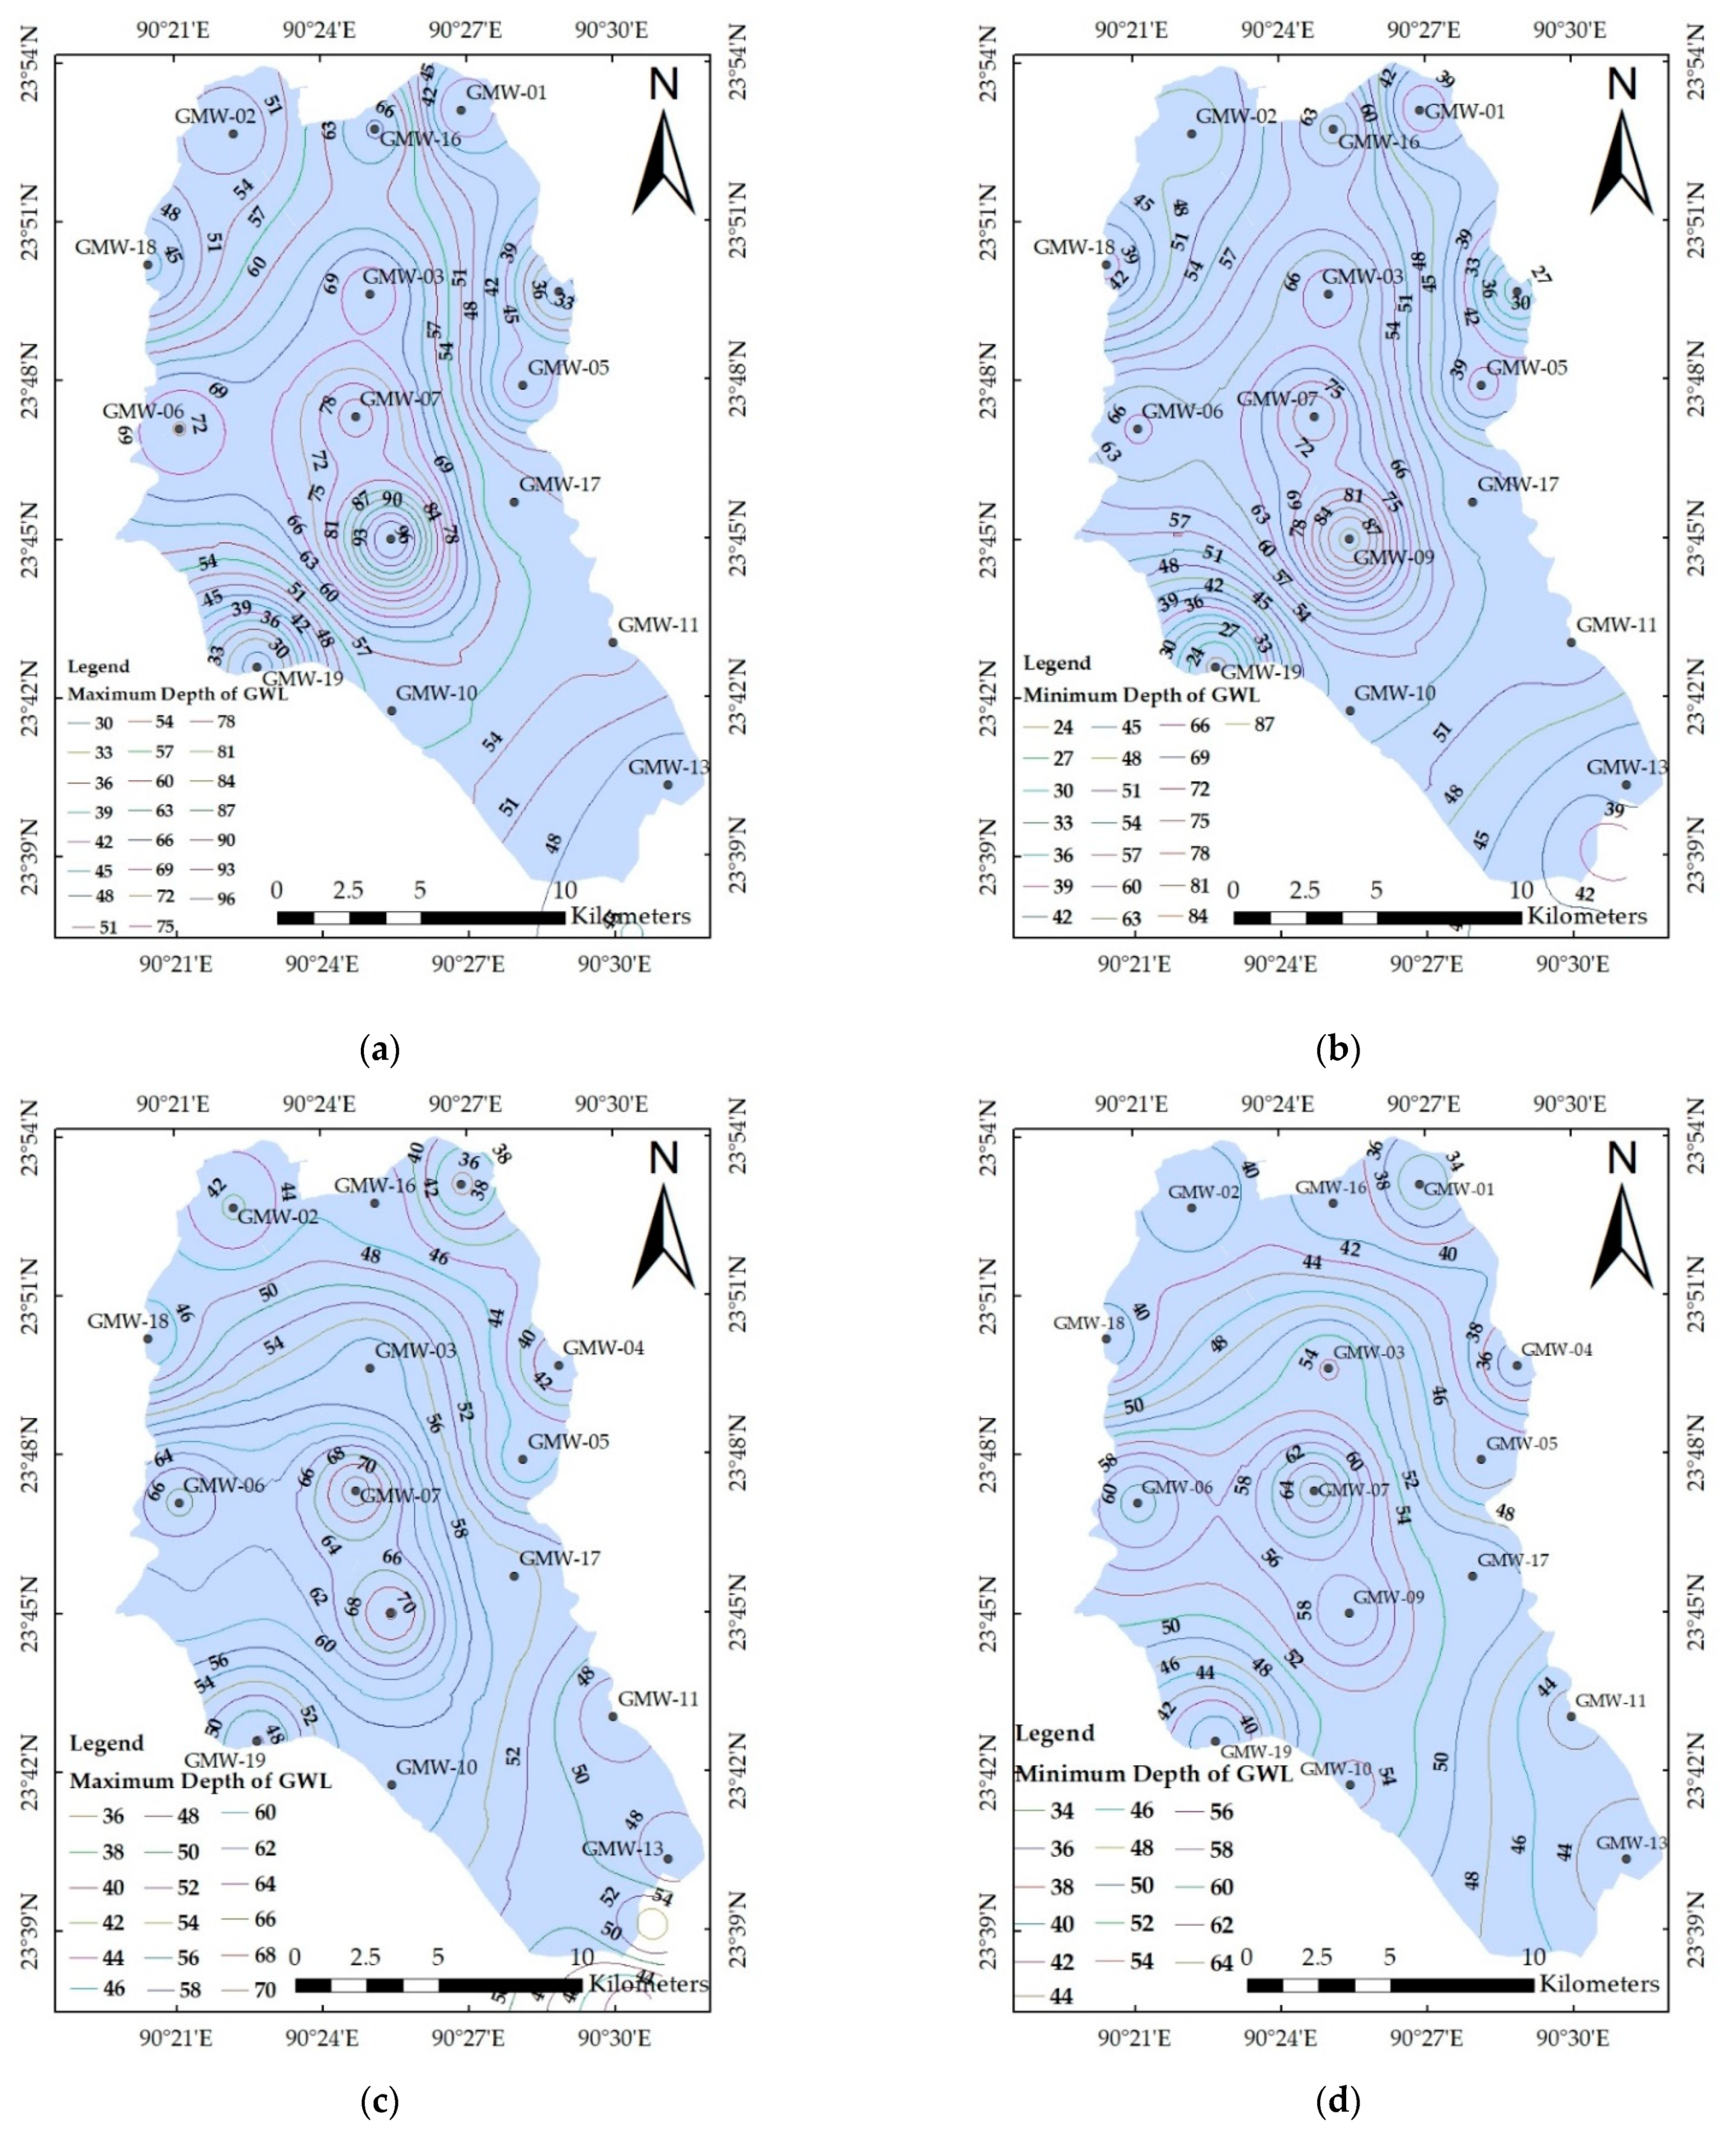
3.3. Short-Term Declination in Shallow and Deep Aquifer Groundwater Levels

The rates of groundwater level depletion in both shallow and deep aquifers based on recently installed observation wells by the DWASA are given in Table 2. The analysis is based on the available data from March 2016 to April 2019.
The declining situation in groundwater level is observed in almost all the monitoring wells of Dhaka. In fact, all the monitoring wells except for GMW-19 (Kamrangir Char) show a groundwater level declination. The rate of declination also varies from place to place, ranging from a few centimeters to more than a meter. Though 3 years of data are not sufficient to put high confidence in the actual rate of groundwater level declination, these recent data show a vivid situation of continuous declination in groundwater levels in both the aquifers of Dhaka. Thus, an overextraction of groundwater compared to annual replenishment is happening for both the shallow and deep aquifer systems.
Figure 4 shows the contour maps of the depths to groundwater level in the shallow and deep aquifers for the year 2018. The groundwater depletion in the shallow aquifer is severe mainly at the Well ID: GMW-09, Khilgaon High School. The depletion in the deep aquifer is severe mainly at the Well ID: GMW-09, Khilgaon High School, and Well ID: GMW-07, BWDB Officers’ Quarters, Banani. Thus, the short-term twin well data indicate that the cone of depression was highest in central Dhaka near the Khilgaon and Motijheel areas. This means that groundwater has depleted more in central Dhaka than in peripheral areas.

3.4. Potential Options for Sustaining Water Supply in Dhaka City

Sixteen potential options that could reduce the groundwater declination and sustain the water supply in Dhaka were identified from the interviews of key informants and DWASA water users. The options were divided into two groups: supply augmentation options and demand management options. Three supply augmentation options and thirteen demand management options were identified and SWOT analyses were conducted (Table 3). These options are discussed according to their ranks obtained from the normalization process of their weightages.

3.4.1. Surface Water Treatment Plants (Rank 01)

The supply augmentation strategy was given the highest priority. At present, the groundwater is extracted from the deep aquifer. This has increased both water production costs and system maintenance costs. Further extraction would increase the operation cost of the pumps and also deteriorate the aquifer properties. Therefore, to sustain the future water supply, the Surface Water Treatment Plant (SWTP) was suggested as the best option.
One KII, the Director (Technical) of DWASA, shared his experience regarding the impacts of SWTP on groundwater level recovery. After the start of operation of the Padma (Jashaldia) SWTP phase-I in January 2019, the operation of 40 DTWs was ceased. Within one year, the water level recovered by 10–15 m. So, if the supply is augmented through an SWTP, the water production from the DTWs can be lowered, resulting in an automatic rise in groundwater levels. Thus, when the SWTPs are implemented, the current stress on groundwater will be largely minimized. The reduction in abstraction from the DTWs will eventually increase the GWL. However, pollution levels in the river water are a major threat to this strategy.
It was also suggested by the informants that the same purpose could be served not only by large-scale SWTPs, but also by smaller-scale SWTPs. This would reduce the space requirements and reduce the operational costs and energy requirements. However, the thrust of DWASA has so far been on investing in the large-scale SWTPs.

3.4.2. Rainwater Harvesting (Rank 02)

Rainwater harvesting was recommended for areas where space is available for storing rainwater and using it later. The monsoon usually lasts from June to October and occasional rainfall occurs in November. During this period, the city receives ample rainwater, which can reduce the dependency on groundwater for at least 6 months. From the KIIs, it was found that, if the harvested water could be used for toilet-flushing and cleaning houses, then 30% of water could be saved from a conventional piped water supply system. In addition, a one-meter rise in groundwater level due to the harvesting could save 0.40 kilowatt-hour (kWh) of electricity in the load-shedding-stricken city [41]. In a year of normal climate, about 11% to 19% of the total water supply could be supplemented from the RWH system, and the potential savings would be from 500 to 1337 KL of water and from 174 to 401 kWh of energy [42]. To put the system into practice, the government had already amended the Bangladesh National Building Code, 2020 [43], making the provision of RWH mandatory and also introducing awards or subsidies to encourage RWH for all new houses in the Dhaka Metropolitan area. However, previous governmental policies did not highlight the importance and proper process of RWH; they only focused on conjunctive use of rainwater [44]. Moreover, groundwater recharge by rainwater could be introduced and promoted. The existing urban and water policies should be reviewed and revised to bridge the gaps.

3.4.3. Artificial Groundwater Recharge (Rank 03)

The majority area of Dhaka is highly built up and paved, preventing infiltration of rain or surface water, and therefore, rooftop RWH for artificial recharge (AR) with lateral shafts in bore wells has been identified as a suitable method. One key informant, the Project Director of the Emergency Water Supply Project, emphasized that gravity inflow through injection wells can be used a as recharge strategy because the construction is relatively simple and requires less space, which is suitable for a highly urbanized area. Dhaka has the prospect of using MAR techniques to conserve excess rainwater. The upper Dupi Tila aquifer provides suitable characteristics and storage capacities for a MAR implementation. Four basic MAR techniques, soil-aquifer treatment in limited spaces, recharge trenches or pits, aquifer storage and recovery/aquifer storage, transfer and recovery, and natural wetlands, could be suitable for the Dhaka city area with some modifications [45].

3.4.4. 100% Metering (Rank 04)

With an effective metering system from source to end-user, the system loss can be calculated. At present, the DWASA has flow meters in 95% of its deep tubewells and 85–95% of its service households depending on zones. All of the deep tubewells should be furnished with an effective metering system. Smart metering and automated operation of the flow meter along with the household meter could bring about a drastic change in water consumption. The household connection can also be segregated to apartment level, and thus the exact consumption of each family can be calculated. This type of management strategy could significantly change the perception of water use and eventually reduce the wastage of water. For example, the development of electronic and mechanical prepayment systems in South Africa brought tremendous change in the water supply system [46]. The local tariff structure can be changed to manage information about potential leaks and other problems.

3.4.5. Reducing Non-Revenue Water (Rank 05)

Non-revenue water (NRW) is the loss of water before it reaches the customer. Losses can be of two categories: real losses and apparent losses. Real losses can also be termed as physical losses which occur through leaks or bursts of pipes, joints, etc. Apparent losses are sometimes called administrative losses, which are through theft, meter inaccuracies, etc. To reduce NRW, the DWASA is rehabilitating and replacing the existing distribution network and introducing a new asset management concept, ‘District Metered Area’ (DMA). Where each DMA distribution network is sufficiently metered to monitor and account for water flow, any anomaly in the system due to leakage, pilferage, etc. is quickly identified and remedied. The key informants apprehended that if leakage monitoring and control are not properly implemented, the 24 h pressurized system might incur significant NRW through its leakages.

3.4.6. Ensuring Public Participation (Rank 06)

Whilst technological and financial improvements to systems can make a significant contribution to water demand management, these are of little value if they are rejected by people because user perceptions and demands are not taken into account and are perceived as irrelevant or inappropriate. Public participation is central to ensuring that the overall strategies, policies and individual measures are fully informed by the people’s perceptions, needs and capacities. This applies very much to the poor, who may easily be excluded from such a process. Decisions concerning service levels, cost recovery and management systems can and should be made by informed users either individually or collectively, rather than by outsiders making assumptions on their behalf. Effective public participation is therefore needed at different stages throughout the project cycle so that:
  • The approaches adopted are informed of peoples’ perceptions, needs and capacities, and are appropriate;
  • People can make fully informed individual and collective decisions about the service they are to receive and how it is to be delivered;
  • Planners can draw on the capacity of people to formulate appropriate strategies, policies and measures; their local implementation and financing; monitoring and evaluating performance; and
  • Users can voice their opinions concerning the service they receive, and the utility can respond accordingly.
Measures that influence the use of water by the public, or which affect the public’s perceptions on the water service provider, need to be supported by measures that ensure public acceptance. Pilot surveys using a range of techniques, such as questionnaires, interviews and focus group discussions, can give indications as to the public acceptability of particular measures. It is important to cover the range of existing and potential consumers, including poor groups who may not have access to the formal infrastructure networks.

3.4.7. Promoting Public Awareness (Rank 07)

The involvement of stakeholders in developing a public awareness strategy is key to its success and sustainability. This ensures that the views of different user groups are reflected in acceptable policies, which can then be marketed accordingly. In comparison, a lack of awareness can result in a policy being rejected.
According to the informants’ view, all of the supply augmentation and demand management options should be highlighted through media coverage. Social awareness-raising campaigns to establish optimum consumption levels, encourage RWH techniques and install water-saving devices should be emphasized. On the other hand, quarterly, half-yearly and annual newsletters, leaflets, posters, discussions, etc. with a reflection of the DWASA’s services should be published. The DWASA should publish their achievements and liabilities for consumers.

3.4.8. Improving Management Capacity (Rank 08)

To increase efficiency in operation and management, further improvement is required in the management system. Capacity-building of DWASA officials along with field-level staff is required for delivering services smoothly. The key informants explained that the DWASA is acting as a passive respondent to any operational and maintenance problem. There are still many deficiencies in managerial capacity to make the DWASA respond actively to any problem. Technological improvement of total systems along with training facilities to build skilled management is needed for the smooth running of the DWASA.

3.4.9. Constructing Groundwater Plant (Rank 09)

Construction of a groundwater plant, such as the Tetuljhora-Bhakurta Well Field Plant, Phase-I, has great potential to increase the water supply sustainably. More aquifers with recharge potential near Dhaka need to be identified to construct such plants. However, over-pumping from those wells could cause temporary drawdown which could eventually affect the local shallow tubewell production. So, proper study on the aquifer system including the determination of hydraulic connectivity between upper and deeper aquifers is necessary before implementing any such project. By estimating annual potential recharge in the Bhakurta aquifer, it is necessary to keep the annual discharge less than the recharge, along with maintaining proper well spacing.

3.4.10. Promoting Optimum Water Demand (Rank 10)

The chief aim of this is to reduce water footprint and consumption. Water conservation is possible by adopting an optimum water consumption pattern that is sustainable in the long term. According to the WHO, a minimum of 50 lpcd water are required to fulfill the needs for consumption and hygiene in order to ensure optimum water consumption for the highly populated cities [47,48]. At present, water demand per capita is considered to be 140 lpcd. So, there is scope for trimming down the per capita water consumption. In the present condition, if the water footprint can be reduced by promoting sustainable water use, groundwater depletion can be reduced significantly.

3.4.11. Effluent Treatment Plant (Rank 11)

Many industries and factories directly discharge effluents to the surrounding rivers and water bodies, and thus pollute the water. Furthermore, the factories with ETPs do not run their ETPs continuously or properly. Only some factories, mainly medium- to large-scale, have quality ETPs, are keen to protect the surrounding environment, and comply with the DoE regulations. As was explained by one key informant, the Director General of the DoE, about 52% of Bangladesh’s industries have ETPs. This indicates that about 48% of the industries do not have any ETPs.
The key informants emphasized the importance of the full-functioning of ETPs to conserve the water quality of rivers. It should be considered not only from the regulatory point of view, but also from the ETP management point of view. The ETP size and capacity should be proportional to the factory size, which should be determined differently as it grows and expands day by day. An approach such as ‘Road to Zero Discharge’ could reduce river water pollution to a tolerable limit. This will not only help restore the river’s water quality but also create a path to install a smaller version of the SWTP to use the water for drinking purposes by the DWASA.

3.4.12. Recycling and Reusing Household Greywater (Rank 12)

The greywater produced from washbasins, sinks, baths, showers and washing machines can be recycled and reused. Such greywater has a low level of contamination and hence a high potential for treatment and reuse. By appropriately matching the water quality to water needs, the reuse of greywater can replace the use of potable water in non-potable applications. Greywater from sinks, baths and showers can be used directly to irrigate vegetable gardens. However, several barriers may impede the development of greywater recycling and reuse in Dhaka. These include limited human and financial resources, reliability of wastewater treatment, energy demand for the system, the economic feasibility of the system, public perception and willingness, social and institutional acceptance, water rights issues and political process, and sufficient, consistent codes and guidelines. From an aesthetic point-of-view, public acceptance for reusing recycled water can be a major challenge to overcome. Recycling of greywater is based on the exclusion of blackwater. For this purpose, the plumbing system should be modified so that the disposal of greywater and blackwater is facilitated through different pipes. Hence, the implementation of a separate plumbing system for collecting greywater for treatment and reuse could be difficult as Dhaka has been urbanized in an unplanned way. To overcome these challenges, practical strategies should be employed depending on the socio-economic conditions for the implementation of greywater recycling systems.

3.4.13. Reforming Water Tariff System (Rank 13)

That the present uniform tariff system is not sustainable was agreed by both key informants and interviewees. The key informants highlighted the important opportunity of reforming the water tariff system. The existing uniform flat-tariff system is not feasible, and the urban poor and rich people should not pay the same rate. It could be replaced by the Increasing Block Tariff (IBT) system, Area-Based Tariff System, or both. Many South Asian cities, such as Bangalore, Chennai, Hyderabad, Colombo, and Kathmandu have already introduced IBT structures, whereas Dhaka is still far behind [49]. Seasonal water and time-of-use tariffs can be set according to water demands and weather conditions. However, the service quality should also be reformed accordingly. This implementation will eventually achieve at least operation and maintenance costs resulting in an effective water-management system. At the same time, taxes and tariffs should be imposed on the private withdrawal of water. At present, private deep tubewell users pay an annual renewal fee. Provision should be added for a certain limit of abstraction. Apart from the annual fee, the monthly or volume-based tariffs could be introduced in private abstraction.

3.4.14. Water-Saving Devices and Practices (Rank 14)

The key informants put significant emphasis on the potential to conserve water in domestic and non-domestic premises through the adoption of water-saving devices and practices. These include replacing seals and converting existing water closets (WCs) to low or dual flushes, installing water-efficient washing machines, water-saving urinals, low-flow showers and so on. The impact can be considered in terms of the quantity of water saved. For example, in many higher-income areas, WCs may account for a substantial proportion of domestic and institutional consumption. Many flush WCs that are fitted with a flap valve leak. The flush volume of many existing WCs could be reduced by 20% or more with a water-filled bottle or similar.
It is important to check that the existing regulations allow for water-saving devices to be installed. If a significant quantity of water-saving devices are needed, it may be necessary to facilitate relatively simple local manufacturing.

3.4.15. Wastewater Treatment and Reuse (Rank 15)

Rapid population growth in the Dhaka city area has led to an increased volume of wastewater generated and discharged into the surface water system. Wastewater treatment and reuse can provide a great opportunity for water conservation. According to the key informants, wastewater reuse is likely to become one of the major technologies in the future, especially when coupled with Aquifer Storage and Recovery. Moreover, water should be used directly when the quality does not need to be improved for usage. However, wastewater was mentioned as the most underused available water resource by the key informants, though numerous technologies are available to treat wastewater for almost any application. Different qualities of wastewater can be used in a fit-for-purpose manner, and thus can help alleviate the pressure on existing freshwater resources. This can also reduce direct discharge into water streams and thus serve as an important measure of pollution control [50].
Key informants agreed that the recycling and reuse of wastewater, non-potable and potable water storage, and distribution systems would be required for this recycling effort. Wastewater reuse would require a system that can collect wastewater from users to be treated before various uses. This might be a serious challenge in many developing countries.

3.4.16. Installing Deep Tubewells (Rank 16)

The commissioning of an SWTP is a time-lengthy procedure. SWTP projects are usually delayed by at least 4–5 years due to land acquisition issues, political and local influences, delaying of loans, and other unforeseen causes in operation. For the time being, additional DTWs can be installed to meet the supply deficit. After the SWTPs become operational, the operation of the DTWs can be stopped or controlled gradually as required.
Excessive pumping from DTWs lowers the groundwater level and causes wells to no longer be able to reach groundwater. As the water level lowers, the water must be pumped farther to reach the surface using more energy. Breakdown of pumps occurs frequently. In extreme cases, using such a well can be cost-prohibitive. Moreover, land subsidence could occur when there is a loss of support below the ground. Installing DTWs on a need basis can be only a temporary solution. This practice is not sustainable.

3.5. Potential Adaptation Options for Different Areas in Dhaka City

The sixteen adaptation options suggested earlier are overall options with city-wide applicability. However, the options have different potential in different areas depending on a number of factors. While conducting the semi-structured interviews, the interviewees suggested some area-wise adaptation options. Such suggestions also came forward from the emphasis placed by the key informants on different options. Table 4 is prepared to indicate area-wise adaptation options for better management of water supplies in the concerned areas.

4. Discussion

Water requirements in Dhaka are increasing day by day due to increasing population, industries and economic activities. This has led to an ever-increasing extraction of groundwater from both the shallow and deep aquifers with public and private DTWs. As the rate of groundwater recharge is much lower than the rate of extraction, there is a declining trend in the groundwater level, which is increasing with time, and the cone of depression is both increasing laterally and deepening [2].
Two typical groundwater level hydrographs—one for the shallow aquifer, based on long-term data, and the other for both deep and shallow aquifers, based on short-term data—are shown in Figure 5 from heavily depleted areas. The figure shows the changes in groundwater levels over time, the range of groundwater level fluctuations, seasonal groundwater level variations, and the cumulative effects of short-term and long-term hydrologic stresses. It is seen from the figure that there has always been a downward trend in the groundwater level of the Upper Dupi Tila Aquifer in Dhaka. The depletion started in the early 1980s (Figure 5a). This gradual declining situation of the groundwater level since early 1980s implies that the groundwater over-abstraction situation started in the city area long before. The over-abstraction of groundwater rendered the upper aquifer from a semi-confined to an unconfined nature with increased susceptibility to permanent mining, vulnerability and risk.
The groundwater level fluctuation data from the twin monitoring wells (Figure 5b) show that there is a sharp difference between the groundwater levels of the shallow and deep aquifers. The deep aquifer still shows the regional condition of a pressurized aquifer, i.e., the condition of an artesian aquifer. In both aquifers, the water level is declining. For example, the groundwater level in the shallow aquifer was 87.3 m below the ground surface on 1 March 2016, and the level had fallen to 90.79 m on 26 April 2019. Thus, a depletion of around 3.49 m was observed within a short period of about 3 years. In addition, a linear depletion of 1.90 m per year was observed in the shallow aquifer in the Khilgaon area. The maximum depth to groundwater level for this aquifer was 96.15 m from the ground surface on 18 August 2018 and the minimum depth was 87.37 m on 9 March 2016 during the observation period.
The deep aquifer, on the other hand, was experiencing a rapid decline with fluctuation starting at 54.31 m below the ground surface on 1 March 2016 and falling to 66.30 m on 26 April 2019 (Figure 5b). So, the groundwater level had declined by 11.99 m by the observation period, with an average declining rate of 4.23 m per year. The maximum depth to groundwater level of this aquifer was 70.12 m from the ground surface and the minimum depth was 54.29 m.
Supply-oriented management with a heavy dependence on groundwater has been the strategy adopted by the DWASA as well as by private users to meet the growing water demand in Dhaka. A number of studies were sponsored by the DWASA to assess the groundwater potential in the city as well as to investigate the feasibility of surface water diversion, treatment and supply. However, water-source diversification and demand-oriented management did not receive due attention in the city water policy and governance. There was not even a master plan of water management, until recently, for the city. Due to these lapses in the policy, plan and governance of the city water management, there was over-abstraction of the non-renewable groundwater from the Dhaka aquifer. Coherent and coordinated organizational policies and actions are needed from the DWASA, Dhaka City Corporations (there are two city corporations in Dhaka), capital development authority (RAJUK), Department of Environment, and Bangladesh Inland Water Development Authority [51].
Even in the supply-oriented management, which is often preferred by the utility service providers, there are avenues for further improvement. The surface water collection rate can be increased, and the quality of surface water can be improved by adopting new technologies. However, if demand management strategies are not implemented, the augmentation of supply alone would not result in a sustainable water supply system. The city dwellers need to adopt new strategies to reduce water demand, such as rainwater harvesting, recycling and reusing of wastewater, and so on. Most of the suggested options received high acceptance and only a few received low acceptance among the key informants and semi-structured interviewees. Installing new DTWs was not preferred by most of the respondents. Wastewater treatment was identified to be a great alternative to conserve freshwater. However, the process may be expensive for a country like Bangladesh. So, the opinions were divided regarding this option, and most of the respondents stayed neutral.
Finally, the findings from this study could be useful for planning and managing the water supplies and resources of a city in a developing country, particularly for the cities in South Asia. The conjunctive use of surface water, groundwater and rainwater; an integrated policy of supply augmentation along with demand management; and organizational integration through coherent policies and practices suggested in this paper can help sustain the city water supplies and reduce water footprints even in developed countries.

5. Conclusions

The water supply system of Dhaka is heavily dependent on the underground water sources. As the rate of groundwater recharge is less than the rate of extraction, there was a declining trend in the GWL. The groundwater level was declining all over the city areas at an alarming rate without any significant recovery even during the monsoon season. The spatial variation in groundwater level depletion trends indicated that the south-central city areas experienced the highest and most rapid groundwater depletion and are more vulnerable to the aquifer drying out. The study also identified potential adaptation options to sustain the water supply in Dhaka. Supply-side management via structural interventions could make the water supply system better, but it would require sufficient time and budgetary allocation. On the other hand, the demand-side management options, such as RWH, AR, new tariff system, water-saving devices and promoting optimum water demand, would need institutional policies and actions. The latter approach has not received due attention of the policy makers and service providers. Hence, the main thrust of future water supplies in Dhaka should be on the demand-side management to reduce the groundwater footprint and conserve groundwater sources. Coherent and integrated policies and actions would be needed from different relevant government organizations to sustain future water supplies and resources of the city.

Author Contributions

Conceptualization, M.M. and M.S.M.; methodology, M.M. and M.S.M.; soft-ware, M.M. and S.B.; validation, M.M.; formal analysis, M.M. and S.B.; investigation, M.M.; resources, M.S.M.; data curation, M.M.; writing—original draft preparation, S.B. and M.M.; writing—review and editing, M.S.M.; visualization, M.M. and S.B.; supervision, M.S.M.; project administration, M.S.M.; funding acquisition, M.S.M. All authors have read and agreed to the published version of the manuscript.

Funding

This research was funded by the International Development Research Center (IDRC), Canada under the IDRC-South Asian Water (SAWA) Fellowships Program.

Institutional Review Board Statement

Not applicable.

Informed Consent Statement

Not applicable.

Data Availability Statement

Data can be made available upon request.

Acknowledgments

We thank the three anonymous reviewers for their valuable comments, constructive criticisms, and useful suggestions, which helped improve the quality of this manuscript.

Conflicts of Interest

The authors declare no conflict of interest. The funders had no role in the design of the study; in the collection, analyses, or interpretation of data; in the writing of the manuscript; or in the decision to publish the results.

References

  1. Kabir, A.; Parolin, B. Planning and Development of Dhaka–A Story of 400 Years. In Proceedings of the 15th International Planning History Society Conference, Paulo, Brazil, 15–18 July 2012; pp. 1–20. Available online: https://www.academia.edu/download/30275584/kabir_parolin.pdf (accessed on 1 December 2021).
  2. Hoque, M.A.; Hoque, M.M.; Ahmed, K.M. Declining Groundwater Level and Aquifer Dewatering in Dhaka Metropolitan Area, Bangladesh: Causes and Quantification. Hydrogeol. J. 2007, 15, 1523–1534. [Google Scholar] [CrossRef]
  3. Alam, M. Evaluation of Ground Water Condition of Dhaka City; University of Dhaka: Dhaka, Bangladesh, 1983. [Google Scholar]
  4. Dhaka Water Supply and Sewerage Authority. Establishment of Groundwater Monitoring System in Dhaka City for Aquifer Systems and DWASA Production Wells; Dhaka Water Supply and Sewerage Authority: Dhaka, Bangladesh, 2018. [Google Scholar]
  5. Khan, M.R.; Koneshloo, M.; Knappett, P.S.K.; Ahmed, K.M.; Bostick, B.C.; Mailloux, B.J.; Mozumder, R.H.; Zahid, A.; Harvey, C.F.; van Geen, A.; et al. Megacity Pumping and Preferential Flow Threaten Groundwater Quality. Nat. Commun. 2016, 7, 12833. [Google Scholar] [CrossRef] [PubMed]
  6. Islam, M.; Camp, M.V.; Hossain, D.; Sarker, M.M.R.; Khatun, S.; Walraevens, K. Impacts of Large-Scale Groundwater Exploitation Based on Long-Term Evolution of Hydraulic Heads in Dhaka City, Bangladesh. Water 2021, 13, 1357. [Google Scholar] [CrossRef]
  7. Darling, W.; Burgess, W.; Hasan, M. Isotopic Evidence for Induced River Recharge to the Dupi Tila Aquifer in the Dhaka Urban Area, Bangladesh; International Atomic: Solihull, UK, 2002. [Google Scholar]
  8. Hasan, M.K. The Vulnerability of the Dupi Tila Aquifer of Dhaka, Bangladesh; IAHS-AISH Publ.: Wallingford, UK, 1999; pp. 91–98. [Google Scholar]
  9. Ahmed, K.; Hasan, M.K.; Burgess, W.; Dottridge, J.; Ravenscroft, P.; Wonderen, J.V. Dupi Tila Aquifer of Dhaka: Hydraulic and Hydrochemical Response to Extensive Exploitation. In Groundwater in the Urban Environment: Selected City Profiles; Chilton, J., Ed.; A. A. Balkema: Rotterdam, The Netherlands, 1997; pp. 19–30. [Google Scholar]
  10. Morris, B.L.; Seddique, A.A.; Ahmed, K.M. Response of the Dupi Tila Aquifer to Intensive Pumping in Dhaka, Bangladesh. Hydrogeol. J. 2003, 11, 496–503. [Google Scholar] [CrossRef] [Green Version]
  11. Islam, M.B.; Firoz, A.B.M.; Foglia, L.; Marandi, A.; Khan, A.R.; Schüth, C.; Ribbe, L. A Regional Groundwater-Flow Model for Sustainable Groundwater-Resource Management in the South Asian Megacity of Dhaka, Bangladesh. Hydrogeol. J. 2017, 25, 617–637. [Google Scholar] [CrossRef]
  12. Bhattacharjee, S.; Saha, B.; Saha, B.; Uddin, M.S.; Panna, C.H.; Bhattacharya, P.; Saha, R. Groundwater Governance in Bangladesh: Established Practices and Recent Trends. Groundw. Sustain. Dev. 2019, 8, 69–81. [Google Scholar] [CrossRef]
  13. Chowdhury, F. A Study on Ground Water Scenario in Dhaka, the Capital City of Bangladesh. Int. J. Innov. Res. Sci. Eng. Technol. 2018, 7, 10981–10989. [Google Scholar] [CrossRef]
  14. Holman, I.P.; Trawick, P. Developing Adaptive Capacity within Groundwater Abstraction Management Systems. J. Environ. Manag. 2011, 92, 1542–1549. [Google Scholar] [CrossRef] [Green Version]
  15. Alam, M.F.; Pavelic, P.; Sharma, N.; Sikka, A. Managed Aquifer Recharge of Monsoon Runoff Using Village Ponds: Performance Assessment of a Pilot Trial in the Ramganga Basin, India. Water 2020, 12, 1028. [Google Scholar] [CrossRef] [Green Version]
  16. Richard-Ferroudji, A.; Raghunath, T.P.; Venkatasubramanian, G. Managed Aquifer Recharge in India: Consensual Policy but Controversial Implementation. Water Altern. 2018, 11, 749–769. [Google Scholar]
  17. Massuel, S.; Perrin, J.; Mascre, C.; Mohamed, W.; Boisson, A.; Ahmed, S. Managed Aquifer Recharge in South India: What to Expect from Small Percolation Tanks in Hard Rock? J. Hydrol. 2014, 512, 157–167. [Google Scholar] [CrossRef]
  18. Petrone, K.C.; Hughes, J.D.; Van Niel, T.G.; Silberstein, R.P. Streamflow Decline in Southwestern Australia, 1950–2008. Geophys. Res. Lett. 2010, 37, L11401. [Google Scholar] [CrossRef]
  19. Baccar, M.; Bergez, J.-E.; Couture, S.; Sekhar, M.; Ruiz, L.; Leenhardt, D. Building Climate Change Adaptation Scenarios with Stakeholders for Water Management: A Hybrid Approach Adapted to the South Indian Water Crisis. Sustainability 2021, 13, 8459. [Google Scholar] [CrossRef]
  20. Knüppe, K. The Challenges Facing Sustainable and Adaptive Groundwater Management in South Africa. Water SA 2011, 37, 67–80. [Google Scholar] [CrossRef] [Green Version]
  21. Rajeevan, U.; Mishra, B.K. Sustainable Management of the Groundwater Resource of Jaffna, Sri Lanka with the Participation of Households: Insights from a Study on Household Water Consumption and Management. Groundw. Sustain. Dev. 2020, 10, 100280. [Google Scholar] [CrossRef]
  22. Haq, F.U.; Naeem, U.A.; Gabriel, H.F.; Khan, N.M.; Ahmad, I.; Rehman, H.U.; Zafar, M.A. Impact of Urbanization on Groundwater Levels in Rawalpindi City, Pakistan. Pure Appl. Geophys. 2021, 178, 491–500. [Google Scholar] [CrossRef]
  23. Ahsan, M.M. Climate Change Adaptation-based Strategies on Water and Its Security: A Study on Dhaka and Ankara. Güvenlik Bilim. Derg. 2020, 79–92. [Google Scholar] [CrossRef]
  24. Hossain, N.; Bahauddin, K.M. Integrated Water Resource Management for Mega City: A Case Study of Dhaka City, Bangladesh. J. Water Land Dev. 2013, 19, 39–45. [Google Scholar] [CrossRef]
  25. Roy, S.K.; Zahid, A. Assessment of Declining Groundwater Levels due to Excessive Pumping in the Dhaka District of Bangladesh. Environ. Earth Sci. 2021, 80, 333. [Google Scholar] [CrossRef]
  26. Hoque, M.A. Hydrostratigraphy and Aquifer Piezometry of Dhaka City; Bangladesh University of Engineering and Technology (BUET): Dhaka, Bangladesh, 2004. [Google Scholar]
  27. Rahman, M.M. Regionalization of Urbanization and Spatial Development: Planning Regions in Bangladesh. J. Geo-Environ. 2004, 4, 31–46. [Google Scholar]
  28. Sen, P.K. Estimates of the Regression Coefficient Based on Kendall’s Tau. J. Am. Stat. Assoc. 1968, 63, 1379–1389. [Google Scholar] [CrossRef]
  29. Tabari, H.; Marofi, S.; Aeini, A.; Talaee, P.H.; Mohammadi, K. Trend Analysis of Reference Evapotranspiration in the Western Half of Iran. Agric. For. Meteorol. 2011, 151, 128–136. [Google Scholar] [CrossRef]
  30. Tabari, H.; Taye, M.T.; Willems, P. Statistical Assessment of Precipitation Trends in the Upper Blue Nile River Basin. Stoch. Environ. Res. Risk Assess. 2015, 29, 1751–1761. [Google Scholar] [CrossRef]
  31. Kendall, M.G. Rank Correlation Methods, 2nd ed.; Hafner Publishing Co.: New York, NY, USA, 1955. [Google Scholar]
  32. Mann, H.B. Nonparametric Tests Against Trend. Econometrica 1945, 13, 245. [Google Scholar] [CrossRef]
  33. Kumar, V.; Jain, S.K.; Singh, Y. Analysis of Long-Term Rainfall Trends in India. Hydrol. Sci. J. 2010, 55, 484–496. [Google Scholar] [CrossRef]
  34. Partal, T.; Kahya, E. Trend Analysis in Turkish Precipitation Data. Hydrol. Process. 2006, 20, 2011–2026. [Google Scholar] [CrossRef]
  35. Yue, S.; Wang, C. The Mann-Kendall Test Modified by Effective Sample Size to Detect Trend in Serially Correlated Hydrological Series. Water Resour. Manag. 2004, 18, 201–218. [Google Scholar] [CrossRef]
  36. Dinpashoh, Y.; Jhajharia, D.; Fakheri-Fard, A.; Singh, V.P.; Kahya, E. Trends in Reference Crop Evapotranspiration over Iran. J. Hydrol. 2011, 399, 422–433. [Google Scholar] [CrossRef]
  37. Hamed, K.H.; Rao, A.R. A Modified Mann-Kendall Trend Test for Autocorrelated Data. J. Hydrol. 1998, 204, 182–196. [Google Scholar] [CrossRef]
  38. Coulibaly, J.Y.; Mbow, C.; Sileshi, G.W.; Beedy, T.; Kundhlande, G.; Musau, J. Mapping Vulnerability to Climate Change in Malawi: Spatial and Social Differentiation in the Shire River Basin. Am. J. Clim. Chang. 2015, 4, 282–294. [Google Scholar] [CrossRef] [Green Version]
  39. Chowdhury, M.A.; Sabrina, H.; Zzaman, R.U.; Islam, S.L.U. Green Building Aspects in Bangladesh: A Study Based on Experts Opinion Regarding Climate Change. Environ. Dev. Sustain. 2021, 23, 1–25. [Google Scholar] [CrossRef]
  40. Quackenbush, J. Microarray Data Normalization and Transformation. Nat. Genet. 2002, 32, 496–501. [Google Scholar] [CrossRef] [PubMed]
  41. UN-HABITAT. Rainwater Harvesting and Utilization. Book 2. Beneficiaries and Capacity Builders; UN-Habitat, United Nations Centre for Human Settlements: Nairobi, Kenya, 2005. [Google Scholar]
  42. Karim, M.R.; Sakib, B.M.S.; Sakib, S.S.; Imteaz, M.A. Rainwater Harvesting Potentials in Commercial Buildings in Dhaka: Reliability and Economic Analysis. Hydrology 2021, 8, 9. [Google Scholar] [CrossRef]
  43. BNBC. Bangladesh National Building Code (BNBC); Ministry of Housing and Public Works, GoB: Dhaka, Bangladesh, 2020. [Google Scholar]
  44. MoWR. National Water Policy; Ministry of Water Resources, Government of the People’s Republic of Bangladesh: Dhaka, Bangladesh, 1999.
  45. Rahman, M.A.; Wiegand, B.A.; Badruzzaman, A.B.M.; Ptak, T. Hydrogeological Analysis of the Upper Dupi Tila Aquifer: Towards the Implementation of a Managed Aquifer-Recharge Project in Dhaka City, Bangladesh. Hydrogeol. J. 2013, 21, 1071–1089. [Google Scholar] [CrossRef]
  46. Deverill, P.; Herbertson, P.; Cotton, A. Urban Water Demand Management–Sustainable Approaches for Low Income Countries; Water, Engineering and Development Center: Leicestershire, UK, 2001. [Google Scholar]
  47. Gleick, P.H. Basic Water Requirements for Human Activities: Meeting Basic Needs. Water Int. 1996, 21, 83–92. [Google Scholar] [CrossRef]
  48. WHO. How Much Water Is Needed in Emergencies; Technical Notes on Drinking-Water, Sanitation and Hygiene in Emergencies; World Health Organization: Geneva, Switzerland, 2013. [Google Scholar]
  49. Brocklehurst, C.; Pandurangi, A.; Ramanathan, L. Tariff Structures in Six South Asian Cities. In Water Tariffs and Subsidies in South Asia Paper 3: Tariff Structures in Six South Asian Cities; Massachusetts Institute of Technology: Cambridge, MA, USA, 2002; p. 3. [Google Scholar]
  50. Nazari, R.; Eslamian, S.; Khanbilvardi, R. Water Reuse and Sustainability. In Ecological Water Quality-Water Treatment and Reuse; InTechOpen: London, UK, 2012. [Google Scholar]
  51. Mondal, M.S.; Salehin, M.; Huq, H. Evaluation of Institutional Arrangements for Governance of Rivers Surrounding Dhaka City. In Globalization of Water Governance in South Asia; Narain, V., Goodrich, C.G., Chourey, J., Prakash, A., Eds.; Routledge: New Delhi, India, 2014; pp. 273–291. [Google Scholar]
Figure 1. Map of the Study Area with MODS Zones and GWL Stations.
Sustainability 14 01518 g001
Figure 2. Present Situation of DTWs in Dhaka city: (a) Number of DTWs over the years 1960 to 2019; (b) Depth of DTWs below ground surface over the years 1960 to 2019.
Sustainability 14 01518 g002
Figure 3. Contour maps of the long-term depletion trends in groundwater level: (a) annual maximum; (b) annual median; (c) annual minimum.
Sustainability 14 01518 g003
Figure 4. Contour maps of groundwater depths (Year 2018): (a) maximum depth in shallow aquifer; (b) minimum depth in shallow aquifer; (c) maximum depth in deep aquifer; (d) minimum depth in deep aquifer.
Sustainability 14 01518 g004
Figure 5. Groundwater level hydrographs of observation wells: (a) long-term groundwater declining trend from the BWDB well at New Shewrapra, Mirpur; (b) short-term groundwater level declining trend from the DWASA twin monitoring wells at Khilgaon High School.
Sustainability 14 01518 g005
Table 1. Nonparametric Long-term Trends Estimated at Different Groundwater Observation Wells of Dhaka Using the Sen’s Slope and Modified Mann-Kendall Tests.
Well IDLocationNumber of Data PointsSen’s Slope (m/year)Mann-Kendall Statistic (S)Variance of SNormalized Test Statistic (Z)p-ValuePresence of Significant Trend
GT2608001Joar Shahara, Cantonment27−1.34−1692150−3.620.0003Decreasing Trend
GT2614002Bannal, Dhamrai40−0.10−51014,649−4.21<0.0001Decreasing Trend
GT2614003Dhamrai, Dhamrai140.0316411,5251.520.1289No Trend
GT2614004Shaha Balishwa, Dhamrai24−0.04−35510,481−3.460.0005Decreasing Trend
GT2616005Green Road, Dhanmondi44−2.29−1502893−2.770.0056Decreasing Trend
GT2618006Dayagajaria, Dohar39−0.03−2676327−3.340.0008Decreasing Trend
GT2618007Sundaripara, Dohar32−0.01−16813,419−1.440.1494No Trend
GT2638008Bamonsur, Keraniganj24−0.10−49820,558−3.470.0005Decreasing Trend
GT2642009Baksibazer, Lalbagh36−1.54−3546529−4.37<0.0001Decreasing Trend
GT2648010New Sewrapara, Mirpur27−1.45−74446,440−3.450.0006Decreasing Trend
GT2650011Mohammadpur41−0.93−54518,839−3.96<0.0001Decreasing Trend
GT2650012Sultangonj, Mohammadpur38−0.78−47411,400−4.43<0.0001Decreasing Trend
GT2654013Maniknagar, Motijheel11−0.62−41676−1.540.1240No Trend
GT2654014South Khilgaon, Motijheel36−2.40−45165−3.430.0006Decreasing Trend
GT2662015Nawabganj School, Nawabganj37−0.05−2934958−4.15<0.0001Decreasing Trend
GT2662016Paragram, Nawabganj400.017825621.520.1282No Trend
GT2672017Savar38−0.12−49114,481−4.07<0.0001Decreasing Trend
GT2672018Subandi, Savar47−0.35−45617,435−3.450.0006Decreasing Trend
GT2668019Khilgaon, Sobujbag31−1.62−2494741−3.600.0003Decreasing Trend
GT2668020South Bashabo, Sobujbag28−2.03−3608017−4.01<0.0001Decreasing Trend
GT2688021Jaganath University, Sutrapur40−0.52−73028,217−4.34<0.0001Decreasing Trend
Table 2. Trends in groundwater levels from the twin monitoring wells of the DWASA, installed in shallow and deep aquifers.
Well IDLocationRate of Depletion (m/year)p-Value
Shallow AquiferDeep AquiferShallow AquiferDeep Aquifer
GMW-01Moinertek, Uttar Khan−2.35−2.610.00400.0188
GMW-02Dia Bari, Uttara−3.31−5.030.00220.0037
GMW-03Kha-84/Tanpara, Nikunja−2.06−2.92<0.0001<0.0001
GMW-04Mastul, Khilkhet−1.05−0.410.07320.7361
GMW-05Beraid, Vatara−1.82−3.670.02000.0121
GMW-06Bangla College, Mirpur−4.45−5.350.01530.0518
GMW-07BWDB Officers’ Quarters, Banani−0.96−3.730.01390.0155
GMW-08Ashraful Madrasa, Mohammadpurn.a.−2.40n.a.<0.0001
GMW-09Khilgaon High School−1.34−3.91<0.0001<0.0001
GMW-10WASA Staff Quarters, Gandaria−2.22−2.140.05910.0243
GMW-11Sarulia Intake−2.02−2.01<0.0001<0.0001
GMW-13Adamjinagar, Siddirgonj−2.17−2.32<0.0001<0.0001
GMW-14Godenail, Siddirgonj−0.57−3.360.0014<0.0001
GMW-15Twin OHT Khanpur−0.55−1.44<0.00010.0003
GMW-16Atipara, Dakkhinkhan−2.88−3.79<0.0001<0.0001
GMW-17Nasirabad High School, Khilgaon−1.56−1.53<0.0001<0.0001
GMW-18Goranchatbari Pump House, Rupnagar−2.33−2.490.0001<0.0001
GMW-19Matbor Bari Mosque, Kamrangirchar1.33−1.630.72480.6982
Note: n.a. indicates that the data is not available.
Table 3. Major SWOT of the identified adaptation options for water supply in Dhaka.
Adaptation OptionStrengthWeaknessOpportunityThreat
Surface Water Treatment PlantsProduction and supply of bulk volume of waterTime-consuming and involves high initial, operational and maintenance costsRecovery of GWL and reduction in chances of groundwater contamination and land subsidencePotential increase in pollution levels in the river water sources
Rainwater HarvestingLow-cost local technologyFeasible only for a certain period of the yearAvailability of huge annual rainfallRisk of contamination
Artificial Groundwater RechargeConstruction is simple and technology is cheapSpace constraintsAvailability of high rainfall, suitable aquifer characteristics and policy frameworksRisk of aquifer contamination
100% MeteringVolumetric water use and tariff; water conservationHigh initial investment costImproved burst detection and leakage identificationNon-functional water meter and inaccuracy in reading
Reducing Non-revenue WaterReduction in water loss through repair and replacement of faulty distribution networkContinuous operation and maintenance are requiredDevelop a 24-h pressurized systemSudden breakdown in the pipe network
Ensuring Public ParticipationMobilization of public support and acceptanceRequires time and resourcesCan address water-related gender issuesNon-representative participation may lead to undesired outcome
Promoting Public AwarenessEncourage water conservationInvolves extra costCan mobilize support for good water policyCan create pressure on utility service provider in case of poor performance
Improving Management CapacityBetter service delivery due to enhanced technical and operational capacityRequires technological, human and financial resourcesIllegal vandalism of water is reducedLack of institutional coordination and political will
Constructing Groundwater PlantProduces moderate- to high-quality water with low energy and costCost of extraction rises rapidly as the water table fallsUseful backup to fill in water supply gapsOver-pumping may render local hand and shallow tubewells inoperative
Promoting Optimum Water DemandReduces water footprint by promoting conservationLack of public awarenessGradually promoting sustainable consumptionNot sustainable if equity cannot be maintained
Effluent Treatment PlantConserves water qualityHigh capital and operation costImplementing ‘Road to Zero Discharge’High risk of contamination
Recycling and Reusing Household GreywaterHigher potential for treatment and reuseLimited financial resources and reliability of treatmentRegulations and guidelines for greywater reusePublic willingness, social and institutional acceptance
Reforming Water Tariff SystemProper valuation of water useInstitutional setup and required technology can be expensiveDifferent tariff structures according to income, class, demand, etc.Faulty meters and non-metered connections
Water-Saving Devices and PracticesSignificant amount of water can be savedReluctance for extra cost with less waterLocal manufacturing of devices can be facilitatedUnwillingness of high-income users
Wastewater Treatment and ReuseAlleviate pressure on freshwater resourcesExpensive technology for collecting wastewater and treatmentAquifer storage and recoveryNegative impact on groundwater quality
Installing Deep TubewellsInstant source for fresh drinking waterHigh capital and operation costsCan be remodeled as recharge wellsRisks of aquifer dewatering, contamination and land subsidence
Table 4. Area-Wise Suggested Adaptation Options.
MODS ZoneLocationMajor ProblemsSuggested Options
Zone 07 and DNDDemra, Matuail, Shyampur and DoniaGWL depletion, poor water supply network, and odor in water.Mandatory provision for RWH and artificial recharge (AR), greywater reuse in suitable places, controlled groundwater flow through Supervisory Control and Data Acquisition (SCADA), SWTP (e.g., Saidabad Water Treatment Plant), leakage monitoring to reduce NRW, and converting the whole network system to DMA.
Zone 01 and Zone 02Gendaria, Old Dhaka, Lalbagh and AzimpurGroundwater depletion, faulty meter, poor water supply network, odor, and presence of suspended solids in supply water.Mandatory provision for RWH and AR, greywater reuse in suitable places, controlled groundwater flow through SCADA, SWTP (e.g., Padma Water Treatment Plant), changing faulty meters, leakage monitoring to reduce NRW, and converting the whole network system to DMA.
Zone 03Dhanmondi and MohammadpurGroundwater depletionMandatory provision for RWH and AR, greywater reuse in suitable places, controlled groundwater flow through SCADA, and SWTP (e.g., Padma Water Treatment Plant).
Zone 04 and Zone 10Gabtoli, Mirpur and Cantonment AreaGroundwater depletionMandatory provision for RWH and AR, greywater reuse in suitable places, controlled groundwater flow through SCADA, and Creating SW sources from the nearby rivers (e.g., Turag and Buriganga).
Zone 09UttaraGroundwater depletionMandatory provision for RWH and AR, greywater reuse in suitable places, controlled groundwater flow through SCADA, SWTP (e.g., Gandrarbpur Water Treatment Plant), and creating alternative SW sources.
Zone 08Badda and Boshundhora Residential AreaGroundwater depletion, poor water supply network, odor, and presence of suspended solids in supply waterMandatory provision for RWH and AR, greywater reuse in suitable places, controlled groundwater flow through SCADA, and SWTP (e.g., Gandrarbpur Water Treatment Plant).
Zone 06Motijheel, Khilgaon, Bashabo, Banashree and MoghbazarGroundwater depletion, faulty meter, poor water supply network, odor, and presence of suspended solids in supply water.Mandatory provision for RWH and AR, greywater reuse in suitable places, controlled groundwater flow through SCADA, SWTP (e.g., Saidabad Water Treatment Plant), leakage monitoring to reduce NRW, and converting the whole network system to DMA.
Zone 05Tejgaon, Mohakhali, Banani, Gulshan and BaridharaGroundwater depletionMandatory provision for RWH and AR, greywater reuse in suitable places, controlled groundwater flow through SCADA, and SWTP (e.g., Gandrarbpur Water Treatment Plant).
Publisher’s Note: MDPI stays neutral with regard to jurisdictional claims in published maps and institutional affiliations.

