Article

BIM-Based Multi-Objective Optimization of Low-Carbon and Energy-Saving Buildings

1
School of Telecommunications Engineering, Jiangsu Vocational Institute of Architectural Technology, Xuzhou 221000, China
2
Jiangsu Province Engineering Research Center of Intelligent Visual Recognition and Data Mining, Xuzhou 221000, China
3
Xuzhou Intelligent Machine and Visual Application Technology Engineering Research Center, Xuzhou 221000, China
4
Jiangsu Collaborative Innovation Center for Building Energy Saving and Construct Technology, Jiangsu Vocational Institute of Architectural Technology, Xuzhou 221116, China
5
School of Mechanics & Civil Engineering, China University of Mining and Technology, Xuzhou 221000, China
*
Authors to whom correspondence should be addressed.
These authors contributed equally to this work.
Sustainability 2022, 14(20), 13064; https://doi.org/10.3390/su142013064
Submission received: 26 August 2022 / Revised: 28 September 2022 / Accepted: 10 October 2022 / Published: 12 October 2022

Abstract

:
Global warming and other environmental problems are increasing the demand for green and low-carbon buildings. The development of high-performance computers and building information models has a significant impact on low-carbon buildings. Low-carbon building design needs to comprehensively consider geography, climate, material, cost and other factors, a highly complex multidisciplinary research problem. Therefore, it is urgent to use advanced modeling and simulation technology, involving BIM, parametric design, cloud platform and evolutionary algorithm. This paper proposes a BIM based low-carbon building design optimization framework, which realizes the comprehensive trade-off function of building low-carbon energy saving and daylighting performance through an improved genetic algorithm. The framework drives BIM through parameterization and integrates building environment information, geometric information and operation information, including six parts: BIM model establishment, parameter-driven development, building performance simulation, multi-objective optimization design, Pareto frontier analysis, and energy-saving decision-making and evaluation. The case study shows that the simulation results obtained through the framework can effectively achieve building energy conservation while maximizing the lighting performance of the building, providing a scientific basis and reference for construction professionals to design low-carbon buildings. Finally, the application advantages and limitations of the framework in low-carbon building design and its application prospects in low-carbon energy-saving building design are discussed. This research has made contributions to the multi-disciplinary low-carbon energy conservation research field, realized the multi-objective optimization strategy of building performance based on BIM, genetic algorithm and simulation, and is an important supplement to existing building energy conservation and emission reduction optimization design.

1. Introduction

The process of global warming continues to accelerate, bringing severe negative effects on the living environment of mankind. The main cause of climate warming is the emission of greenhouse gases such as carbon dioxide [1]. Energy consumption in the construction industry is one of the major factors causing greenhouse gas emissions. According to statistics from the United Nations Environment Program, the construction industry consumes about 50% of global energy and emits about 36% of global greenhouse gases [2]. The construction industry has a high potential for energy conservation and carbon reduction. Building energy conservation and carbon reduction is considered the “last mile” of carbon neutral transformation [3]. Therefore, the research on low-carbon and energy-saving architectural design is becoming the focus of architectural professionals. In the early stage of architectural design, it is important to fully consider carbon emission and energy consumption, study the characteristics of building carbon emission in different countries, comprehensively consider economic, technical, climate and behavior, build an evaluation framework for carbon emission reduction intensity, emission reduction and emission reduction efficiency, and realize the low-carbon transformation of the construction industry [4,5]. Although new research strategies and methods such as high-performance computers [6], multi-disciplinary integration and BIM Technology have gradually been applied to the unified design of building function and energy conservation and carbon reduction, the complex parameters involving multiple disciplines such as shape, cross region and aesthetics in architectural design make it very difficult to formulate a composite trade-off energy conservation and carbon reduction strategy [7].
Multidisciplinary integration of building energy conservation and carbon reduction design has the following potential impacts on cross regional carbon emission reduction targets [8,9,10]: (1) Provide designers with a scientific decision-making basis in the initial stage of architectural design; (2) Real-time reflection on the impact of changes in materials, forms and other parameters on carbon emissions during the construction phase; (3) Through multi-disciplinary simulation, to produce a design plan that weighs building functions and carbon reduction, which has a high reference value for construction professionals. Although the composite trade-off of building carbon reduction design has very good application prospects, it needs the support of multi-disciplinary knowledge such as high-performance computing, complex algorithms and simulation [11]. Therefore, it has not been popularized in industry and is limited to a few academic studies. The difficulty of energy-saving and carbon-reduction design lies in the fact that there are multiple discipline-related parameters and variables in buildings, which are interconnected, influenced and restricted [12]. Any slight change may have an important impact on the effect on energy-saving and carbon-reduction. Therefore, it is urgent to use advanced modeling and simulation technologies such as high-performance computers, BIM, big data, intelligent sensors and intelligent electronic devices to establish multidisciplinary parameter relationships related to architectural design, and use optimization algorithms to simulate and analyze the results of building energy conservation and carbon reduction, so as to reduce typical costs or improve the quality of energy transmission [13,14].
The current energy saving strategies mostly use a combination of trial-and-error method and empirical method, in which designers or researchers propose several project construction and implementation plans based on personal experience and existing cases, measure their energy consumption levels, lighting performance and other indicators through simulation software or professional tools and make decisions through repeated trials. It can be seen that this way of studying and dealing with the relationship between energy consumption, light and heat, morphology and other complex parameters of construction projects based on personal experience has problems such as strong subjectivity, incomplete data analysis and inaccurate decision making. The application of BIM (Building Information Modeling) in the field of building energy efficiency research, especially in the research of sustainable energy efficiency in construction projects, is still relatively limited. How to reflect the complex information, parameters, associations and impacts of buildings through the rich semantic information and parametric-driven characteristics of BIM and to conduct collaborative energy-saving research in information science, architecture, management and other disciplines is a new direction in the field of building energy efficiency.

2. Recent Works

For building energy consumption simulation calculation, there are still difficulties in system boundary determination, data acquisition in the energy consumption list, data accuracy, unification of evaluation criteria, research cost trade-off and operability assessment, which cannot meet the demand for accurate building energy consumption calculation. Although dynamic energy consumption simulation improves the accuracy of calculation, it requires the establishment of complex physical and mathematical models, and different solution methods can make the calculation results vary greatly. To address these technical bottlenecks, the findings from recent works are listed in Table 1. Zhang et al. [15] proposed the use of the genetic algorithm for architectural aided design. This helped decision-makers generate and evaluate planning and design options to evaluate building carbon emissions and performance indicators. Nili et al. [16] coupled a genetic algorithm and dynamic thermal model to optimize their low-carbon design scheme and visually presented it to users to judge its potential use. Kohlhepp et al. [17] explored the multi-objective optimization model in low-carbon buildings, evaluated the economic and environmental standards of the design scheme and obtained the optimal solution through a genetic algorithm. Tang et al. [18] established a CKC model of changes in carbon emissions from residential and commercial building operations in 30 provinces in China and analyzed the robustness of the CKC model estimates through carbon emission intensity.
BIM simulates the construction and operation of buildings by developing and using computer software models. The use of parameterized BIM to realize building performance simulation analysis can reflect building carbon emissions, energy consumption, daylighting and other performance indicators in real time, providing a new workflow for building energy conservation and carbon reduction research [21]. With the continuous promotion of BIM technology in the construction industry, researchers have investigated the multi-objective optimization problem of low-carbon and energy-saving buildings based on the advantages of BIM parameterization from the perspective of multidisciplinary collaborative design. Ohueri et al. [22] studied the application of BIM in low-carbon building design. Through BIM, complex performance simulations were performed in the project design and planning stages to optimize the sustainability indicators of the building. At the end of the study, a conceptual framework was proposed to illustrate how construction companies can use BIM to conduct low-carbon analysis of buildings and implement LEED assessments. Chen et al. [23] developed ThermalOpt, a BIM-based carbon emission and heat simulation tool. It broke through the technical barriers of integrating BIM technology into comprehensive performance optimization. The actual test results of the case implied that ThermalOpt can significantly reduce the preprocessing, configuration, and execution time. Y Wei et al. [24] proposed a BIM-based optimization method for building energy efficiency and low carbon. His PhD student MR Asl designed the Optimo plug-in for Dynamo toolkit to achieve genetic algorithm optimization [25]. The plug-in implemented the NSGA-II algorithm through visual programming. The evolutionary algorithm obtained 72 sets of non-dominated feasible solutions through iterative calculation, as well as a more ideal Pareto front.
This research has made contributions to the field of low-carbon and energy-saving buildings. First, the simulation of building energy consumption and daylighting performance based on BIM was realized and the BIM model was driven through parameterization. The material, orientation, window-to-wall ratio and other parameters were selected to explore the change mechanism of building energy consumption and lighting performance under different design parameters. Second, the NSGA-II algorithm was introduced into the construction performance optimization design to realize the low-carbon and energy-saving optimization strategy of buildings based on the integration of multiple disciplines. Besides, the Pareto frontier balancing building energy consumption and daylighting performance were obtained through case studies. This is an essential supplement to the existing cross-regional building energy-saving and emission reduction optimization design.

3. Materials and Methodology

3.1. Parametric Design of BIM Model

In this paper, the BIM model for building form and energy analysis created by Glenn Katz of Stanford University’s School of Environment and Civil Engineering is used as the research object. The region has close to 1600 h of dry bulb temperature above 27 °C throughout the year, which is higher than the statistical hours of other dry bulb temperatures; the maximum time of wet bulb temperature below 0 °C is about 1350 h throughout the year. When the temperature value is at 6 °C, 9 °C, 18 °C and 21 °C, the difference between the statistical hours of dry bulb temperature and wet bulb temperature is not significant; when the temperature value is at 15 °C, influenced by the rainy season, the statistical hours of wet bulb temperature are higher than the dry bulb temperature by about 400 h; when the temperature value is at 27 °C, the annual statistical hours of wet bulb temperature are less than 200 h, indicating that the region has higher humidity throughout the year and the difference between dry and wet bulb temperature is smaller. Material, orientation, volume and other parameters are combined to simulate building carbon emissions. The energy consumption result is expressed by the annual or unit energy consumption index (kWh/m2). The basic form of the BIM model is presented in Figure 1. The periphery of each floor is an open space and the interior is an office and traffic area. The height is 12 m, and the total construction area is about 1642 m2. The model layer height, roof and wall materials were adjusted to obtain a more ideal lighting simulation effect. Specifically, the floor height is set to three floors; the daylighting skylight and glass curtain wall are added. The revised model is exhibited in Figure 1. The various parameters of daylighting simulation are provided in Table 2.
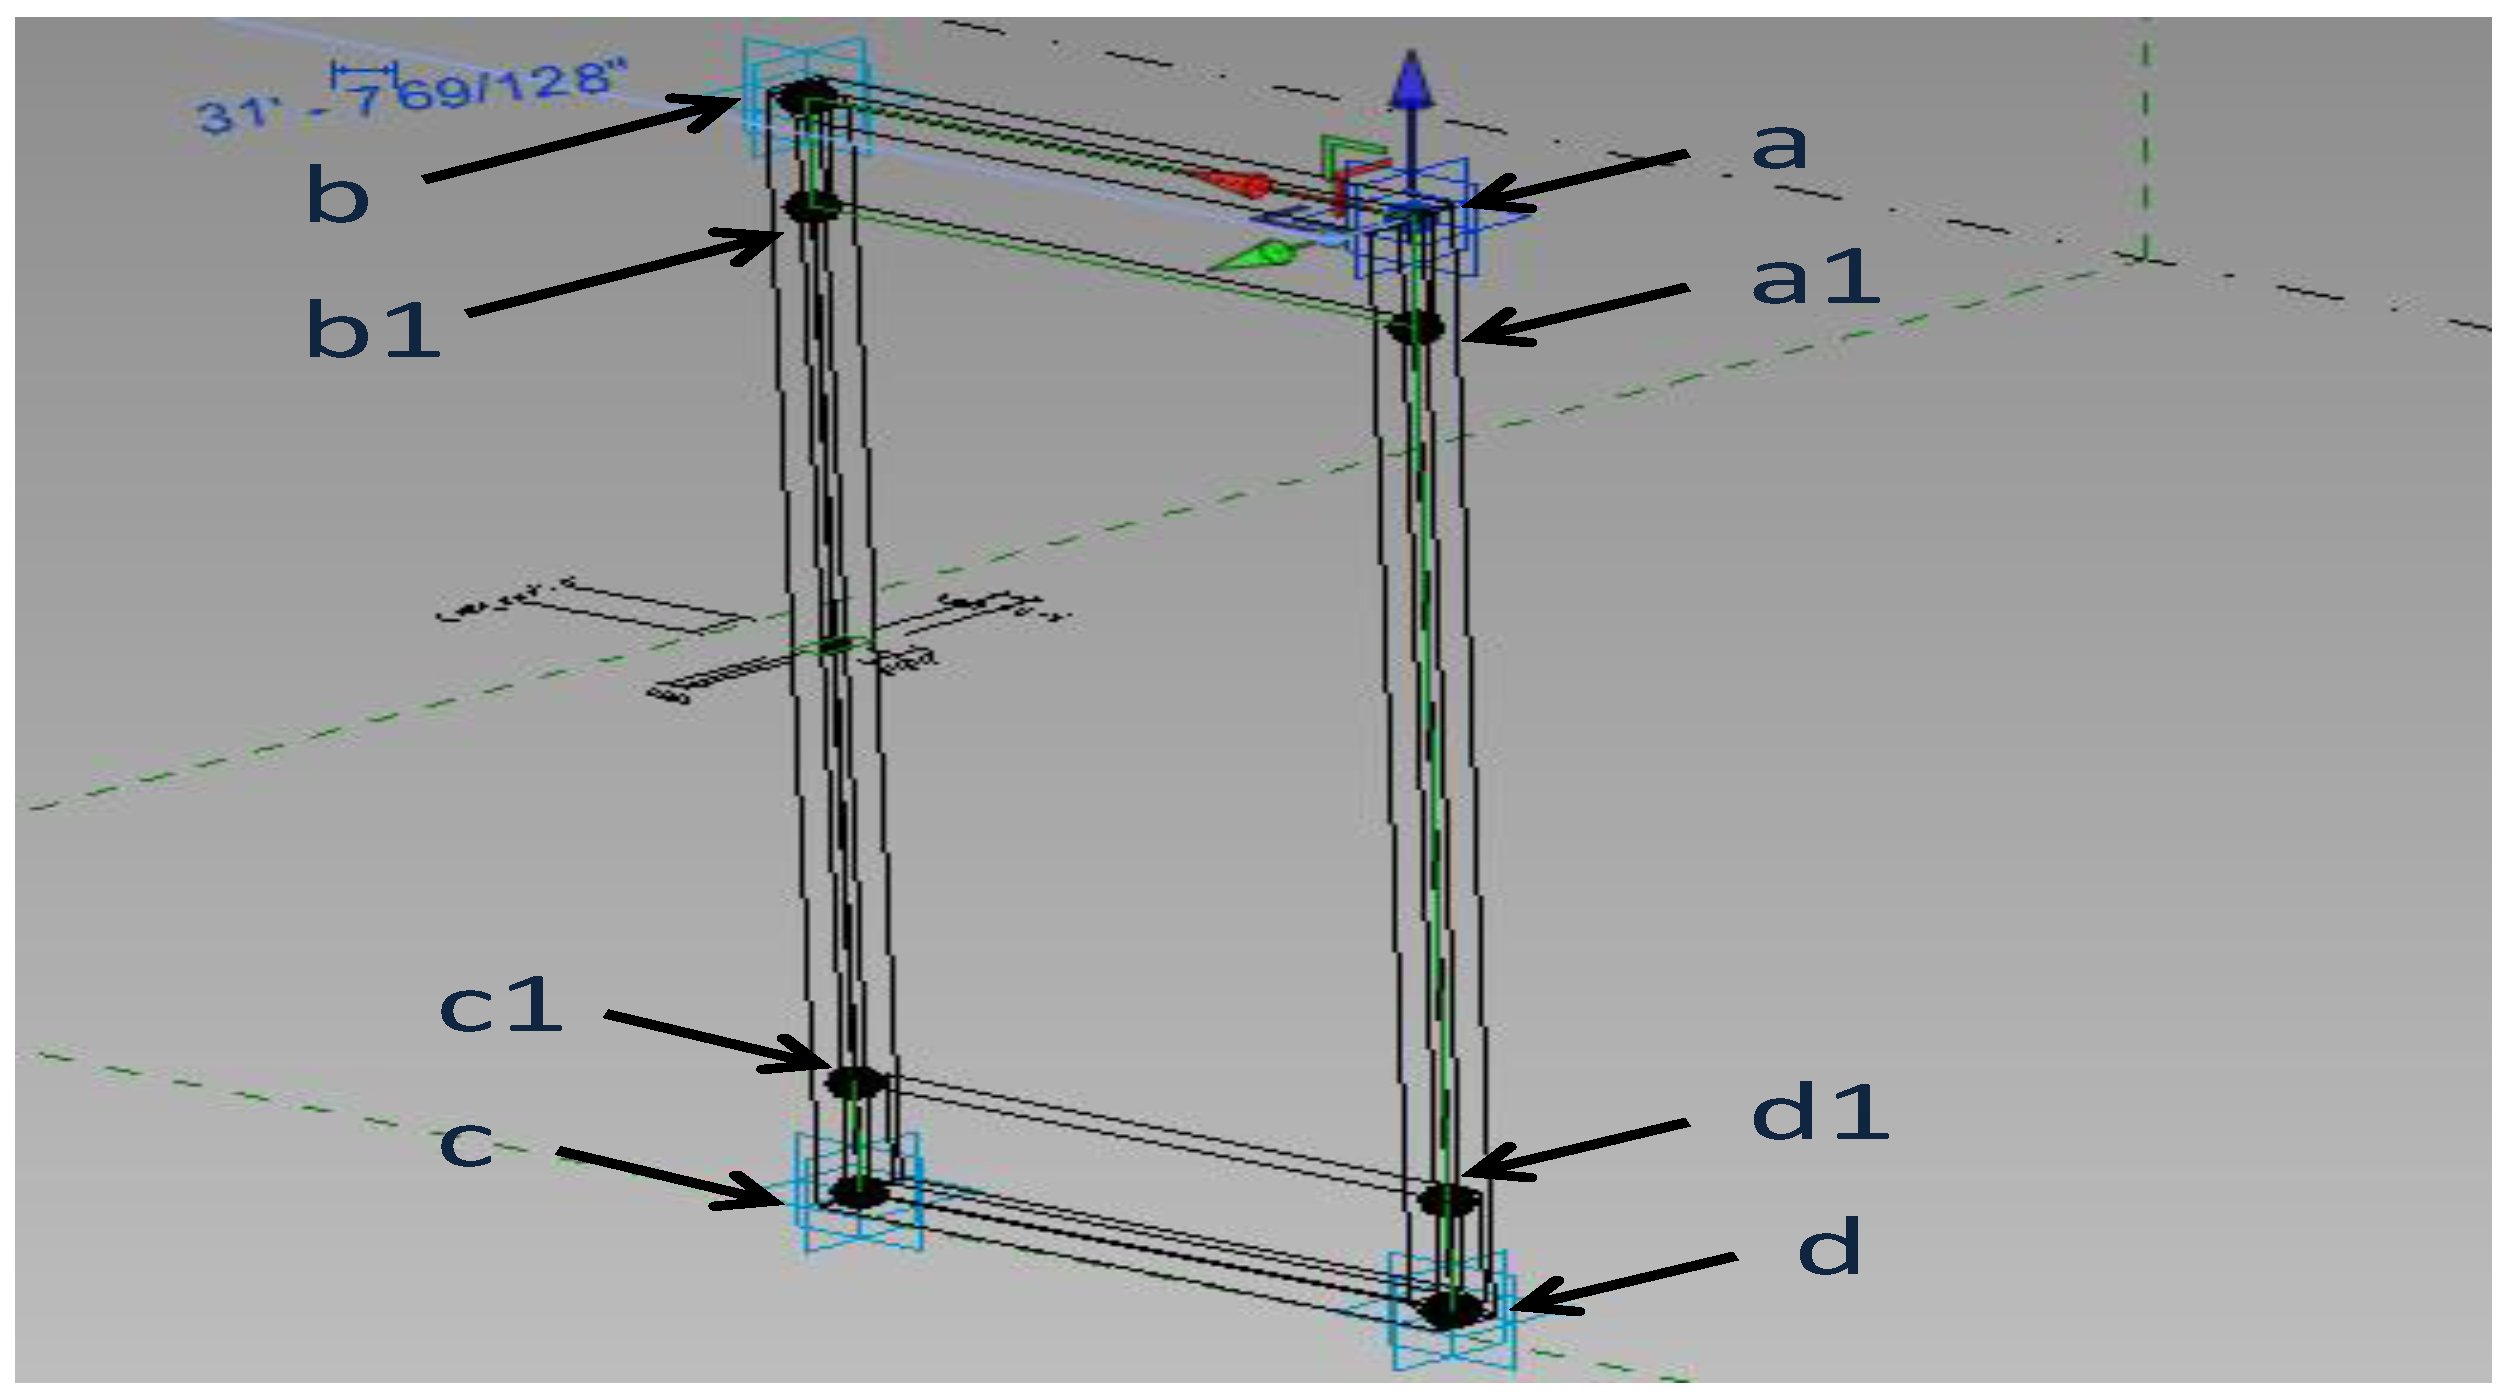
The curtain wall module of the model adopts adaptive components for parametric control. First, the outer frame of the curtain wall module is established through adaptive points a, b, c, and d. The reference plane of the internal partition of the curtain wall is established through reference points a1, b1, c1 and d1, as illustrated in Figure 2. Next, the parameters of f_size, f_size_z, gap, s_up, s_down, s_dist and f_size_m are set. Each parameter and the relationship between the parameters are exhibited in Table 3. Finally, the size of the glass inside the curtain wall is adjusted by the control parameters of s_up and s_down and the size of the outer frame of the curtain wall is adjusted by the control parameters of f_size and f_size_m [24,25].
The window to wall ratio is positively related to the total energy consumption of the building, i.e., the larger the window to wall ratio, the higher the energy consumption. However, increasing the window to wall ratio will improve the indoor lighting effect. Therefore, this variable is taken as the decision variable of the optimization objective. The window height will affect the lighting performance index in the depth direction of the building. At the same time, the window height has a significant positive correlation with the air conditioning energy consumption in the building energy consumption and the window height determines the external window width height ratio of the building facade, which has an impact on the building form. Therefore, the window height is taken as the decision variable. Different walls and glass materials have differences in visible light transmittance, heat transfer and shading coefficient, which directly affect energy consumption and lighting goals, while building materials and costs are directly related, so glass materials are taken as building materials decision variables. Finally, 11 parameters such as building orientation, window wall ratio, window height and glass material are determined as optimization decision parameters.
Considering the impact of building orientation change on energy consumption and lighting simulation, take 15° as the step of orientation parameter change. When the case project rotates counterclockwise with the center point, the variation range of orientation parameter is 0° to 30°; When the case item rotates clockwise with the center point, the change range of the orientation parameter is −30° to 0°. The design standard for energy efficiency of public buildings (GB50189-2015) requires that the window wall ratio of public buildings should be less than 70%. Considering that the window wall ratio of the East facade has a significant impact on the lighting, the parameter range of the window wall ratio of the west side of the building is set to be 0–50%, and the window wall ratio of other facades is set to be 10–65%. For the window height parameters of all directions, the sampling of office buildings in hot summer and cold winter shows that the range of window height parameters is usually 1.5 m–2.8 m. The selected variables include parameters such as building orientation, building floor height, window height, window-to-wall ratio and building material. The heat transfer coefficient of external walls and roofs and the visible light transmittance of windows are associated with the building materials. The corresponding external wall, roof and window parameters are obtained by reading the Revit wall and window material library. The variable design and some initial values are listed in Table 4.
The case project creates eight types of glass materials and seven types of wall materials. The heat transfer coefficient and visible light transmittance are shown in Table 5. Material information is stored in the list as a discrete variable and each material information corresponds to an index value. During the optimization process, Dynamo first reads the material information in the BIM model, and then takes the index corresponding to each material as the decision parameter. The parameter variation range is (0, n−1) (n is the total number of materials).

3.2. Optimization of the Design Process

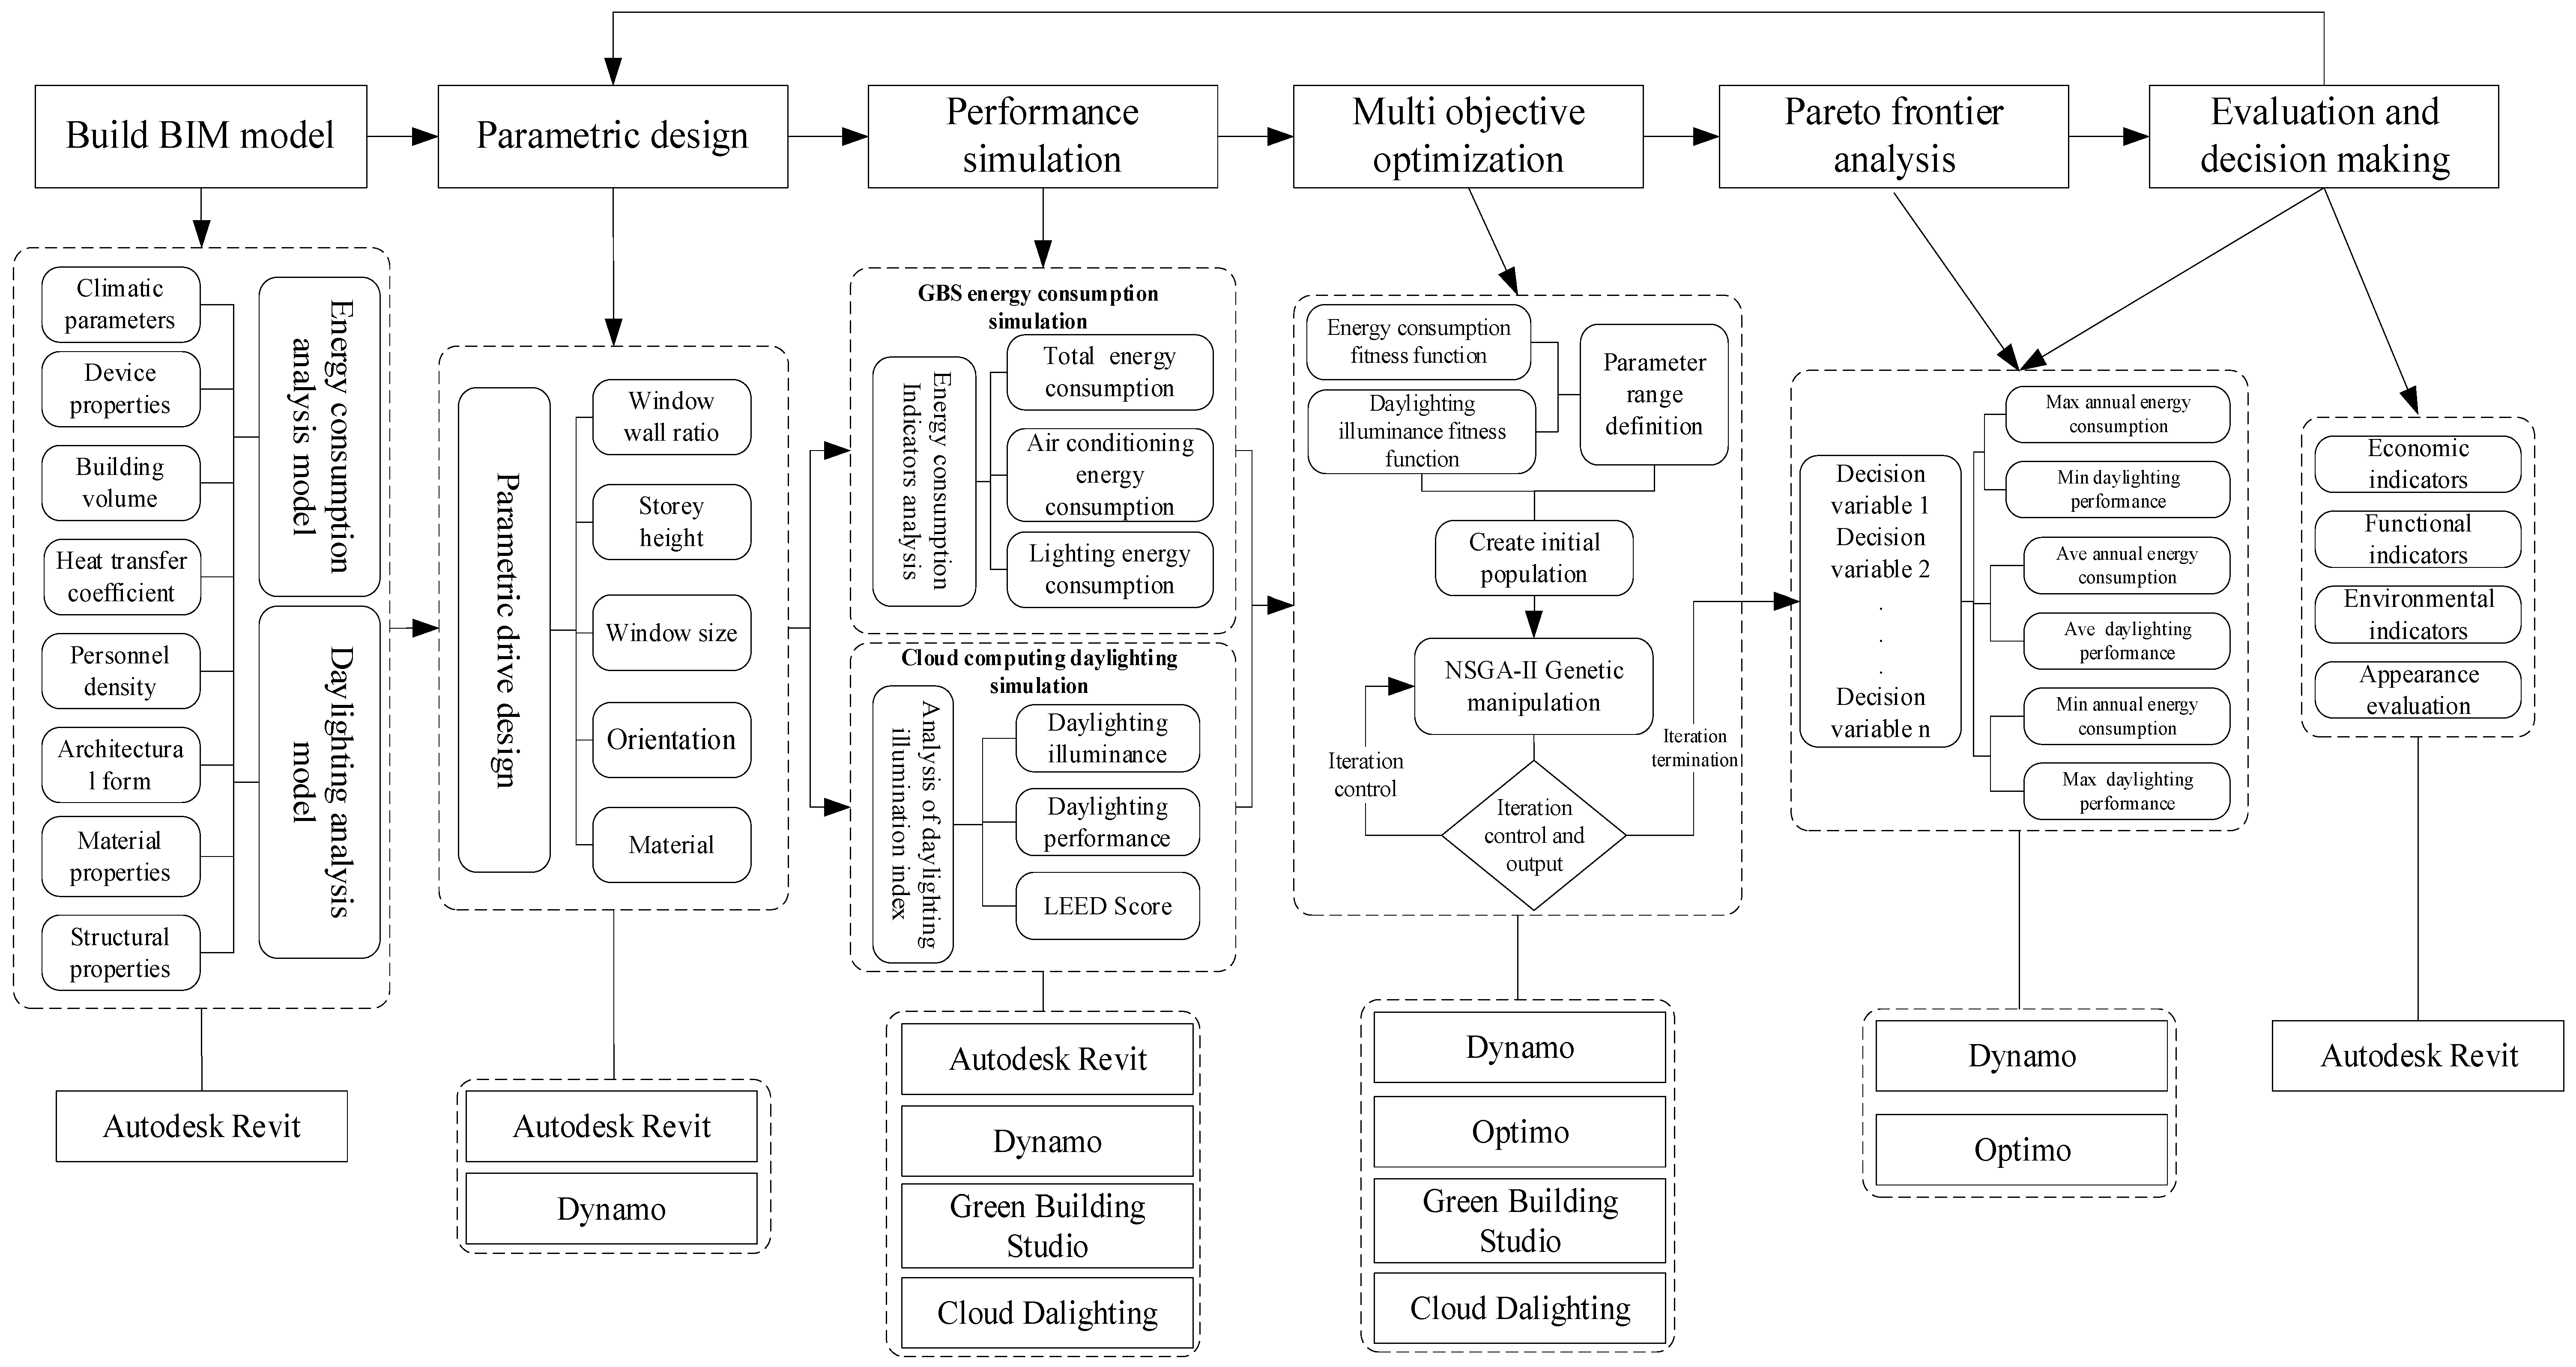
Building performance optimization based on the NSGA-II algorithm is a combination of BIM technology, parameterized drive, visual programming, building performance simulation, and multi-objective optimization theories, as well as the integration of multiple disciplines [26]. It involves the interaction of various platforms and the interaction between users and system integration. The framework consists of two parts: BIM-based energy consumption analysis and daylighting performance analysis. The rich project information stored in BIM is combined with the building performance simulation tool in a parameter-driven way [27]. The two indicators of building energy consumption and daylighting performance are designed as competing fitness functions. Multi-objective optimization is performed through the NSGA-II algorithm provided by Optimo to obtain the Pareto frontier. The multi-objective optimization process is illustrated in Figure 3. It is divided into six parts: BIM model establishment, parameter-driven development, building performance simulation, multi-objective optimization design, Pareto frontier analysis and energy-saving decision-making and evaluation.
To create the BIM model module to set climate parameters, equipment parameters, heat transfer coefficient, material parameters and other attributes, the input file for building performance simulation is created by reading the project attribute, building form, physical information and other contents stored in the BIM model. The parametric drive development module defines the parameter relationship between the objects of the BIM model, generates a variety of schemes in the optimization process and performs analysis and performance evaluation. The building performance simulation module calculates the building energy consumption through Dynamo connecting BIM model and GBS and analyzes the energy consumption of the whole year, air conditioning energy consumption and lighting energy consumption. The lighting performance calculation process is similar to the energy consumption analysis. In the multi-objective optimization design module, Optimo is used to optimize the decision variables and fitness functions through the NSGA-II algorithm. The BIM model is updated as the decision variables change. Dynamo uploads the analysis model to the cloud simulation engine and iterates the entire optimization process to generate the optimal solution. In the Pareto frontier analysis module, by outputting Pareto frontier data, the decision variables and BIM models under the optimal, worst and composite trade-offs of annual energy consumption and lighting targets are analyzed. In energy-saving evaluation and decision-making module, the designer evaluates and makes decisions on the obtained Pareto frontier according to the project requirements and functional objectives. Decision-making is based on evaluation criteria such as environment, society, function and aesthetics.
Multi-objective optimization design defines two fitness functions of energy consumption index and daylighting index. With Optimo, the decision variables and fitness function are optimized through the NSGA-II algorithm. The NSGA-II algorithm (non-dominant sorting genetic algorithm II) was proposed by Srinivas and DEB after improvement of the NSGA algorithm. It is one of the most widely used genetic algorithms at present. The NSGA-II algorithm hierarchizes the non-inferior solution level of the population through the non-dominant order value i r a n k of the individual, and guides the search to the hierarchical direction of Pareto optimal solution. Its elite retention strategy directly enters the excellent individuals in the parent population C i into the child population D i , and forms the next generation population R i together to prevent the loss of the non-inferior solution of the parent population. The calculation of individual congestion density in NSGA-II algorithm is shown in Formula (1):
L [ i ] d = L [ i ] d + ( L [ i + 1 ] m L [ i 1 ] m ) / ( f m max f m min )
where L [ i + 1 ] m is the value of the m objective function of the i + 1 individual and f m max and f m min are the maximum and minimum values of the function, respectively. The congestion density is used to ensure the uniform distribution of the calculation results and maintain the diversity of the population. The algorithm has the characteristics of fast running speed, high performance and strong convergence while reducing the complexity of the non-inferior sorting genetic algorithm. The recursive pseudo-code implemented by the NSGA-II Algorithm 1 is described as follows [28,29].
Algorithm 1 NSGA-II algorithm pseudo code
mak-new-pop(P)
{ R t = P t Q t   //Random generation of primary population P0
  F = fast-nondonminated-sort(Rt)    //Generate all boundary sets
   P t + 1 = and i = 1
  Until(|Pt+1|+|Fi|≤N)
      crowding-distance-assignment(Fi)
       P t + 1 = P t + 1 F i
      i = i + 1
   sort ( F i , n )     //Establish the partial order relation of the boundary set of layer i
     P t + 1 = P t + 1 F i [ 1 : ( N | P t + 1 | ) ] //Perform selection, crossover, and mutation operations on Pt+1
  Qt+1 = make-new-pop(Pt+1)
  t = t + 1
}
Through fast-nondominated-sort, multiple boundary sets F = ( F 1 , F 2 , ... ) will be generated. Besides, the individuals in the top-ranked population are selected into the new population through the elite retention strategy. The total time complexity of the algorithm is O ( r ( N ) 2 ) .
The crossover operation of NSGA-II uses a single-point crossover. The parent population and offspring population are expressed in Formula (2) after the crossover operation.
Parent   population : P 1 = A 1 t k + B 1 P 2 = A 2 t k + B 2 Offspring   population : C 1 = A 1 t k + B 2 C 2 = A 2 t k + B 1
According to the positional relationship between the parent and offspring populations, the crossover operation can be divided into three types: compressed crossover, expanded crossover, and steady-state crossover. It is determined by the value of the distribution coefficient β = | C 1 C 2 P 1 P 2 | . Suppose the length of the parent is l, and each bit is represented by a i , b i ( 0 < i l ) ; assume that the position of the crossover operation is k. Then, the calculation of the parent C, the offspring P, and the distribution coefficient β is presented in Formula (3).
P 1 = i = 0 l 1 a i 2 i P 2 = i = 0 l 1 b i 2 i C 1 = i = 0 k 1 b i 2 i + i = k l 1 a i 2 i C 2 = i = 0 k 1 a i 2 i + i = k l 1 b i 2 i β ( k ) = | C 1 C 2 P 1 P 2 | = | i = 0 k 1 u i 2 i i = k l 1 u i 2 i i = 0 k 1 u i 2 i + i = k l 1 u i 2 i |
If 0 β 1 , the probability density of β can be simplified to p ( β ) = 1 2 ( η c + 1 ) β η c ; if β > 1 , the probability density of β is p ( β ) = 1 2 ( η c + 1 ) 1 β η c + 2 , where η c is a non-negative real number, also known as the cross coefficient. Therefore, the generation of β can be obtained by calculating a random number u uniformly distributed in the interval (0, 1), as expressed in Formula (4).
0 β 1 , 0 β k p ( β ) d β = u β > 1 , 0.5 + 1 β k p ( β ) d β = u , β k = ( 2 u ) 1 η c + 1 , 0 u 0.5 ( 2 ( 1 u ) ) 1 η c + 1 , u > 0.5
The value of β tends to 1 when the value of η c is larger. At this time, the offspring population closer to the parent is more likely to be selected into the next generation. The value of β is approximately a uniform distribution in the interval [0, 1] when the value of η c is smaller or even tends to 0. Meanwhile, the offspring population far away from the parent may also be selected into the next generation population.
The BIM model is updated as the decision variables change to regenerate the corresponding energy consumption and daylighting analysis models. Dynamo uploads the analysis model to the cloud simulation engine and calculates the fitness function value. Optimo iterates the entire optimization process to generate the optimal solution. Through the elite retention strategy, each generation of the population is improved and the final non-dominated feasible solution is output. The tools involved in Pareto Frontier Analysis include Dynamo and Optimo. The decision variables and BIM model under the optimal, worst, and compound trade-offs of the annual energy consumption and daylighting goals are analyzed with the output of the Pareto frontier data. Decision-making variables majorly consist of building material, window size, and window-to-wall ratio. The designer evaluates and makes decisions on the obtained Pareto frontier based on project requirements and functional goals. The basis for decision-making contains evaluation criteria such as environment, society, function and aesthetics. The designer can directly select one or several sets of solutions in the final non-dominated solution, or adjust the parameters of the non-dominated solution and finally obtain the desired result through re-optimization.

4. Results

In cold regions, hot-summer and cold-winter regions and hot-summer and warm-winter regions of China, air conditioning, lighting and equipment energy consumption are the main sources of building energy consumption. There is a significant correlation between the density of equipment and space size in the building and the amount of equipment is usually calculated based on the floor area, so the equipment energy consumption is relatively stable under the constant floor area. Therefore, this paper does not include the equipment energy consumption into the consideration of energy performance and the study selects the minimum energy consumption of air conditioning and lighting as the energy consumption target [30]. The project site is located in the central region of the lower reaches of the Yangtze River, with a humid north subtropical climate, four distinct seasons, annual precipitation of about 1106.5 mm, annual precipitation days of about 117 days, relative humidity of 76%, annual average temperature of about 15.4 °C, maximum temperature of about 39 °C and minimum temperature of about −10 °C. The building energy consumption and lighting performance optimization model conducted by the case study can be expressed by Formula (5).
M i n f 1 ( X ) = A E U ( X ) M a x f 2 ( X ) = D L S ( X ) X = x B O , x E W W R , x W W W R , x S W W R , x N W W R , x E W H , x W W H , x S W H , x N W H , x i G M , x j W M
AEU: annual energy consumption; DLS: lighting performance; BO: building orientation; E–WWR: east window wall ratio; W–WWR: west window wall ratio; S–WWR: south window wall ratio; N–WWR: North window wall ratio; E–WH: east window height; W–WH: west window height; S–WH: south window height; N–WH: North window height; GM: glass material, I: 0, 1 ... 7; WM: external wall material, j: 0, 1 ... 6.The fitness function of the optimization target is expressed in Formula (6). Among them, E F i t represents the energy consumption target fitness function; D F i t denotes the fitness function of the lighting target; A E U indicates the annual energy consumption, mainly composed of air-conditioning energy consumption and lighting energy consumption; D L S refers to the LEED lighting performance score, including the percentage of room lighting illuminance.
E Fit = A E U Min ,   D Fit = D L S Max
The fitness function design of the A E U target reads various information stored in the BIM model, such as building orientation, building material and geographic location. The BIM model is converted into an energy consumption analysis model in GBXML format through the Revit API programming interface. The upper and lower limits of the parameters of the energy analysis model are set using Dynamo and uploaded to GBS for energy consumption simulation. Finally, the simulation result is applied as the fitness function to construct the initial population. The fitness function design of the D L S target adopts the method of LEED EQc 8.1 to calculate the daylighting performance score. It satisfies the product of visible light transmittance (VLT) and window-to-ground ratio (WFR) between 0.15–0.18. Parameter information in BIM is read through Dynamo. Python-API s employed to realize the lighting performance calculation of LEED EQc 8.1. Finally, the percentage of room area that meets the LEED score requirements is defined as the fitness function. The threshold is set to 0.75 according to the requirements of the LEED lighting score.
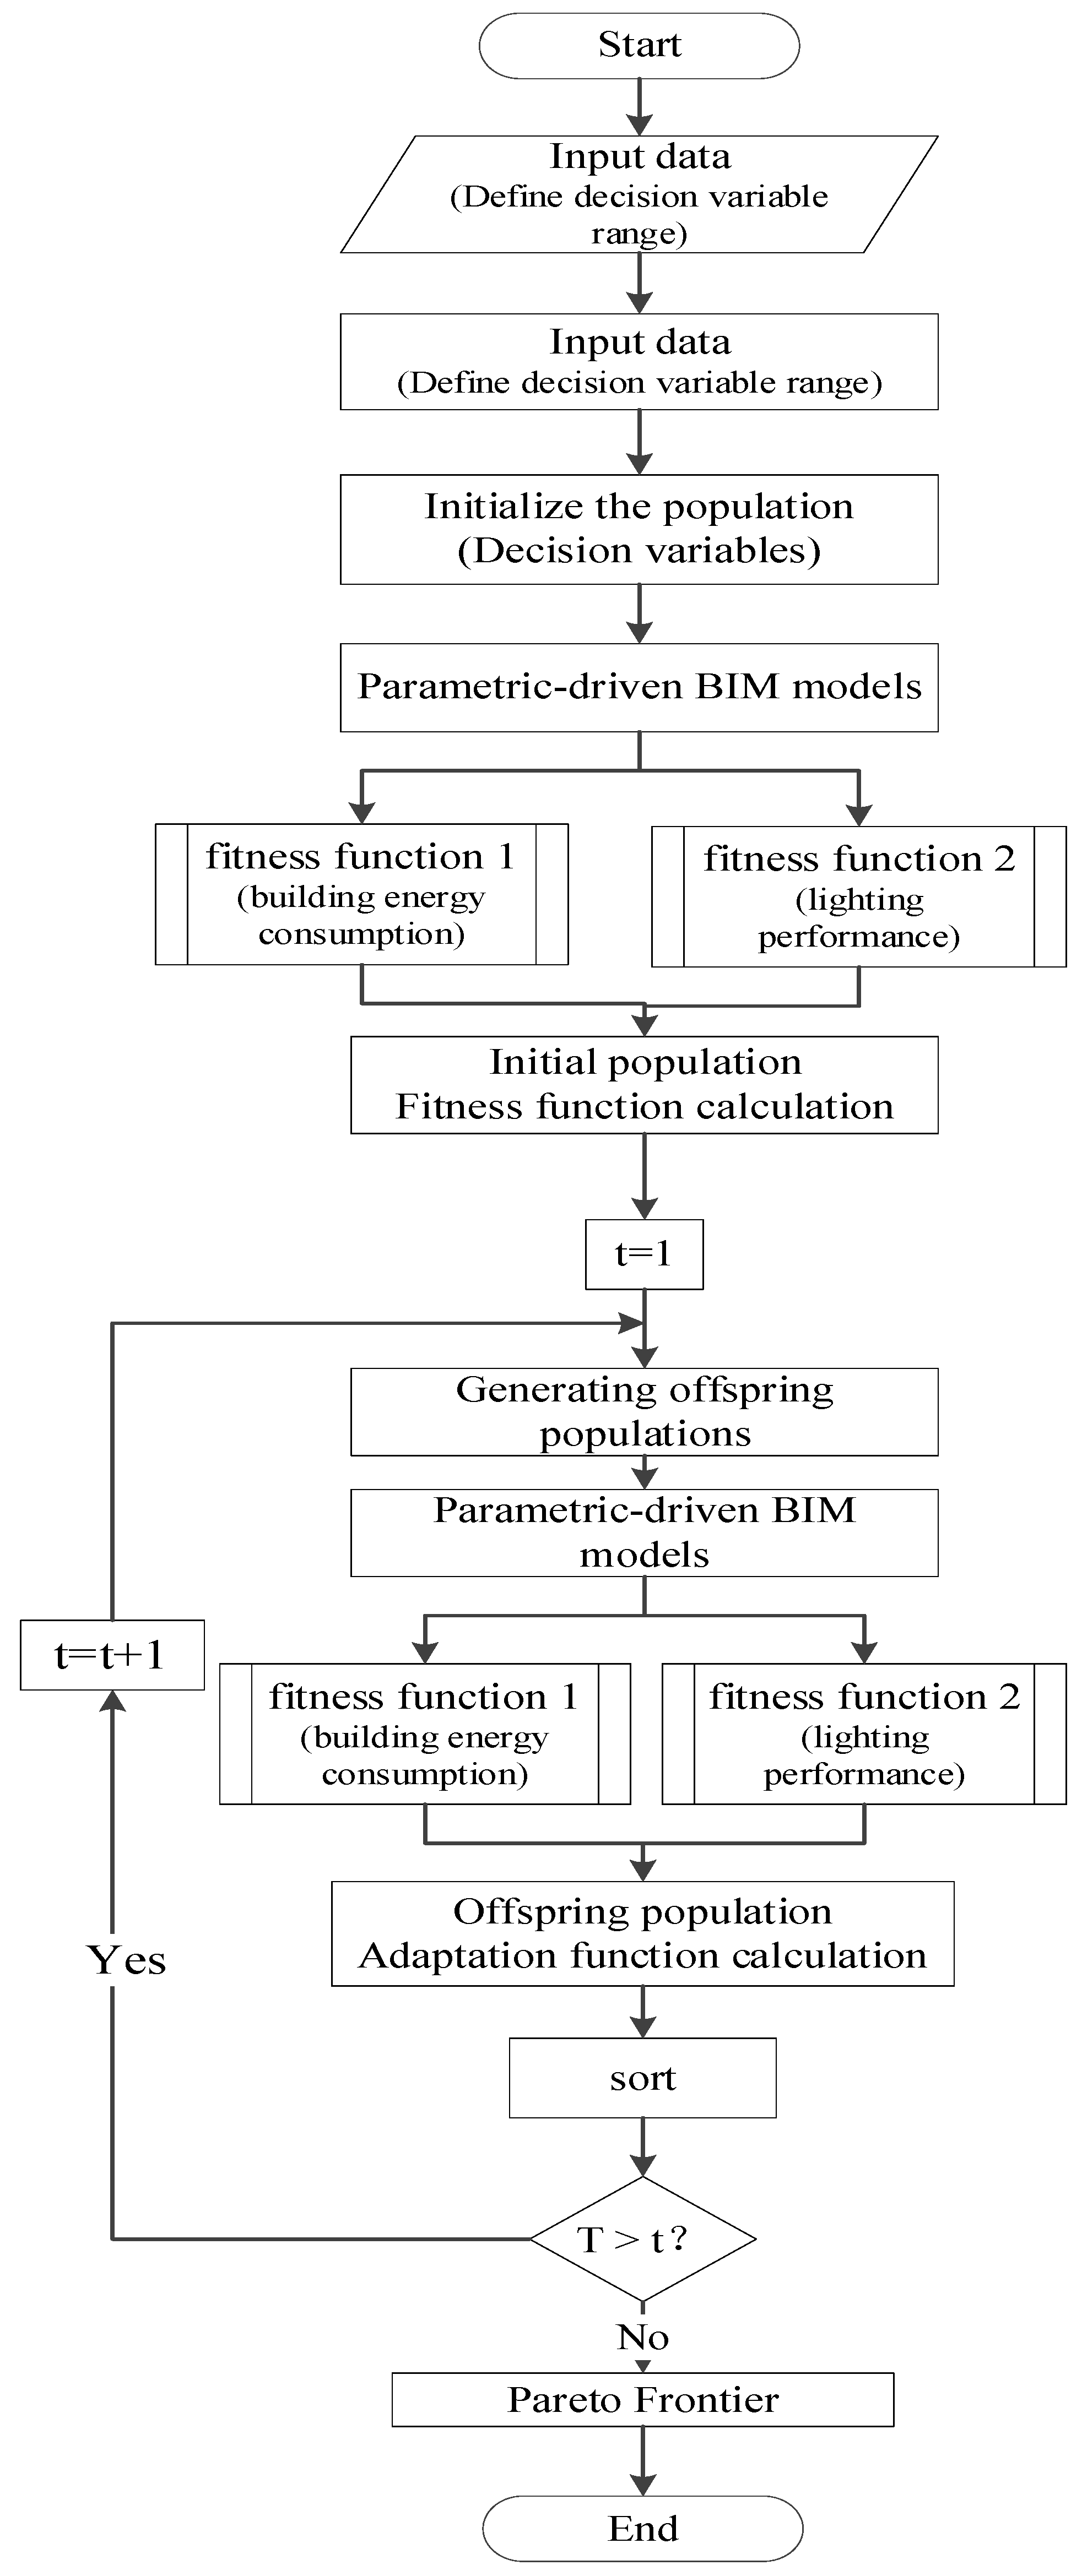
The design process for realizing energy consumption and daylighting optimization through Dynamo is exhibited in Figure 4. Lower Limit and Upper Limit define the variable ranges of the building orientation, window-to-wall ratio, material, and other parameters, respectively. A list of random variables as initial values is generated through InitialSolutionList. The ComputeDaylightingScore node is a fitness function for daylighting performance simulation. The ComputeEnergyUse node is a fitness function for building energy consumption simulation. Besides, the BIM model is exported through PythonScript code to generate a GBXML file and uploaded to GBS for energy consumption simulation and output annual energy consumption results. The AssignFitnessFunction node calculates the fitness function value and creates the initial population. The NSGA-II Function node uses the NSGA-II algorithm for multi-objective optimization. With the purpose of improving the operation efficiency, the population size is set to 100, the number of iterations is 150, the crossover parameter in the genetic algorithm is 0.9, the mutation parameter is 0.01 and the crossover and mutation distribution index value is 20. The Pareto frontier after the iteration is written into the local Excel file.
The population size of the optimization case is 100, the crossover probability parameter of the genetic algorithm is 0.9, the mutation probability parameter is 0.01 and the crossover and mutation distribution indexes are set to 20. Since the simulation of energy consumption and lighting performance requires frequent interaction with GBS and cloud rendering services, in order to reduce the simulation time and improve the operation efficiency the number of iterations is set to 15, resulting in a total of 1500 energy consumption simulation results and 3000 lighting simulation results (LEED EQC 8.1 needs to conduct two simulations at 9:00 a.m. and 3:00 p.m. to obtain lighting performance indicators). The process of energy consumption and lighting optimization through NSGA-II algorithm in Optimo is shown in Figure 5.
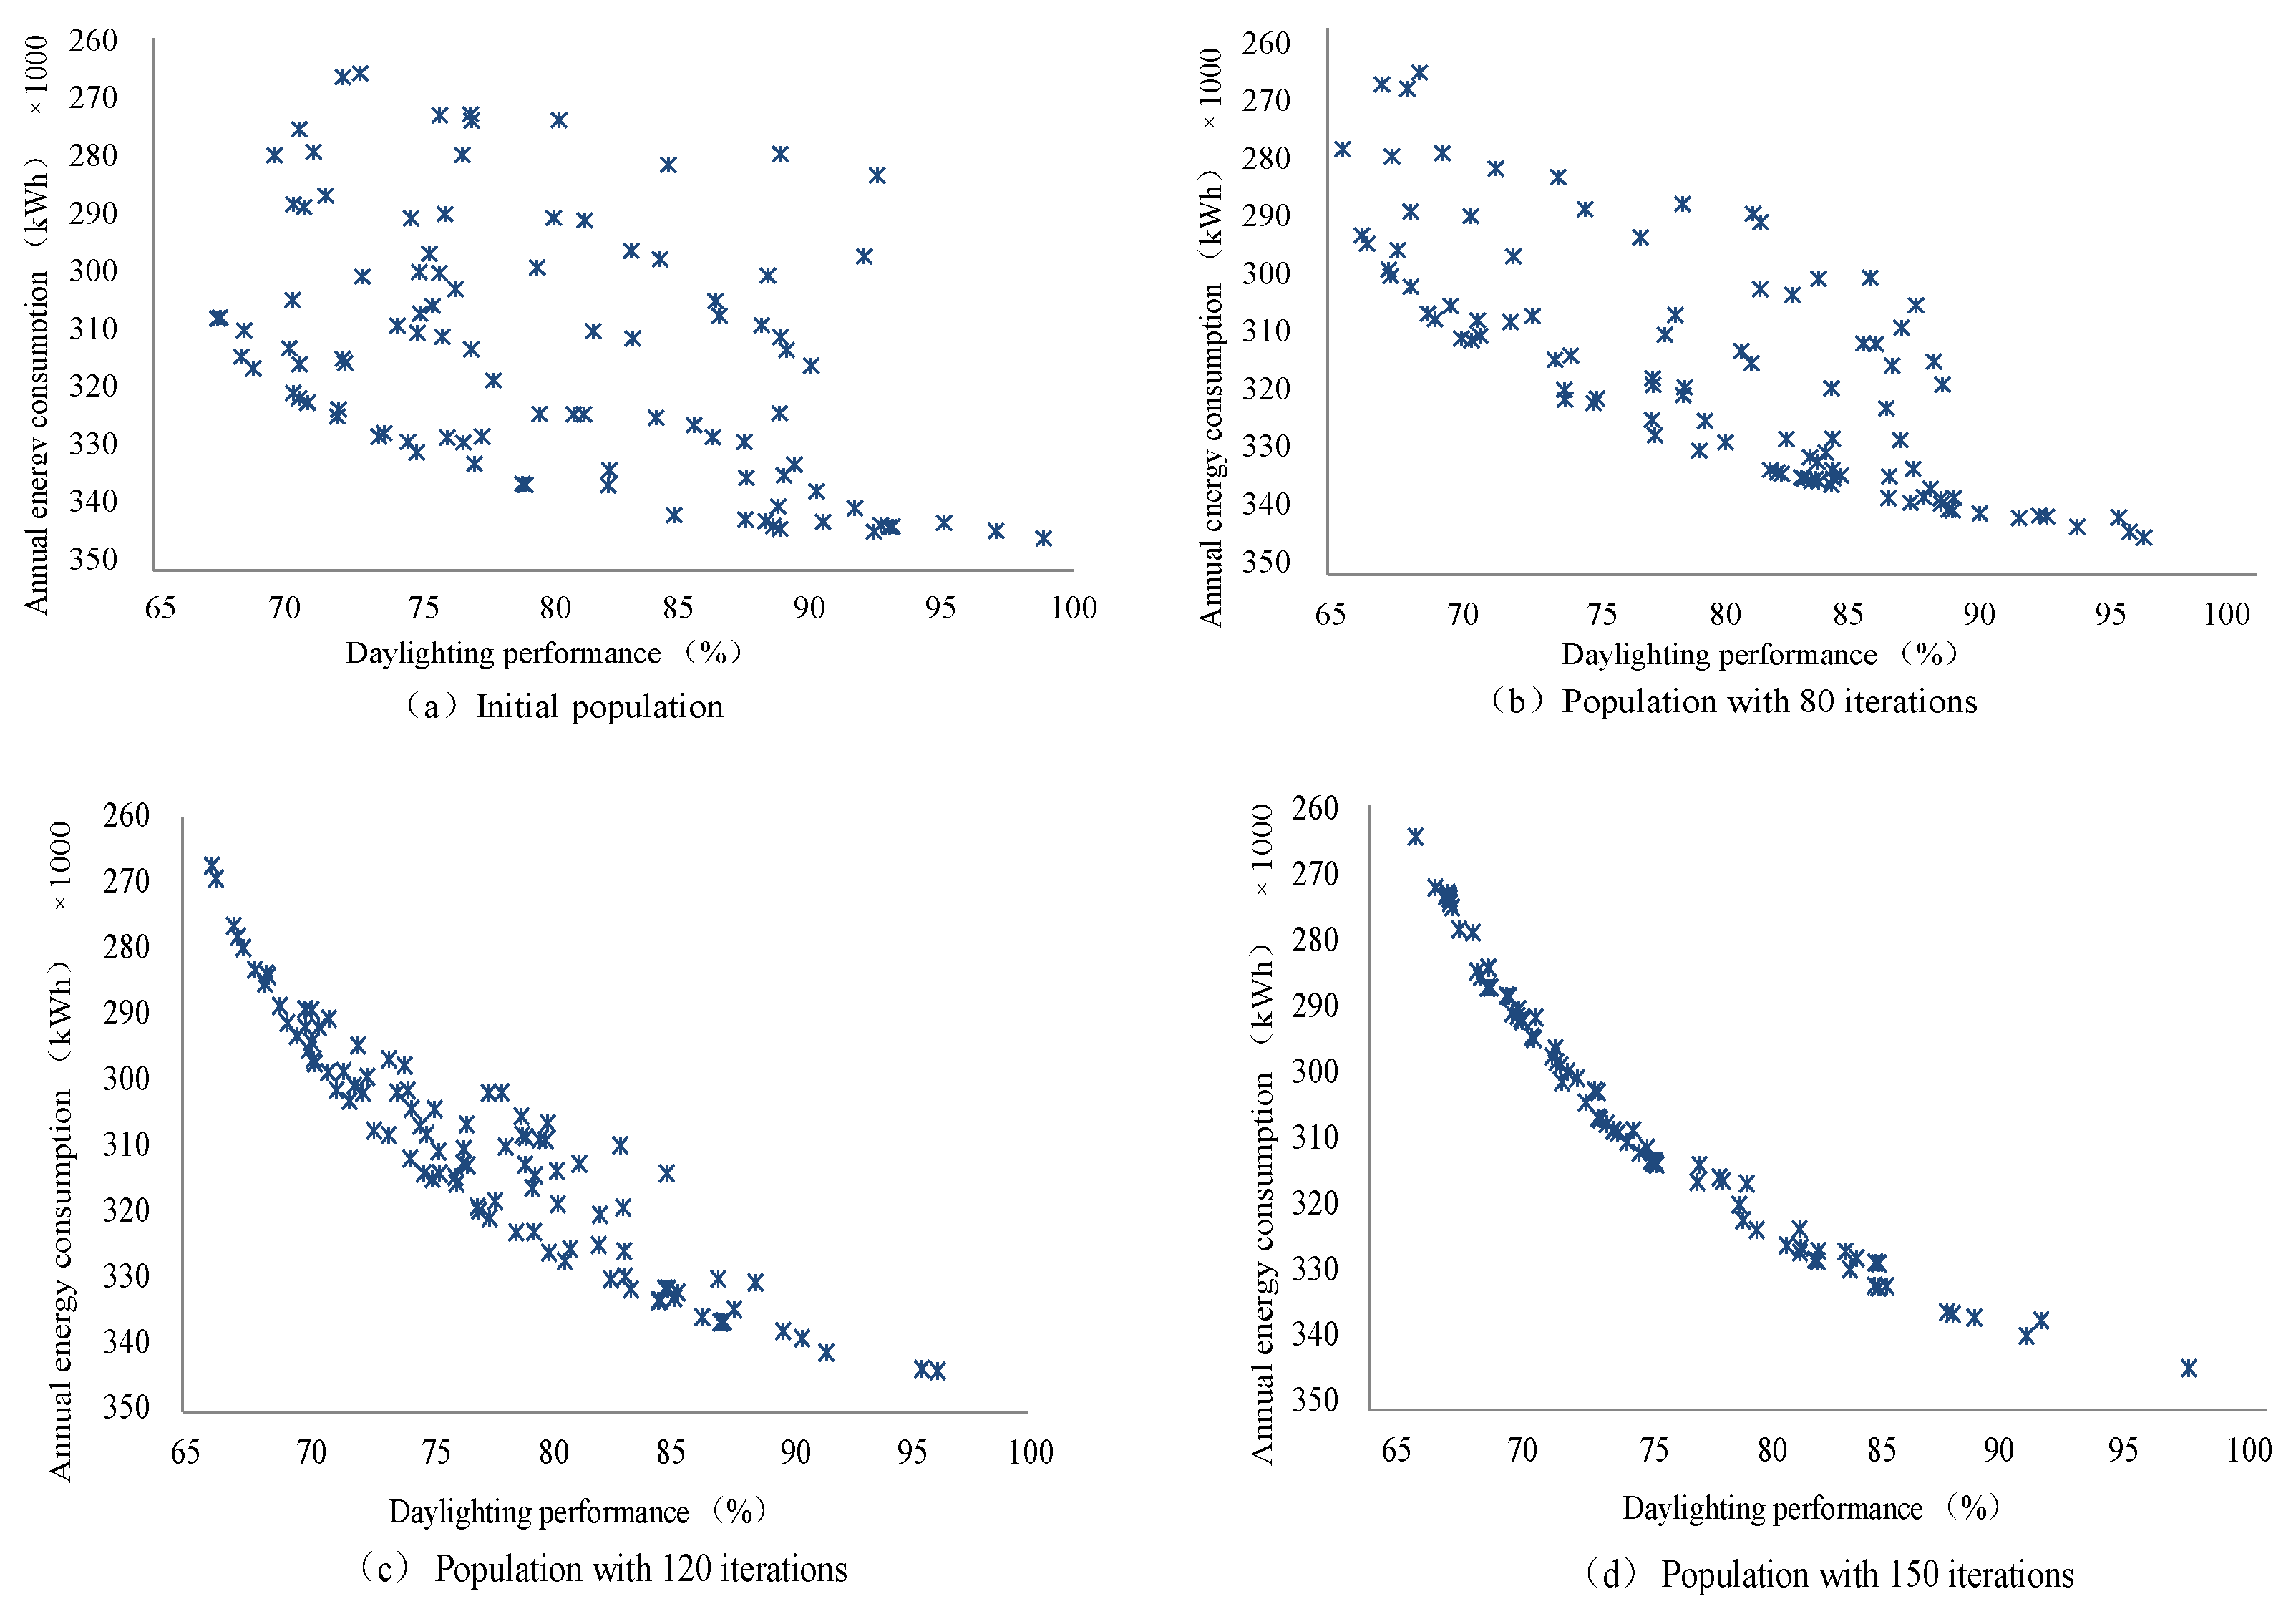
Figure 6 reflects the process of obtaining the Pareto front after 150 iterations in total for energy consumption and daylighting indicators from the initial population. The distribution of the first-generation population is illustrated in Figure 6a and the population is 100. After 80 iterations, the population distribution has a clear trend of convergence. Feasible solutions far away from the coordinate axis have gradually been eliminated. The progeny population continues to converge to the coordinate axis and the origin, as presented in Figure 6b. The population has formed a relatively obvious Pareto front when the number of iterations reaches 120. The feasible solution converges to a relatively small area, as exhibited in Figure 6c. The Pareto frontier finally obtained after 150 iterations is provided in Figure 6d. The population individuals are more evenly distributed in the optimal solution and each point corresponds to a non-dominated feasible solution. The boundary individuals have also been successfully retained. To sum up, the optimization result is ideal.
It can be observed from Figure 6 that, when the LEED lighting performance index value is 65%, the total energy consumption of the building for the whole year is at least approximately 260 × 1000 kWh. The building’s annual energy consumption is rising with the continuous increase in LEED lighting performance indicators. The total annual energy consumption of the building is close to 350 × 1000 kWh at the maximum when the daylight index value is close to 95%. Therefore, there is a negative correlation between the lighting performance index and the annual energy consumption. Under the premise of meeting the LEED lighting performance of 75%, the total energy consumption value of the building is about 310 × 1000 kWh at the lowest and 350 × 1000 kWh at the highest. The corresponding lighting performance indicators in different climate regions can also be adjusted appropriately. For example, the locations where energy consumption and daylighting are simulated in this paper belong to areas with a hot summer and cold winter, with dry winters of little rain and high temperatures, and the lowest temperature is around −5 °C. Thus, the daylighting index can be appropriately relaxed to 70%. At this time, the total annual energy consumption of the building is about 290 × 1000 kWh, which is about 16.7% lower than that of the 95% daylighting index. The designer can also select the desired optimization plan from the Pareto frontier in combination with actual needs.
The LEED lighting performance index value is determined to be 75%. After the number of iterations reaches 150, the decision variable parameters of the BIM model obtained through performance simulation have significantly changed compared with the initial model. The orientation of the building is rotated from the original northerly to the southerly orientation. Compared with the initial model, the north-facing and west-facing window walls are significantly reduced, the east-facing window-to-wall ratio slightly changes and the south-facing window-to-wall ratio is adjusted to 0.45. The window size of the east, south, and west walls of the building is 0.68 × 1.2 m2, and the north opening size is 0.68 × 1.2 m2. The glass material used is double-layer insulation Low-e glass, with a visible light transmittance of 0.61. Besides, the solar heat gain coefficient is 0.41 and the thermal resistance is 2.8573.

5. Discussion and Conclusions

This paper presents a new methodology of low carbon building design for multi-objective optimization of building performance. It implements BIM-based building performance simulation and optimization, writes an improved genetic algorithm NSGA-II for multi-objective optimization in the environment of Dynamo visual programming and completes the optimization process through the coupling of Revit and Dynamo. In detail, the methodological framework consists of four main phases as follows.
  • Integrate building material, location and other parameter information through adaptive components to re-implement parameter-driven BIM modeling and reflect the changes of various parameters inside the building in real time.
  • Determine the decision variables in the optimization process, including building orientation, window-to-wall ratio, window height, glass material, wall material and other parameters, and combine climate, geography and building function information to determine the variation range of various decision variables.
  • Propose a multi-objective optimization strategy for building performance based on NSGA-II algorithm, including six steps, such as BIM model establishment, building performance simulation, multi-objective optimization, and Pareto front analysis (Figure 3).
  • The two-objective Pareto optimization of building energy consumption and lighting performance is carried out through a project case and a non-dominated solution to balance building energy consumption and lighting performance is obtained.
The Pareto front obtained from the optimization shows that the simulation results of building energy consumption and lighting performance show a negative correlation driven by multiple parameters. Considering the influence of climate, temperature and humidity at the simulation location, the obtained dominated solutions may produce a maximum difference of about 25.7% in the building energy consumption index and a maximum difference of about 16.7% in the lighting performance index. Therefore, it is clear that building performance simulation analysis through parametric design is very important and critical in determining the performance of low carbon energy efficient buildings. As suggested by Heiselberg et al. and Mechri et al. [31,32] to determine the important parameters related to building performance in the early stage of building design the low carbon building design methodology proposed in this paper can achieve low carbon energy efficiency, while meeting the functional requirements of the building by selecting appropriate building design parameters to enhance the energy performance of the building itself. As Rapone et al. [33] pointed out, optimization algorithms have proven to be quite effective in single-objective optimization of building design; the methodology proposed in the paper provides diverse solutions for optimization algorithms to address multi-objective optimization of building performance while considering performance metrics, which is beneficial to the decision-making process.
The research methodology in the paper provides a new interactive research case that implements an application programming interface for a visual programming environment. The framework provides a BIM-based visual interface for building professionals with no experience in parametric modeling and computer programming, which helps to improve the interoperability of existing low-carbon building designs, enables building performance analysis and guides the design of energy and carbon reduction optimizations. However, the Pareto front obtained through optimization does not eliminate the subjectivity and creativity of building design and policy makers can propose reasonable revisions to policy regulations taking into account climate, geography and other factors, thus helping to maintain the integrity of low-carbon and energy-efficient building design practices. Finally, each non-dominated solution obtained by optimization contains building parameters such as materials and window-to-wall ratios, which can be combined with material costs, construction difficulties, environmental impacts and other factors to provide references for the formulation of practical energy-saving and emission reduction policies.

Author Contributions

Conceptualization, L.Z.; Data curation, L.Z.; Funding acquisition, L.Z.; Investigation, L.Z.; Methodology, W.Z.; Project administration, W.Z.; Resources, W.Z.; Software, W.Z.; Supervision, W.Z.; Validation, W.Z.; Visualization, W.Z.; Writing—original draft, W.W.; Writing—review & editing, W.W. All authors have read and agreed to the published version of the manuscript.

Funding

This research was funded by [The Key University Science Research Project of Jiangsu Province] grant number [21KJA560003], [The Natural Science Foundation of the Jiangsu Higher Education Institutions of China] grant number [22KJB560014], [Jiangsu Province “Qing Lan” Academic Leader Project] grant number [2020-0519], [Jiangsu Province “Qing Lan” Academic Leader Project] grant number [2020-0519], [Jiangsu Collaborative Innovation Center for Building Energy Saving and Construct Technology Project] grant number [SJXTBS2125, SJXTZD2103].

Institutional Review Board Statement

Not applicable.

Informed Consent Statement

Not applicable.

Data Availability Statement

The datasets used and/or analyzed during the current study are available from the corresponding author on reasonable request.

Acknowledgments

The authors acknowledge the Key University Science Research Project of Jiangsu Province (Grant: 21KJA560003), The Natural Science Foundation of the Jiangsu Higher Education Institutions of China (Grant No. 22KJB560014), Jiangsu Province “Qing Lan” Academic Leader Project (Grant No. 2020-0519), Jiangsu Collaborative Innovation Center for Building Energy Saving and Construct Technology Project (Grant: SJXTBS2125, SJXTZD2103).

Conflicts of Interest

The author(s) declared no potential conflict of interest with respect to the research, author-ship, and/or publication of this article.

References

  1. Xu, C.; Yang, J.; He, L.; Wei, W.; Lin, A. Carbon capture and storage as a strategic reserve against China’s CO2 emissions. Environ. Dev. 2020, 37, 100608. [Google Scholar] [CrossRef]
  2. Zhang, C.; Su, B.; Zhou, K.; Yang, S. Decomposition analysis of China’s CO2 emissions (2000–2016) and scenario analysis of its carbon intensity targets in 2020 and 2030. Sci. Total Environ. 2019, 668, 432–442. [Google Scholar] [CrossRef] [PubMed]
  3. Sz, A.; Mm, B.; Kai, L.C.; Zm, A.; Wei, F.D.; Wc, A. Historical carbon abatement in the commercial building operation: China versus the US. Energy Econ. 2021, 105, 105712. [Google Scholar]
  4. Li, K.; Ma, M.; Xiang, X.; Feng, W.; Ma, Z.; Cai, W.; Ma, X. Carbon reduction in commercial building operations: A provincial retrospection in China. Appl. Energy 2022, 306, 118098. [Google Scholar] [CrossRef]
  5. Chen, M.; Ma, M.; Lin, Y.; Ma, Z.; Li, K. Carbon kuznets curve in China’s building operations: Retrospective and prospective trajectories. Sci. Total Environ. 2022, 803, 150104. [Google Scholar] [CrossRef] [PubMed]
  6. Ioakimidis, C.S. Use of ai algorithms in different building typologies for energy efficiency towards smart buildings. Buildings 2021, 11, 613. [Google Scholar]
  7. Liu, C. Digital simulation for buildings’ outdoor thermal comfort in urban neighborhoods. Buildings 2021, 11, 541. [Google Scholar]
  8. Chen, H.; Hou, L.; Zhang, G.K.; Moon, S. Development of BIM, IoT and AR/VR technologies for fire safety and upskilling. Autom. Constr. 2021, 125, 103631. [Google Scholar] [CrossRef]
  9. Koutamanis, A. Dimensionality in BIM: Why BIM cannot have more than four dimensions? Autom. Constr. 2020, 114, 103153. [Google Scholar] [CrossRef]
  10. Kf, A.; Rp, A.; Awah, B.; Ah, A. Sustainable material choice for construction projects: A life cycle sustainability assessment framework based on BIM and fuzzy-AHP. Build. Environ. 2021, 196, 107805. [Google Scholar]
  11. Liu, J.; Li, S.; Xu, C.; Wu, Z.; Ao, N.; Chen, Y.F. Automatic and optimal rebar layout in reinforced concrete structure by decomposed optimization algorithms. Autom. Constr. 2021, 126, 103655. [Google Scholar] [CrossRef]
  12. Pang, Z.; O’Neill, Z.; Li, Y.; Niu, F. The role of sensitivity analysis in the building performance analysis: A critical review. Energy Build. 2020, 209, 109659. [Google Scholar] [CrossRef]
  13. Jeong, W.; Wei, Y.; Chang, J.L. Thermal performance visualization using objectoriented physical and building information modeling. Appl. Sci. 2020, 10, 5888. [Google Scholar] [CrossRef]
  14. Zand, M.; Nasab, M.A.; Padmanaban, S.; Khoobani, M. Big data for SMART Sensor and intelligent Electronic devices–Building application. In Smart Buildings Digitalization; CRC Press: Boca Raton, FL, USA, 2022; pp. 11–28. [Google Scholar]
  15. Zhang, J.; Liu, N.; Wang, S. Generative design and performance optimization of residential buildings based on parametric algorithm. Energy Build. 2021, 244, 111033. [Google Scholar] [CrossRef]
  16. Nili, M.; Seyedhosseini, S.M.; Jabalameli, M.S.; Dehghani, E. A multi-objective optimization model to sustainable closed-loop solar photovoltaic supply chain network design: A case study in Iran. Renew. Sustain. Energy Rev. 2021, 150, 111428. [Google Scholar] [CrossRef]
  17. Kohlhepp, P.; Harb, H.; Wolisz, H.; Waczowicz, S.; Hagenmeyer, V. Large-scale grid integration of residential thermal energy storages as demand-side flexibility resource: A review of international field studies. Renew. Sustain. Energy Rev. 2019, 101, 527–547. [Google Scholar] [CrossRef]
  18. Tang, S.; Shelden, D.R.; Eastman, C.M.; Pishdad-Bozorgi, P.; Gao, X. A review of building information modeling (BIM) and the internet of things (IoT) devices integration: Present status and future trends. Autom. Constr. 2019, 101, 127–139. [Google Scholar] [CrossRef]
  19. Wang, C.; Yu, Q.; Law, K.H.; Mckenna, F.; Elhaddad, W. Machine learning-based regional scale intelligent modeling of building information for natural hazard risk management. Autom. Constr. 2021, 122, 103474. [Google Scholar] [CrossRef]
  20. Li, M.; Yu, H.; Liu, P. An automated safety risk recognition mechanism for underground construction at the pre-construction stage based on BIM. Autom. Constr. 2018, 91, 284–292. [Google Scholar] [CrossRef]
  21. Torres-Quezada, J.; Coch, H.; Isalgué, A. Assessment of the reflectivity and emissivity impact on light metal roofs thermal behaviour, in warm and humid climate. Energy Build. 2019, 188, 200–208. [Google Scholar] [CrossRef]
  22. Ohueri, C.C.; Enegbuma, W.I.; Kuok, K.K.; Wong, N.M.; Ng, L.T.; Kenley, R. Preliminary Evaluation of Synergizing BIM and Malaysian Carbon Reduction and Environmental Sustainability Tool. In Proceedings of the International Conference on Sustainability in Energy and Buildings, Gold Coast, Australia, 24–26 June 2018; Springer: Cham, Switzerland, 2018. [Google Scholar]
  23. Chen, B.; Liu, Q.; Chen, H.; Wang, L.; Wu, X. Multiobjective optimization of building energy consumption based on BIM-DB and LSSVM-NSGA-II. J. Clean. Prod. 2021, 294, 126153. [Google Scholar] [CrossRef]
  24. Wei, Y.; Akinci, B. A vision and learning-based indoor localization and semantic mapping framework for facility operations and management. Autom. Constr. 2019, 107, 102915.1–102915.14. [Google Scholar] [CrossRef]
  25. Asl, M.R.; Zarrinmehr, S.; Bergin, M.; Yan, W. BPOpt: A framework for BIM-based performance optimization. Energy Build. 2015, 108, 401–412. [Google Scholar]
  26. Ghaderian, M.; Veysi, F. Multi-objective optimization of energy efficiency and thermal comfort in an existing office building using nsga-ii with fitness approximation: A case study. J. Build. Eng. 2021, 41, 102440. [Google Scholar] [CrossRef]
  27. Yao, J. Identifying occupants’ appropriate seating position and view direction in office buildings: A stochastic shade control based multi- objective visual comfort optimization. J. Green Build. 2020, 15, 15–36. [Google Scholar] [CrossRef]
  28. Lin, B.; Chen, H.; Liu, Y.; He, Q.; Li, Z. A preference-based multi-objective building performance optimization method for early design stage. Build. Simul. 2021, 14, 477–494. [Google Scholar] [CrossRef]
  29. Kirimtat, A.; Krejcar, O.; Tasgetiren, M.F.; Herrera-Viedma, E. Multi-performance based computational model for the cuboid open traveling salesman problem in a smart floating city. Build. Environ. 2021, 196, 107721. [Google Scholar] [CrossRef]
  30. Shkundalov, D.; Vilutien, T. Bibliometric analysis of building information modeling, geographic information systems and web environment integration. Autom. Constr. 2021, 128, 103757. [Google Scholar] [CrossRef]
  31. Heiselberg, P.; Brohus, H.; Hesselholt, A.; Rasmussen, H.; Seinre, E.; Thomas, S. Application of sensitivity analysis in design of sustainable buildings. Renew. Energy 2009, 34, 2030–2036. [Google Scholar] [CrossRef] [Green Version]
  32. Mechri, H.E.; Capozzoli, A.; Corrado, V. USE of the ANOVA approach for sensitive building energy design. Appl. Energy 2010, 87, 3073–3083. [Google Scholar] [CrossRef]
  33. Rapone, G.; Saro, O. Optimisation of curtain wall façades for office buildings by means of PSO algorithm. Energy Build. 2012, 45, 189–196. [Google Scholar] [CrossRef]
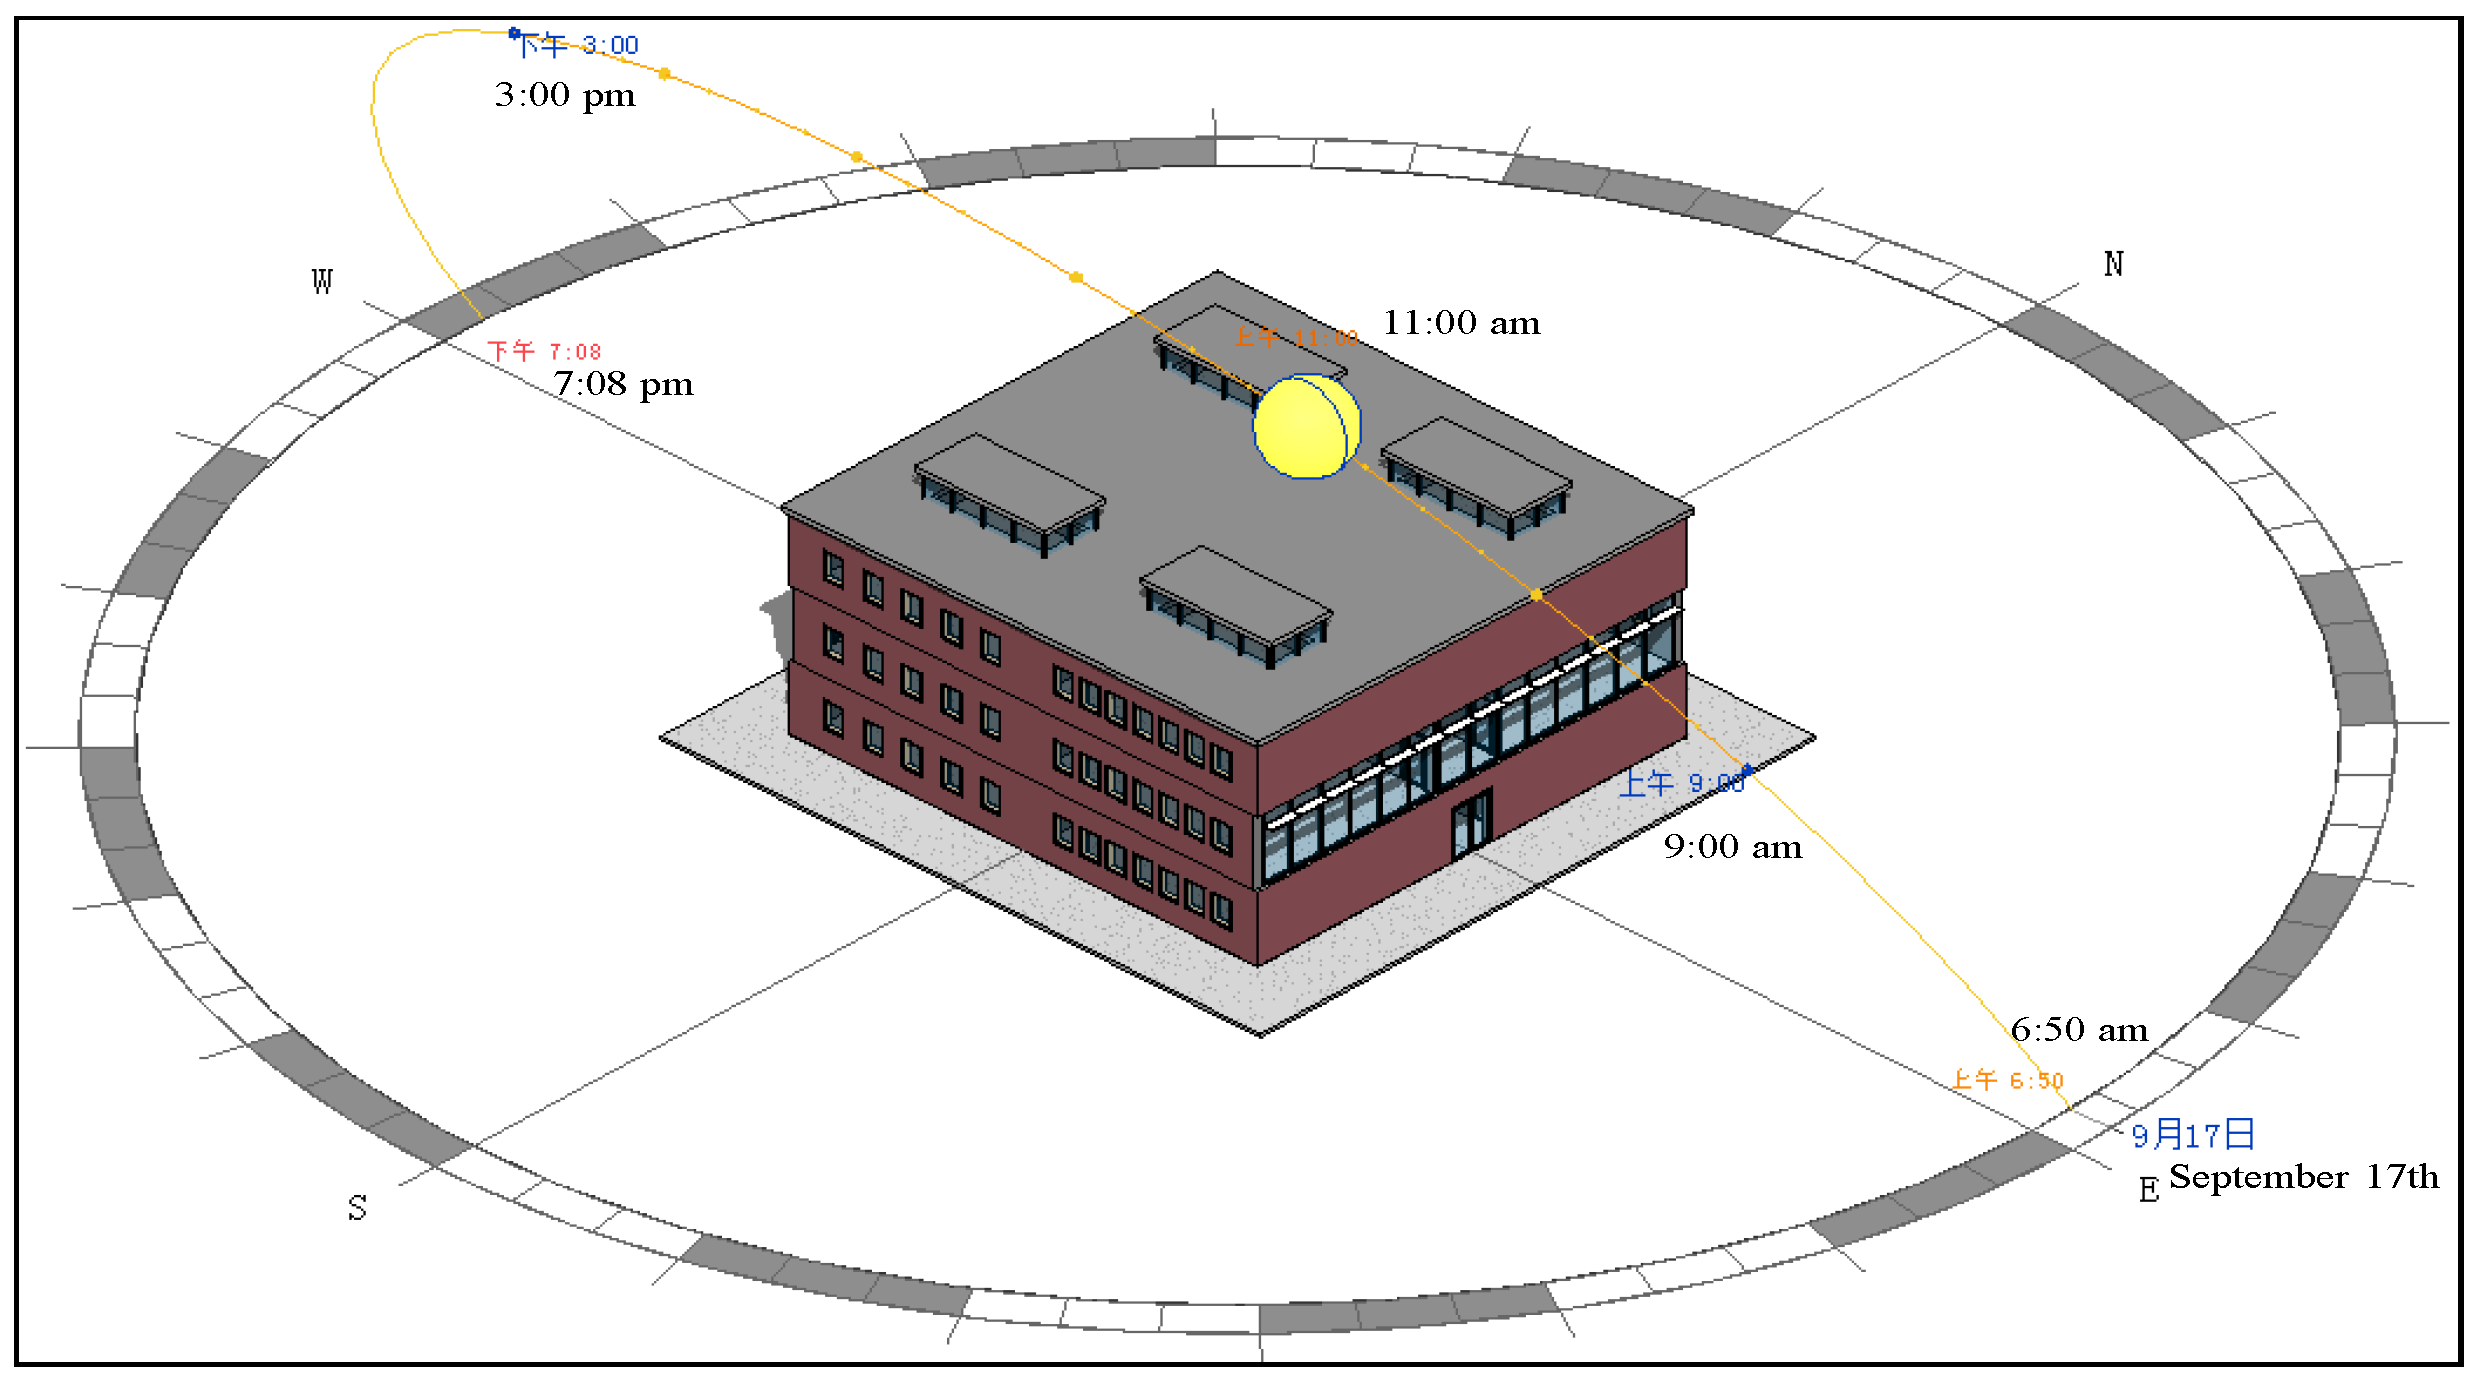
Figure 1. BIM analysis model.
Sustainability 14 13064 g001
Figure 2. Parametric design for curtain wall adaptive components.
Sustainability 14 13064 g002
Figure 3. Building performance optimization process based on NSGA-II algorithm.
Sustainability 14 13064 g003
Figure 4. Energy and daylighting optimization through Dynamo.
Sustainability 14 13064 g004
Figure 5. Multi-objective optimization process by Optimo.
Sustainability 14 13064 g005
Figure 6. Multi-objective optimization results.
Sustainability 14 13064 g006
Table 1. The findings from recent works.
Research ObjectResearch ContentsResearch Literatures
Multidisciplinary parametric driving technologyTransform simulation process into proxy modelZhang et al., 2021 [15], Wang et al., 2021 [19]
Optimization algorithmsUsing evolutionary algorithm and genetic algorithmNili et al., 2018 [16], Kohlhepp et al., 2018 [17]
Parallelization high-performance ComputingCloud computing, computer clustersTang et al., 2019 [18], Li et al., 2018 [20]
Table 2. Parameters setting of daylighting analysis model.
ParameterValue
PlaceJiangsu
Time9:00 AM; 15:00 PM
Storey number3
OrientationSouth
Storey height3 m
Floor area1298.692 m2
External wall area568.009 m2
Lighting power9.689 w/m2
length21.3 m
breadth20.3 m
People52
External window ratio0.5
Table 3. Parameter relationships and meanings of adaptive components.
Parameter NameRelationship between Parameters or Parameter ValuesParameter Meaning
f_sizeCustom valueFrame width
f_size_zf_size × f_size_mFrame height
gapCustom valueOffset of curtain wall
s_up0.5 + s_distTop height of curtain wall
s_down0.5 − s_distBottom height of curtain wall
s_dist0.4Glass size parameters
f_size_mCustom valueFrame aspect ratio
Table 4. Variable design and value range of multi-objective optimization model.
Variable NameUnitValue RangeVariable NameUnitValue Range
OrientationDegree−30–30North window wall ratio-0.10–0.65
Number of storeysstorey1–4East window wall ratio-0.10–0.65
Window heightMeter1.5–2.8West window wall ratio-0.00–0.50
Floor aream2Set standard value before optimizationVisible light transmittance of window-0.3–0.86
South window wall ratio-0.10–0.65
Table 5. Properties of glass and wall material variables.
Parameter TypeIndexMaterial NameHeat Transfer Coefficient (W/(m2 K))Visible Light Transmittance
Glass material0Single Glazing Clear6.170.88
1Double Glazing Clear2.740.78
2Double Glazing Clear Low-E1.990.74
3Triple Glazing Clear Low-E1.550.66
4Translucent Wall Panel3.010.25
5Triple pane clear low-e1.260.64
6Double pane reflective low-e1.780.12
7Single Low-E4.340.82
Wall material0Structural Insulated Panels (SIP)0.15
1Insulated Concrete Form (ICF)0.19
2R13 Metal Frame0.88
3R13 Wood Frame0.46
4Structural Insulated Panels0.32
5R2 CMU Wall1.21
6R0 Wood Frame1.56
Publisher’s Note: MDPI stays neutral with regard to jurisdictional claims in published maps and institutional affiliations.