Article

Implementing Design and Operational Measures for Sustainable Mobility: Lessons from Zurich

1
Division of Engineering, New York University Abu Dhabi, Abu Dhabi 129188, United Arab Emirates
2
Institute for Transport Planning and Systems, ETH Zurich, 8092 Zurich, Switzerland
*
Author to whom correspondence should be addressed.
Sustainability 2022, 14(2), 625; https://doi.org/10.3390/su14020625
Submission received: 16 September 2021 / Revised: 13 December 2021 / Accepted: 15 December 2021 / Published: 6 January 2022

Abstract

:
Increasing mobility and urbanization is important for economic prosperity but leads to higher urban traffic congestion, which is associated with many negative externalities. Therefore, cities are in need of integrative solutions that reduce their transportation network’s spatial and environmental footprint, while maintaining the highest transportation efficiency possible. Focusing on a nontraditional and more sustainable cycle of urban transportation, this paper covers an integrated perspective by describing a combination of individual design and operational measures. To do so, a case study of the city of Zurich is presented, which consistently ranks highly across different indicators, from smart city to sustainability. This paper is therefore a qualitative review of different measures that the city has implemented to become more sustainable. The measures are compared with indicators from the existing literature and classify them into three clusters: (i) measures discouraging private motorized transport, (ii) measures encouraging public transport, and (iii) measures encouraging human-powered mobility. The discussion thereof allows us to integrate the different measures to define a sustainable transportation cycle, which potentially serves as a best-practice example.

1. Introduction

Nowadays, an increasing number of cities around the world are showing interest in sustainable and smart development practices. Transportation, as one of the primary sources of emissions, is particularly important. Therefore, cities are in need of integrative solutions that reduce their transportation network’s ecological and spatial footprint, while maintaining the highest transportation efficiency possible.
The issues surrounding sustainable transportation can be broadly grouped into three overlapping categories: economic, environmental, and social [1]. Traffic congestion, for example, has effects in all categories: it creates financial losses and induces higher air pollution, and those impacts are unequally burdened. Within these issues, car traffic and its allocated space is at the center of the discussion [1].
There exists a multitude of definitions of sustainable transport. Here, we follow the definition by Litman and Burwell in their seminal paper [1]: “Sustainability tends to support transportation planning and market reforms that result in more diverse and economically efficient transportation systems, and more compact land use patterns that reduce automobile dependency. These reforms help increase economic efficiency, reduce resource consumption and harmful environmental impacts, and improve mobility for non-drivers”.
For over 50 years, car traffic has increased around the world. The combination of mature and new technologies, lower prices, an increasing population, and more demanding mobility patterns have all contributed to a rapid growth of the motorization rate. Currently, road traffic accounts for 83% of pax-km in the European Union, with little variation across countries (standard deviation of 4.4%-points) [2]. Higher levels of motorization lead, obviously, to more traffic congestion. This, in turn, has many negative externalities, including but not limited to: higher consumption of energy and other resources, more pollution and health-related issues, more noise, less traffic safety, urban fragmentation, and other changes to the urban landscape with large proportions of it devoted to private cars, as well as more urban sprawl leading to the segregation of activities, long commutes, and ultimately isolation. Nowadays, according to the International Energy Agency, transport is responsible for almost a quarter of the CO2 emissions worldwide [3] significantly influencing the global climate [4]. These problems can be further exacerbated in urban areas, which concentrate a large portion of the trips. More importantly, urban space is valuable but limited. It is also shared with other users and activities beyond those related to mobility. Even within the mobility sector, different transportation modes normally compete for the road space, thus increases in capacity for one mode typically come at the expense of another.
To address these challenges, this paper advocates for a nontraditional, more sustainable approach to urban transportation. Figure 1 illustrates the traditional, unsustainable cycle (on the left) and our proposed sustainable cycle for urban transportation (on the right). Many of the existing design and operational measures aim at improving the efficiency of the urban traffic network mostly for cars, e.g., [5]. Here, the efficiency concept is referred to as often described in the multimodal transportation literature [5,6,7,8,9,10,11]. Given that the objective of transportation systems is to move the largest number of people (not vehicles) possible in a given amount of time; this study categorizes as efficient the systems that do so while also minimizing the negative externalities such movement imposes on society (including the environmental and the spatial footprint). This paper, however, does not quantify the efficiency values but refers to the concept in qualitative terms.
Without the proper measures, any increases in car efficiency soon vaporize as such efficiencies attracts new trips that sooner or later lead to the same levels of congestion. This process is known as induced traffic demand [12,13,14] and is the result of a vicious cycle which in turn leads to even more traffic-related problems. The goal of having a more efficient traffic system, however, could be used instead to simultaneously improve the performance of other modes. This paper proposes to reclaim those gains in efficiency in the form of space for other more sustainable transport modes, thus increasing their appeal and hopefully luring people to switch modes. In other words, a sustainable transportation cycle should aim at offering more space for other, more sustainable modes, encouraging mode switching and reducing the traffic-related problems in the long-term. At worst, this cycle would maintain the same number of cars while still increasing the usage of the more sustainable transportation modes, due to the induced demand replacing the mode switchers.
Although a substantial amount of research exists on the scientific foundation as well as the strategies to encourage sustainable urban transportation, limited information can be found on the implementation of integrated measures that combine such strategies, especially those aiming to curb the dependencies on the private cars with those that promote the use of alternative modes [1,15,16,17,18]. The goal of this paper is to review qualitatively the combination of measures that a city can implement to become more sustainable. To this end, multiple lessons learned from the city of Zurich, Switzerland, are presented, which consistently ranks high in holistic comparison metrics (see Table 1). Subsequently, it is show that the city of Zurich follows implicitly the sustainable transportation cycle given in Figure 1.
In the IMD’s smart city index, Zurich ranks second behind Singapore [23]. Similarly, in the Arcadis’ sustainable cities mobility index, Zurich ranks second behind Hong Kong [19]. In Mercer’s quality of living ranking, Zurich consistently ranks second, behind Vienna [21]. Mobile data analyzers Here and Omio both rank Zurich first, in the core transportation categories: public transport, transport efficiency, and traffic flow [20,22]. In addition to these high rankings, Zurich has been the focus of scientific reviews and papers numerous times. From a traffic perspective, the city of Zurich has gained attention for its innovative approaches, e.g., [5,24,25]. From a public transport view, there are numerous studies that highlight the excellent level of service, the integrated network, the very high public transport priority, as well as the reliable and simple time table structure, e.g., [26,27,28,29,30,31].
Looking at greenhouse gas emissions, it becomes evident that Zurich serves well as a model: Greenhouse gas emissions in the area of mobility fell in the city of Zurich between 1990 and 2020—in contrast to Switzerland as a whole, where an increase continues to be recorded. Transport accounts for around 40 percent of total greenhouse gas emissions in the city of Zurich [32]. Figure 2 shows the decrease in transportation-related GHG per person in the city over time. This is evidence of the positive impact on the climate-related sustainability of the implemented operational and design measures implemented by the city of Zurich.
In addition, given that Switzerland’s federal government aims to double the use of public transport by 2050 [33], the city’s efficient public transportation system has been the focus of several studies [30,34,35]. We acknowledge there are large differences across cities, countries, and even continents. However, many of the challenges faced by cities worldwide are the same. Hence, there is value in sharing the approaches used in some places in order to achieve a more sustainable transport system overall. We believe that Zurich’s transportation design and operational measures offer best-practices which might be useful for other cities, especially in Europe, but also around the globe. Here, we not only present a theoretical discussion on how a sustainable transportation cycle should look but also a pragmatic description of how it has been implemented in real life.
This paper assesses the transportation system holistically. On one hand, it describes specific measures to discourage the use of private cars including strict parking, speed and traffic calming policies, and perimeter control. On the other hand, this study focuses on specific measures to encourage the use of public transport and human-powered mobility, including transit signal priority and the use of additional signals, dedicated bus lanes and curbside bus stops, as well as specific strategies to promote walking, cycling, and different forms of shared micromobility. With few exceptions, this paper focuses on the measures introduced in the last two decades.
The remainder of the paper is organized as follows: Section 2 presents the private motorized transport discouraging measures. Section 3 presents the public transport encouraging measures. Section 4 presents the human-powered mobility encouraging measures. Section 5 discusses and evaluates the integrated perspective. Section 6 offers some concluding remarks.

2. Design and Operational Measures Discouraging Private Motorized Transport

Although private cars make up 30% of the modal share (almost 50% of all motorized trips) in the city of Zurich, they are not considered a priority when it comes to improvements to the system. The underlying idea is that by limiting (or even completely avoiding) the expansion of the car traffic network, limiting parking, and implementing other car restricting policies, private car users shift with time to other more sustainable and potentially attractive transport modes (specifically public transport, walking, and cycling) [36]. Nevertheless, in Zurich, limiting the expansion of the car traffic network does not imply discontinuing measures to improve the network’s efficiency. Quite on the contrary, the city has found innovative ways (discussed in this section) to improve the car network’s efficiency. The gains from these efficiency improvements are reallocated to more sustainable transport modes—as in Figure 1. Figure 3 shows the increase in the city’s population and the decrease in the usage of private cars as a means of transport in the area over time. The city has a street network approximately 780 km long, and a motorization rate of 281 cars per 1000 inhabitants, distributed across 55% of the households [37].
Despite its relatively small size, the low number of inhabitants, and the quality of its public transport system, the city of Zurich does face some congestion, although it has been improving over time. The utilization ratio of the Zurich traffic network during peak times reaches 98% [39]. In a 2020 survey conducted by the navigation system maker TomTom, Zurich was named the 46th most congested city in Europe [40], a significant improvement over 2012, when it was ranked the 16th most congested city in Europe [41]. Almost 30% of the daytime traffic in the city faced speeds over 70% lower than those observed at night [42]. Those statistics became more controversial as representatives from the city stated that slowing private cars was one of its goals, in order to “reconquer public space for pedestrians, not to make it easy for drivers” [43].
Although it is impossible to completely disentangle national policies from city-wide policies, a national comparison shows a clear trend for Zurich. For example, the second-largest city in Switzerland, Geneva, has seen an opposite trend over the last 10 years, with an increasing car usage as well as a slight increase in congestion according to the Tomtom Index [40]. In fact, even though considerably smaller with 200,000 inhabitants, Geneva is currently ranked more congested than Zurich. Other cities in Switzerland are of smaller size and thus have a substantially smaller catchment area; so a direct comparison is not meaningful.
The city of Zurich has worked hard, especially during the last years, developing measures to manage traffic better and use the available space in a more optimal manner. As part of this effort, a good amount of technology has been deployed. The city, for instance, currently has almost 4000 loop detectors plus a high number of speed cameras (of which 100 are permanent cameras), 400 traffic control signals, 110 variable traffic signs, 15 traffic information displays, 8 traffic computers, and one traffic control center [39].
Here, the following list of measures is specifically implemented to discourage private motorized transport:
  • Parking policies: limit and reduce parking spaces, high parking fee, and maximum 2 h parking;
  • Speed and traffic calming policies: 30 km/h on more than 50% of roads, high density of speed cameras, and on-street parking on alternating road sides;
  • Perimeter control, the Zurich model, and ZuriTraffic: congestion reduced in the inner city.

2.1. Parking Policies

Parking, although not always used that way, is a very powerful traffic management tool [44,45]. By actively controlling the general availability of parking (i.e., parking supply), the maximum possible parking duration, and/or the parking price, travel demand could be indeed modified [46]. Recall that every trip typically begins and ends in a parking space. As a matter of fact, parking pricing could be considered as a less controversial alternative to road pricing [47], as it typically receives less opposition, while still contributing to regulate traffic and induce changes to the demand. These ideas are definitely exploited in the city of Zurich [48].
The city introduced the first parking meters in the 1960s, with an initial focus on commercial streets with a high turnover rate. Initial deployments show that making parking decisions at the link level was not ideal, as it rapidly led to spillbacks to other streets. Since then, parking plans have been made at the neighborhood level [49].
The city has a total of around 265,000 parking spaces, of which only 50,000 are public property [37]. These are divided among blue (mostly nonpaid) parking zones and white (paid) parking zones (mostly on-street). Blue zones are for both short-term and long-term parking for local residents. White zones are for visitors and customers, mostly in the city center and other commercial areas. Additionally, there are roughly 18,000 private parking spaces that are accessible to the public. They are mostly on parking garages [37].
The city strictly controls the number of public parking places. As a matter of fact, in 1996, the city council implemented a policy known as a “historic parking compromise” within the city center, to keep the number of public parking spaces at the level from 1990. This means that when a new parking garage is built, on-street parking must be removed in order to keep the net number of additional parking spaces at zero. The construction of parking garages has allowed then for the conversion of old on-street parking spaces into new public plazas, shared spaces, and other on-street improvements [50] (see Figure 4a,b).
Unfortunately, the number of private parking spaces available to the public is not so strictly regulated yet and has been increasing dramatically during the last decade. Pricing, however, tends to be relatively high, keeping some degree of disincentive to use private cars [51]. In fact, according to the global parking index, Zurich has the second-highest long-term parking fee in Europe after London [52]. This shows a long-term policy intention to discourage the use of private cars by reducing cheap parking opportunities. Auto-ownership decreased by 17% in the city of Zurich from 2000–2017 (even though the population grew by roughly 15%) [30].
The city of Zurich has more restrictions than the canton (i.e., larger region) on the private parking required by new construction. Access to nearby public transport, air quality issues, and capacity of nearby roads can further reduce the minimum and maximum number of parking spaces required for new buildings. It is even possible to create parking free housing, if alternative mobility solutions (e.g., car sharing) are provided [25,26]. Figure 5 shows the number of publicly available parking spaces in the city over the last two decades.
In addition, and in order to reduce the searching for parking phenomenon, the city has deployed a guidance system for parking garages and parking lots. It has 60 static and 250 dynamic displays, as well as an online platform, intended to provide real-time information on parking availability [37,53].
The city of Zurich now plans to modify the fee structure for parking spaces in the white zone (i.e., mostly raise prices), increase the hours during which parking spaces must be paid for, and reduce the maximum parking duration to two hours in order to discourage commuters from using their cars. In addition, it plans as well to reduce the number of blue zone parking spaces to offset the addition of private parking spaces. Such measures are intended to reduce car usage and free up some additional street space for other uses [37].

2.2. Speed and Traffic Calming Policies

Mostly driven by the need to reduce noise, increase the quality of life for residents, and increase safety, Zurich has been implementing low-speed areas since the early 1990s. A federal program to implement “Tempo 30” zones was established in Zurich in 1991. Its main objective was to make streets more livable by reducing traffic speeds. Nowadays, over 50% of the streets in Zurich have a speed limit of 30 km/h. An important factor is the rigid enforcement of the speed limits, thanks to a very dense system of speed cameras and high fines for speeding.
In addition, most residential streets exhibit some kind of traffic calming mechanism: speed humps, on-street parking spaces with 2–5 cars on each cluster alternating the street side, chokers, and other road restrictions, etc. Figure 6a,b shows some of the most commonly used traffic-calming measures. In general, these measures have been shown to create safer residential areas, lower noise levels, and provide more appealing public spaces [26,54,55,56,57]. Therefore such measures reduce negative traffic externalities, which are unsustainable from an economic and social point of view, e.g., [54,55,56]. Moreover, reducing speeds in the network increases the relative attractiveness of traditionally slower, yet more sustainable, modes. In addition, speed restrictions ensure that potential induced demand is limited [14]. Therefore, such measures reduce or limit the attractiveness of car usage in a direct way.

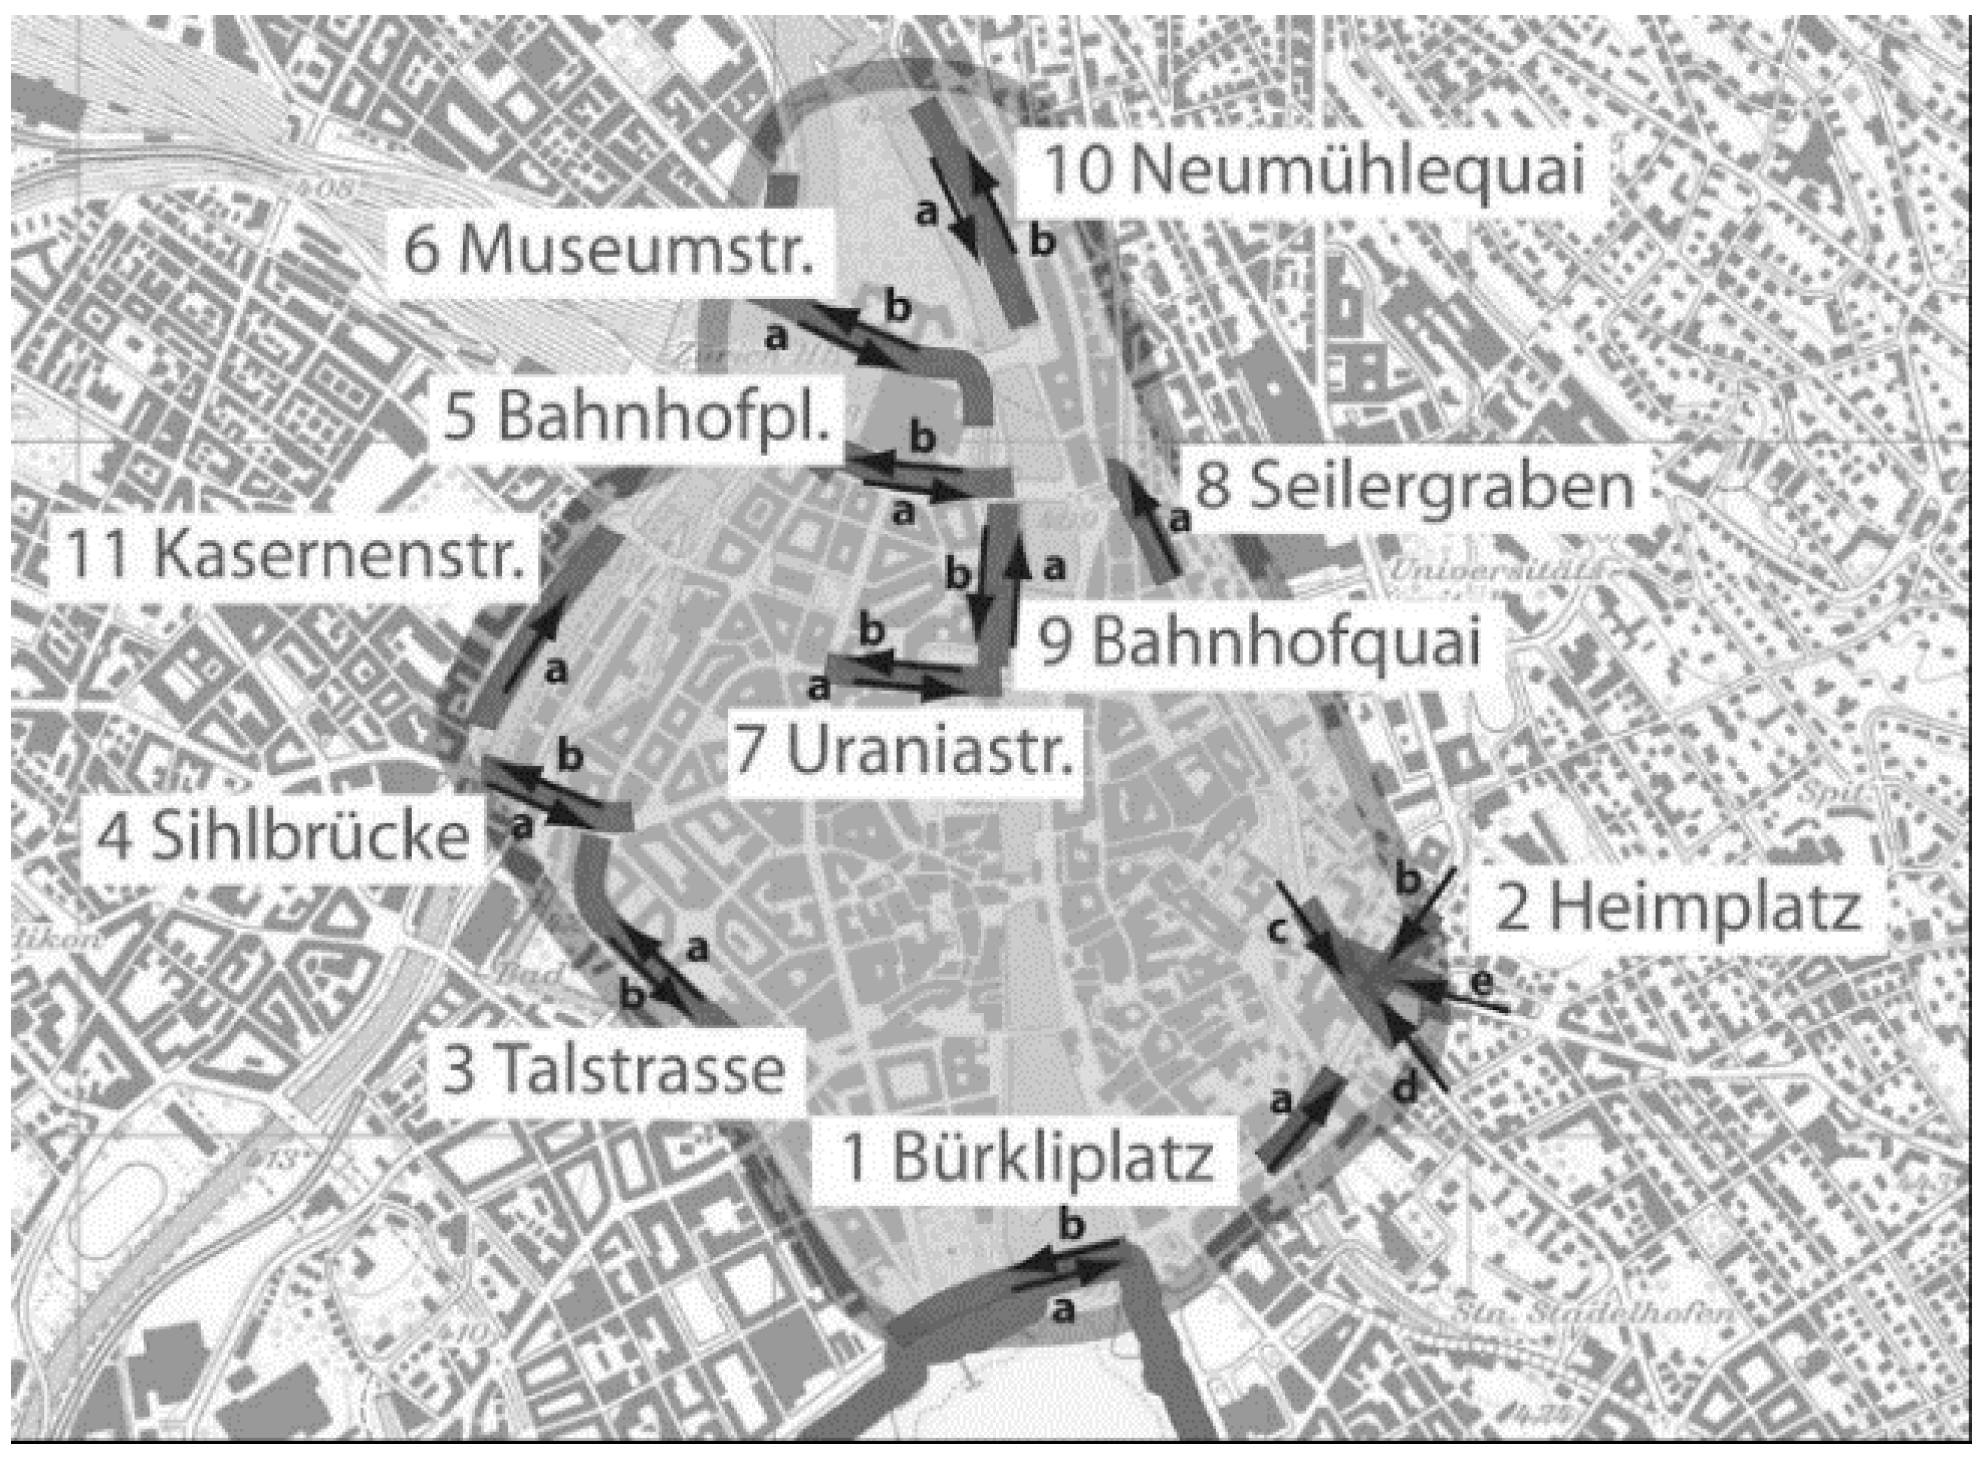
2.3. Perimeter Control, the Zurich Model, and ZuriTraffic

The automatic traffic control in Zurich consists of a connected system of traffic signals that can act individually or in coordination, responding to some network-wide objectives. In the outer regions of the city, the signals are connected to build a green wave and therefore reduce congestion spillovers [39]. For the inner city, however, Zurich went one step further. The city implemented an innovative perimeter control that tries to manage congestion levels below a certain threshold [5,39,42,58].
In general, the overall traffic management is carried out mostly considering three area levels. The observation perimeter outlines the largest area, covering beyond the perimeter of the city. Its goal is to provide enough information in order to estimate the future amount of traffic within the city some time in advance. It uses monitoring devices from either the Canton of Zurich (i.e., region including the city of Zurich) or the Swiss Federal Roads Office. The action area is slightly smaller, covering mostly the city of Zurich itself. In this area, traffic is monitored using sensors from the city, and this is where the traffic management measures are implemented. Lastly, the influence perimeter outlines the smallest of the three areas. This is where most of the impact of the traffic management measures is observed [39,42].
Using this division, in 2007, the city of Zurich implemented an adaptive gating system for controlling traffic accessing the inner city. The system, often referred to as the Zurich model, is a macroscopic operational scheme aimed at reducing congestion in the central area by managing the inflow in the city perimeter and giving priority to outgoing traffic. It is based on a demand model elaborated in 2007 [59], which estimates how traffic accessing the city distributes itself across the different inner roads. The Zurich model continuously monitors several of those inner roads in order to detect changes (specifically reductions) in their level of service (see Figure 7). Once such reductions are detected, traffic lights on the city access roads generating the traffic for those inner streets are adjusted automatically. Normally, this translates into extended red lights coming into the city during the morning rush to meter the number of incoming cars and extended green lights leaving the city during the afternoon rush to allow more cars to leave. The system, although it has some drawbacks [60], is rather innovative [61], being one of the first perimeter control systems implemented in the world with this level of technology and responsiveness to real-time traffic conditions. More details can be found in [61]. Note that the perimeter control also improves conditions for public transport that uses shared road space. In addition, the perimeter control limits the access into the protected zone, effectively reducing traffic, and the resulting congestion. Lastly, the additional waiting time at the boundaries of the perimeter potentially discourages car drivers from traveling into the city by car.
Notice that information for the Zurich model is also used in ZuriTraffic, an online platform with a visualization tool that shows the real-time traffic situation within city limits (https://verkehrslage.stadt-zuerich.ch/, accessed on 15 September 2021). This visualization tool can be used by drivers to change travel plans based on traffic conditions.

3. Design and Operational Measures Encouraging Public Transport

The previously discussed measures limiting and optimizing the car network aim to prevent the induced car mobility demand from vaporizing the improvements. At the same time, the generated gains from these efficiency improvements are reallocated to the public transport system of the city. Here, the following list of measures is specifically implemented to improve public transportation:
  • Transit signal priority: full priority for public transport;
  • Dedicated public transport lanes: 20% lanes for buses, bidirectional bus lanes;
  • Additional signals: presignals;
  • Bus and tram stops: curb-side stops.
The public transport system in the city of Zurich is operated by a municipal corporation with high level of independency, the Verkehrsbetriebe Zürich (VBZ). The organization was founded in 1896 (under a different name) when it bought its first publicly operated tram system. In addition, there is a regional authority that plans and coordinates all public transport services, the Zürcher Verkehrsverbund (ZVV). This is important, as today, the whole transport system in the country, including the Swiss Federal Railways (SBB), works, from the user perspective, seemingly as a single entity (e.g., single tickets can be used for multiple transport modes or regions, transfer times are coordinated across multiple operators, and travel advice is provided assuming intermodal trips). In fact, when introduced in 1990, the integrated fare system alone increased ridership on feeder buses within the Zurich region by 53% in just two years [63]. Compared to 1990, the ridership has continuously risen in the past 30 years. From 2005–2017, ridership increased by another 10% on the city-wide public transportation system [30]. The transport payment system today is an honor system, where passengers are responsible for buying and validating their tickets without constant supervision. Enforcement, however, exists; although mostly for long-distance trains. Fare evasion, nevertheless, is less than 4% in Zurich, where random ticket checks are conducted sporadically during daytime hours [64].
Around 1,030,000 passengers are moved daily (2019) by the public transport system–the city’s population is 400,000. This is not surprising given the quality and reliability of the system, as well as the density of the network. The Zurich city public transport network includes over 80 lines (14 served by trams, 6 by trolleybuses, 52 by regular buses, 2 by funiculars, 1 by a cog railway, and a few by boat service), covering approximately 290 km of urban network. Moreover, the system includes 451 stops within city boundaries. This guarantees that most of the trams and bus stops can be accessed with a maximum walking distance of 300 m. In addition, the frequency of trams and buses is rather high, with average headways ranging between 5 and 8 min [26].
Zurich was the first city in the world to introduce a control center for public transport in 1971 [62]. This gave rise to a clear priority structure for the different transport modes [65]. Trams always have first priority (partially based on their physical and mechanical limitations and partially based on their high occupancy levels). Buses are slightly different as they do not necessarily have “official” priority over cars, but for most practical purposes they do, as in most instances car drivers yield to them [66]. Such priority, combined with a clear time table, and an active response on the bus and tram drivers’ side to deviations from the schedule, have led to a very high on-time performance of the system.
In 2012, only ∼2% of the public transport passengers arrived over 5 min late, ∼13% arrived between 2 and 5 min late, and ∼85% arrived on time, i.e., less than 2 min late [37].
Below, some of the measures implemented by the city to encourage the use of this system are described in more detail.

3.1. Transit Signal Priority

The first traffic signal in Zurich was installed over 70 years ago, on May 1949 [62]. Evidently, since then, signal control in the city of Zurich has evolved significantly; and signal actuation is now present almost everywhere. The triggers for the signal actuation, however, have switched from private vehicles to public transport vehicles. Nowadays, the city has close to 400 signalized intersections, many offering public transport priority. The system relies on information from almost 4000 sensors spread throughout the city. Buses and trams are typically detected as they approach the intersections, triggering (when possible) a green light for their specific approach [67]. Notice that the priority is offered within certain boundaries (e.g., as long as it does not lead to a queue of cars longer than a given threshold or while maintaining a maximum and minimum green/red times for the different approaches). Nevertheless, this type of signal control results in frequent stops for car drivers. The priority scheme is based on a “full priority” policy. In other words, public transport vehicles receive priority whether they are early, late, or on-time. This, although it could be perceived as a less-than-optimal measure, works relatively well in Zurich due to several reasons. First, it does transmit a message of support toward public transport and a clear vision regarding the importance given to public transport over private cars. Second, it greatly simplifies the signal control scheme. Third, given that buses in Zurich are highly equipped, and typically adhere to their schedule, it works fairly well in most situations without providing unnecessary priority [30,68,69]. In the case of intersections with a very high public transport demand, however, the transit signal priority scheme might not be feasible. These intersections can be very complex, with many conflicting public transport lines, as well as cars, bicycles, and pedestrians. In such cases, a fixed-time scheme is normally in place.

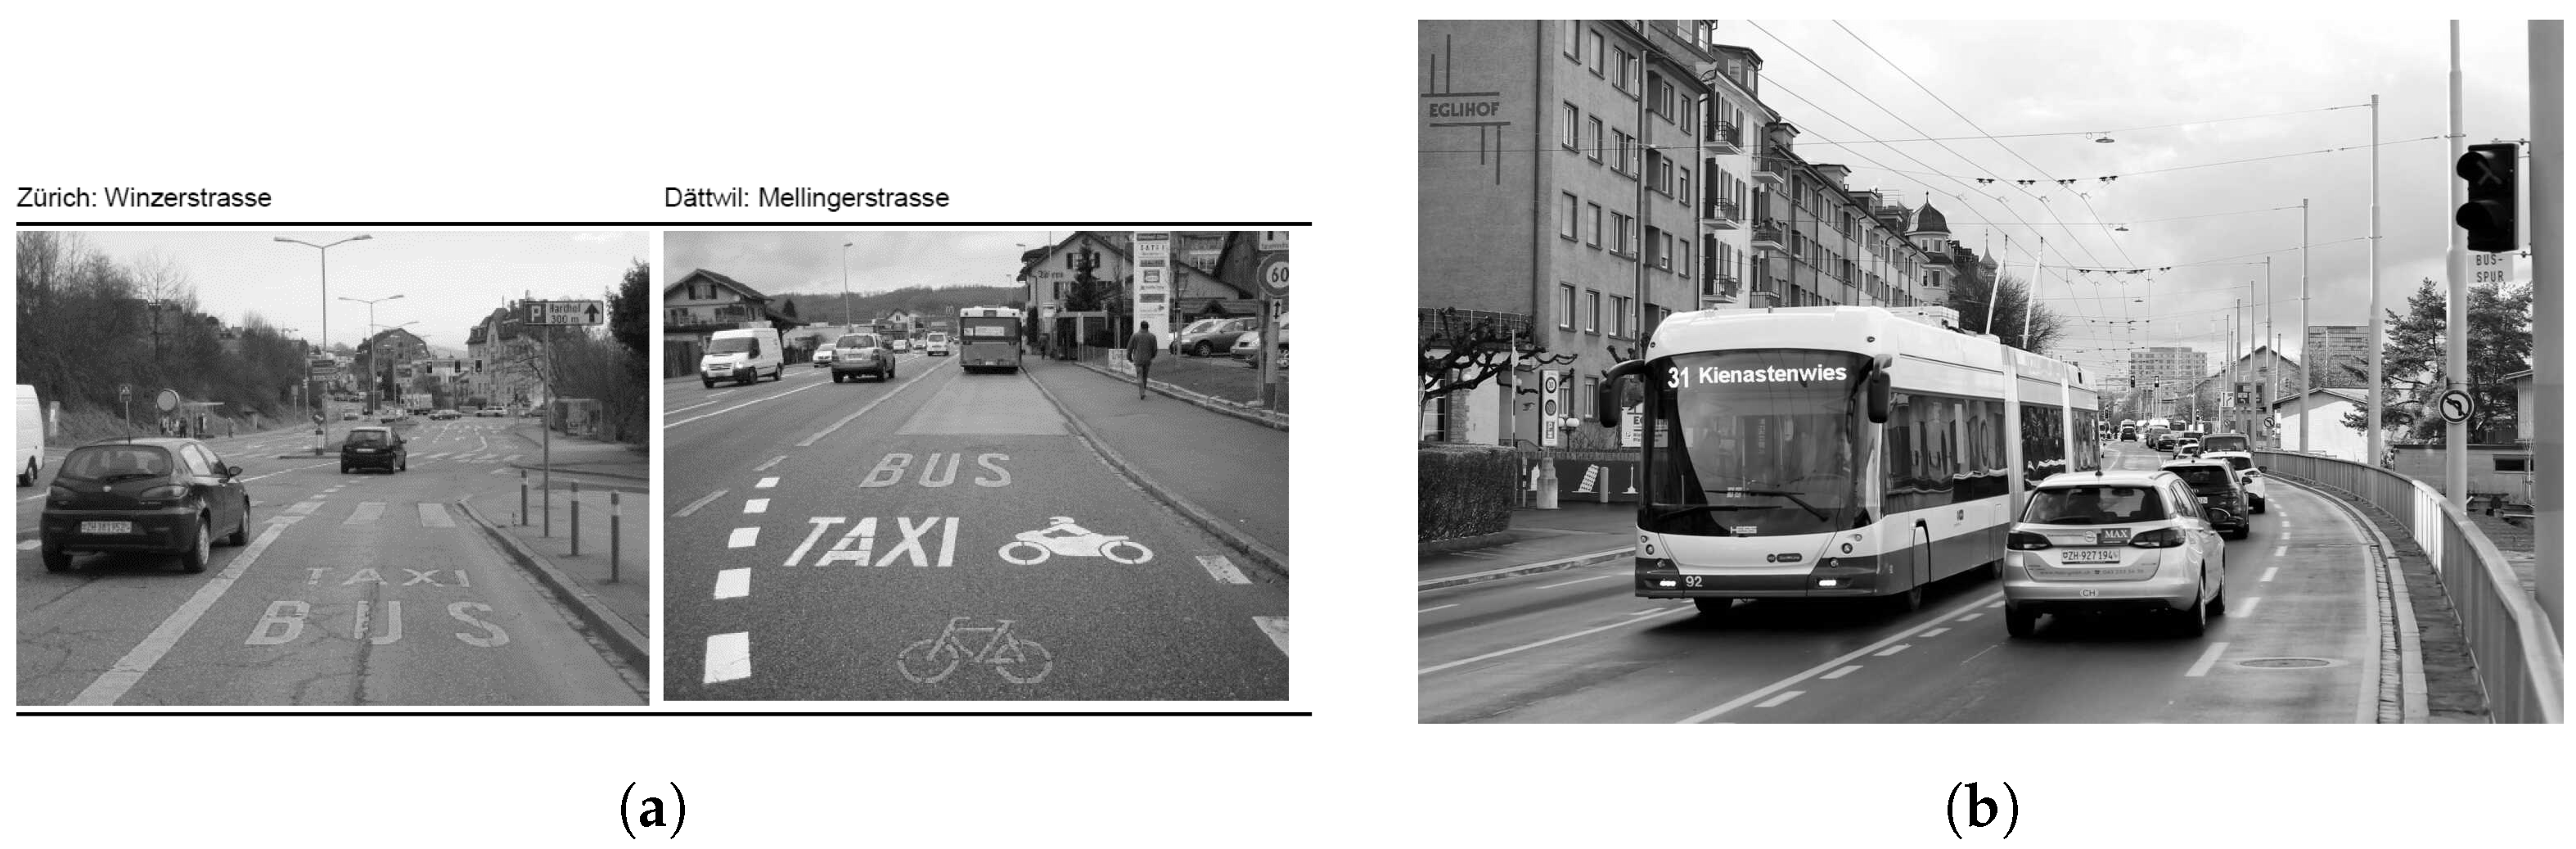
3.2. Dedicated Public Transport Lanes

The road network in Zurich includes a good portion of dedicated public transport lanes (either for trams only, for buses only, or a combination of the two). Within the city center, for example, approximately 20% of the lane-km are dedicated to public transport, 75% are dedicated to private cars, and only 5% of the lane-km are shared by private and public transport [70,71].
Evidently, such a high share of dedicated public transport lanes reduces the available capacity for cars, which can be especially problematic at intersections and other types of bottlenecks [72]. Hence, in many cases, these dedicated lanes are discontinued directly upstream of those bottlenecks (see Figure 8a) or implemented on those segments where the car queues would otherwise impede the free movement of trams or buses (see Figure 8b). In other cases, buses are allowed to drive on the less-frequented turning lanes upstream of intersections, even though they are not turning. These measures allow buses to bypass traffic spillbacks directly upstream of the intersections.
In addition, when the flow of buses is too low or in order to also provide priority to different modes, other types of vehicles (typically taxis and bicycles) are given access to the dedicated bus lanes (see Figure 9a). Notice, however, that this is not very common in Zurich as the frequency of public transport is rather high. Last, an important measure is the creation of bidirectional bus lanes. They tend to be short, and are only implemented in places where there is no space for two additional lanes (see Figure 9b). The length of these special lanes varies from 260 up to 400 m for bus lines where headways do not fall below 5 min [74].

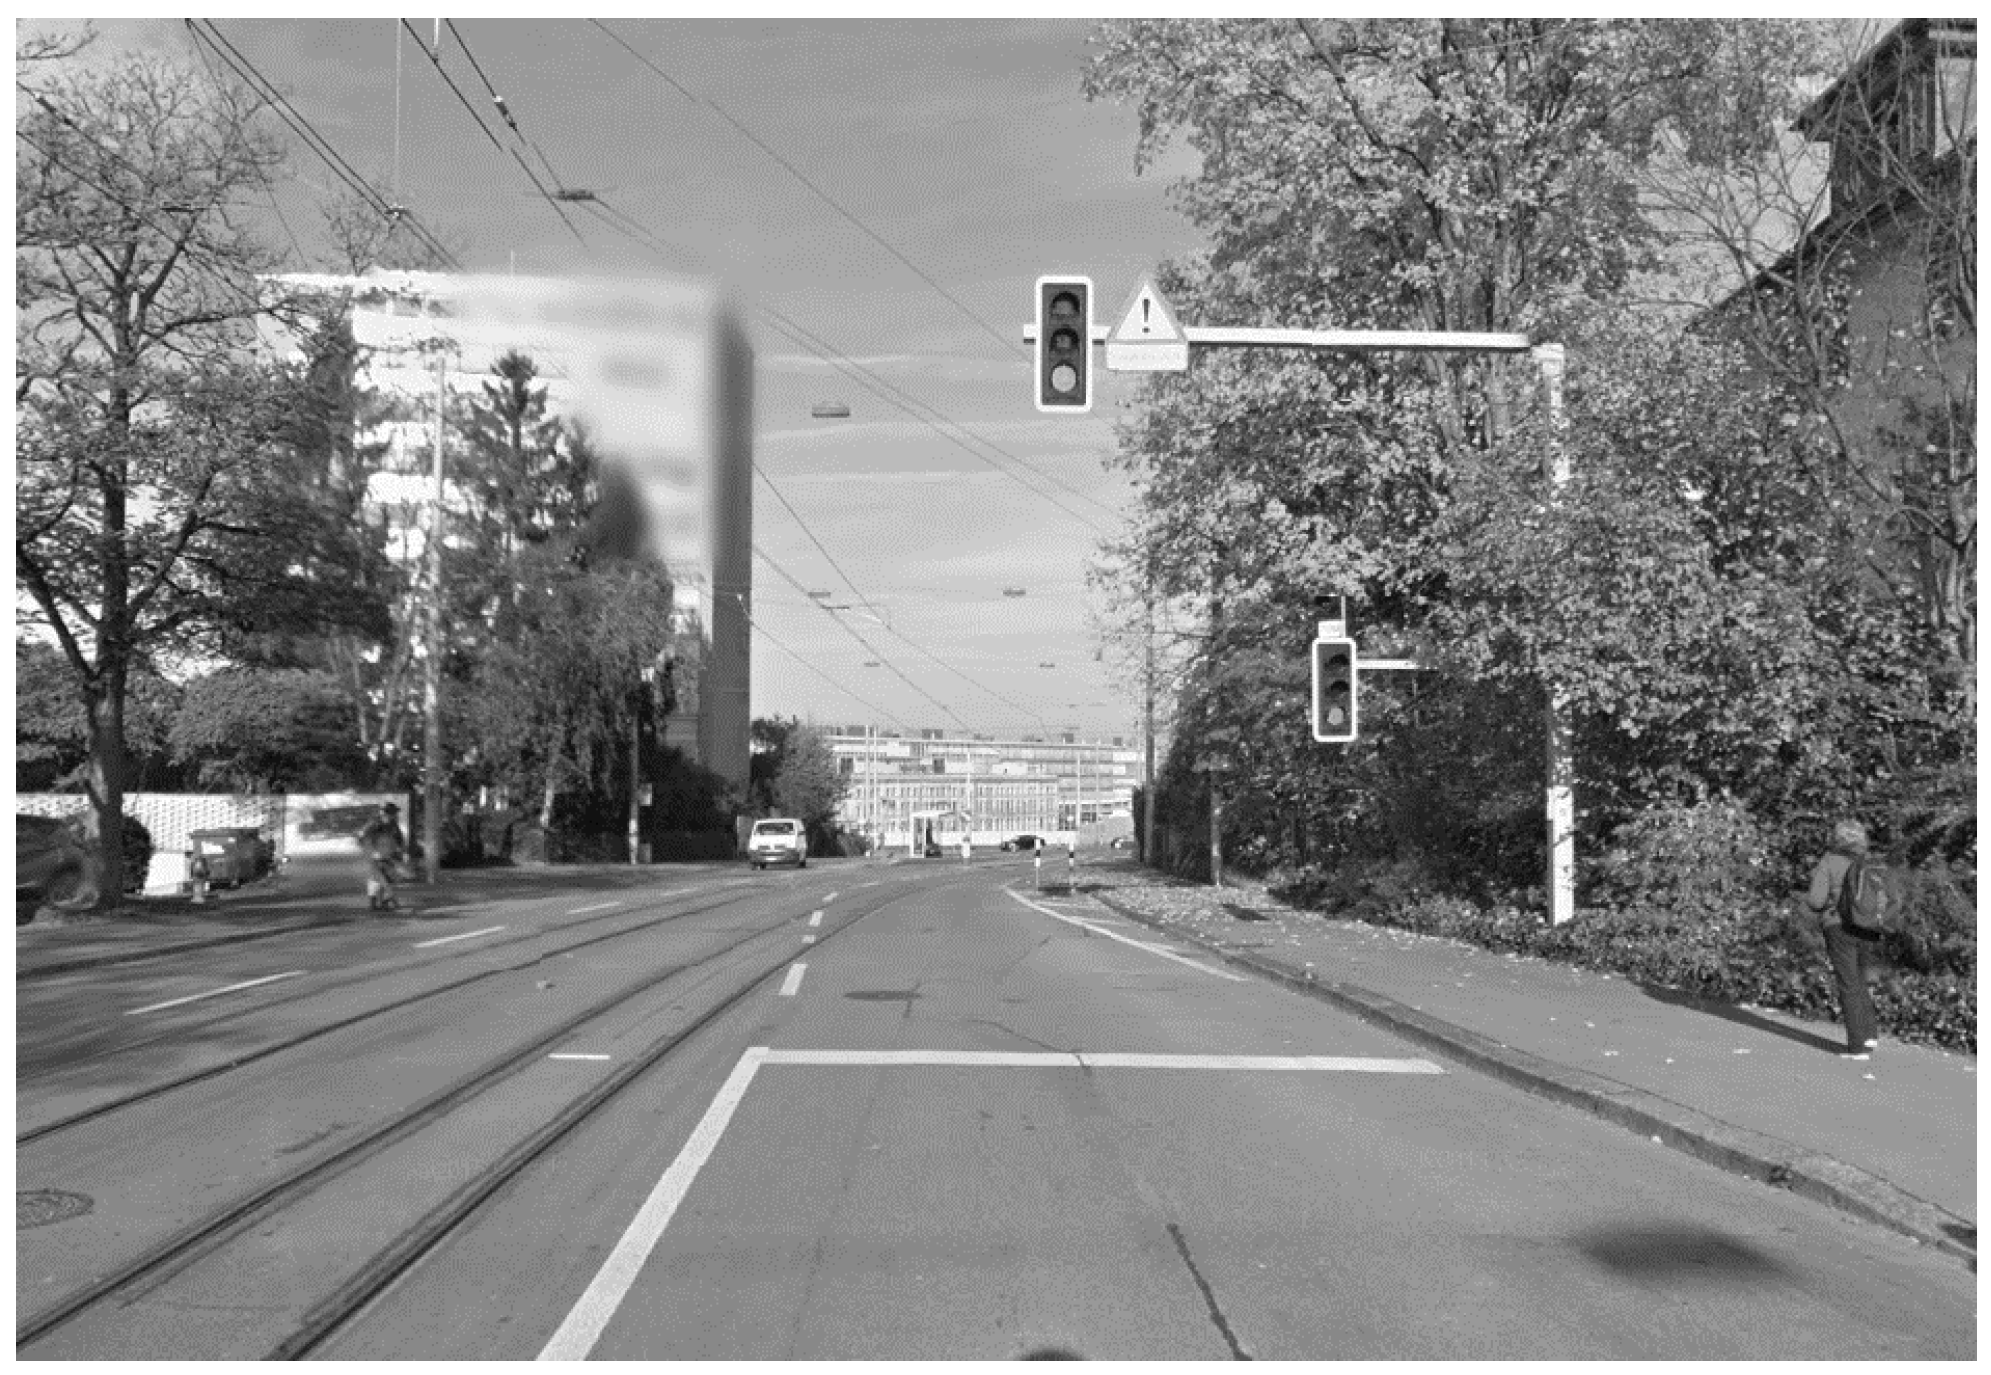
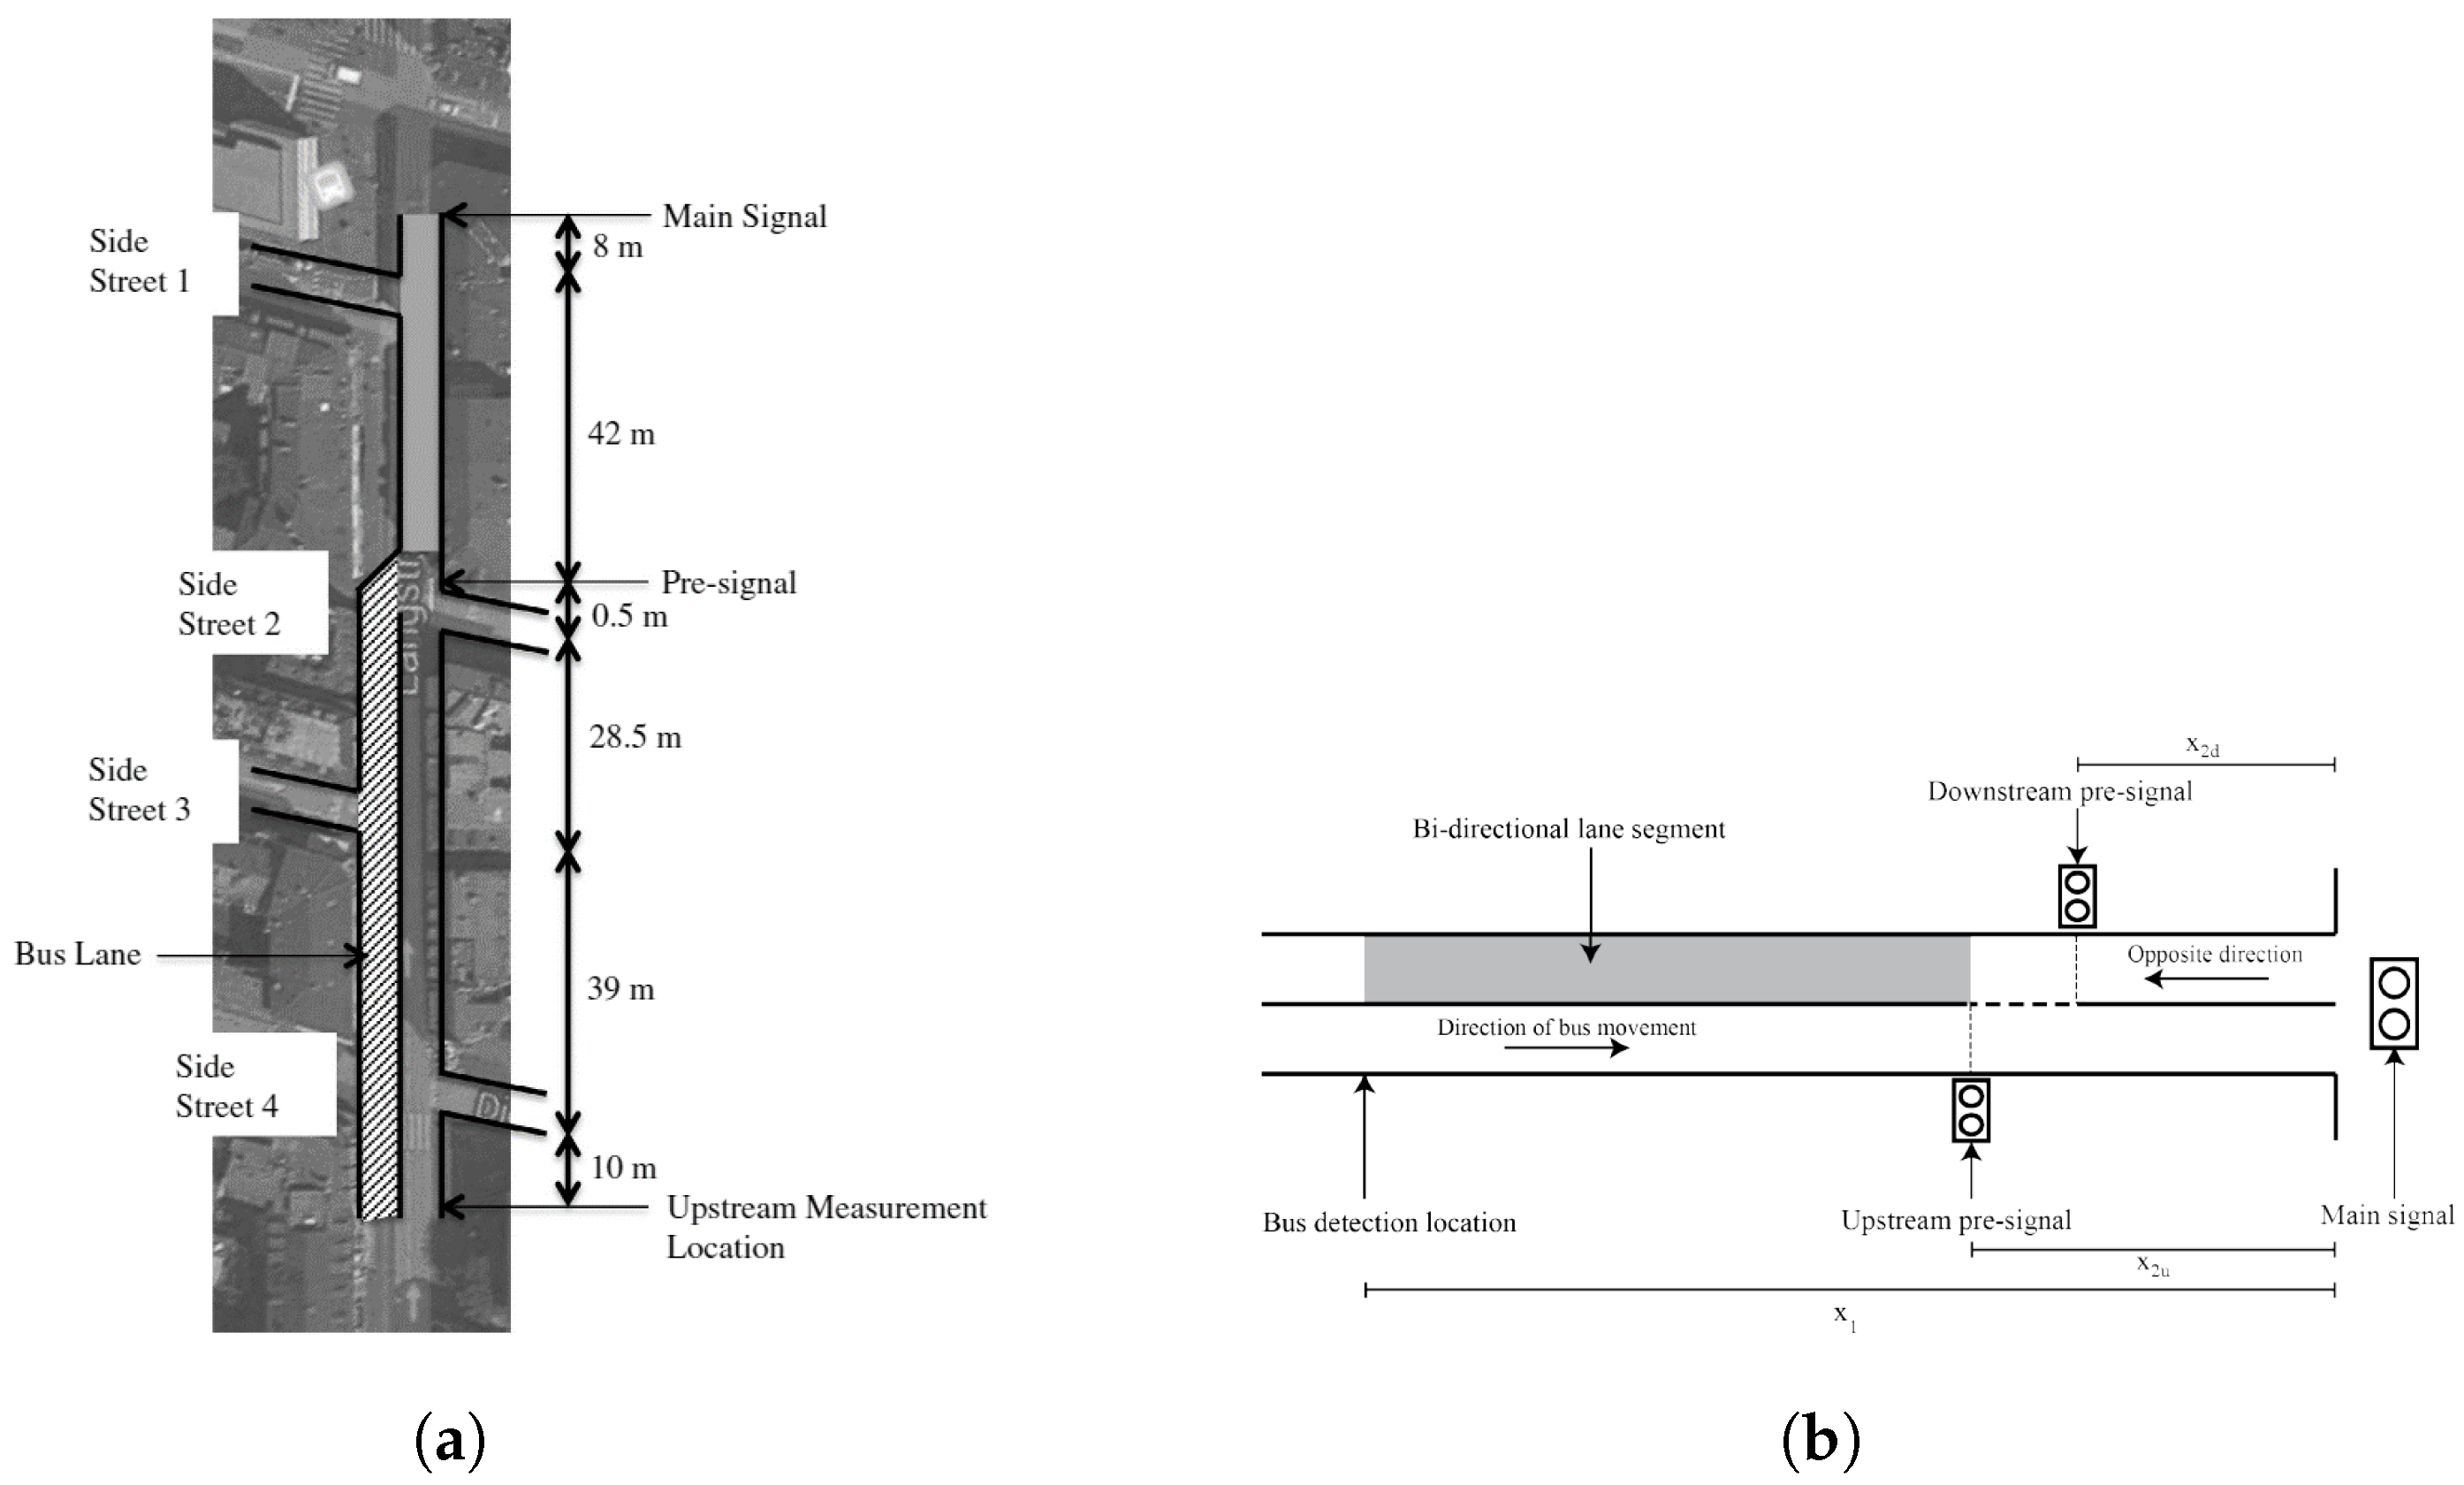
3.3. Additional Signals

On those locations where the dedicated public transport lanes are discontinued, often times additional signals are implemented. They serve to stop traffic ahead of the merge, so that buses and trams are never hindered as they transition from the dedicated lanes into the mixed-use lanes (see Figure 10).
Although the case shown in Figure 10 (i.e., a traffic light at the location when a tram line merges into the regular car lane) is the most common one, there is at least one location, with a considerably more complicated scheme. It includes what is called a presignal [24,75]. This is an additional signal upstream of the intersection’s main signal, used to provide priority to buses at the intersection, even after the dedicated bus lane has been discontinued [76]. The presignal is located at a distance that allows enough car storage between the presignal and the main signal so that the latter can be fully utilized when buses are not present. The presignal turns red for cars in advance of the red main signal, so that the last car that crosses the presignal location can also depart from the intersection within the same cycle. In addition, the presignal turns red for cars when a bus arrives to it, irrespective of the main signal. That way buses can move through the intersection without encountering almost any traffic. The presignal turns green for cars in advance of the green main signal so that the intersection never starves for traffic. In general, it is possible to think of this type of presignal as one that intermittently changes the allocation of a lane from mixed-use to bus-use only. This, although rather uncommon, is a very promising measure. It provides public transport priority at intersections even when there is not enough space for a dedicated bus lane. Alternatively, for cases when the car demand is very high, it could allow cars to discharge from all lanes at the intersection (hence reducing the extent of congestion), while still providing priority to buses [77]. Figure 11a shows the layout of a presignal of this kind in Zurich.
Another type of presignal used in Switzerland, although not in the city of Zurich but in the canton (i.e., region), is one that intermittently changes not only the allocation, but also the direction of travel allowed on a lane [78]. This is useful to provide priority to public transport on intersections with single-lane approaches. In this case, presignals are used on travel lanes in both directions on a given intersection approach. One of them clears cars out of the travel lane in the opposite direction ahead of an arriving bus such that it can be used almost as a dynamic bus lane [79]. The other one stops cars traveling in the direction a bit upstream of the intersection such that the bus can merge back into its lane after jumping a portion of the car queue. Figure 11b shows the layout of a typical presignal of this type.

3.4. Bus and Tram Stops

Bus stops, when curbside, normally operate as fixed bottlenecks that reduce the capacity of the road temporarily (while the bus is there). To avoid such issues, bus bays can be used. However, they can potentially introduce some additional delay to the buses, as they try to incorporate again into the traffic stream after leaving the stop [80]. In Zurich, although bus bays exist in certain places, curbside bus stops are more common. They are typically marked in yellow and require cars to stop. They ensure that buses do not have any trouble entering back into the traffic stream afterward. That being said, it should also be noted that drivers in Switzerland typically yield to buses. A research study observed that even in bus stops where drivers can move ahead of the bus, many chose not to do so in order to not block the bus [66]. Figure 12a,b shows typical curbside stops in Zurich, both for trams and for buses. Notice that many of these stops also have pedestrian crossings next to them, with an island in the middle of the road. This, not only provides a safer environment for pedestrians and public transport users but also avoids overtaking of public transport vehicles when at the stop. Limiting overtaking, especially when upstream of signalized intersections, can also help buses to gain a more advantageous position in the queue when leaving the bus stop.

4. Design and Operational Measures Encouraging Human-Powered Mobility

As part of the effort to promote more sustainable transportation, the city of Zurich has developed not only incentives for the use of the public transport system but also other forms of mobility, including walking, biking, and different forms of shared micromobility. Below some of the measures are discussed that are implemented to promote human-powered mobility as well as the challenges faced when doing so:
  • Pedestrians: short cycles, green when public transport arrives at stop, and road crossing anywhere in 30 km/h zones;
  • Cyclists: speed reduction, comfort routes, and right-on-red;
  • Shared micromobility: per vehicle fee, public dockless bike-sharing system.

4.1. Pedestrians

In general, most of the emphasis, especially in downtown Zurich, has been placed on providing priority and safety to pedestrians [39]. For example, current signal control measures establish a maximum waiting time of 30 s for pedestrians [62]. In order for this to happen, traffic cycles tend to be rather short (between 30 and 60 s for intersections in the city center).
Another signal timing approach the city of Zurich is currently testing consists of setting lights to green at pedestrian crossing when trams or buses arrive. This reduces the jaywalking of public transport passengers trying to catch their connection. Hence, it improves pedestrian safety as well as the attractiveness of the public transportation system. Similarly, pedestrians have priority over cars on pedestrian crossings (whether they have a signal or not). Notice that many pedestrian crossings have an island in the middle of the road.
Moreover, in Tempo 30 areas, there are almost no pedestrian crossings since they can, in theory, cross at any location. This priority system and the lack of signalized crossings are just another way to increase the social interaction between pedestrians and cars, giving them both more responsibility regarding traffic safety and forcing drivers to lower their speed [81,82,83].

4.2. Cyclists

Bicycle trips remained relatively low with 4% mode share from 2000 to 2010. From 2010 to 2015, the modal share doubled to 8% [38]. As of 2019, two thirds of the people living in Zurich have a bicycle [38]. However, only about 20% of the population bikes on a regular basis. Some of the reasons for this are the competition with a well-connected public transportation system, a highly efficient space distribution between private and public transportation (not leaving much space for cyclists), and a suboptimal topography, with main roads reaching almost 15% gradient. In response to this, several operational measures have been taken over the last decade to improve the cycling infrastructure in Zurich.
The Tempo 30 regime discussed in Section 2.2, for example, reduces the speed difference between transportation modes, thereby improving the overall safety, including that of cyclists [84]. Such speed homogenization mechanisms also reduce the need to physically separate the cycle path from the rest of the road, reducing in turn the space requirements for cycling infrastructure. As a result, most of the cycle paths in Zurich are integrated in the cross-section of the road.
A master plan from 2012 defines two types of routes: main and comfort routes. While the former aims at providing direct and fast connections competing in space with other modes, the latter operates on less frequented roads, such as residential streets. Unfortunately, there are still many discontinuities in the routes at major intersections. The previously discussed space allocation for public transportation and pedestrians has not only been at the detriment of cars but also makes it hard to reclaim space for bicycles. For example, the aforementioned pedestrian crossing islands result in a short discontinuity of the cycling paths, decreasing the cyclist’s safety substantially when overtaken by another motorized mode. In addition, in almost no case priority is given to cyclists, e.g., when a comfort route crosses another road. In summary, policy plans are well documented, but their implementation remains a patchwork.
To compensate for this, additional signals are being installed at some locations to improve the interactions between cars or public transport and bicycles. When a bicycle is detected (using an optical bicycle detector) at an intersection in front of a tram, the signal for the bicycle turns green 10 s ahead of the tram arrival in order for the slower bicycle not to interfere with the approaching tram [85]. Something similar is performed in some places to allow a faster discharge of bicycles at an intersection ahead of the cars, with an early green phase for cyclist only. Moreover, thanks to a change in the Swiss federal law the beginning of 2021, now cyclists are allowed to turn right while the traffic light is on red (something not common in Zurich and not allowed for cars) [86]. These measures reduce the delay for cyclist at intersections, thus improving their relative speed compared to other modes. Additionally, many intersections have been modified, when possible, to incorporate a “bicycle box” in front of the signal, which allows for a better visibility of waiting cyclists and additional priority in relation to cars [85].

4.3. Shared Micromobility

As in many other cities worldwide, in the last years, Zurich has seen a strong increase in shared micromobility modes, ranging from simple bicycles to electrified scooters and bicycles with top speeds of 25 and 45 km/h, respectively [87]. The surge in supply has caused somewhat unorganized conditions on many pathways and relatively strong criticism of the city council [88]. This, in turn, led to a new operating fee per vehicle introduced by the city of Zurich in 2019, which argues that the operators are using the city space for economic activities and should pay for it. For example, an operator of free-floating shared bicycles pays CHF 10 (EUR 9) per bicycle and month, a deposit of CHF 50 (EUR 45) per bicycle, and a yearly flat fee of CHF 1500 (EUR 1370) [88]. This measure has decreased the number of shared mobility providers substantially to currently five [87].
To partially balance this out, the city of Zurich provides a subsidized city-wide bicycle-sharing system, “Publibike”. While its implementation was delayed substantially and introduced after many other European cities, the system does offer a key advantage to commonly implemented bicycle sharing systems. Its roughly 160 stations are operated docklessly, i.e., the bicycle is returned to the station without the need to dock it, allowing for a flexible space usage [87]. In other words, public space still remains organized, keeping sidewalks free from overspilling shared mobility modes.

5. Integrated Perspective and Future Expectations

Studies focusing on Zurich’s public transport priority [30,35] have stated that the strategic requirements for a successful deployment are: obtaining and maintaining strong public support, including elected official support; developing a smart implementation plan with high-impact projects that quickly show their benefits; organizing the government to effectively deliver the program, while carefully looking into traffic engineering and technology; implementing complementary programs to improve the public transport system; using capital investments to leverage institutional change; and always looking at the system level problem and solution.
This paper discusses how the city of Zurich uses a holistic approach to transport, combining strategies to encourage the use of public transport and nonmotorized mobility solutions with those aiming to discourage the use of private transport. Moreover, this study shows how such strategies are put into practice for all transportation modes. In particular, this paper highlights different design and operational measures that together allow to allocate more space to public transport, which combined with multiple strategies to promote such public transport and human-powered mobility modes, help curb the overall car dependence.
As mentioned in Section 1, there exist many classifications and definitions of sustainable transportation, e.g., [89,90,91], but here, the focus is on the seminal work by Litman and Burwell, where transportation-related sustainability measures can improve three overlapping objectives: economic, environmental, and social [1]. Their study developed a list of comprehensive indicators describing the three objectives. The classification is restricted to first-order effect indicators [1]: climate change emissions, land-use impacts, transport diversity, as well as nonmotorized transport planning, and resource efficiency. In order to highlight the circular dependencies, it is also focused on the cycle of sustainable transportation (see Section 1).
Table 2 first classifies the investigated operational and design measures using the aforementioned indicators. Then, Table 2 is also used to summarize the discussed interplay between different design and operational measures and their impacts on the cycle of sustainable transportation, which offers more space for other, more sustainable modes, encourages mode switching and reduces the traffic-related problems in the long term.
Using the introduced cycle of sustainable transportation, it is now possible to discuss the interactions between the different measures. Therefore, the measures discussed above are clustered into three overarching categories: (i) Cars are allowed but not congestion: this category aims to provide adequate network efficiency, mostly for cars. Using a world-wide unique perimeter control system, the city of Zurich limits congestion. Importantly, the reduction of the speed limit and the constant level of parking reduces the likelihood of induced demand; therefore, the infrastructure for private transportation does not need to grow with time. (ii) Modes are separated where necessary: this is achieved through the use of dedicated lanes, presignals, and bidirectional bus-lanes, all aiming to improve the system’s efficiency measured in terms of passengers (not vehicles). Priority and space are allocated in a targeted and cost-efficient way at intersections and on heavily congested roads. This allows one to increase public transport’s efficiency, thereby inducing a modal shift. (iii) Pedestrians and public transport always go first: Short traffic signal cycles and absolute priority for public transport make the networks more efficient for pedestrians and public transport. They also recover higher time-space windows for the latter and improve the reliability of the public transportation system, which in turn induces a modal shift toward more sustainable modes.
It is clear that some of these measures have dependencies with each other, and those are not easily separated. In other words, isolating and quantifying the effect of each individual measure within the context of Zurich is a worthwhile but challenging task, which is out of scope for this review paper. Some of the specific operational challenges associated with the deployment of the individual measures were discussed throughout the text. However, for more details, the interested reader can refer to the sources given in Table 2 for the respective quantitative analysis.
In addition to the measures listed in Table 2, the city of Zurich is now planning and/or deploying some new measures focused on cycling in particular, with the clear goal of promoting cycle in the long term. The city of Zurich intensified its long-term promotion of cycling. Specifically, a new cycling program, Zurich invites you to cycle, has been proposed. With the new program, the city plans to double the number of cyclists by 2025 with an increase across all sectors of society, while reducing also the number of accidents involving bicycles. In order to achieve these goals, among other measures, more/better park and ride facilities for bicycles will be established mostly at train stations around the city. In addition, two new cycle networks are being added: a 97 km network for experienced cyclists and a 55 km network for families and other less experience cyclists [37]. Additional routes and lanes fully dedicated to bicycles are being built also in the region surrounding the city. Figure 13 shows the evolution of modal share in Zurich over the last 20 years, as well as the goal for 2025. It is evident that public transport has been gaining market share at the expense of private cars steadily in the past.
As part of a 2000-Watt strategic program the city is also looking at reducing energy consumption in Zurich to 2000 watts per person per year, and CO2 emissions to one tonne per person per year [100]. CO2 emissions in 2011, when the strategy was devised, amounted to 5.5 tonnes per person per year. The 2000 Watt Society strategy includes much more than mobility (e.g., renewable energy sources, more efficient buildings, process and machines). However, mobility plays a significant role on it, as it accounts for 18% of the energy consumed and 37% of the CO2 emissions in the city nowadays. Specific goals include the increase in the efficiency of motor vehicles, a switch to more environmentally friendly forms of transport, and less mobility overall. For that, the city of Zurich aims to continue reducing the number of automobile trips and the rate of motorization, especially across the younger population, through counseling and education [37]. Ideas addressing the growing mobility needs and the limited space available in the city with more environmentally sound transport alternatives, such as walking, cycling, and public transport, have been once again reinforced in the strategic planning for 2035 [101].

6. Final Remarks

This paper discusses the different transport design and operational measures in Zurich, leading to an integrated perspective promoting sustainable transportation. This study focuses on the three main elements composing such integrated plan: measures discouraging private motorized transport, measures encouraging public transport, and measures encouraging human-powered transport. The experience in Zurich shows that combining these measures allows for a shift toward more sustainable mobility: (i) cars are allowed but not congestion; (ii) modes are separated where necessary; and (iii) pedestrians and public transport always go first. The discussion of Table 2 has shown that the city of Zurich indeed follows our sustainable cycle of transportation in a holistic way. The implementation, in turn, is based on an overarching view on mobility that leads to noncompeting policies; multimodal policies with a mix of incentives and disincentives to promote the more sustainable transport modes; a long-term vision that guarantees strategies are neither myopic nor short-lived; and a widespread, clear, and consistent message that ensures citizens’ support and compliance with the mobility policies. Although successful, many of these strategies have faced opposition at some point. In fact, the political will, long-term perspective, and institutional memory have all been crucial for the deployment of this integrated set of measures. Here, we qualitatively described the path taken by urban and transportation planning and operating agencies in Zurich in order to achieve a more sustainable mobility system. Lessons learned from this case study could be helpful to other cities and agencies as they design their own path.

Author Contributions

Conceptualization, M.M.; writing—original draft preparation, M.M. and L.A.; writing—review and editing, M.M. and L.A.; visualization, M.M. and L.A.; supervision, M.M. All authors have read and agreed to the published version of the manuscript.

Funding

This research received no external funding.

Institutional Review Board Statement

Not applicable.

Informed Consent Statement

Not applicable.

Data Availability Statement

Data are fully available online and on request.

Acknowledgments

M. Menendez acknowledges the support by the NYUAD Center for Interacting Urban Networks (CITIES), funded by Tamkeen under the NYUAD Research Institute Award CG001 and by the Swiss Re Institute under the Quantum Cities™ initiative. We also want to thank different people within the city of Zurich that have provided information to us over time, including G. Donier, C. Heimgartner, O. Janssens, and W. Brucks.

Conflicts of Interest

The authors declare no conflict of interest.

References

  1. Litman, T.; Burwell, D. Issues in sustainable transportation. Int. J. Glob. Environ. Issues 2006, 6, 331–347. [Google Scholar] [CrossRef]
  2. Eurostat. Energy, Transport and Environment Statistics; European Commission: Luxembourg, 2019. [Google Scholar] [CrossRef]
  3. Schipper, L.; Fabian, H.; Leather, J. Transport and Carbon Dioxide Emissions: Forecasts, Options Analysis, and Evaluation; Technical Report; Asian Development Bank: Mandaluyong, PH, USA, 2009. [Google Scholar]
  4. Uherek, E.; Halenka, T.; Borken-Kleefeld, J.; Balkanski, Y.; Berntsen, T.; Borrego, C.; Gauss, M.; Hoor, P.; Juda-Rezler, K.; Lelieveld, J.; et al. Transport impacts on atmosphere and climate: Land transport. Atmos. Environ. 2010, 44, 4772–4816. [Google Scholar] [CrossRef]
  5. Daganzo, C.F. Urban gridlock: Macroscopic modeling and mitigation approaches. Transp. Res. Part Methodol. 2007, 41, 49–62. [Google Scholar] [CrossRef]
  6. Dakic, I.; Ambühl, L.; Schümperlin, O.; Menendez, M. On the modeling of passenger mobility for stochastic bi-modal urban corridors. Transp. Res. Part C 2020, 113, 146–163. [Google Scholar] [CrossRef]
  7. Zheng, N.; Geroliminis, N. On the distribution of urban road space for multimodal congested networks. Transp. Res. Part B 2013, 57, 326–341. [Google Scholar] [CrossRef] [Green Version]
  8. Loder, A.; Ambühl, L.; Menendez, M.; Axhausen, K.W. Understanding traffic capacity of urban networks. Sci. Rep. 2019, 9, 16283. [Google Scholar] [CrossRef] [Green Version]
  9. He, H.; Yang, K.; Liang, H.; Menendez, M.; Guler, S.I. Providing public transport priority in the perimeter of urban networks: A bimodal strategy. Transp. Res. Part C 2019, 107, 171–192. [Google Scholar] [CrossRef]
  10. Roca-Riu, M.; Menendez, M.; Dakic, I.; Buehler, S.; Ortigosa, J. Urban space consumption of cars and buses: An analytical approach. Transp. B 2020, 8, 237–263. [Google Scholar] [CrossRef]
  11. He, H.; Menendez, M.; Ilgin Guler, S. Analytical evaluation of flexible-sharing strategies on multimodal arterials. Transp. Res. Part A Policy Pract. 2018, 114, 364–379. [Google Scholar] [CrossRef] [Green Version]
  12. Goodwin, P. Empirical evidence on induced traffic. Transportation 1996, 23, 35–54. [Google Scholar] [CrossRef]
  13. Goodwin, P.; Noland, R.B. Building new roads really does create extra traffic: A response to Prakash et al. Appl. Econ. 2003, 35, 1451–1457. [Google Scholar] [CrossRef]
  14. Weis, C.; Axhausen, K.W. Induced travel demand: Evidence from a pseudo panel data based structural equations model. Res. Transp. Econ. 2009, 25, 8–18. [Google Scholar] [CrossRef] [Green Version]
  15. Richardson, B.C. Toward a policy on a sustainable transportation system. Transp. Res. Rec. 1999, 27–34. [Google Scholar] [CrossRef]
  16. Jepson, E.J. Sustainability and Planning: Diverse Concepts and Close Associations. J. Plan. Lit. 2001, 15, 499–510. [Google Scholar] [CrossRef]
  17. Balsas, C. Cities, Automobiles, and Sustainability. Urban Aff. Rev. 2001, 36, 429–432. [Google Scholar] [CrossRef]
  18. Dinh, D.D.; Kubota, H. Profile-speed data-based models to estimate operating speeds for urban residential streets with a 30km/h speed limit. IATSS Res. 2013, 36, 115–122. [Google Scholar] [CrossRef] [Green Version]
  19. Arcadis. Sustainable Cities Mobility Index; Technical Report; Arcadis: Amsterdam, The Netherlands, 2017. [Google Scholar]
  20. Urban Mobility Index. HERE Urban Mobility Index. 2018. Available online: https://mappinglondon.co.uk/2018/here-urban-mobility-index/ (accessed on 15 September 2021).
  21. Mercer. Quality of Living City Ranking|Mercer; Mercer: New York, NY, USA, 2018. [Google Scholar]
  22. Omio. Inner-City Mobility in European Cities; Technical Report; Omio: Berlin, Germany, 2019. [Google Scholar]
  23. IMD. Smart City Index 2020 by IMD Business School; Technical Report; IMD: New Delhi, India, 2020.
  24. Ilgin Guler, S.; Menendez, M. Analytical formulation and empirical evaluation of pre-signals for bus priority. Transp. Res. Part B 2014, 64, 41–53. [Google Scholar] [CrossRef]
  25. McCahill, C.; Garrick, N. Parking supply and urban impacts. Transp. Sustain. 2014, 5, 33–55. [Google Scholar] [CrossRef]
  26. Ott, R. The Zurich experience. In Proceedings of the Alternatives to Congestion Charging: Proceedings of a Seminar Held by the Transport Policy Committee, London, UK, 31 January 2002; pp. 73–85. [Google Scholar]
  27. Carrasco, N. Quantifying reliability of transit service in Zurich, Switzerland. Transp. Res. Rec. 2012, 114–125. [Google Scholar] [CrossRef]
  28. Mägerle, J.; Maggi, R. Zurich transport policy: Or the importance of being rich. Built Environ. 1999, 25, 129–137. [Google Scholar]
  29. Petersen, T. Watching the Swiss: A network approach to rural and exurban public transport. Transp. Policy 2016, 52, 175–185. [Google Scholar] [CrossRef] [Green Version]
  30. Nash, A.; Corman, F.; Sauter-Servaes, T. Public transport priority in 2020 Lessons from Zurich. In Proceedings of the 8th Transport Research Arena TRA 2020, Helsinki, Finland, 27–30 April 2020; pp. 12–19. [Google Scholar]
  31. Fitzroy, F.; Smith, I. Priority Overpricing: Lessons From Zurich on the Redundancy of Road Pricing. J. Transp. Econ. Policy 1993, 27, 209–214. [Google Scholar]
  32. City of Zurich. Treibhausgasbilanz-Stadt Zürich. 2020. Available online: https://www.stadt-zuerich.ch/gud/de/index/umwelt_energie/energie-in-zahlen/2000-watt-indikatoren/treibhausgasbilanz.html (accessed on 15 September 2021).
  33. Swissinfo. Government Wants to Double Use of Public Transport by 2050; Swissinfo: Bern, Switzerland, 2021. [Google Scholar]
  34. Buehler, R.; Pucher, J.; Gerike, R.; Götschi, T. Reducing car dependence in the heart of Europe: Lessons from Germany, Austria, and Switzerland. Transp. Rev. 2017, 37, 4–28. [Google Scholar] [CrossRef]
  35. Nash, A. Implementing Zurich’s transit priority program. Transp. Res. Rec. 2003, 59–65. [Google Scholar] [CrossRef]
  36. Garrick, N.W. A Swiss Lesson in Enlightened Street Design. 2019. Available online: https://www.reddit.com/r/hackernews/comments/ddc0bn/a_swiss_lesson_in_enlightened_street_design/ (accessed on 15 September 2021).
  37. City of Zurich. Urban Traffic Programme-Stadtverkehr 2025: 2012 Report. Technical Report. 2013. Available online: https://www.stadt-zuerich.ch/ted/de/index/taz/publikationen_u_broschueren/urban-traffic-programm—report-2012.html (accessed on 15 September 2021).
  38. City of Zurich. Kennzahlen der Verkehrsentwicklung. 2019. Available online: https://www.stadt-zuerich.ch/ted/de/index/taz/verkehr/webartikel/webartikel_kennzahlen_verkehrsentwicklung.html (accessed on 15 September 2021).
  39. Dönier, G.; Bernhard, J.; Brendel, S.; Raymann, L. Adaptive Traffic Flow Management; Technical Report; ETH Zurich: Zürich, Switzerland, 2013. [Google Scholar]
  40. TomTom. Traffic Congestion Ranking|TomTom Traffic Index 2020; TomTom: Amsterdam, The Netherlands, 2020. [Google Scholar]
  41. TomTom. Traffic Congestion Ranking|Tomtom Traffic Index 2012; TomTom: Amsterdam, The Netherlands, 2012. [Google Scholar]
  42. Ambühl, L.; Loder, A.; Menendez, M.; Axhausen, K.W. A case study of Zurich’s two-layered perimeter control. In Proceedings of the 7th Transport Research Arena, IVT, Sitges, Spain, 3–7 September 2018. [Google Scholar] [CrossRef]
  43. Rosenthal, E. Europe Stifles Drivers in Favor of Mass Transit and Walking—The New York Times. 2011. Available online: https://www.reddit.com/r/TrueReddit/comments/ia1uh/europe_stifles_drivers_in_favor_of_mass_transit/ (accessed on 15 September 2021).
  44. Shoup, D.C. The High Cost of Free Parking; Routledge: London, UK, 2005. [Google Scholar]
  45. Shoup, D. Pricing Curb Parking. Transp. Res. Part A Policy Pract. 2021, 154, 399–412. [Google Scholar] [CrossRef]
  46. McCahill, C.T.; Garrick, N.; Atkinson-Palombo, C.; Polinski, A. Effects of parking provision on automobile use in cities: Inferring causality. Transp. Res. Rec. 2016, 2543, 159–165. [Google Scholar] [CrossRef] [Green Version]
  47. Jakob, M.; Menendez, M. Parking Pricing vs. Congestion Pricing: A Macroscopic Analysis of their Impact on Traffic. Transp. A Transp. Sci. 2020, 17, 1–29. [Google Scholar] [CrossRef]
  48. Cao, J.; Menendez, M.; Waraich, R. Impacts of the urban parking system on cruising traffic and policy development: The case of Zurich downtown area, Switzerland. Transportation 2019, 46, 883–908. [Google Scholar] [CrossRef] [Green Version]
  49. Kodransky, M.; Hermann, G. Europe’s parking U-turn: From accommodation to regulation. Inst. Transp. Dev. Policy 2011, 84. [Google Scholar]
  50. Jakob, M.; Menendez, M. Macroscopic Modeling of On-Street and Garage Parking: Impact on Traffic Performance. J. Adv. Transp. 2019, 2019. [Google Scholar] [CrossRef]
  51. Jakob, M.; Menendez, M.; Cao, J. A dynamic macroscopic parking pricing and decision model. Transp. B 2020, 8, 307–331. [Google Scholar] [CrossRef]
  52. Parkopedia. Global Parking Index. Technical Report September. 2019. Available online: https://cdn2.hubspot.net/hubfs/5540406/Whitepapers_research reports/Parkopedia-Global-Parking-Index-2019_Final_V2.pdf (accessed on 15 September 2021).
  53. Cao, J.; Menendez, M. Quantification of potential cruising time savings through intelligent parking services. Transp. Res. Part A Policy Pract. 2018, 116, 151–165. [Google Scholar] [CrossRef]
  54. Christensen, J. Effects Of Changes in Speed Limits on Traffic Accidents on Danish Roads. In Proceedings of the OECD Symposium: The Effects of Speed Limits on Traffic Accidents and Transport Energy Use, New York, NY, USA, 6–8 October 1981. [Google Scholar]
  55. Lee, C.; Hellinga, B.; Saccomanno, F. Evaluation of variable speed limits to improve traffic safety. Transp. Res. Part C Emerg. Technol. 2006, 14, 213–228. [Google Scholar] [CrossRef]
  56. Vadeby, A.; Forsman, B. Traffic safety effects of new speed limits in Sweden. Accid. Anal. Prev. 2018, 114, 34–39. [Google Scholar] [CrossRef] [PubMed]
  57. Marshall, W.E.; Garrick, N.W.; Hansen, G. Reassessing on-street parking. Transp. Res. Rec. 2008, 2046, 45–52. [Google Scholar] [CrossRef]
  58. Geroliminis, N.; Haddad, J.; Ramezani, M. Optimal perimeter control for two urban regions with macroscopic fundamental diagrams: A model predictive approach. IEEE Trans. Intell. Transp. Syst. 2013, 14, 348–359. [Google Scholar] [CrossRef] [Green Version]
  59. Amt für Verkehr Kanton Zürich. Gesamtverkehrsmodell des Kantons Zürich; Amt für Verkehr Kanton Zürich: Zürich, Switzerland, 2015. [Google Scholar]
  60. Ortigosa, J.; Menendez, M.; Tapia, H. Study on the number and location of measurement points for an MFD perimeter control scheme: A case study of Zurich. EURO J. Transp. Logist. 2014, 3, 245–266. [Google Scholar] [CrossRef]
  61. Ambühl, L.; Loder, A.; Leclercq, L.; Menendez, M. Disentangling the city traffic rhythms: A longitudinal analysis of MFD patterns over a year. Transp. Res. Part C Emerg. Technol. 2021, 126, 103065. [Google Scholar] [CrossRef]
  62. Dönier, G.; Bernhard, J.; Brendel, S.; Raymann, L. The Zurich Model; Technical Report; ETH Zurich: Zürich, Switzerland, 2012. [Google Scholar]
  63. Cervero, R. The Transit Metropolis: A Global Inquiry; Island Press: Washington, DC, USA, 1998. [Google Scholar]
  64. Killias, M.; Scheidegger, D.; Nordenson, P. The Effects of Increasing the Certainty of Punishment: A Field Experiment on Public Transportation. Eur. J. Criminol. 2009, 6, 387–400. [Google Scholar] [CrossRef]
  65. Guler, S.I.; Menendez, M. Methodology for estimating capacity and vehicle delays at unsignalized multimodal intersections. Int. J. Transp. Sci. Technol. 2016, 5, 257–267. [Google Scholar] [CrossRef]
  66. Arnet, K.; Guler, S.I.; Menendez, M. Effects of Multimodal Operations on Urban Roadways. Transp. Res. Rec. 2015, 2533, 1–7. [Google Scholar] [CrossRef]
  67. Genser, A.; Ambühl, L.; Yang, K.; Menendez, M.; Kouvelas, A. Time-to-Green predictions: A framework to enhance SPaT messages using machine learning. In Proceedings of the 2020 IEEE 23rd International Conference on Intelligent Transportation Systems, ITSC 2020, Rhodes, Greece, 20–23 September 2020; p. 9294548. [Google Scholar] [CrossRef]
  68. Xuan, Y.; Argote, J.; Daganzo, C.F. Dynamic bus holding strategies for schedule reliability: Optimal linear control and performance analysis. Transp. Res. Part B Methodol. 2011, 45, 1831–1845. [Google Scholar] [CrossRef]
  69. Orth, H.; Weidmann, U.; Dorbritz, R. Development of measurement system for public transport performance. Transp. Res. Rec. 2012, 2274, 135–143. [Google Scholar] [CrossRef]
  70. Ortigosa, J.; Menendez, M.; Gayah, V.V. Analysis of Network Exit Functions for Various Urban Grid Network Configurations. Transp. Res. Rec. 2015, 2491, 12–21. [Google Scholar] [CrossRef]
  71. Loder, A.; Ambühl, L.; Menendez, M.; Axhausen, K.W. Empirics of multi-modal traffic networks–Using the 3D macroscopic fundamental diagram. Transp. Res. Part C Emerg. Technol. 2017, 82, 88–101. [Google Scholar] [CrossRef]
  72. Guler, S.I.; Cassidy, M.J. Strategies for sharing bottleneck capacity among buses and cars. Transp. Res. Part B Methodol. 2012, 46, 1334–1345. [Google Scholar] [CrossRef] [Green Version]
  73. Buehlmann, F.; Laube, M.; Hächler, C.; Sigrist, K. Oeffnung der Busstreifen für Weitere Verkehrsteilnehmende; Technical Report 1445; Astra: Cambridge, UK, 2013. [Google Scholar]
  74. Astra. Möglichkeiten und Grenzen von Elektronischen Busspuren; Technical Report; Astra: Cambridge, UK, 2012. [Google Scholar]
  75. Guler, S.; Menendez, M. Evaluation of Presignals at Oversaturated Signalized Intersections. Transp. Res. Rec. 2014, 2418, 11–19. [Google Scholar] [CrossRef]
  76. Guler, S.I.; Menendez, M. Pre-signals for bus priority: Basic guidelines for implementation. Public Transp. 2015, 7, 339–354. [Google Scholar] [CrossRef]
  77. He, H.; Guler, S.I.; Menendez, M. Adaptive control algorithm to provide bus priority with a pre-signal. Transp. Res. Part C Emerg. Technol. 2016, 64, 28–44. [Google Scholar] [CrossRef] [Green Version]
  78. Guler, S.I.; Gayah, V.V.; Menendez, M. Bus priority at signalized intersections with single-lane approaches: A novel pre-signal strategy. Transp. Res. Part C Emerg. Technol. 2016, 63, 51–70. [Google Scholar] [CrossRef]
  79. Viegas, J.; Lu, B. Widening the scope for bus priority with intermittent bus lanes. Transp. Plan. Technol. 2001, 24, 87–110. [Google Scholar] [CrossRef]
  80. Lüthy, N. Systemwide effects of bus stops: Bus bays vs. curbside bus stops. In Proceedings of the 95th Annual Meeting of the Transportation Research Board (TRB 2016), Washington, DC, USA, 10–14 January 2016; pp. 16–96. [Google Scholar]
  81. Hamilton-Baillie, B. Shared space: Reconciling people, places and traffic. Built Environ. 2008, 34, 161–181. [Google Scholar] [CrossRef] [Green Version]
  82. Kaparias, I.; Bell, M.G.H.; Dong, W.; Sastrawinata, A.; Singh, A.; Wang, X.; Mount, B. Analysis of Pedestrian–Vehicle Traffic Conflicts in Street Designs with Elements of Shared Space. Transp. Res. Rec. 2013, 2393, 21–30. [Google Scholar] [CrossRef]
  83. Wargo, B.; Garrick, N. Shared Space: Could Less Formal Streets be Better for Both Pedestrians and Vehicles? J. Transp. Health 2016, 3, S74. [Google Scholar] [CrossRef]
  84. Marshall, W.E.; Ferenchak, N.N. Why cities with high bicycling rates are safer for all road users. J. Transp. Health 2019, 13, 100539. [Google Scholar] [CrossRef]
  85. City of Zurich. Masterplan Velo. 2012. Available online: https://www.stadt-zuerich.ch/ted/de/index/taz/publikationen_u_broschueren/masterplan_velo.html (accessed on 15 September 2021).
  86. City of Zurich. Sicher Velofahren. 2021. Available online: https://www.stadt-zuerich.ch/sichervelofahren# (accessed on 15 September 2021).
  87. Reck, D.J.; Haitao, H.; Guidon, S.; Axhausen, K.W. Explaining shared micromobility usage, competition and mode choice by modelling empirical data from Zurich, Switzerland. Transp. Res. Part C Emerg. Technol. 2021, 124, 102947. [Google Scholar] [CrossRef]
  88. NZZ. Fahrradverleih Zürich: Plötzlich stört das grüne Velo; NZZ: Zürich, Switzerland, 2019. [Google Scholar]
  89. Afrin, T.; Yodo, N. A survey of road traffic congestion measures towards a sustainable and resilient transportation system. Sustainability 2020, 12, 4660. [Google Scholar] [CrossRef]
  90. Boltze, M.; Tuan, V.A. Approaches to achieve sustainability in traffic management. Procedia Eng. 2016, 142, 205–212. [Google Scholar] [CrossRef] [Green Version]
  91. Kennedy, C.; Miller, E.; Shalaby, A.; MacLean, H.; Coleman, J. The four pillars of sustainable urban transportation. Transp. Rev. 2005, 25, 393–414. [Google Scholar] [CrossRef]
  92. Branston, D.M. Urban Traffic Speeds—I: A Comparison of Proposed Expressions Relating Journey Speed to Distance from a Town Center. Transp. Sci. 1974, 8, 35–49. [Google Scholar] [CrossRef]
  93. Cao, J.; Menendez, M.; Nikias, V. The effects of on-street parking on the service rate of nearby intersections. J. Adv. Transp. 2015, 50, 406–420. [Google Scholar] [CrossRef]
  94. Zheng, N.; Geroliminis, N. Modeling and optimization of multimodal urban networks with limited parking and dynamic pricing. Transp. Res. Part B Methodol. 2016, 83, 36–58. [Google Scholar] [CrossRef] [Green Version]
  95. He, H.; Guler, S.I.; Menendez, M. Providing Bus Priority Using Adaptive Pre-signals. In Proceedings of the 94th Annual Meeting of the Transportation Research Board, Washington, DC, USA, 11–15 January 2015. [Google Scholar]
  96. Xie, X.; Chiabaut, N.; Leclercq, L. Improving Bus Transit in Cities with Appropriate Dynamic Lane Allocating Strategies. Procedia Soc. Behav. Sci. 2012, 48, 1472–1481. [Google Scholar] [CrossRef] [Green Version]
  97. Seman, L.O.; Koehler, L.A.; Camponogara, E.; Kraus, W. Integrated headway and bus priority control in transit corridors with bidirectional lane segments. Transp. Res. Part C Emerg. Technol. 2020, 111, 114–134. [Google Scholar] [CrossRef]
  98. Heimgartner, C.; Menendez, M. Challenges for Better Understanding and Simulating Urban Traffic: The Zurich Experience. In Proceedings of the 3rd International Conference on Models and Technologies for Intelligent Transportation Systems, MT-ITS 2013, Dresden, Germany, 16–17 June 2013. [Google Scholar]
  99. Wu, K.; Guler, S.I.; Gayah, V.V. Estimating the Impacts of Bus Stops and Transit Signal Priority on Intersection Operations. Transp. Res. Rec. 2017, 2622, 70–83. [Google Scholar] [CrossRef]
  100. Volland, B.; Gessler, R.; Püntener, T.W. On the Way to the 2000—Watt Society. 2011. Available online: https://ourworld.unu.edu/en/2000-watt-society (accessed on 15 September 2021).
  101. City of Zurich. Strategies 2035—City of Zurich. 2019. Available online: https://www.stadt-zuerich.ch/prd/en/index/stadtentwicklung/strategies-2035.html (accessed on 15 September 2021).
Figure 1. Unsustainable vs. sustainable transportation cycle: In contrast to the unsustainable transportation cycle, whose goal is to improve car traffic efficiency, the sustainable transportation cycle aims at offering more space for other, more sustainable modes, encouraging mode switching and reducing the traffic-related problems in the long-term.
Sustainability 14 00625 g001
Figure 2. Mobility-related GHG emissions over time in the city of Zurich. Source: [32].
Sustainability 14 00625 g002
Figure 3. Time series of population vs. traffic volumes for Zurich: Despite increasing population since 2004, car traffic volume has decreased. Source: [38].
Sustainability 14 00625 g003
Figure 4. The city strictly controls the number of public parking places. In 1996, the city council implemented a policy to keep the number of public parking spaces at the level from 1990. Source: [49] (a) Example of a street in Zurich before on-street parking was removed, and (b) example of a street in Zurich after on-street parking was removed.
Sustainability 14 00625 g004
Figure 5. Number of publicly accessible parking spaces in the city of Zurich 2001–2015. (*) In 2009, the city changed the way they counted parking spaces. Source: [38].
Sustainability 14 00625 g005
Figure 6. Most residential streets in Zurich exhibit some kind of traffic-calming mechanism. Source: Google maps (a) road restrictions combined with low-speed limits and (b) alternate parking on both sides of the street.
Sustainability 14 00625 g006
Figure 7. Map of the inner city of Zurich and the streets monitored by the Zurich model. Once a level of service reduction is detected, traffic lights on the city access roads generating the traffic for those inner streets are adjusted automatically Source: [62].
Sustainability 14 00625 g007
Figure 8. Within the city center, for example, approximately 20% of the lane-km are dedicated to public transport. Sources: [73] and Google Maps (a) discontinued bus lane upstream of an intersection and (b) special bus lane to bypass car queues.
Sustainability 14 00625 g008
Figure 9. Special dedicated bus lanes: When the flow of buses is too low or in order to also provide priority to different modes, other types of vehicles are allowed (taxis, bicycles, etc.). Similarly, there are bidirectional bus lanes that can be used by buses traveling in both directions. Sources: Google Maps and [74] (a) dedicated bus lanes accessible to other selected transport modes and (b) bidirectional bus lane.
Sustainability 14 00625 g009
Figure 10. Traffic signal to provide public transport priority at end of a dedicated tram lane. Source: Google Maps.
Sustainability 14 00625 g010
Figure 11. Layouts of presignals. Presignals turn red for cars when a bus arrives to it, irrespective of the main signal. That way buses can move through the intersection without encountering almost any traffic. (a) Layout of presignal in Zurich that changes lane allocation. Source: [24] (b) Layout of presignal that changes lane allocation and travel direction. Source: [78].
Sustainability 14 00625 g011
Figure 12. Curbside stops in Zurich. Limiting overtaking, especially when upstream of signalized intersections, can help buses to gain a more advantageous position in the queue when leaving the bus stop. Source: Google maps. (a) Curbside stops for trams and (b) curbside stops for buses with a pedestrian crossing and island next to them.
Sustainability 14 00625 g012
Figure 13. Evolution of transport modal share in the city of Zurich.
Sustainability 14 00625 g013
Table 1. Overview of mobility-related ranking indices for the city of Zurich.
YearIndexSubjectRankSource
2017Arcadissustainable cities mobility2[19]
2018Herepublic transport, transport efficiency, and traffic flow1[20]
2018Mercerquality of living2[21]
2019Omiopublic transport, sharing economy transportation, cost of transportation1[22]
2020IMDsmart city2[23]
Table 2. Evaluation of the implemented design and operations measures with respect to the sustainable transportation cycle introduced in Figure 1.
Design and Operations MeasureIndicators According to Litman and BurwellDetails inMore Efficient SystemsMore Space for other ModesMode ChangeSummary
macroscopic controlclimate change emissions, resource efficiency[5,42,61]+++0“Cars are allowed,
but not congestion”
30 km/h limittransport diversity, nonmotorized planning, noise pollution, safety[54,55,56,84,92]
constant number of parkingnonmotorized planning, land-use impact[25,44,48,93,94]
presignalstransport diversity, nonmotorized planning[24,78,95]+++“Modes are separated
where necessary”
use of turning lanetransport diversity, nonmotorized planning[72,78,96]
bidirectional bus lanestransport diversity, resource efficiency, land-use impact[97]
short traffic signal cyclestransport diversity, community liveability[98]++++“Pedestrians and public
transport always go first”
absolute priority for public transporttransport diversity, resource efficiency[71,99]
Publisher’s Note: MDPI stays neutral with regard to jurisdictional claims in published maps and institutional affiliations.

