
Designing and Energy Estimation of Photovoltaic Energy Generation System and Prediction of Plant Performance with the Variation of Tilt Angle and Interrow Spacing

 ,
,  ,
,  ,
,  ,
,  and
and 
Abstract
:1. Introduction
- (1)
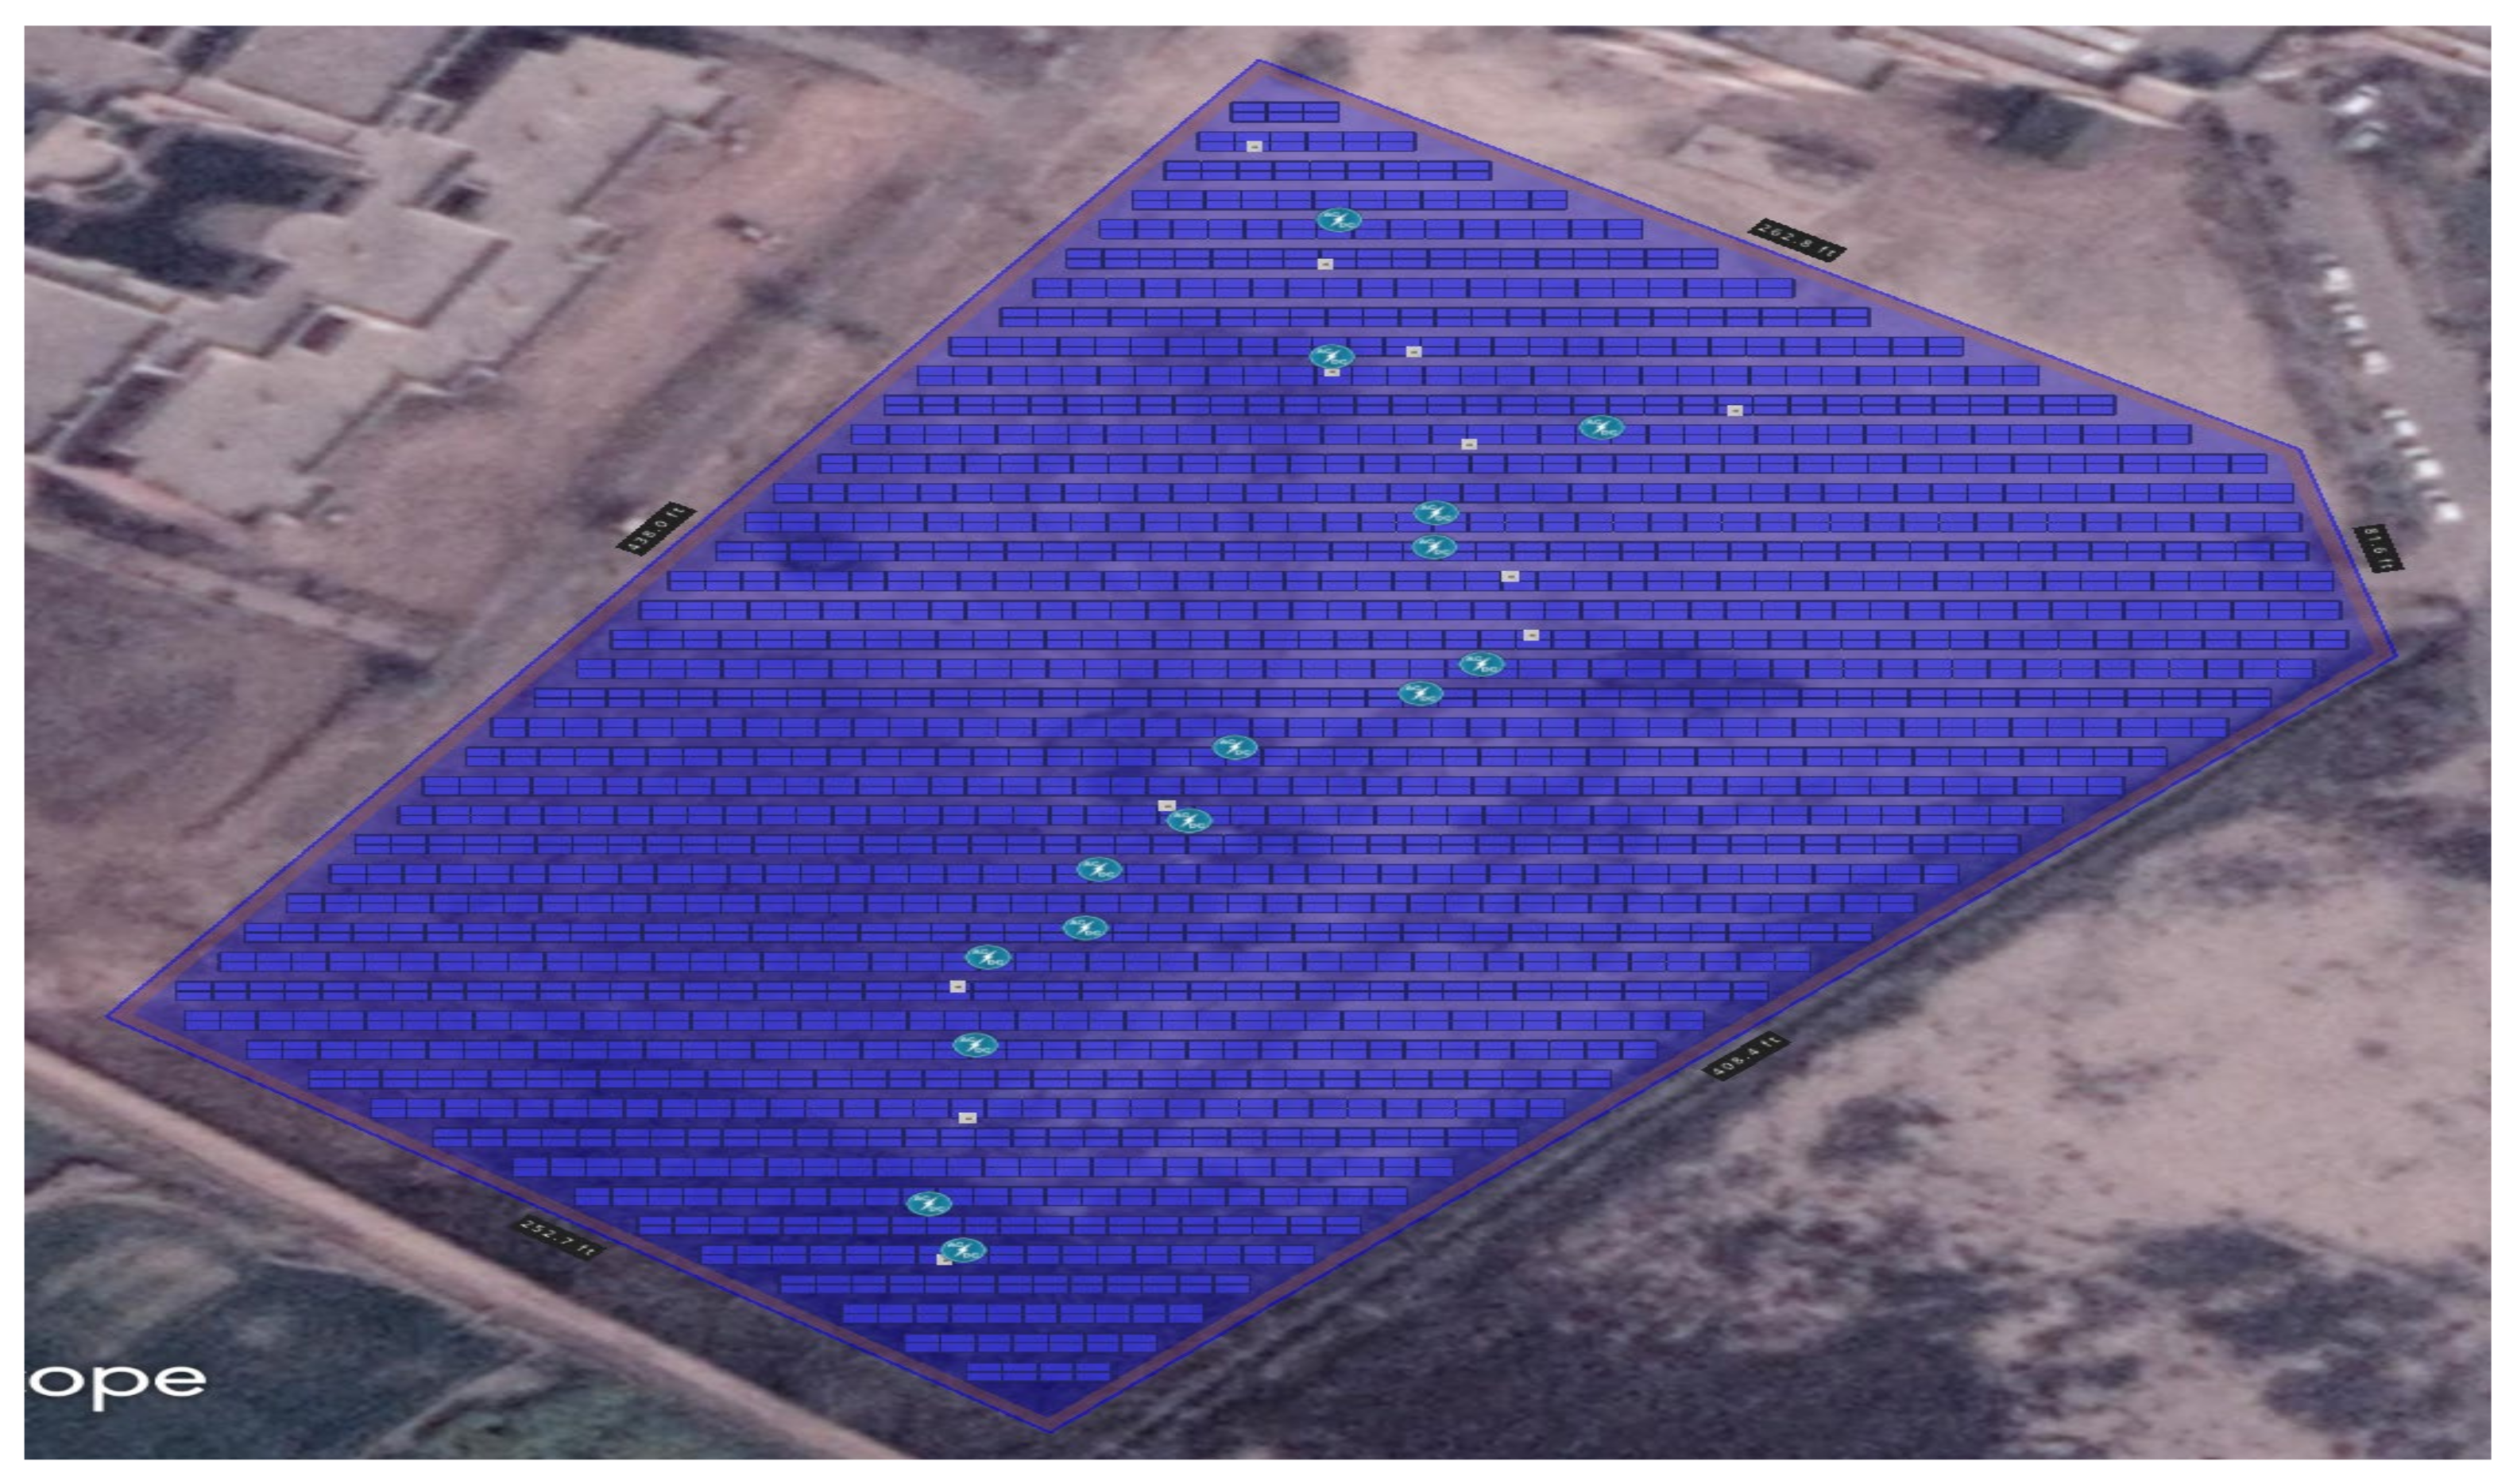
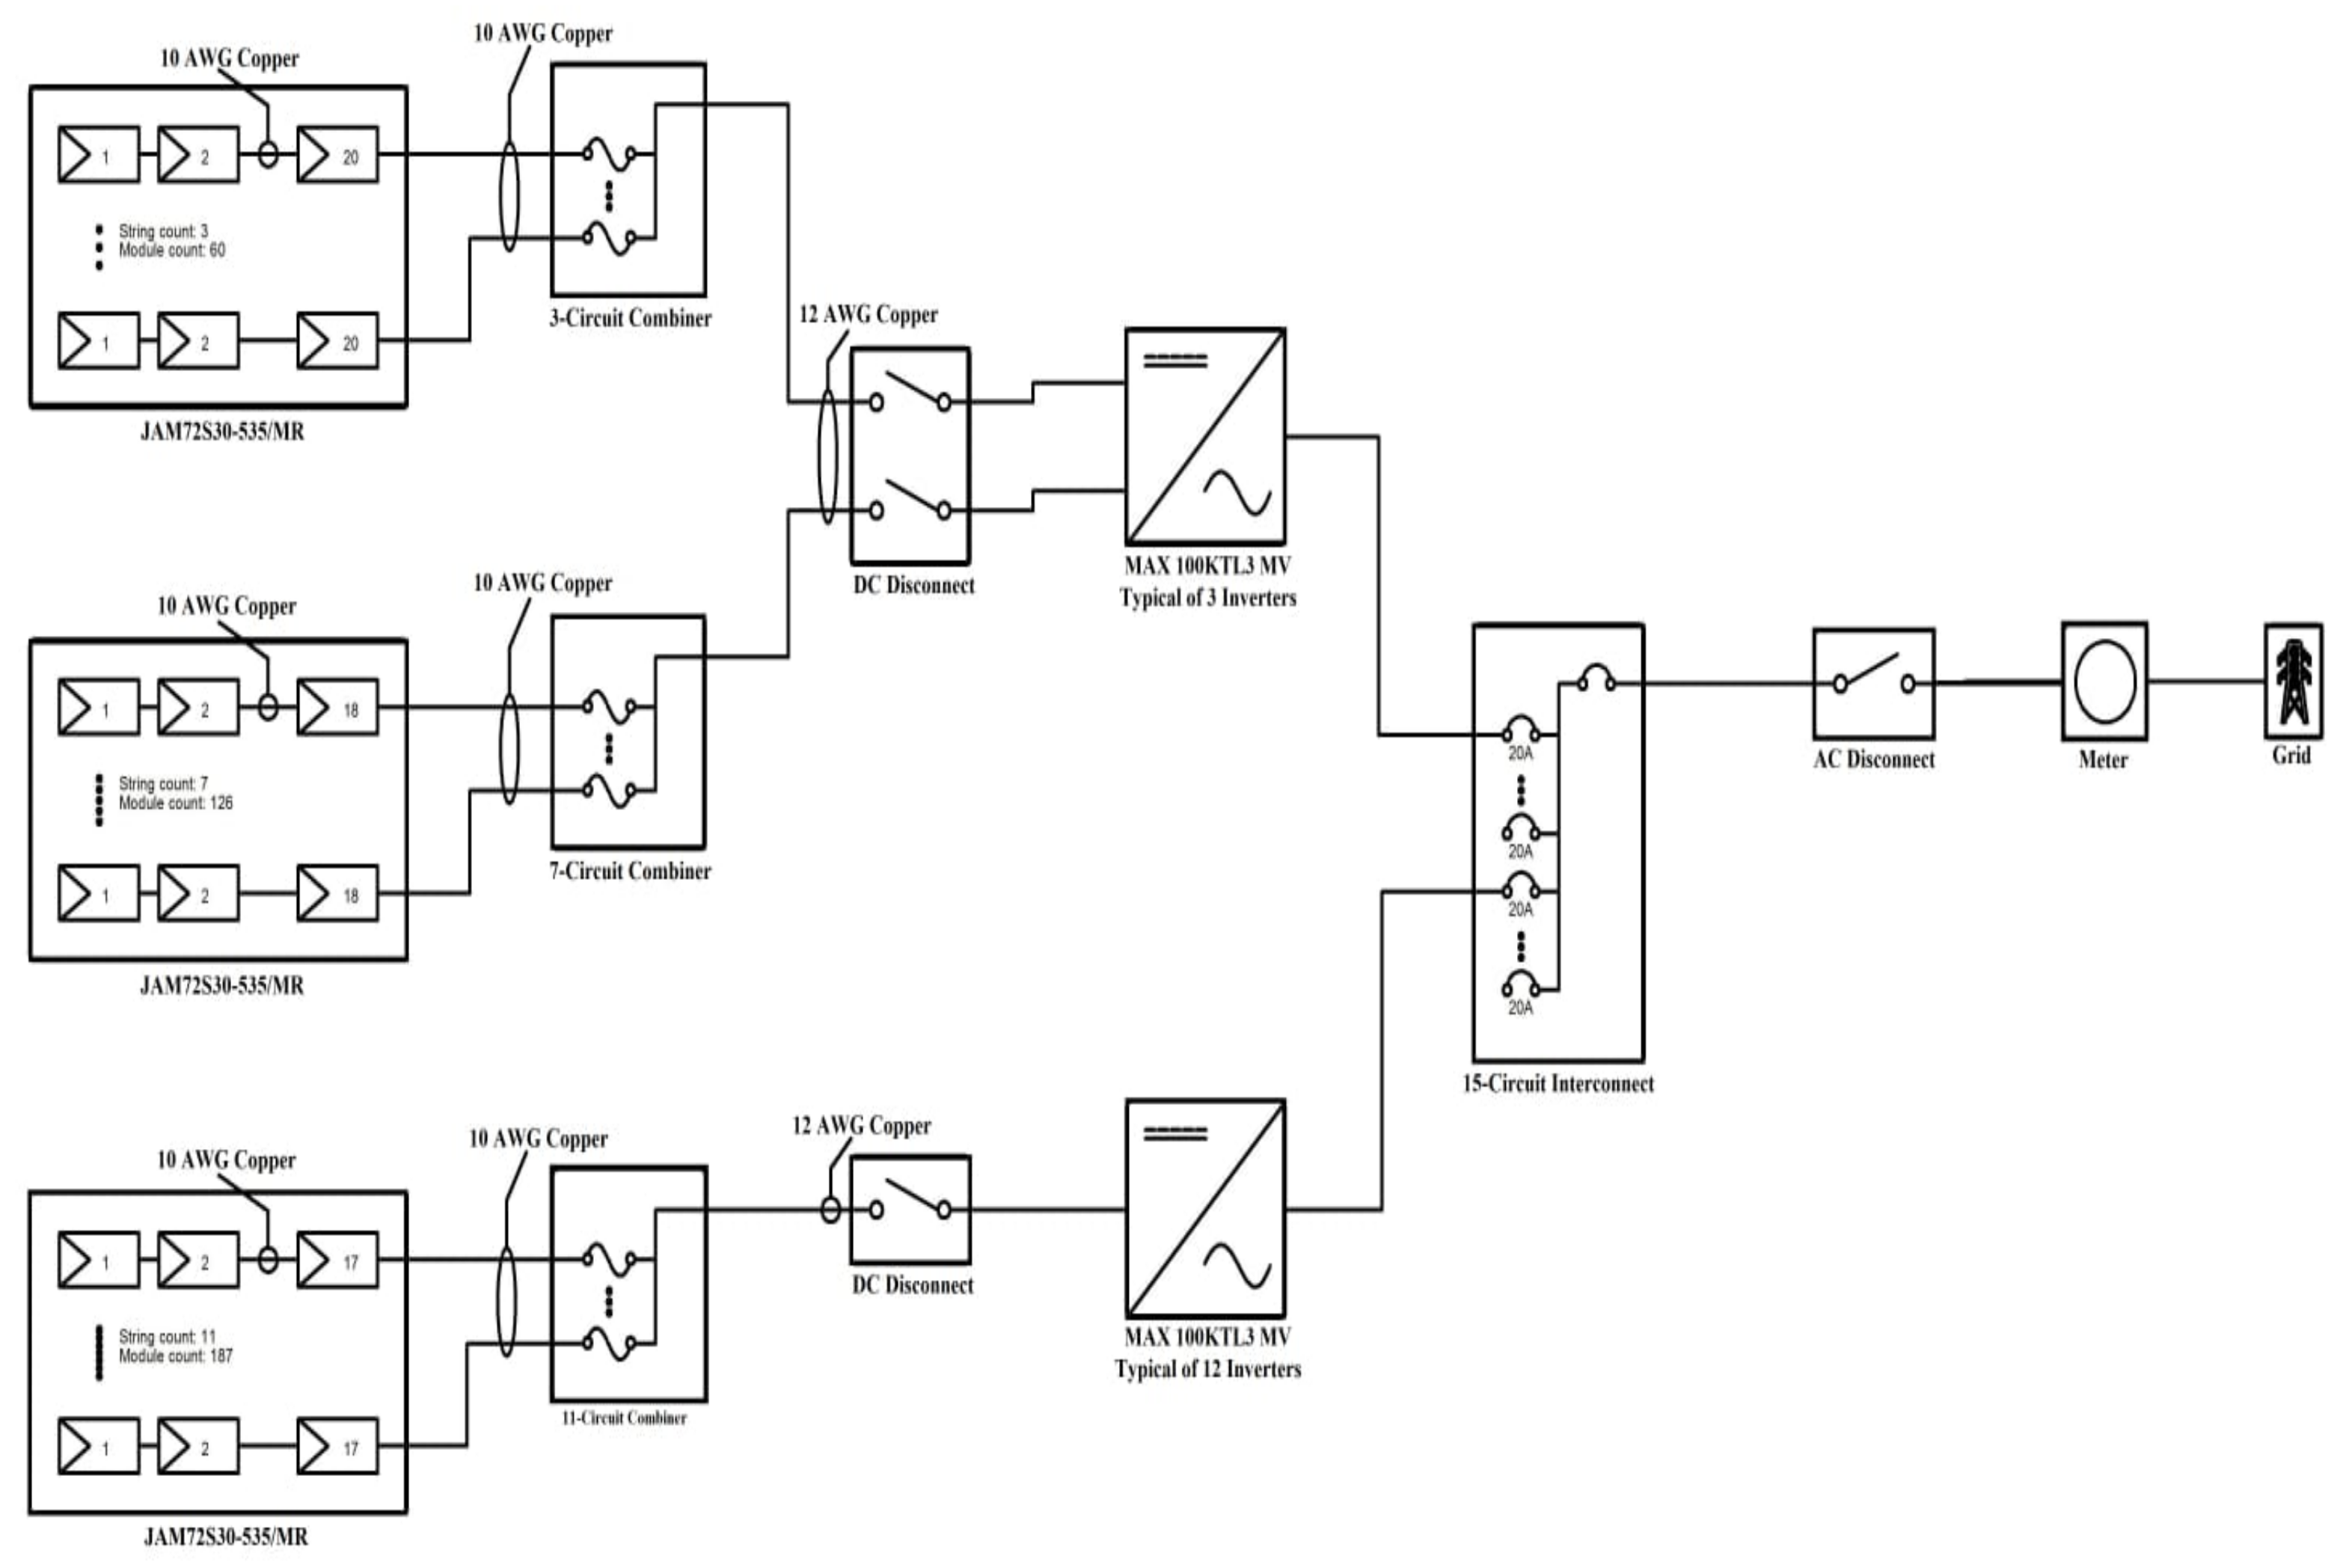
- Modeling of a ground-mounted photovoltaic (PV) system to meet the high demand of electrical energy.
- (2)
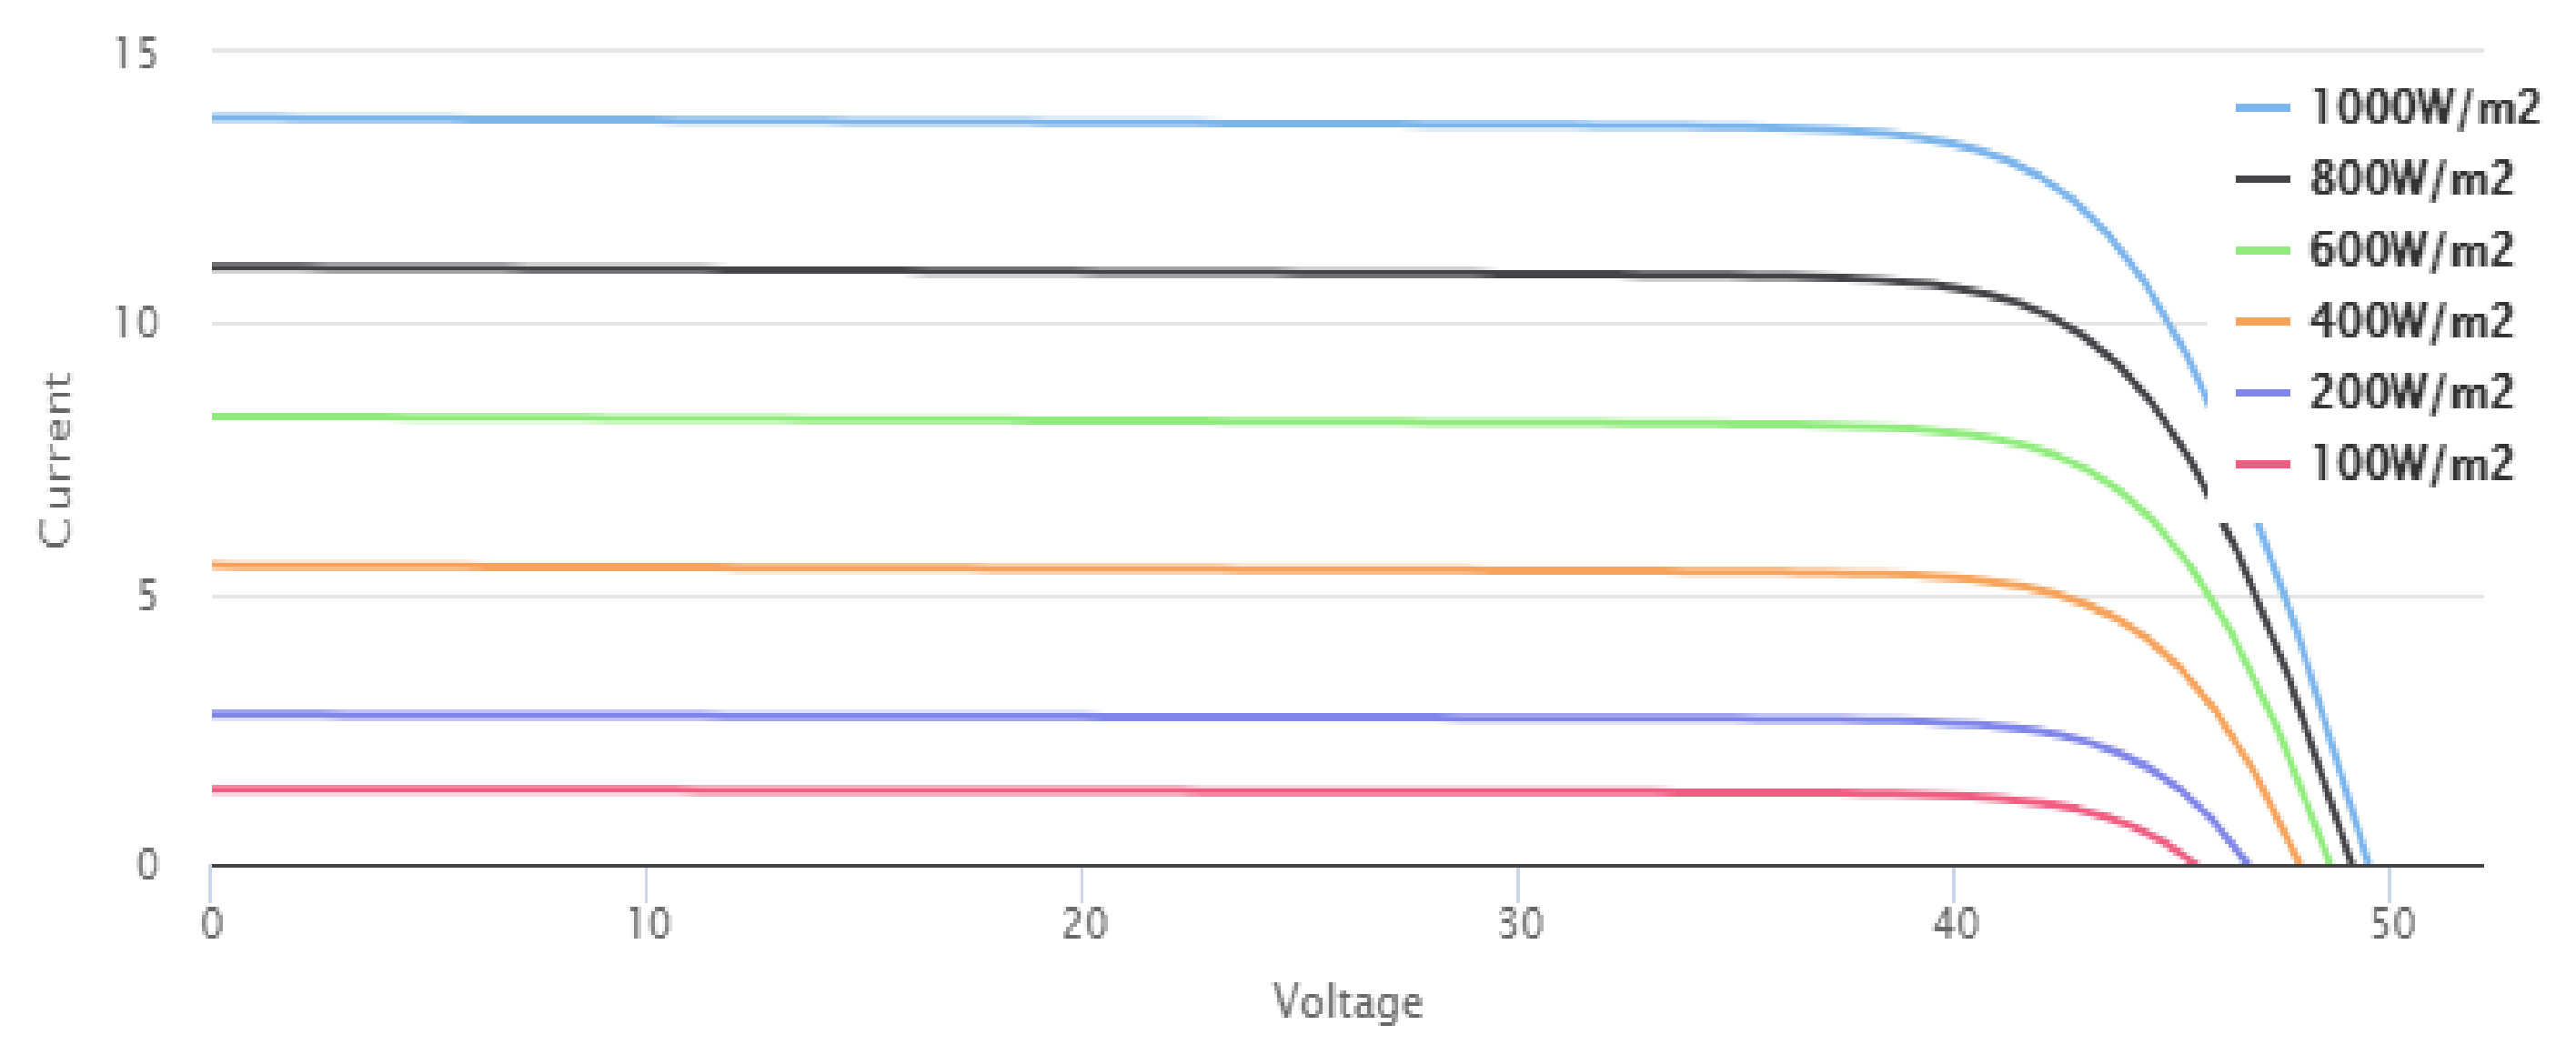
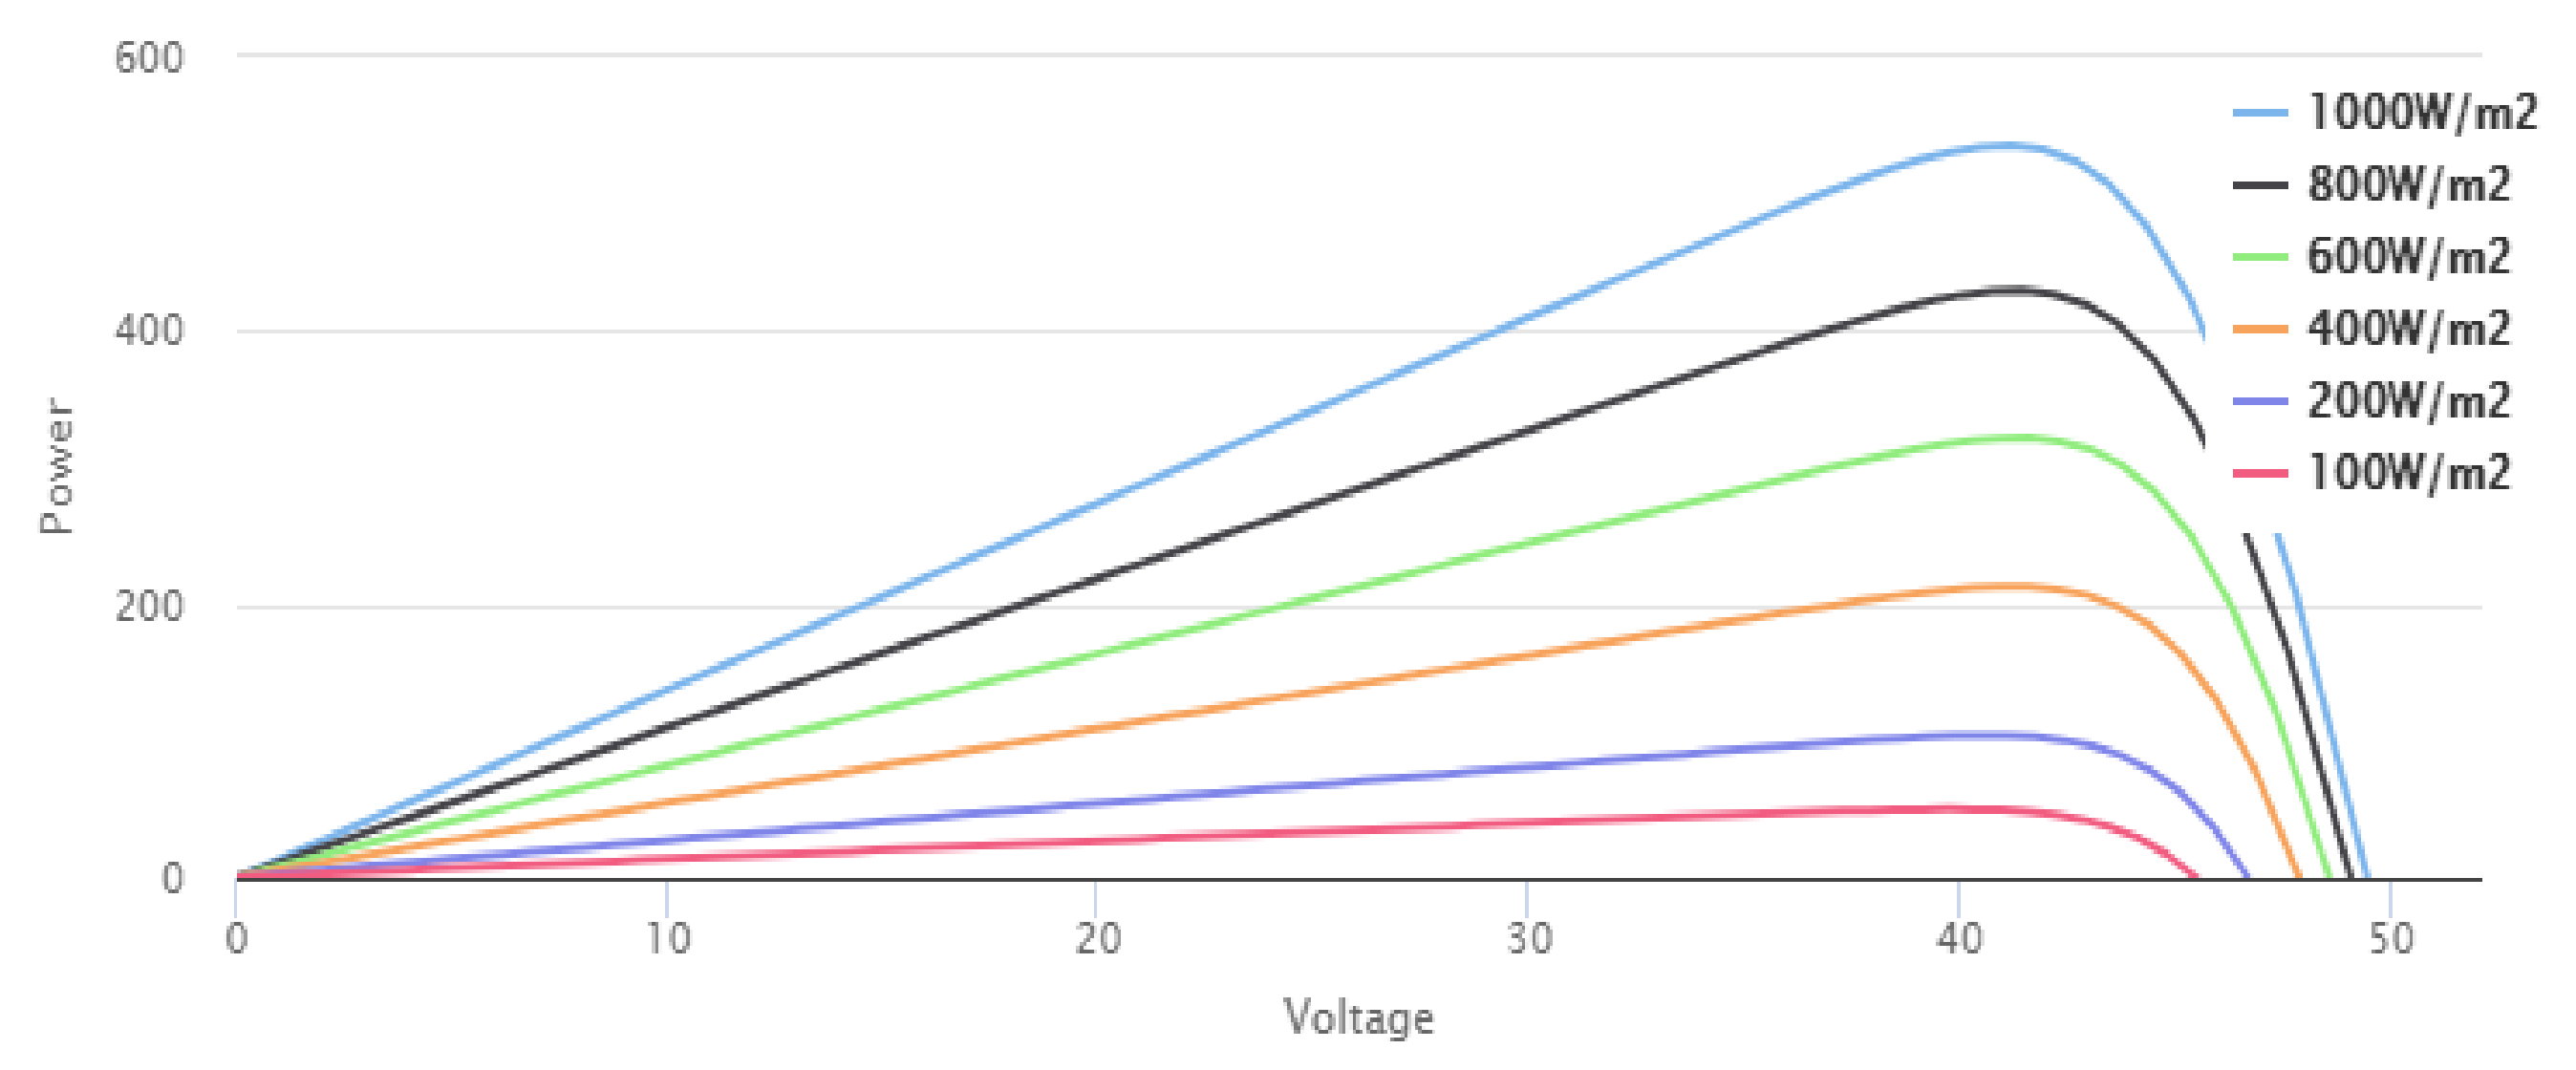
- Analysis of photovoltaic module’s performance, current-voltage and power-voltage curves for different irradiance levels.
- (3)
- Solar resource assessment using Meteonorm software database.
- (4)
- Comparative study of the PV system is performed to identify the optimal interrow spacing for each tilt angle.
- (5)
- Performed analysis of the PV system installed at different tilt angles to find optimal tilt angle for proposed site.
- (6)
- Studied PV system’s performance in terms of annual generation, system losses and performance ratio.
- (7)
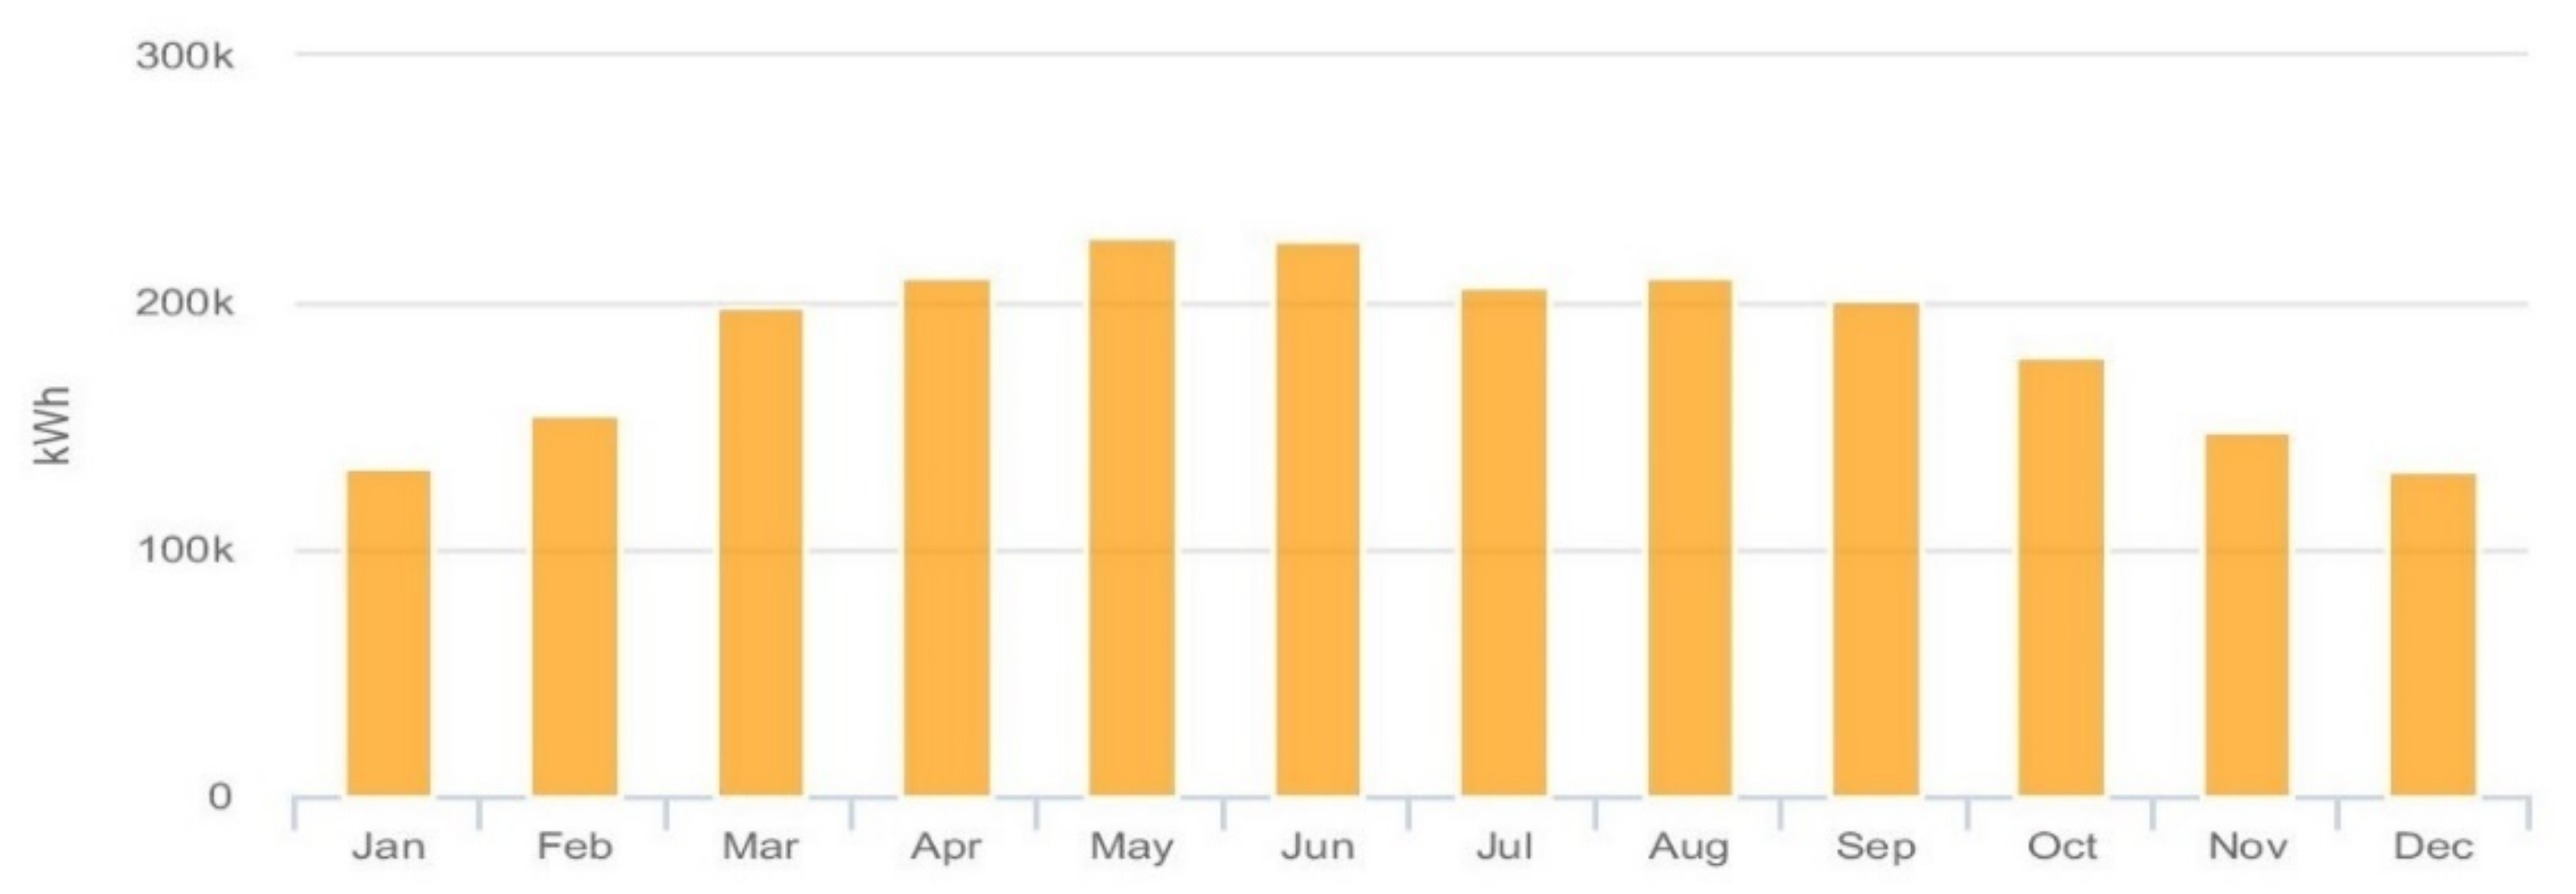
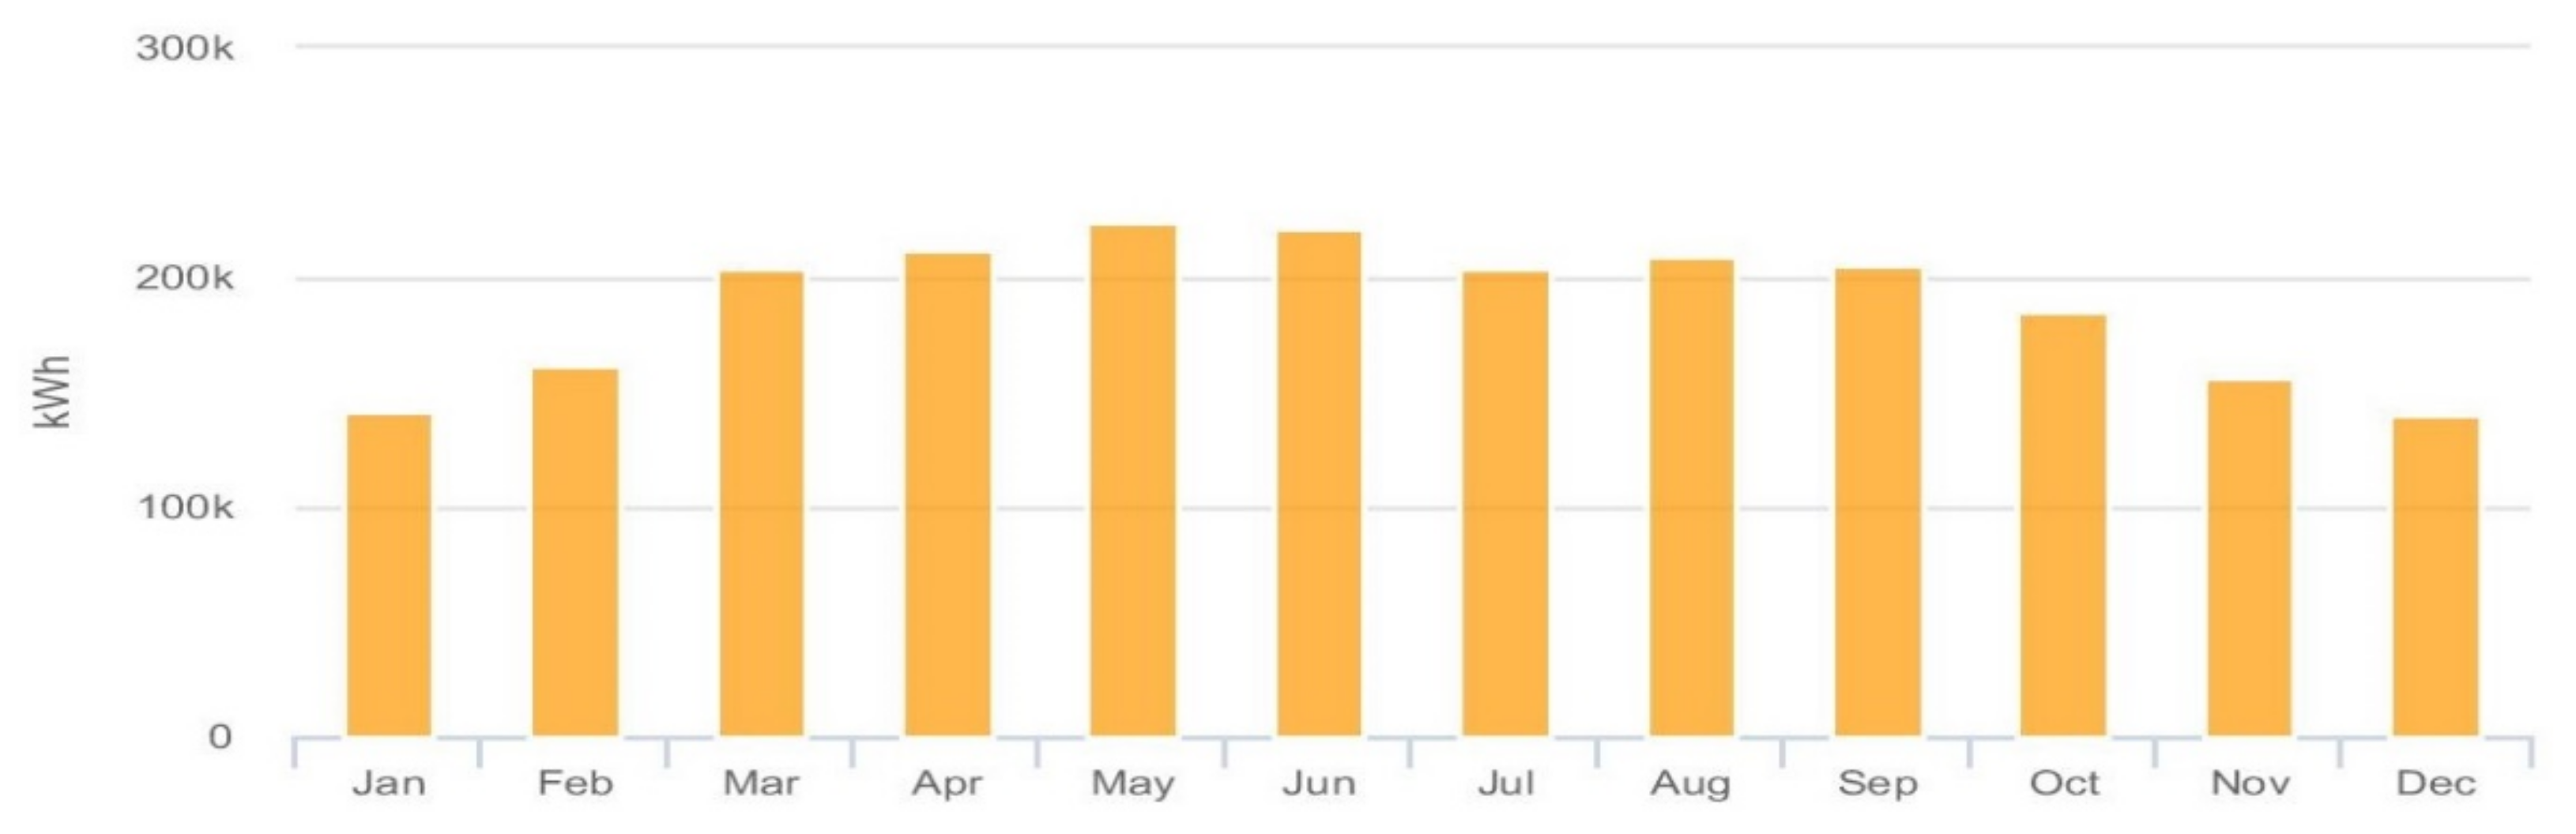
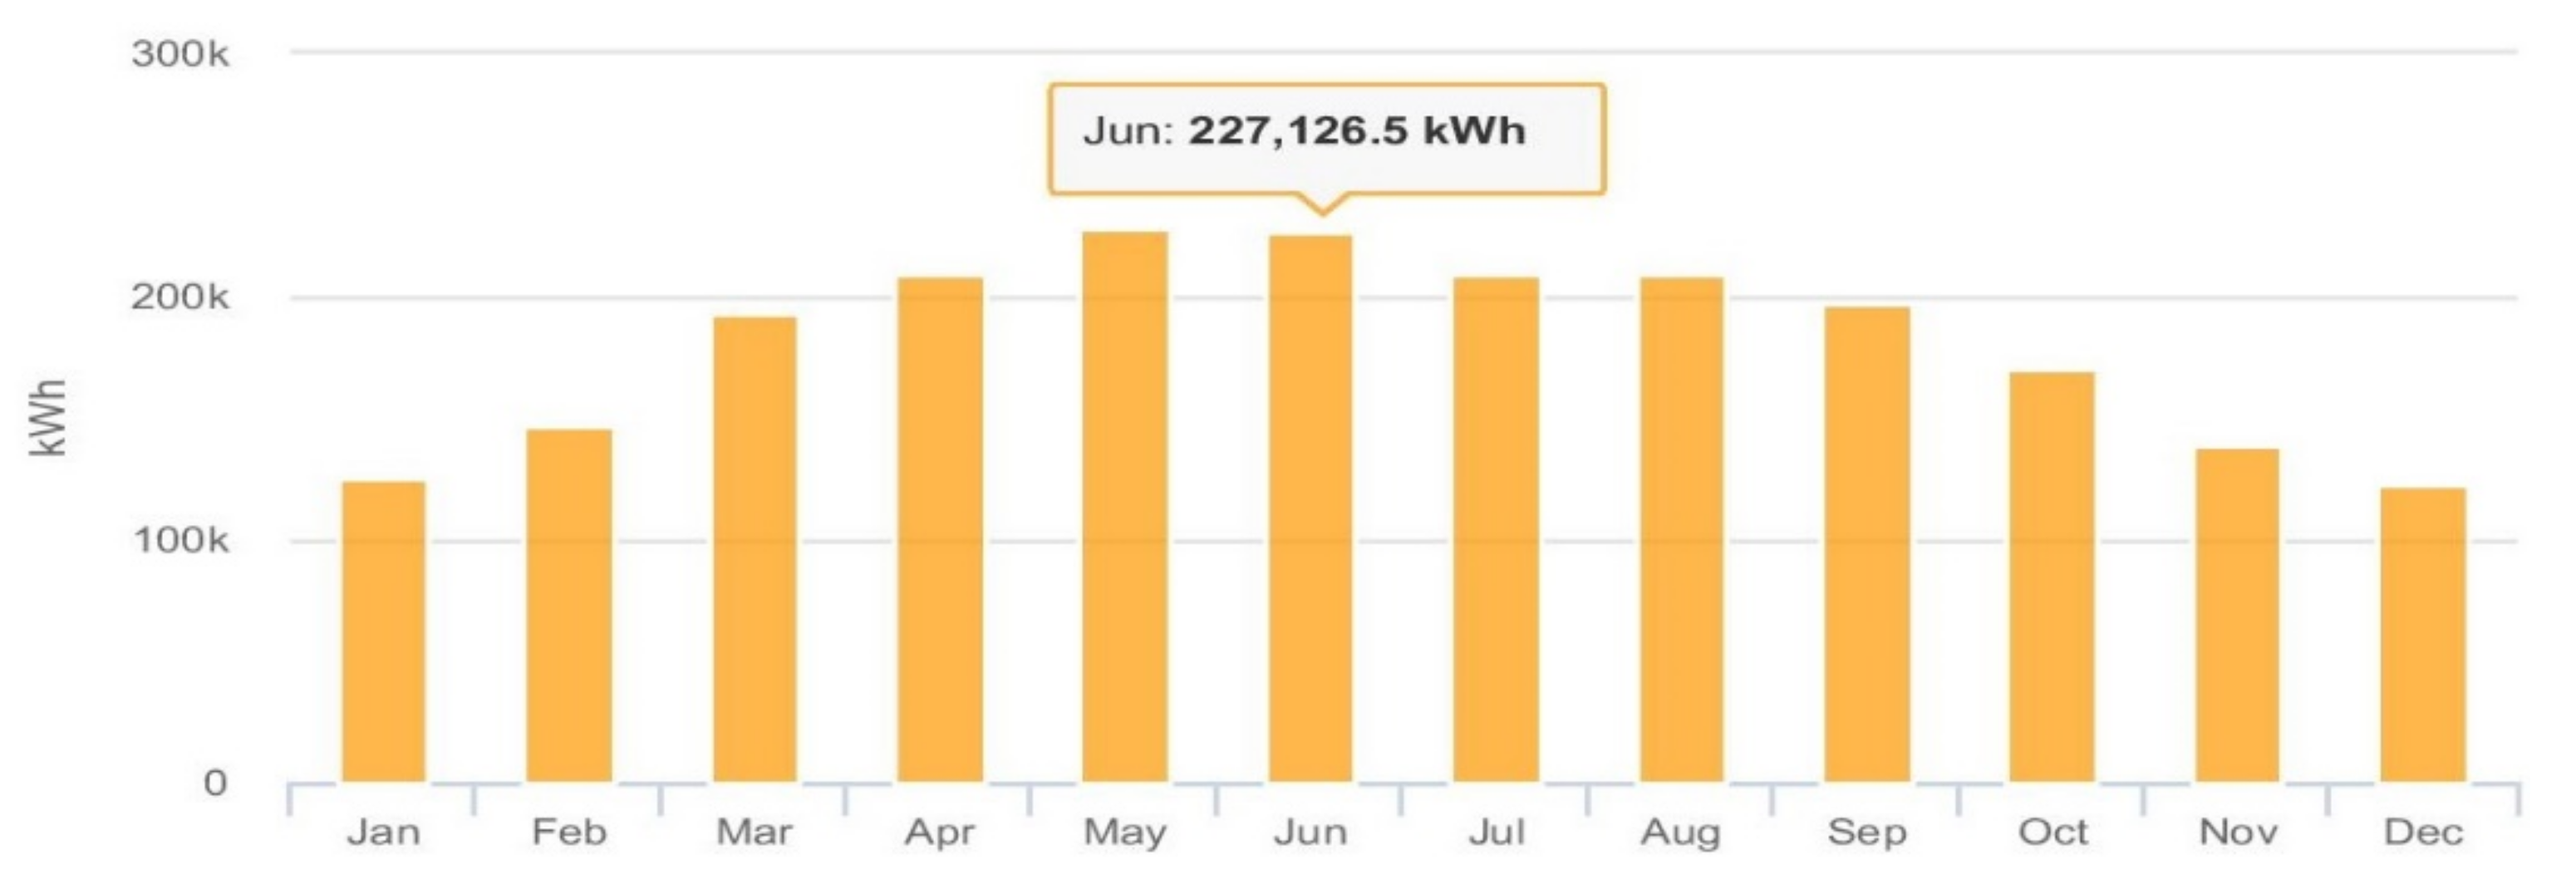
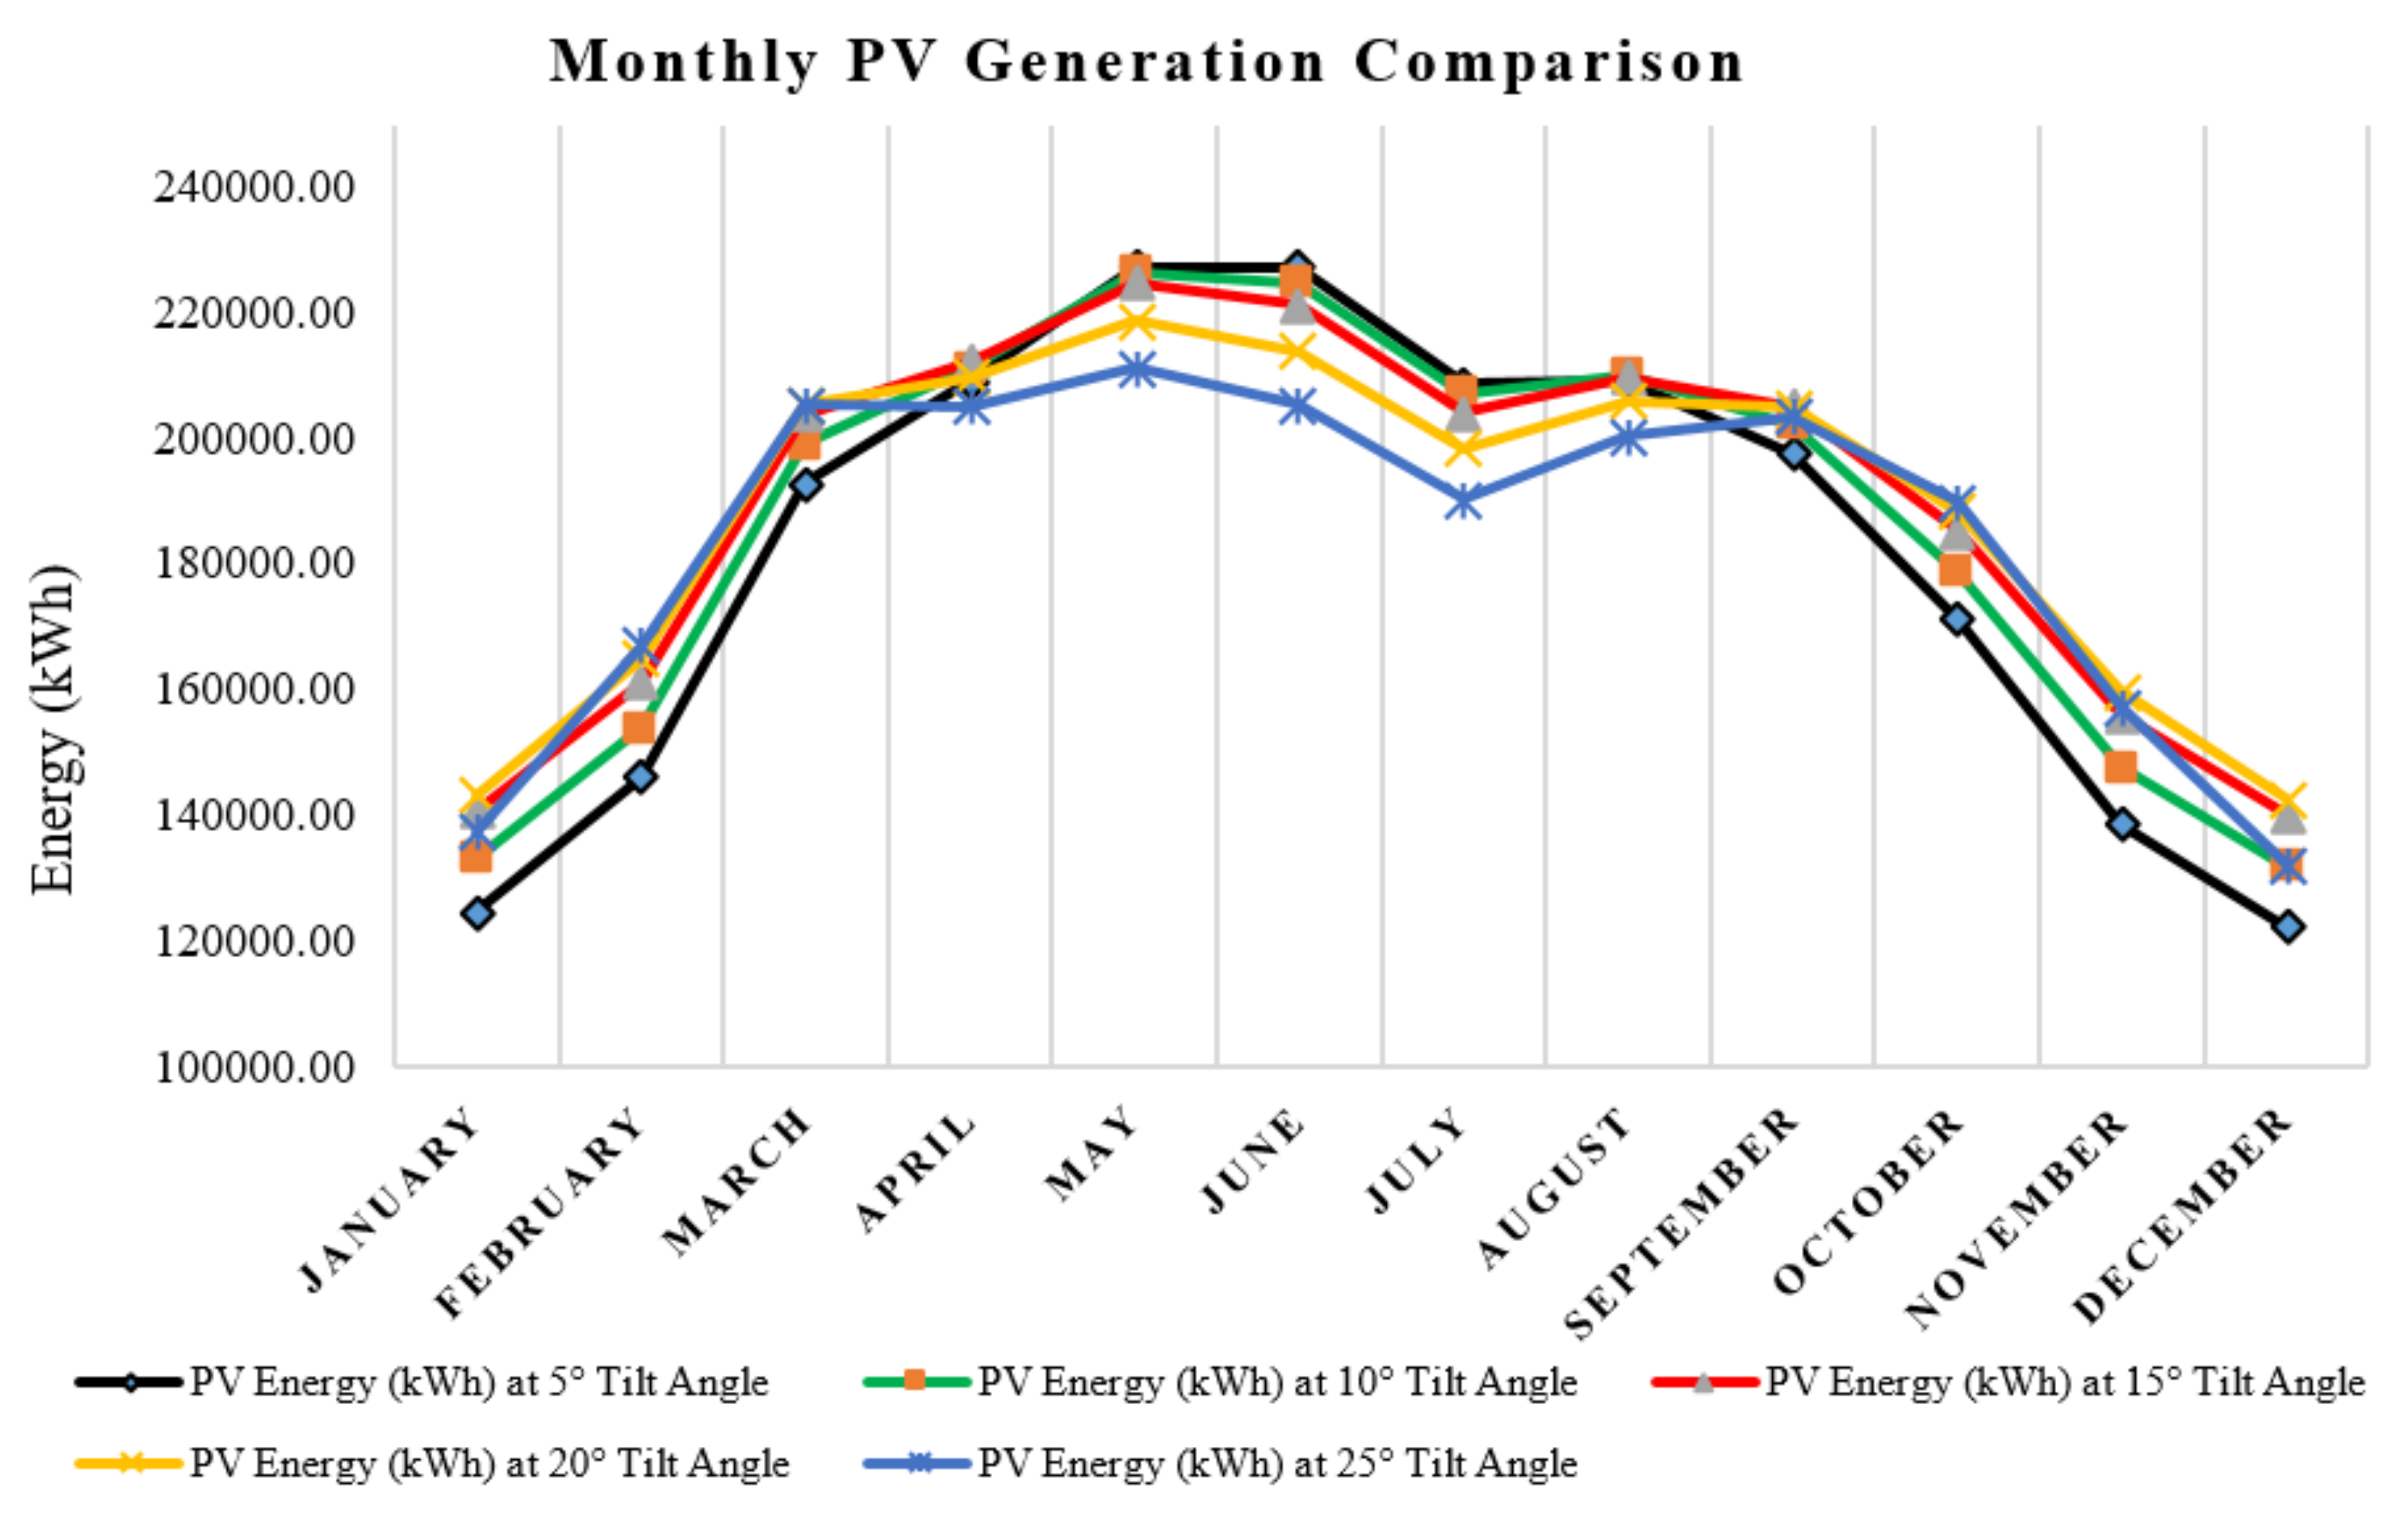
- Comparison of monthly energy generation (kWh) for different tilt angles.
- (8)
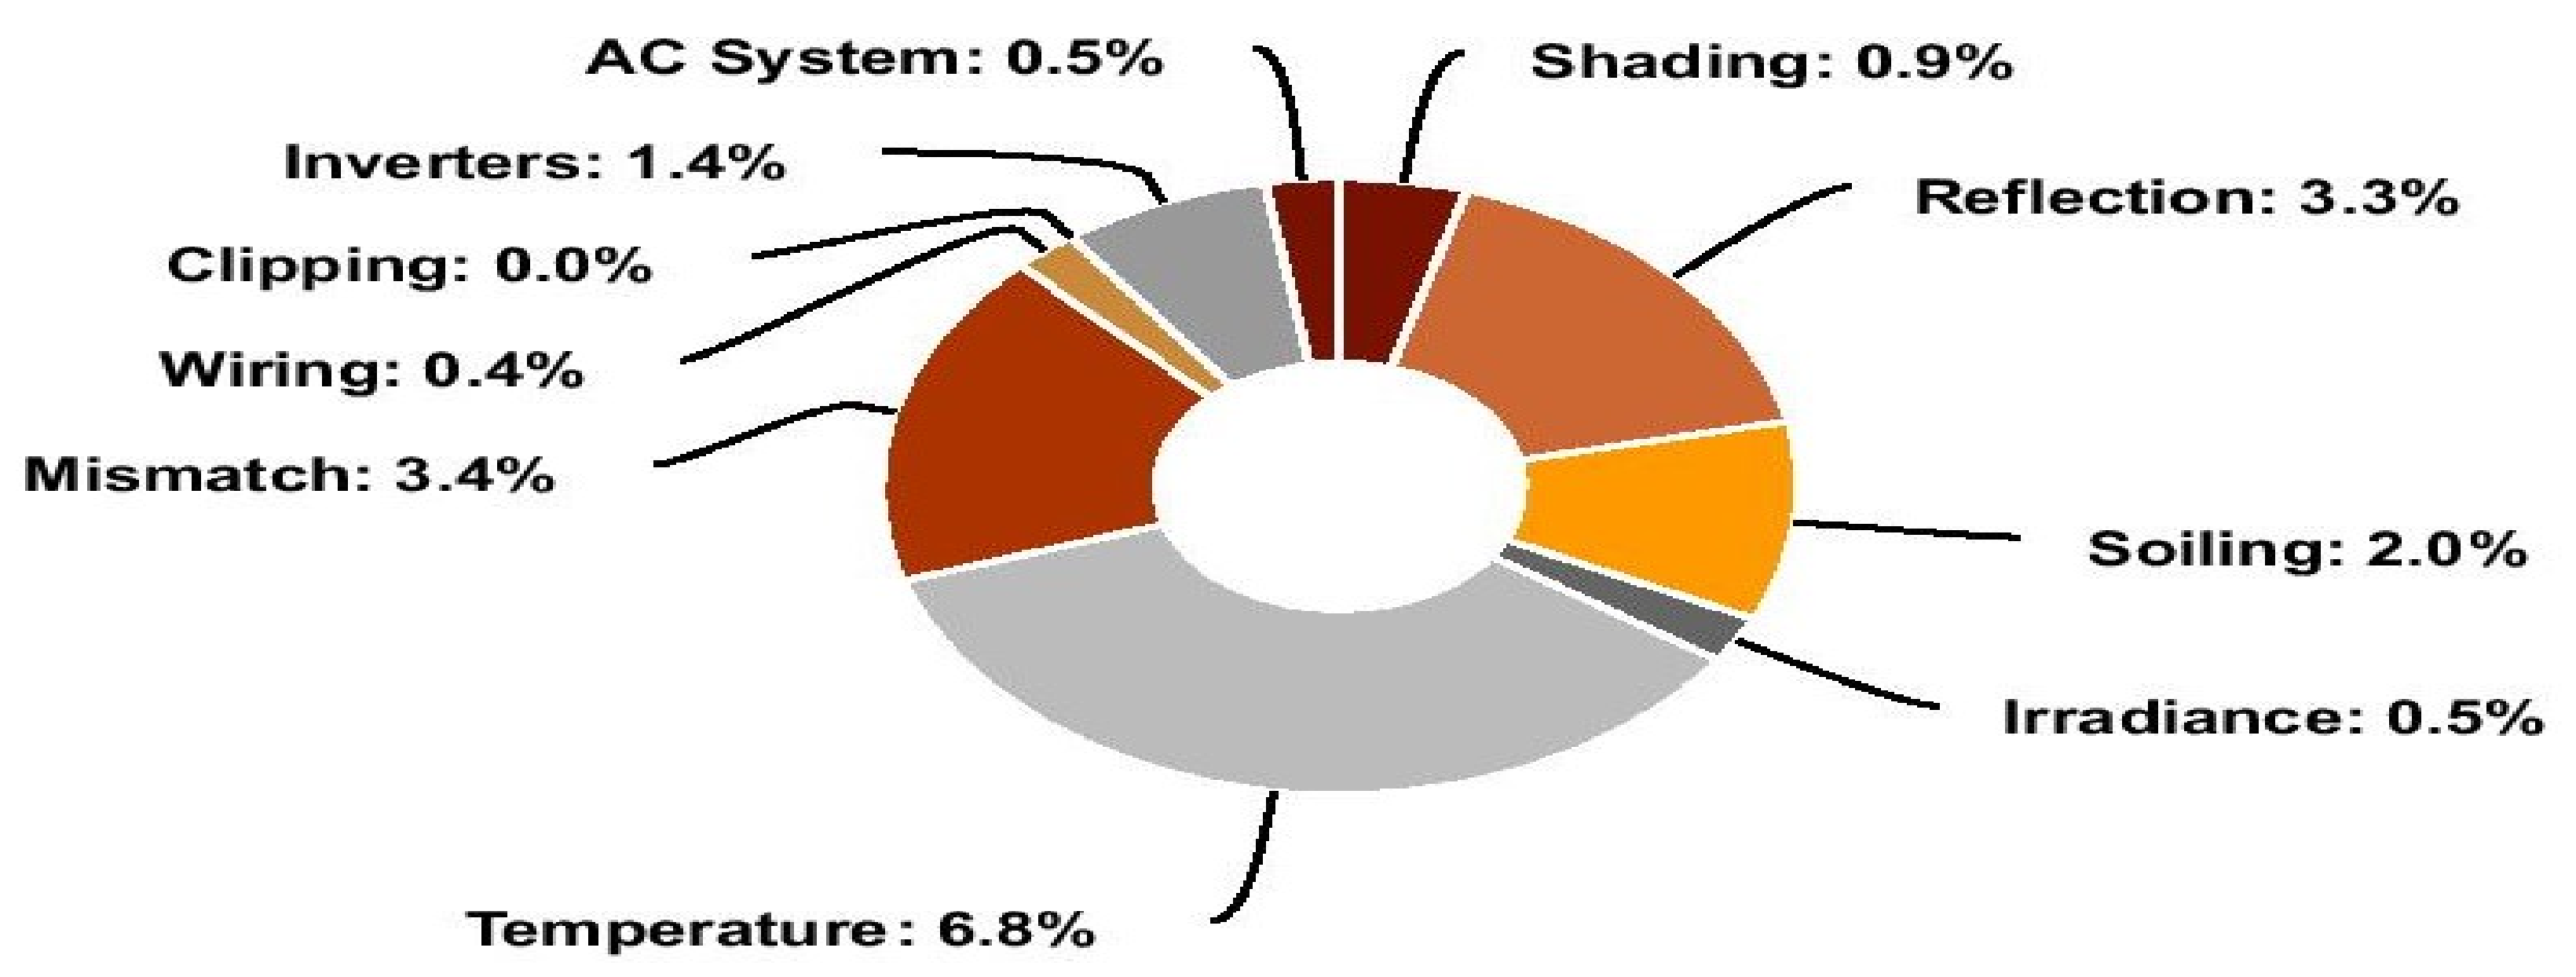
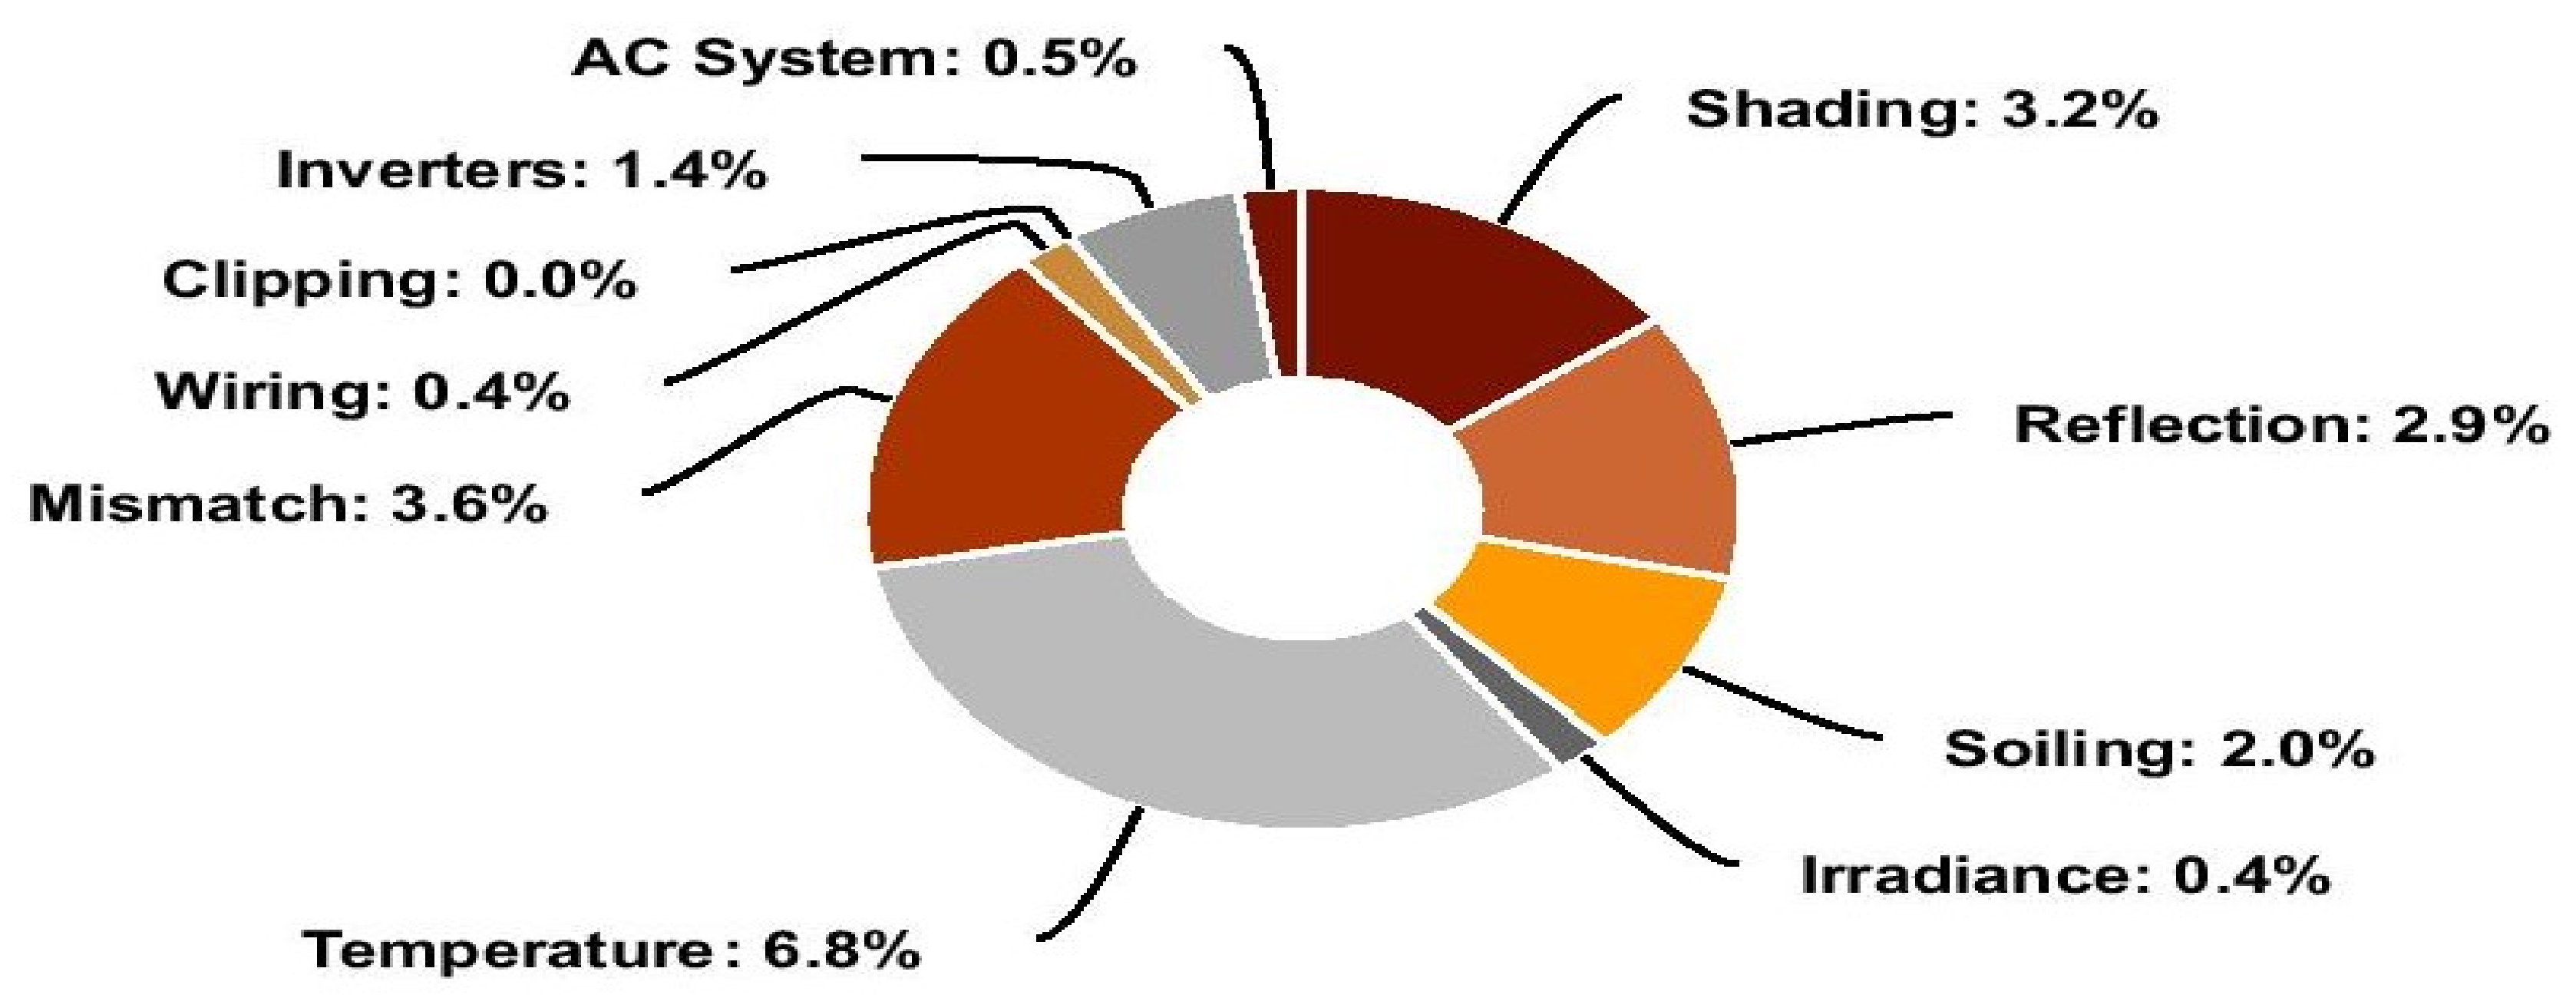
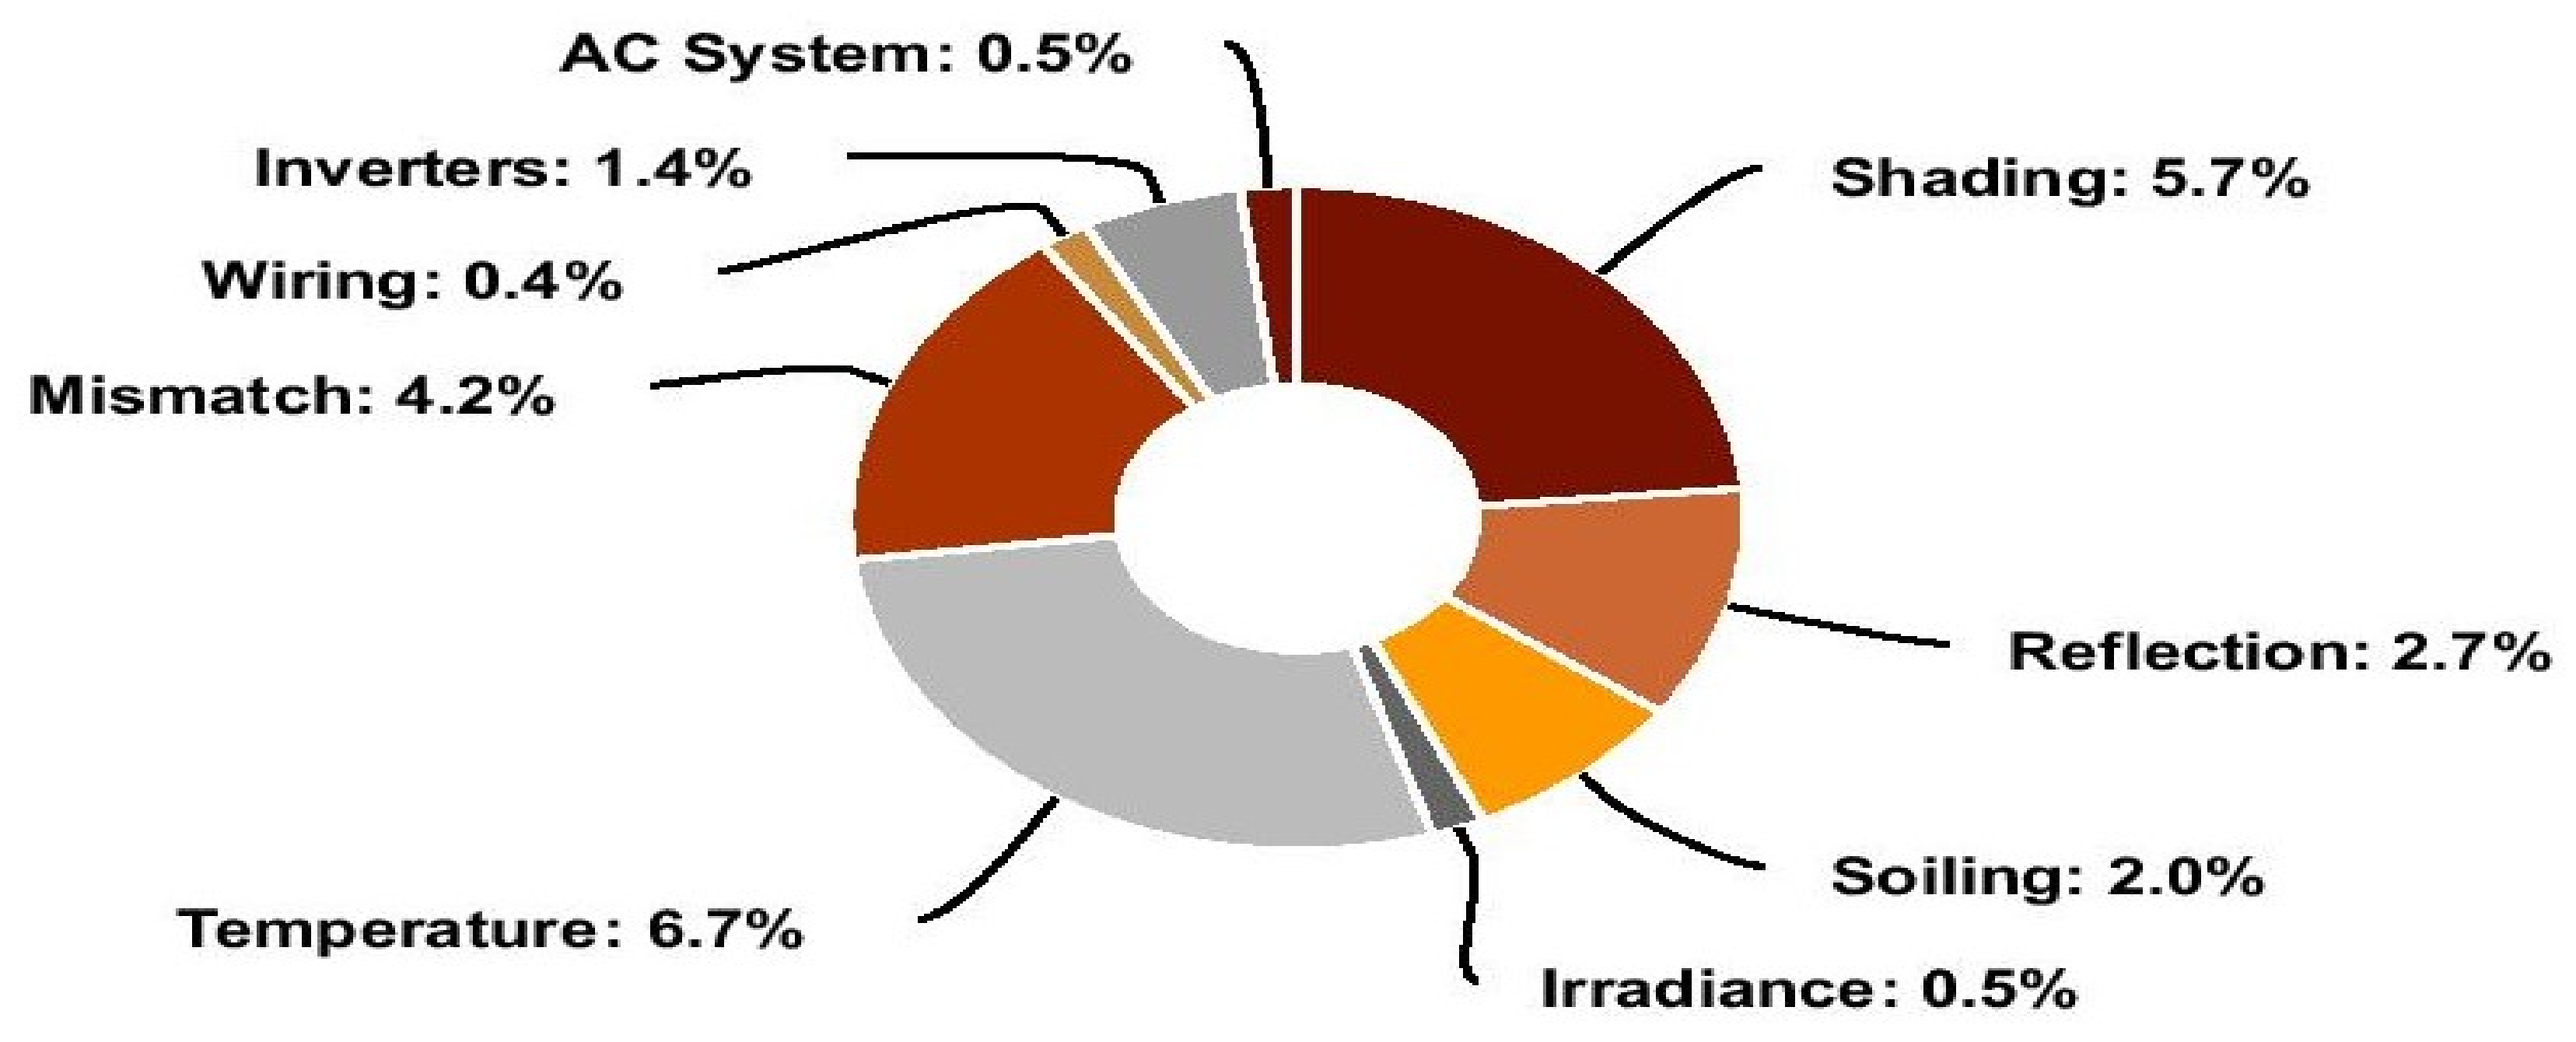
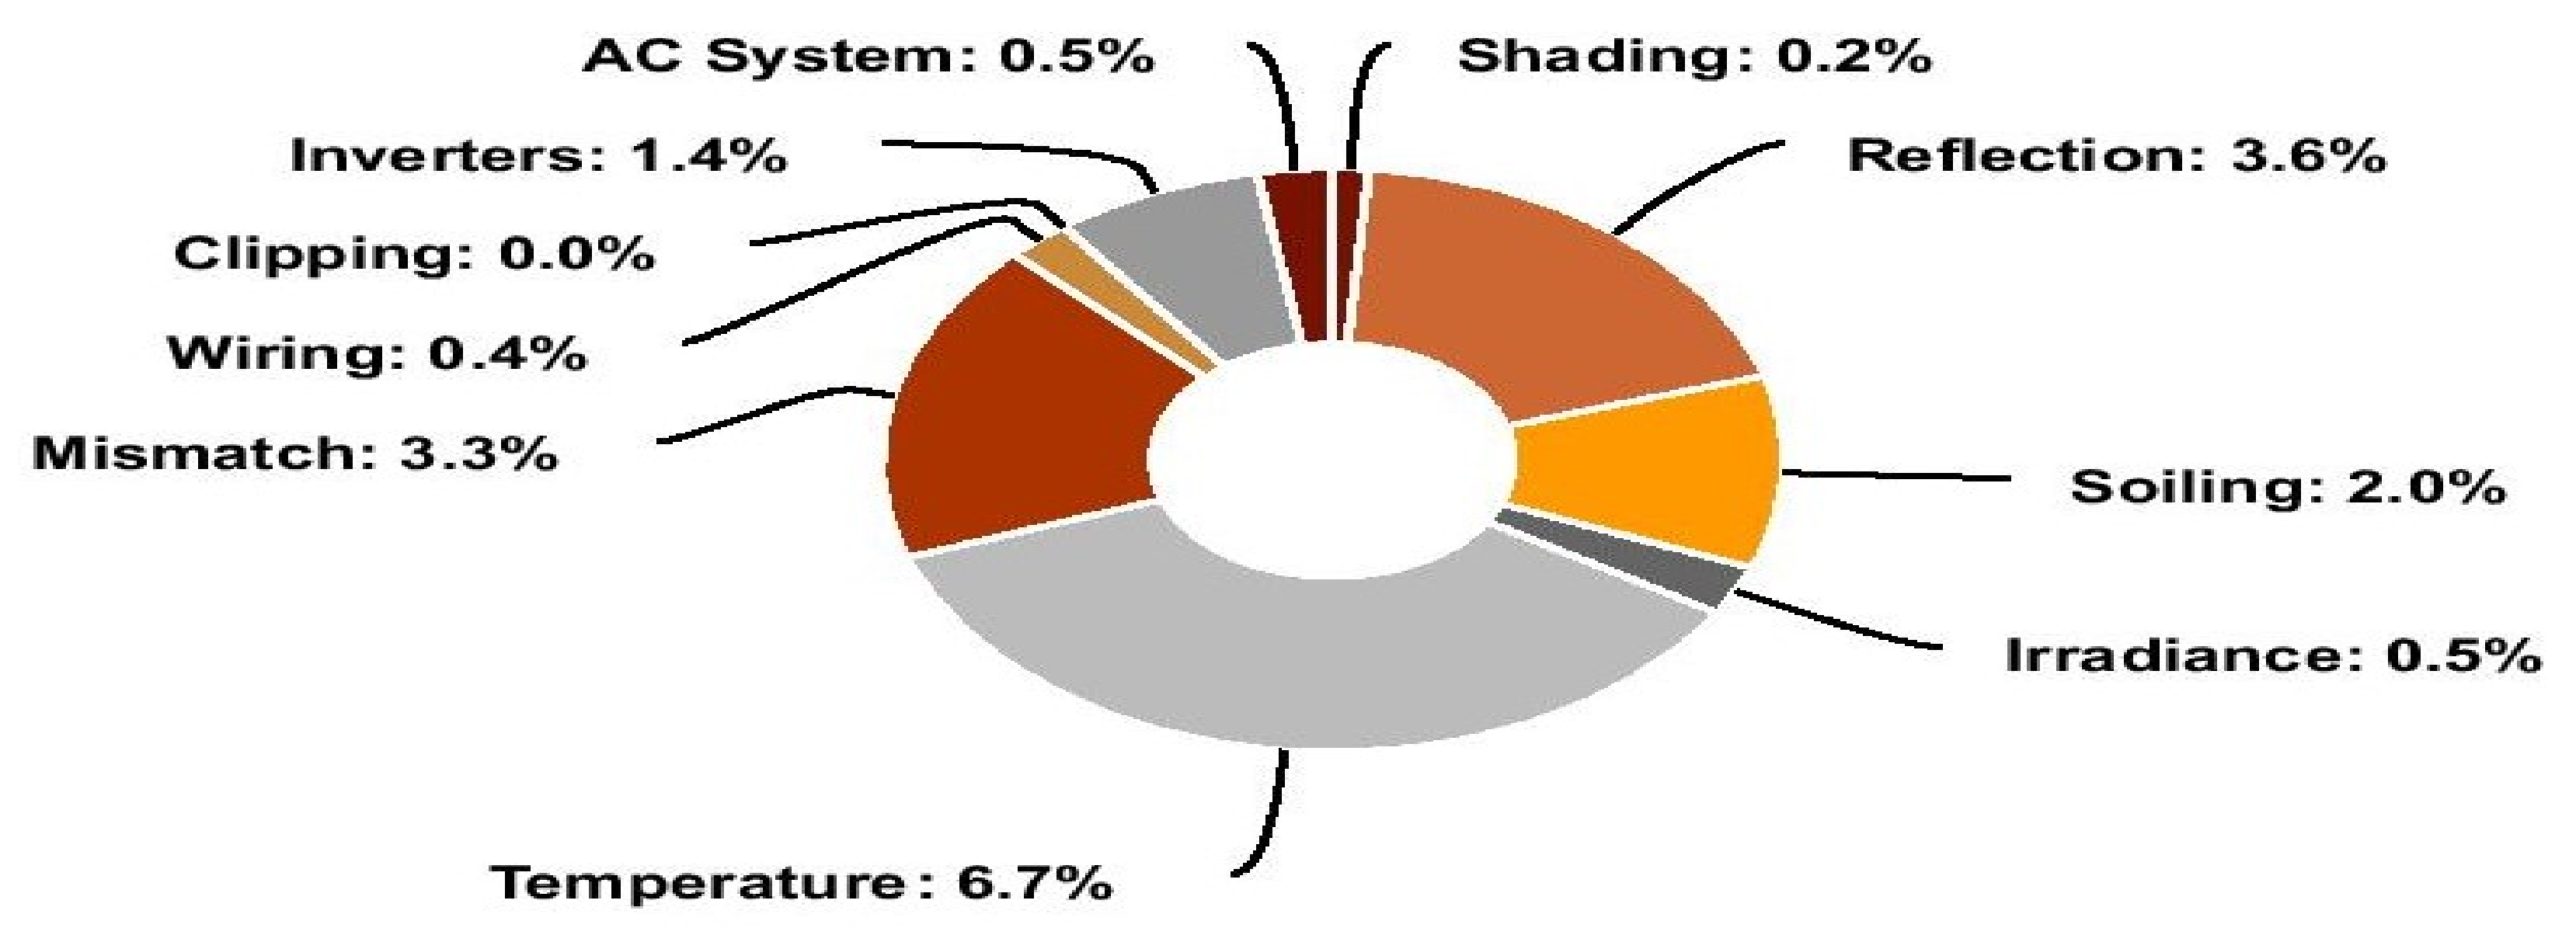
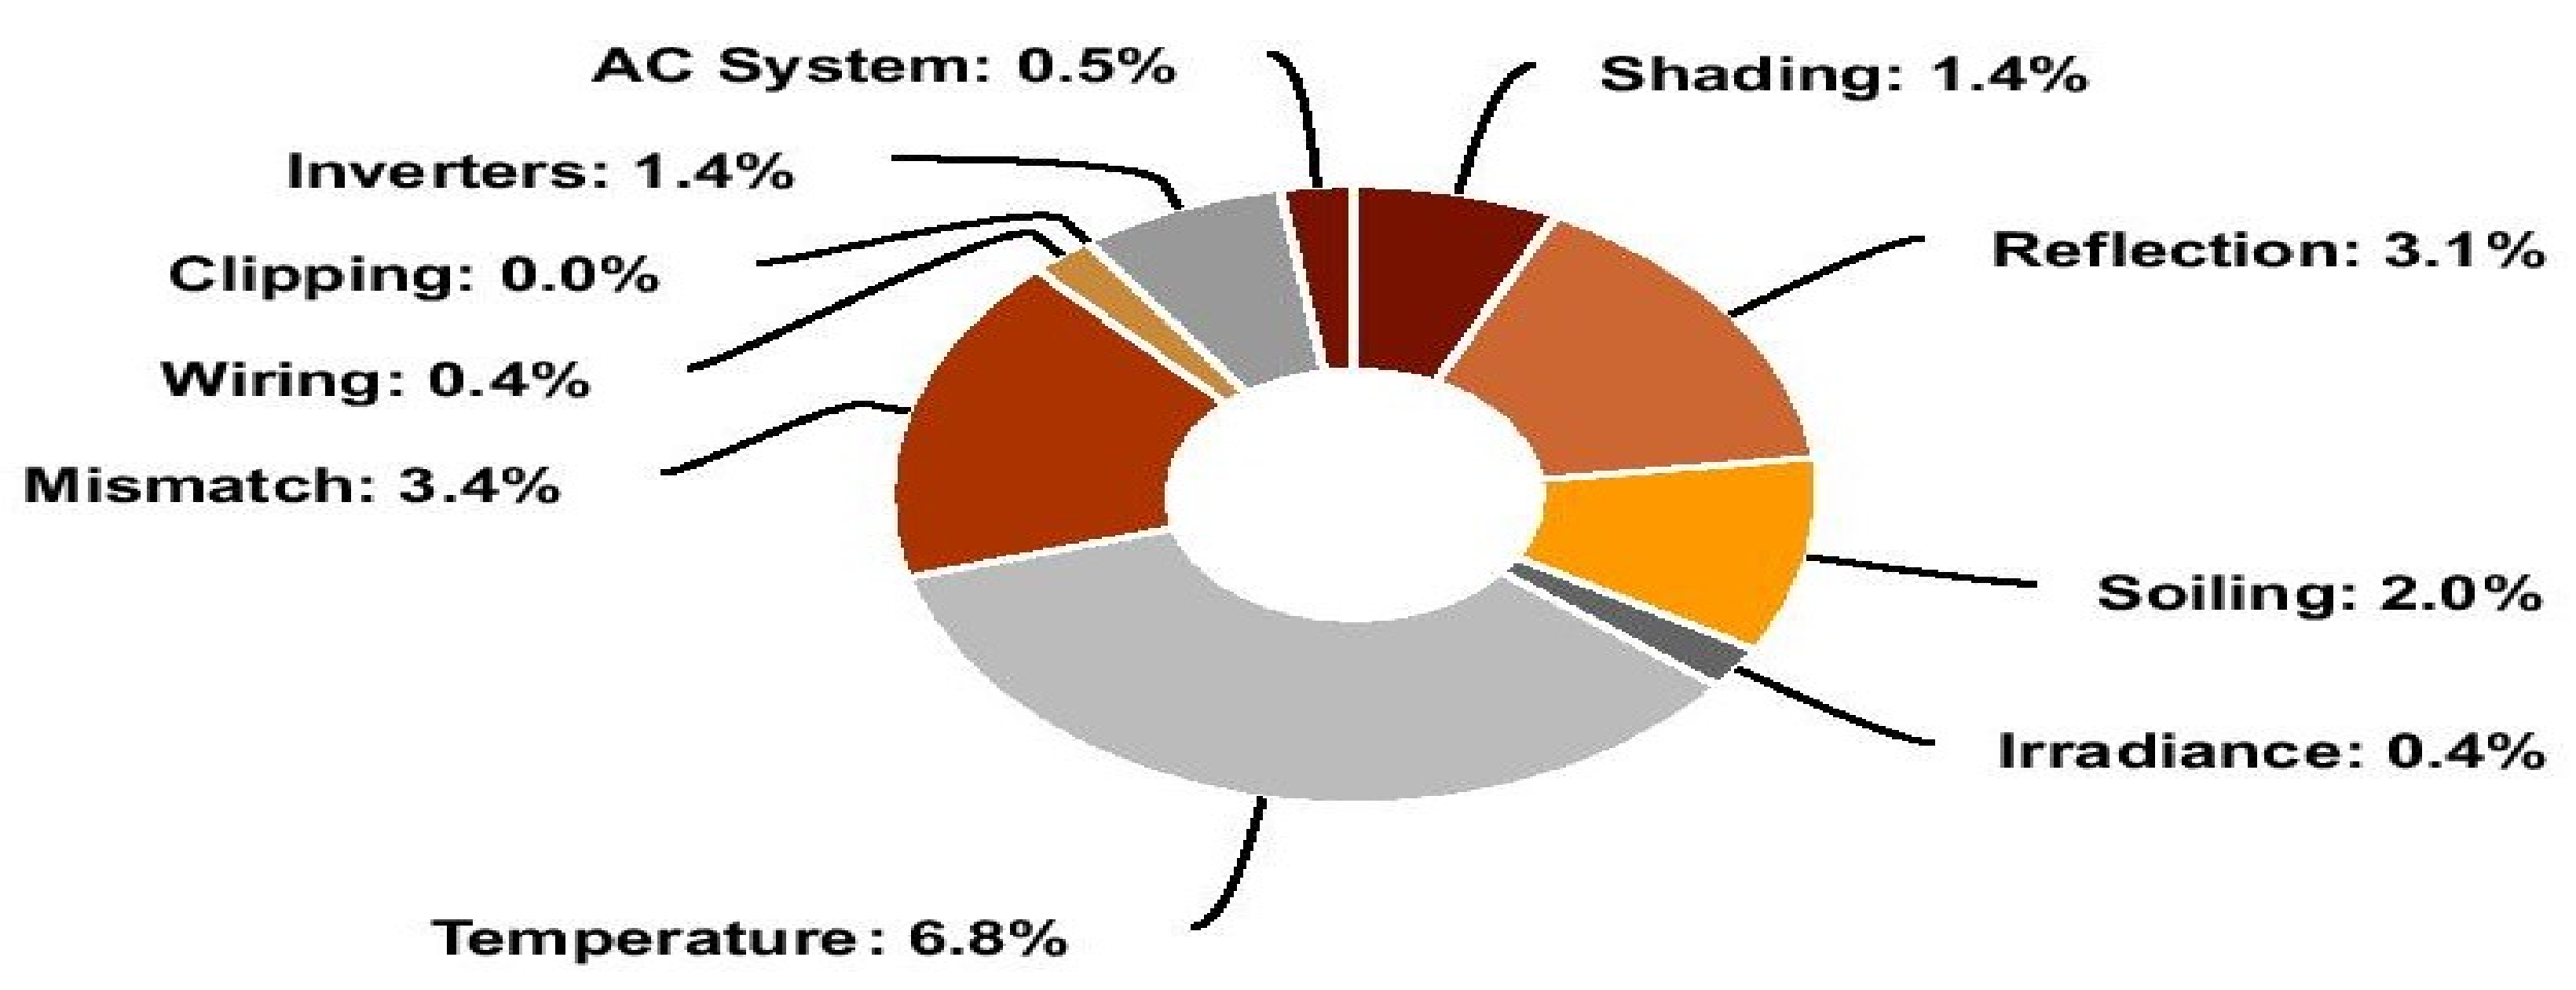
- Analysis of energy system losses under various conditions such as shading, reflection, soiling, irradiance, temperature, mismatch, wiring, and clipping, etc.
- (9)
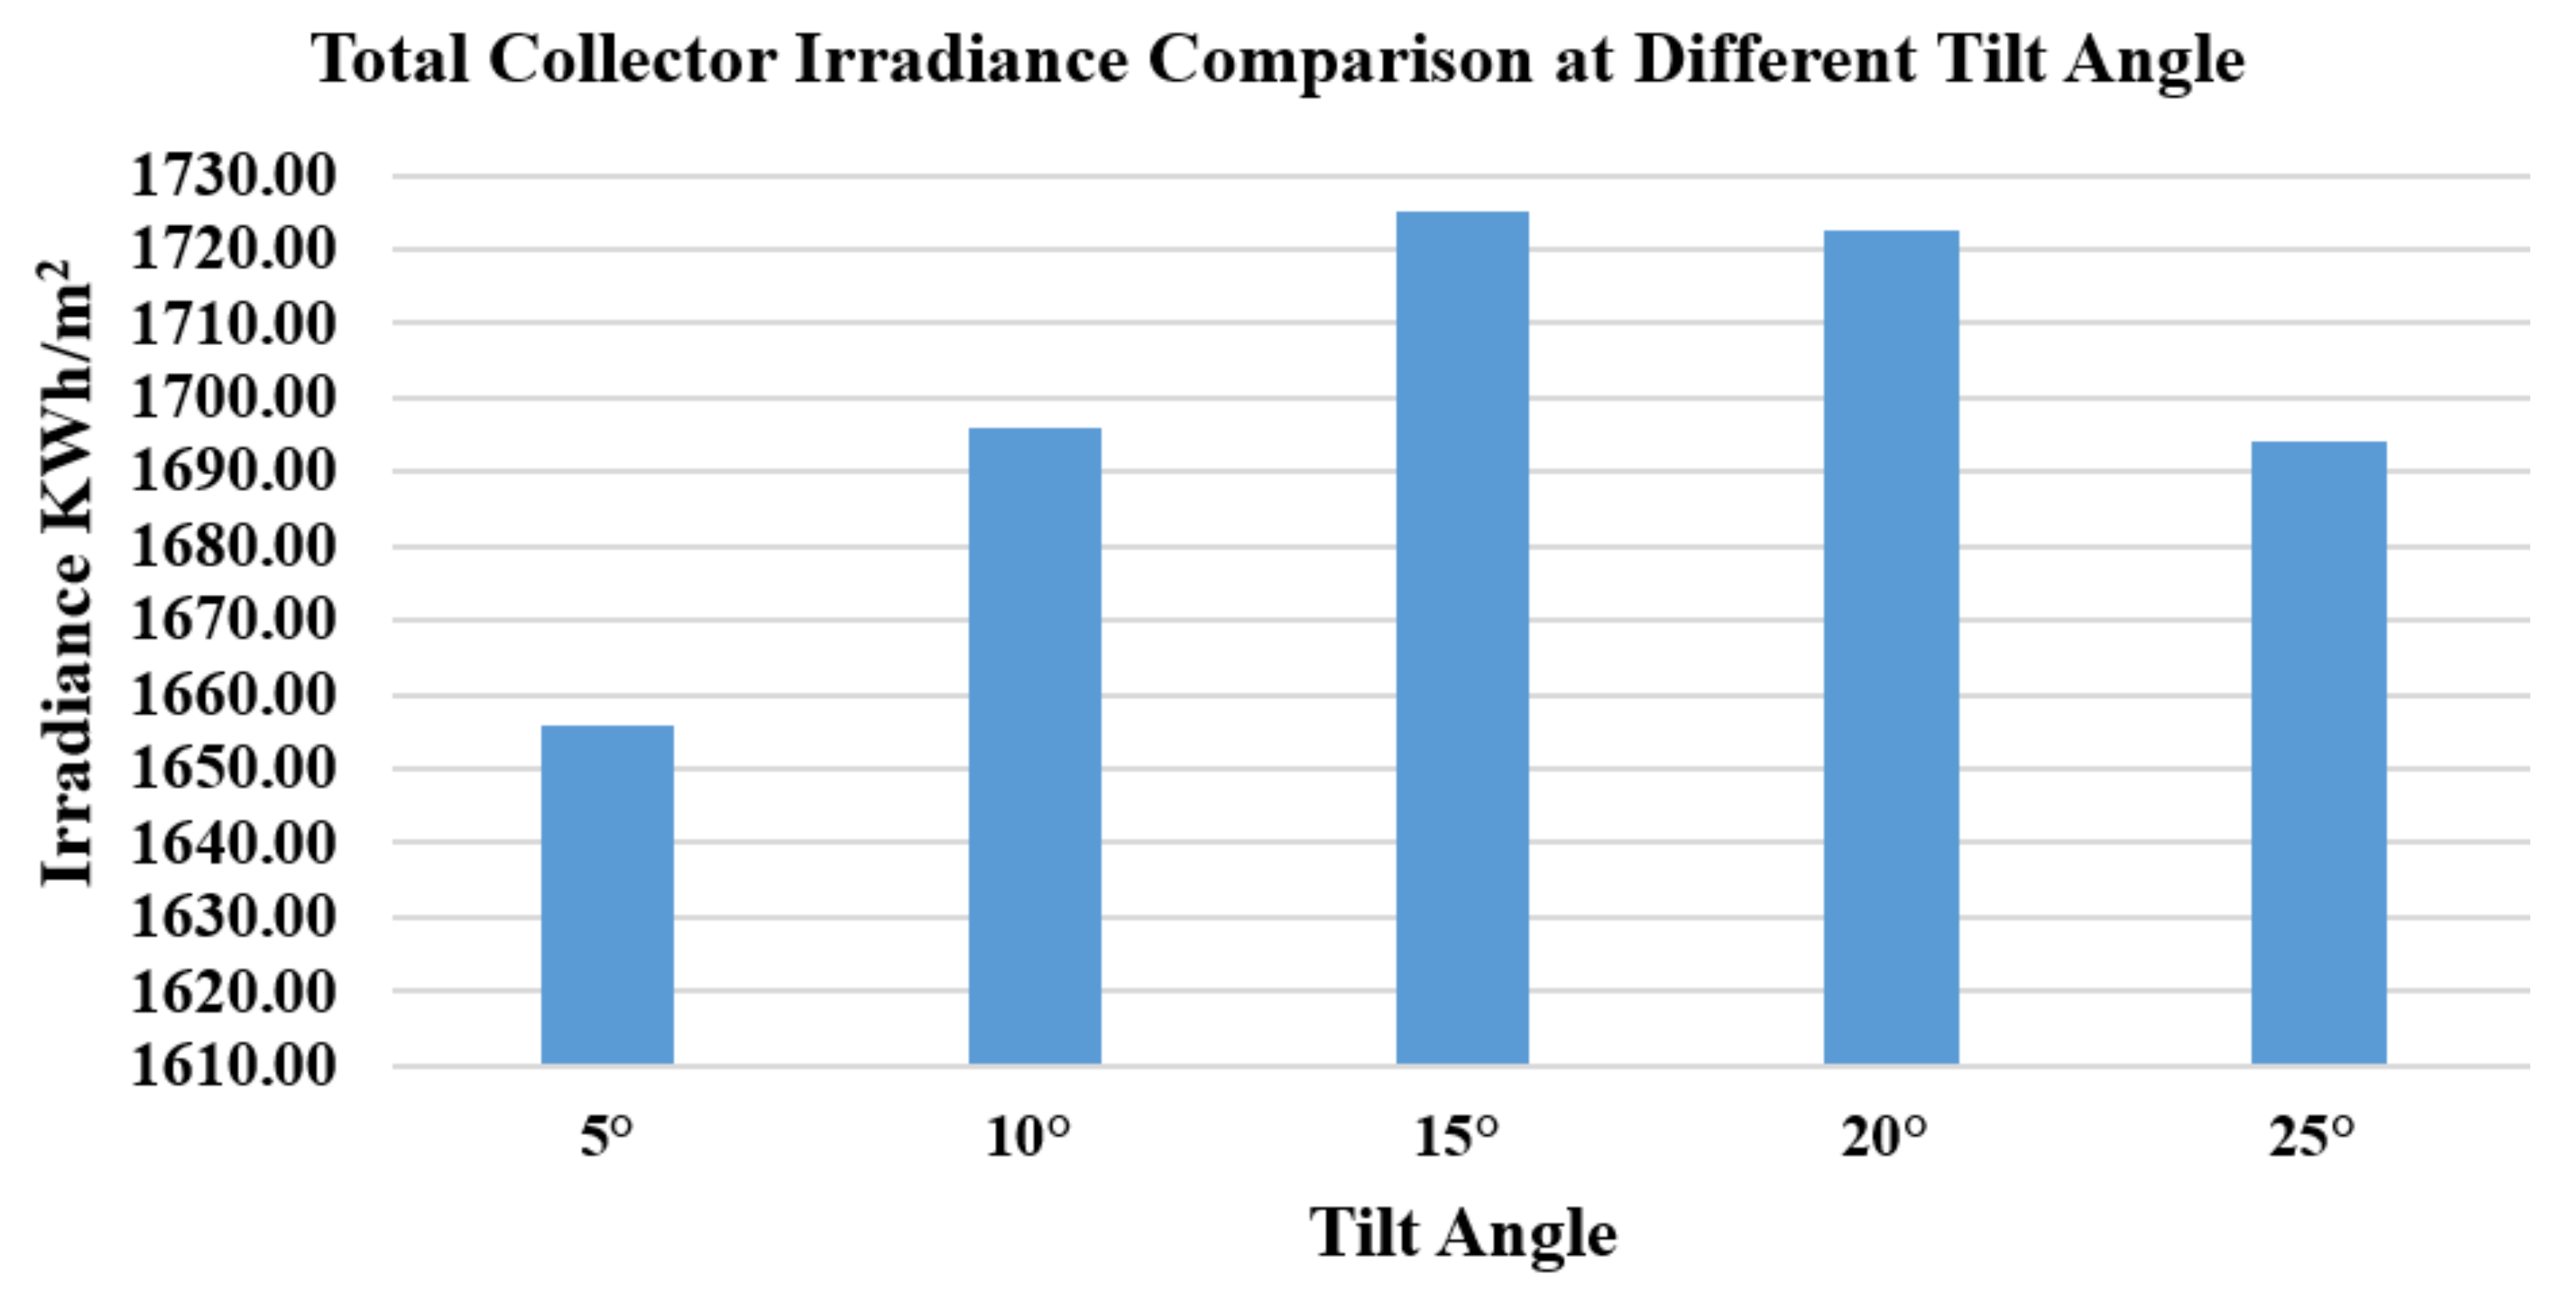
- Total collector irradiance comparison of PV system for different tilt angles.
- (10)
- The proposed optimal tilt angle and interrow spacing can predict maximum PV output.
2. Materials and Methods
- Case 1: Energy production by photovoltaic system installed at 5° tilt angle;
- Case 2: Energy production by photovoltaic system installed at 10° tilt angle;
- Case 3: Energy production by photovoltaic system installed at 15° tilt angle;
- Case 4: Energy production by photovoltaic system installed at 20° tilt angle;
- Case 5: Energy production by photovoltaic system installed at 25° tilt angle.
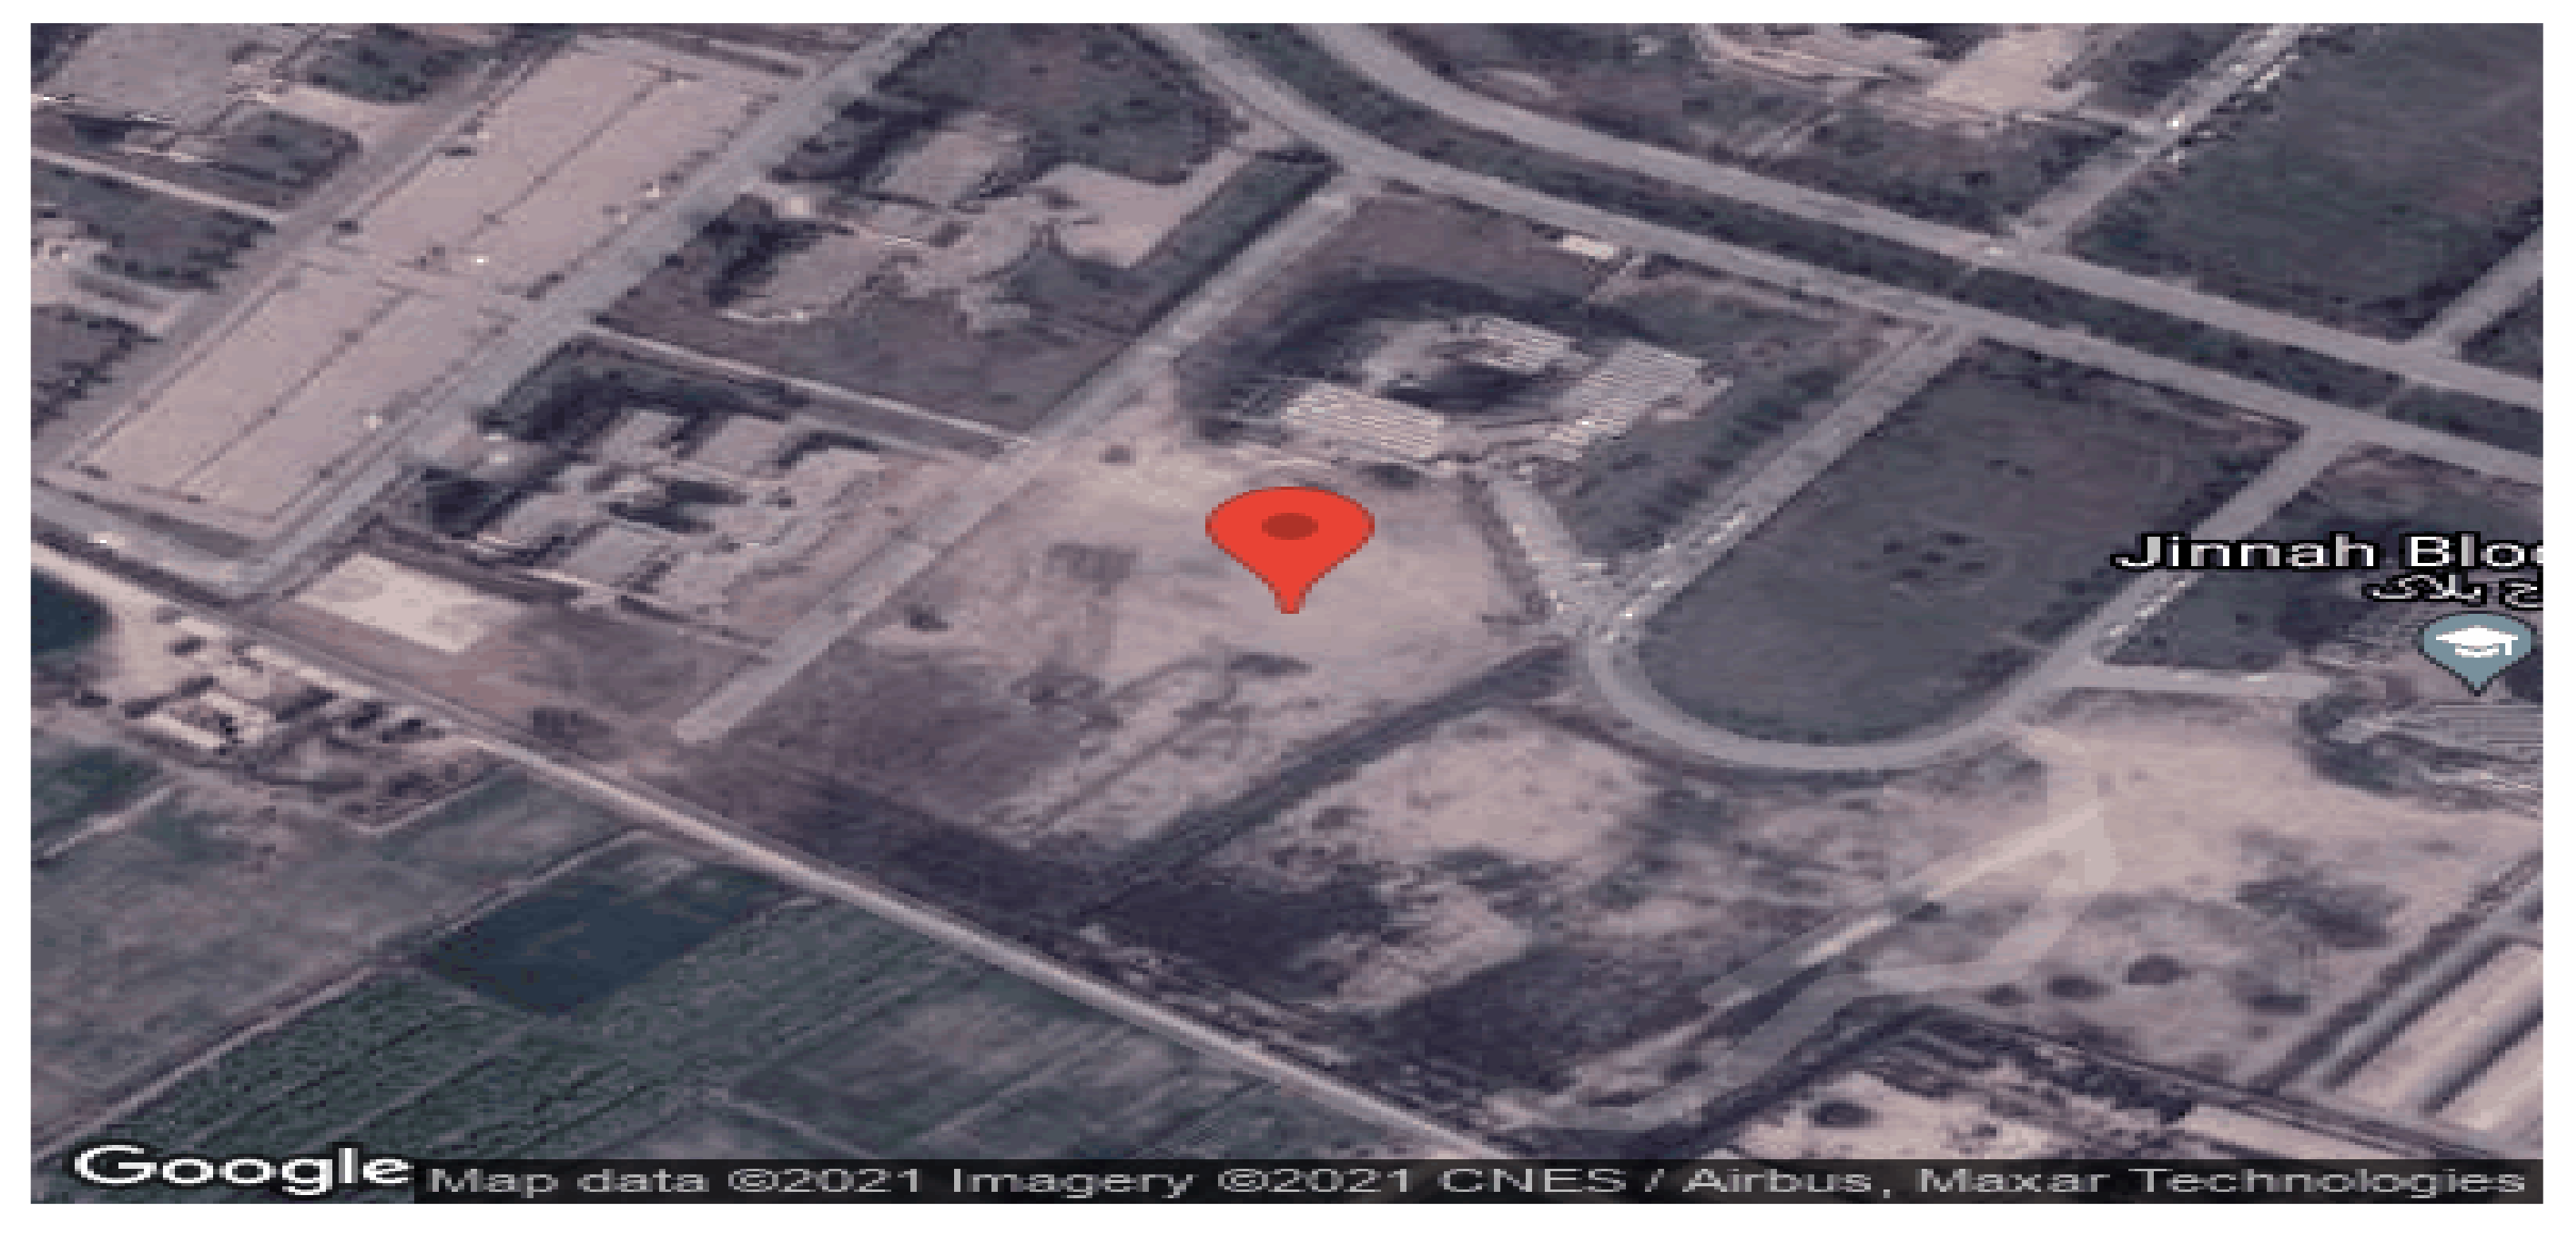
2.1. Proposed Photovoltaic Plant Site Location
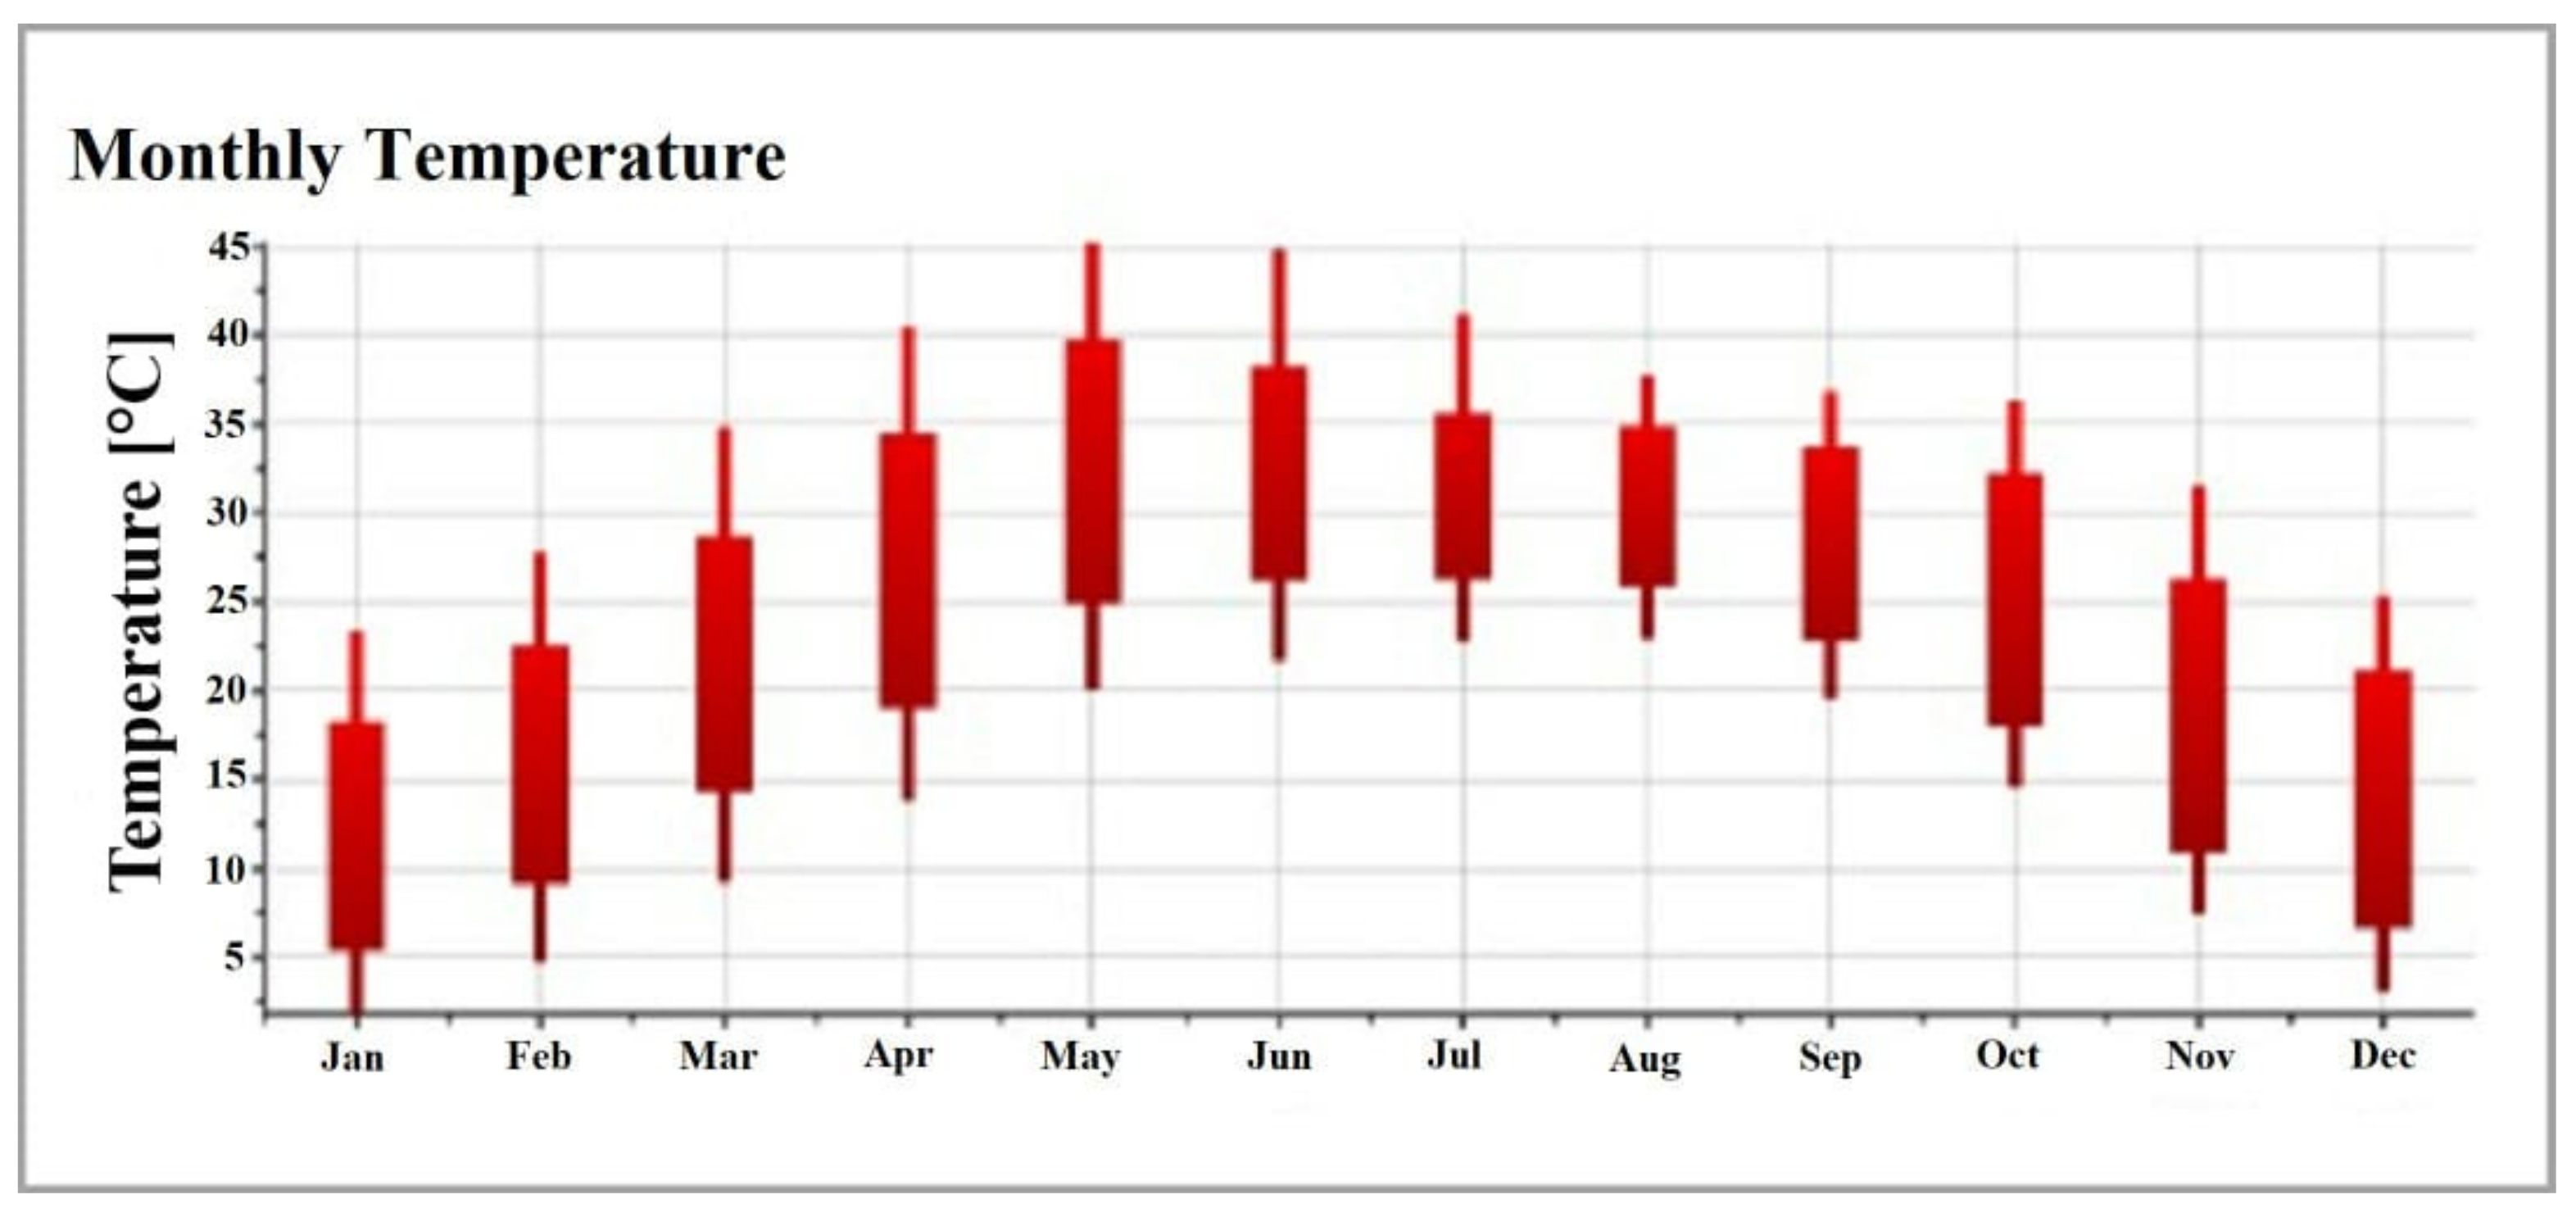
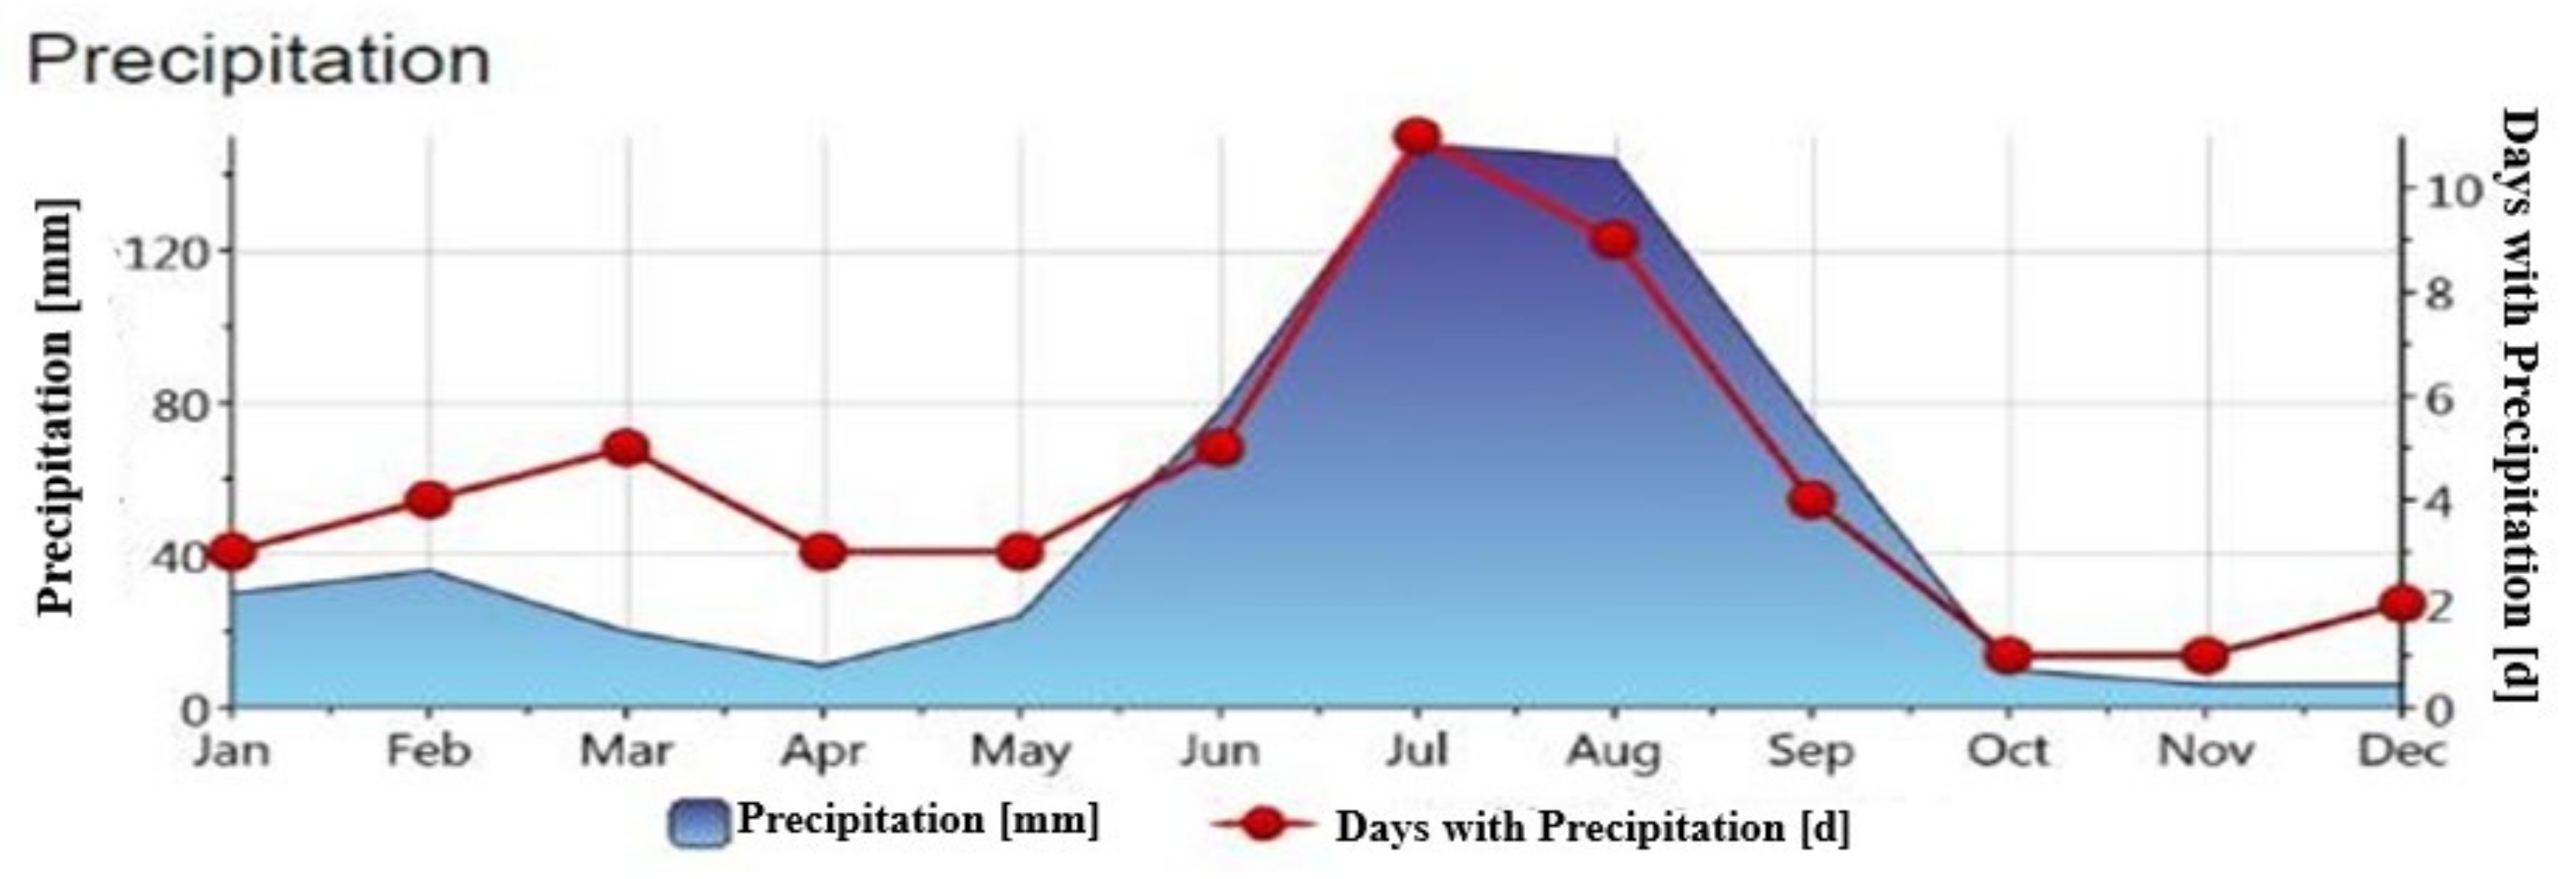
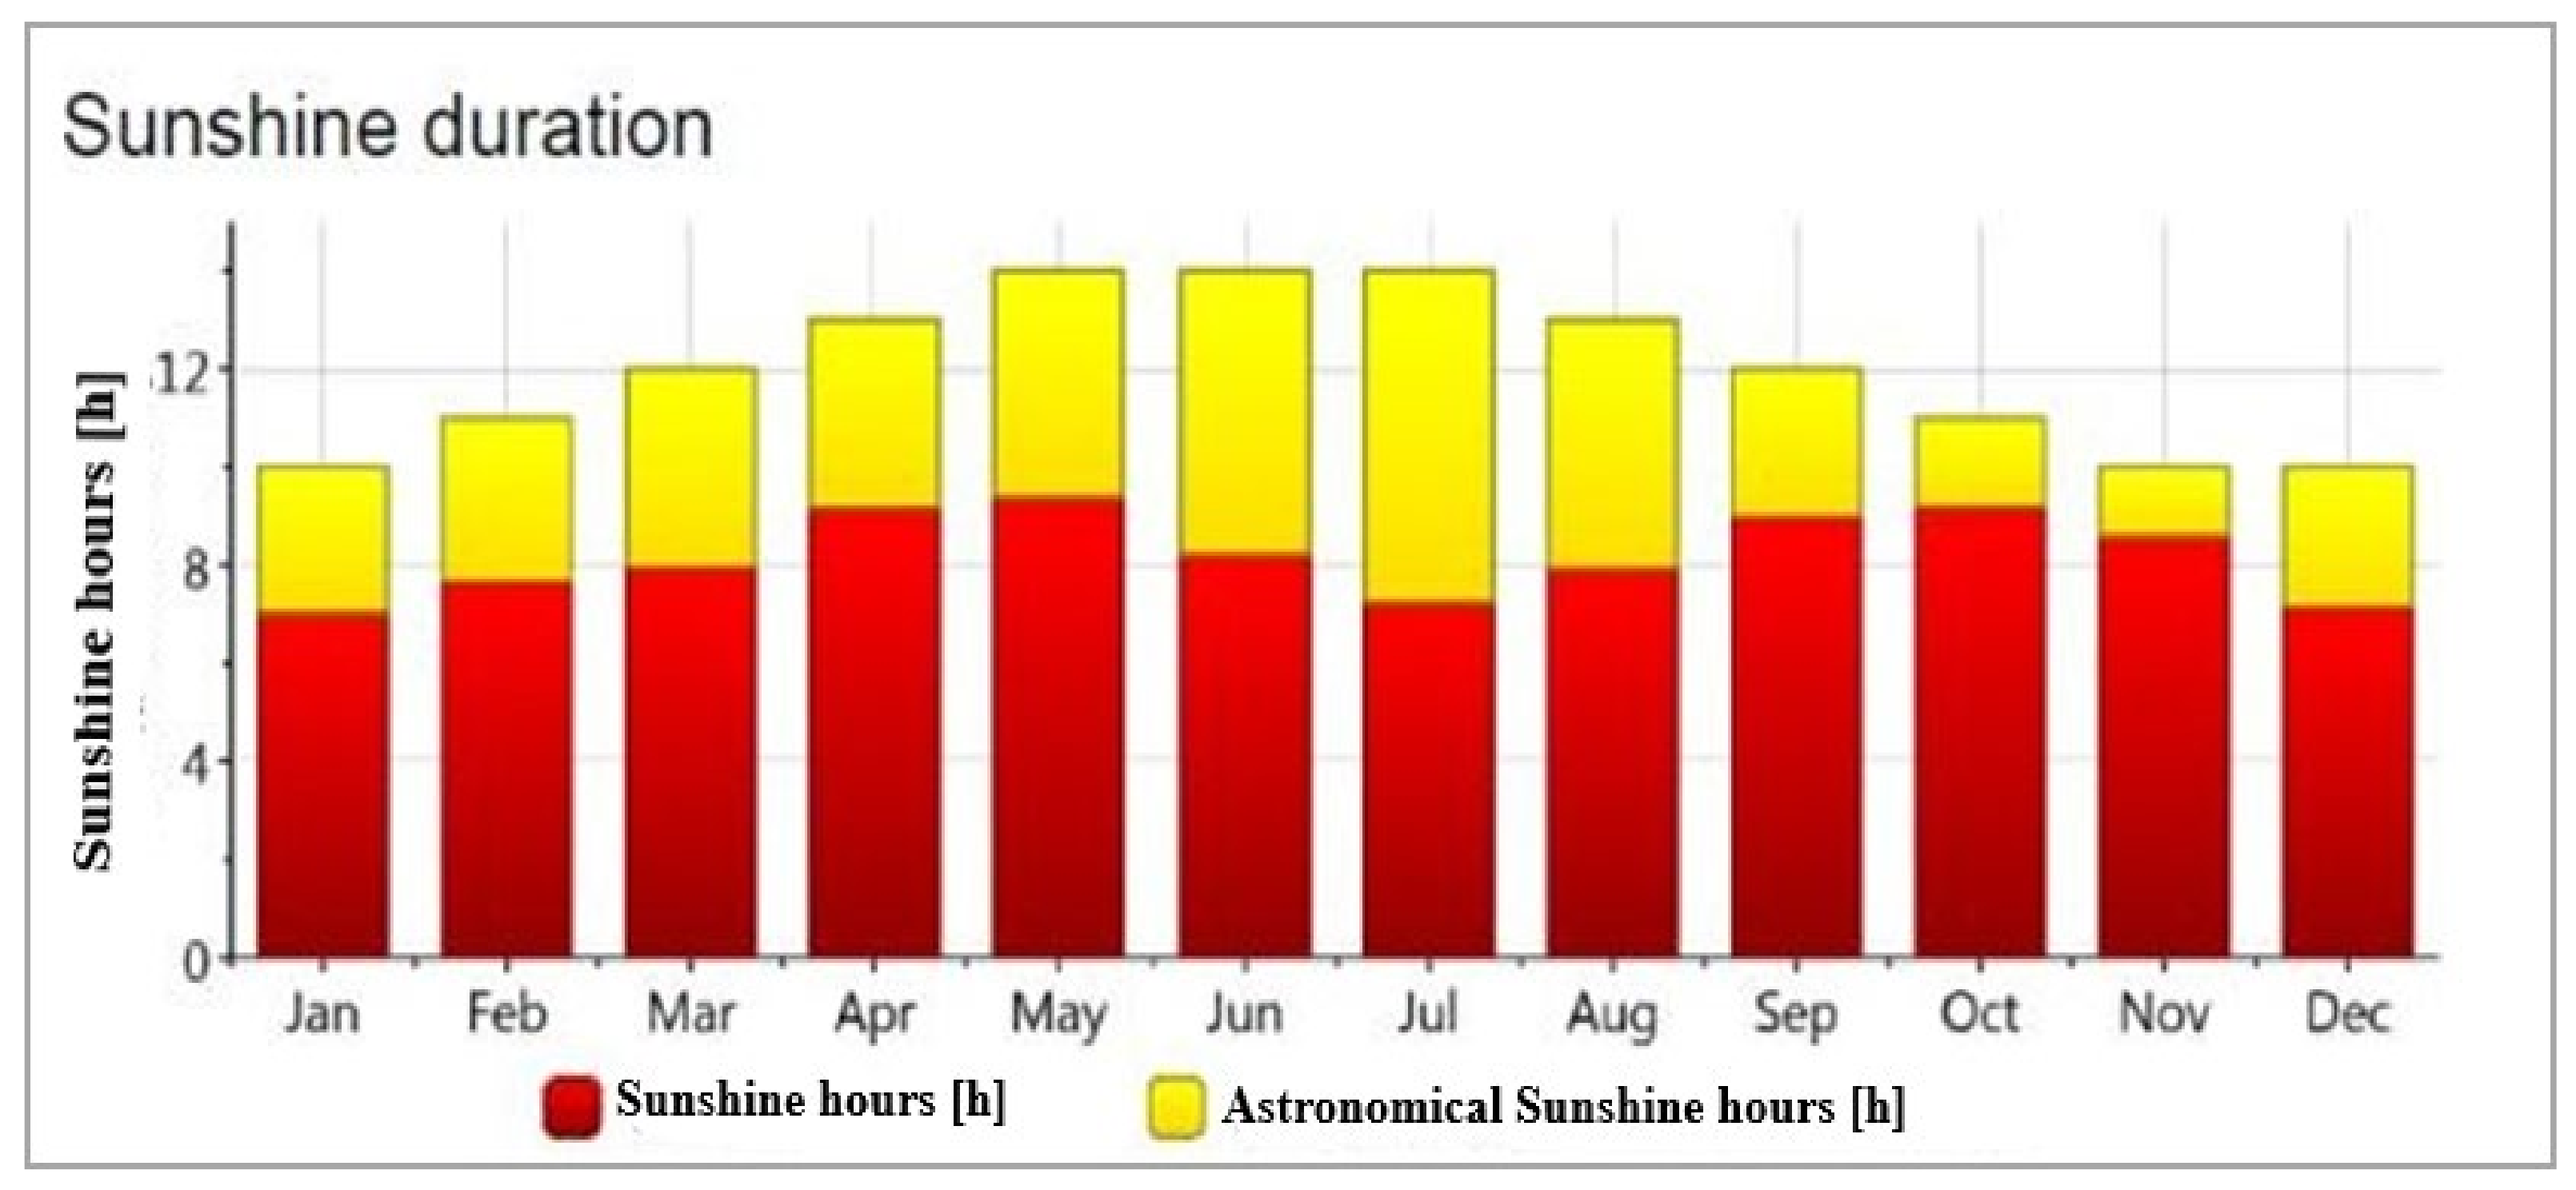
2.2. Climate Conditions for Modelling
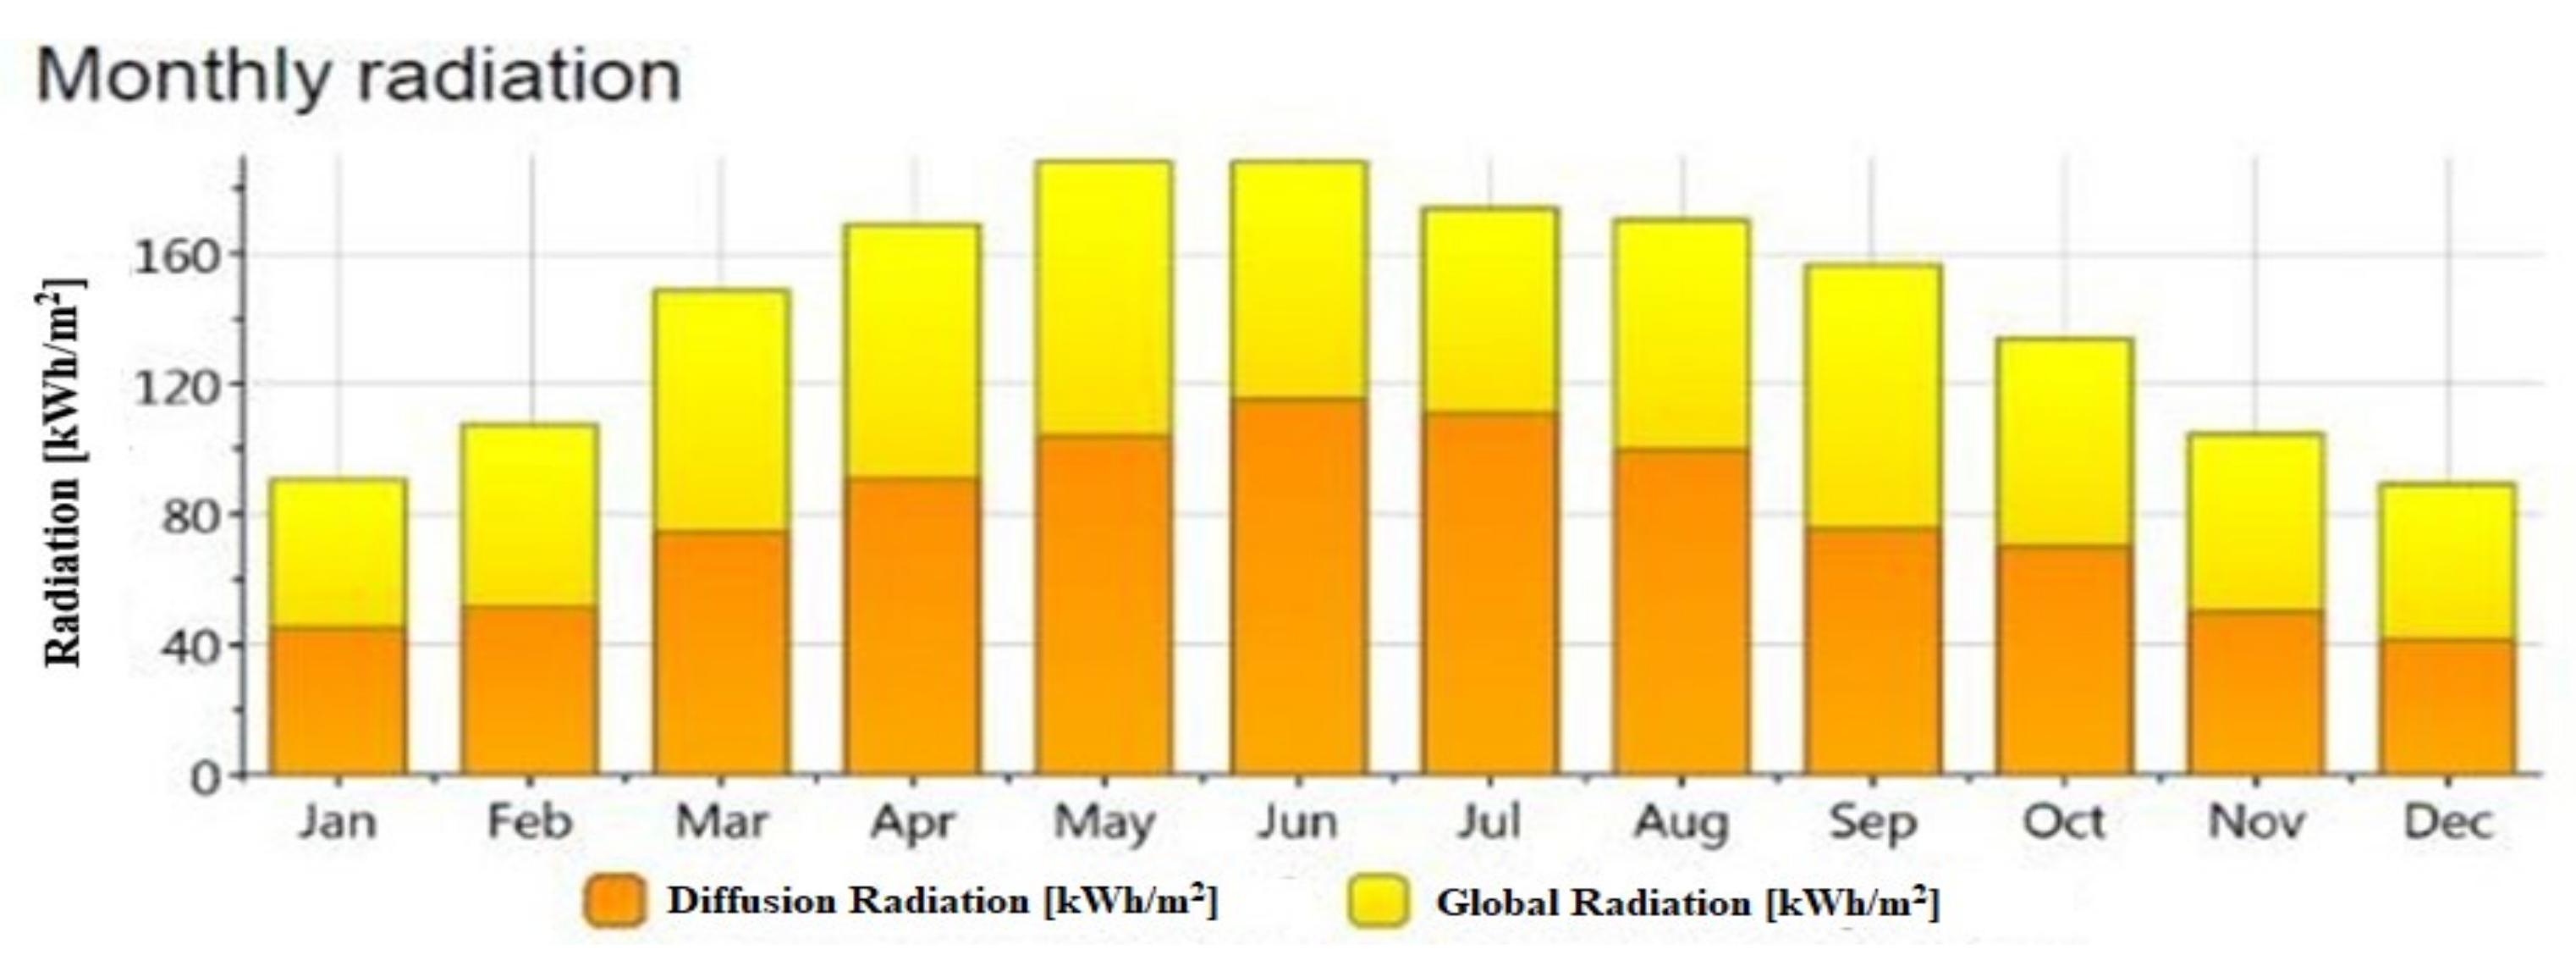
2.3. Solar Resource Assessment
2.4. PV System Designing and Proposed System Components
2.4.1. Photovoltaic Modules
2.4.2. Solar Inverter
3. Results
3.1. Case 1: Energy Production of Photovoltaic System Installed at 5° Tilt Angle
- : photovoltaic modules temperature (°C);
- : ambient temperature (°C);
- : wind speed;
- : solar radiation on the PV module (W/m2);
- : coefficient for the PV module’s upper temperature limit;
- : coefficient that determines how much the temperature of the PV module reduces when the wind speed increases.
- : solar irradiance reflected from the surface of the photovoltaic modules (W/m2);
- : Albedo coefficient;
- : measured global irritation (W/m2);
- : collector tilt.
3.2. Case 2: Energy Production of Photovoltaic System Installed at 10° Tilt Angle
3.3. Case 3: Energy Production of Photovoltaic System Installed at 15° Tilt Angle
3.4. Case 4: Energy Production of Photovoltaic System Installed at 20° Tilt Angle
3.5. Case 5: Energy Production of Photovoltaic System Installed at 25° Tilt Angle
4. Discussions
5. Conclusions
Author Contributions
Funding
Institutional Review Board Statement
Informed Consent Statement
Data Availability Statement
Conflicts of Interest
Abbreviations
| AWG | American wire gauge |
| AC | Alternating current (A) |
| CO2 | Carbon dioxide (CO2) |
| DC | Direct current (A) |
| GWh | Gigawatt hour |
| GHI | Global horizontal irradiance |
| Isc | Short circuit current |
| Imp | Maximum power current |
| kWh | Kilowatt hour |
| MWh | Megawatt hour |
| PR | Performance ratio |
| PV | Photovoltaic |
| POA | Plane of array |
| SLD | Single line diagram |
| Vmp | Maximum power voltage |
| Voc | Open circuit voltage |
References
- Muneer, T.; Asif, M.; Munawwar, S. Sustainable production of solar electricity with particular reference to the Indian economy. Renew. Sustain. Energy Rev. 2005, 9, 444–473. [Google Scholar] [CrossRef]
- Muneer, T.; Asif, M. Prospects for secure and sustainable electricity supply for Pakistan. Renew. Sustain. Energy Rev. 2007, 11, 654–671. [Google Scholar] [CrossRef]
- BP Energy Outlook 2035. 2020. Available online: https://www.bp.com/en/global/corporate/energy-economics/energy-outlook.html (accessed on 3 January 2021).
- Salam, R.A.; Amber, K.P.; Ratyal, N.I.; Alam, M.; Akram, N.; Muñoz, C.Q.G.; Márquez, F.P.G. An Overview on Energy and Development of Energy Integration in Major South Asian Countries: The Building Sector. Energies 2020, 13, 5776. [Google Scholar] [CrossRef]
- Qasim, M.; Kotani, K. An empirical analysis of energy shortage in Pakistan. Asia-Pac. Dev. J. 2014, 21, 137–166. [Google Scholar] [CrossRef]
- National Electric Power Regulatory Authority (NEPRA), Pakistan. State of Industry Report 2019–2020. Available online: http://www.nepra.org.pk/industryreports.htm (accessed on 14 February 2021).
- Sher, H.A.; Murtaza, A.F.; Addoweesh, K.E.; Chiaberge, M. Pakistan’s progress in solar PV based energy generation. Renew. Sustain. Energy Rev. 2015, 47, 213–217. [Google Scholar] [CrossRef]
- Farooqui, S.Z. Prospects of renewables penetration in the energy mix of Pakistan. Renew. Sustain. Energy Rev. 2014, 29, 693–700. [Google Scholar] [CrossRef]
- Duhirwe, P.N.; Hwang, J.K.; Ngarambe, J.; Kim, S.; Kim, K.; Song, K.; Yun, G.Y. A novel deep learning-based integrated photovoltaic, energy storage system and electric heat pump system: Optimising energy usage and costs. Int. J. Energy Res. 2021, 45, 9306–9325. [Google Scholar] [CrossRef]
- Hayat, M.B.; Ali, D.; Monyake, K.C.; Alagha, L.; Ahmed, N. Solar energy—A look into power generation, challenges, and a solar-powered future. Int. J. Energy Res. 2019, 43, 1049–1067. [Google Scholar] [CrossRef]
- Tyagi, V.V.; Rahim, N.A.; Rahim, N.A.; Jeyraj, A.; Selvaraj, L. Progress in solar PV technology: Research and achievement. Renew. Sustain. Energy Rev. 2013, 20, 443–461. [Google Scholar] [CrossRef]
- Li, Y.; Zhang, G.; Lv, G.Z.; Zhang, A.N.; Wang, R.Z. Performance study of a solar photovoltaic air conditioner in the hot summer and cold winter zone. Sol. Energy 2015, 117, 167–179. [Google Scholar] [CrossRef]
- Razykov, T.M.; Ferekides, C.S.; Morel, D.; Stefanakos, E.; Ullal, H.S.; Upadhyaya, H.M. Solar photovoltaic electricity: Current status and future prospects. Sol. Energy 2011, 85, 1580–1608. [Google Scholar] [CrossRef]
- World Energy Council London. World Energy Resources. 2020. Available online: https://www.worldenergy.org/assets/images/imported/2020/10/WEC_Resources_summary-final_180314_TT.pdf (accessed on 29 February 2021).
- REN21. Renewables 2020 Global Status Report (Paris: REN21 Secretariat). ISBN 9783948393007. 2020. Available online: https://www.ren21.net/wp-content/uploads/2019/05/gsr_2020_full_report_en.pdf (accessed on 7 March 2021).
- IEA. World Energy Outlook 2020, IEA, Paris. 2020. Available online: https://www.iea.org/reports/world-energy-outlook-2020 (accessed on 21 March 2021).
- Baccoli, R.; Frattolillo, A.; Mastino, C.; Curreli, S.; Ghiani, E. A comprehensive optimization model for flat solar collector coupled with a flat booster bottom reflector based on an exact finite length simulation model. Energy Convers. Manag. 2018, 164, 482–507. [Google Scholar] [CrossRef]
- Baccoli, R.; Mastino, C.C.; Innamorati, R.; Serra, L.; Curreli, S.; Ghiani, E.; Ricciu, R.; Marini, M. A mathematical model of a solar collector augmented by a flat plate above reflector: Optimum inclination of collector and reflector. Energy Procedia 2015, 81, 205–214. [Google Scholar] [CrossRef] [Green Version]
- Baccoli, R.; Kumar, A.; Frattolillo, A.; Mastino, C.; Ghiani, E.; Gatto, G. Enhancing energy production in a PV collector–Reflector system supervised by an optimization model: Experimental analysis and validation. Energy Convers. Manag. 2021, 229, 113774. [Google Scholar] [CrossRef]
- Al-Zareer, M.; Dincer, I.; Rosen, M.A. Performance improvement study of an integrated photovoltaic system for offshore power production. Int. J. Energy Res. 2021, 45, 772–785. [Google Scholar] [CrossRef]
- Mustafa, R.J.; Gomaa, M.R.; Al-Dhaifallah, M.; Rezk, H. Environmental Impacts on the Performance of Solar Photovoltaic Systems. Sustainability 2020, 12, 608. [Google Scholar] [CrossRef] [Green Version]
- Zsiborács, H.; Baranyai, N.H.; Vincze, A.; Pintér, G. An Economic Analysis of the Shading Effects of Transmission Lines on Photovoltaic Power Plant Investment Decisions: A Case Study. Sensors 2021, 21, 4973. [Google Scholar] [CrossRef]
- Ahmed, W.; Sheikh, J.A.; Farjana, S.H.; Mahmud, M.A.P. Defects Impact on PV System GHG Mitigation Potential and Climate Change. Sustainability 2021, 13, 7793. [Google Scholar] [CrossRef]
- Djordjevic, S.; Parlevliet, D.; Jennings, P. Detectable faults on recently installed solar modules in Western Australia. Renew. Energy 2014, 67, 215–221. [Google Scholar] [CrossRef] [Green Version]
- Nawaz, I.; Tiwari, G.N. Embodied energy analysis of photovoltaic (PV) system based on macro-and micro-level. Energy Policy 2006, 34, 3144–3152. [Google Scholar] [CrossRef]
- Ayompe, L.M.; Duffy, A.; McCormack, S.J.; Conlon, M. Measured performance of a 1.72 kW rooftop grid connected photovoltaic system in Ireland. Energy Convers. Manag. 2011, 52, 816–825. [Google Scholar] [CrossRef] [Green Version]
- Gielen, D.; Boshell, F.; Saygin, D.; Bazilian, M.D.; Wagner, N.; Gorini, R. The role of renewable energy in the global energy transformation. Energy Strategy Rev. 2019, 24, 38–50. [Google Scholar] [CrossRef]
- Kumar, B.S.; Sudhakar, K. Performance evaluation of 10 MW grid connected solar photovoltaic power plant in India. Energy Rep. 2015, 1, 184–192. [Google Scholar] [CrossRef] [Green Version]
- Quiles, E.; Roldán-Blay, C.; Escrivá-Escrivá, G.; Roldán-Porta, C. Accurate Sizing of Residential Stand-Alone Photovoltaic Systems Considering System Reliability. Sustainability 2020, 12, 1274. [Google Scholar] [CrossRef] [Green Version]
- Charan, C.R.; Laxmi, A.J.; Sangeetha, P. Optimized energy efficient solution with stand alone PV system. MATTER Int. J. Sci. Technol. 2017, 3, 16–27. [Google Scholar] [CrossRef] [Green Version]
- Shi, K.; Li, C.; Koo, C. A Techno-Economic Feasibility Analysis of Mono-Si and Poly-Si Photovoltaic Systems in the Rooftop Area of Commercial Building under the Feed-In Tariff Scheme. Sustainability 2021, 13, 4709. [Google Scholar] [CrossRef]
- Sarkar, S.; Bhaskar, M.S.; Rao, K.U.; Prema, V.; Almakhles, D.; Subramaniam, U. Solar PV network installation standards and cost estimation guidelines for smart cities. Alex. Eng. J. 2022, 61, 1277–1287. [Google Scholar] [CrossRef]
- Goel, S.; Sharma, R. Analysis of measured and simulated performance of a grid-connected PV system in eastern India. Environ. Dev. Sustain. 2020, 23, 451–476. [Google Scholar] [CrossRef]
- Guittet, D.L.; Freeman, J.M. Validation of Photovoltaic Modeling Tool HelioScope Against Measured Data (No. NREL/TP-6A20-72155). National Renewable Energy Lab.(NREL), Golden, CO (United States). 2018. Available online: https://www.nrel.gov/docs/fy19osti/72155.pdf (accessed on 27 March 2021).
- Li, H.X.; Zhang, Y.; Edwards, D.; Hosseini, M.R. Improving the energy production of roof-top solar PV systems through roof design. Build. Simul. 2020, 13, 475–487. [Google Scholar] [CrossRef]
- Behi, B.; Baniasadi, A.; Arefi, A.; Gorjy, A.; Jennings, P.; Pivrikas, A. Cost–Benefit Analysis of a Virtual Power Plant Including Solar PV, Flow Battery, Heat Pump, and Demand Management: A Western Australian Case Study. Energies 2020, 13, 2614. [Google Scholar] [CrossRef]
- Meteonorm Software. Worldwide Irradiation Data. Available online: https://meteonorm.com/en/ (accessed on 11 April 2021).
- National Renewable Energy Laboratory. PVWatts Calculator. Available online: https://pvwatts.nrel.gov/ (accessed on 13 April 2021).
- Solar Prospector. Solar Resource Data. Available online: https://www.pvsyst.com/help/meteo_import_solar_prospector.htm (accessed on 15 April 2021).
- Hailu, G.; Fung, A.S. Optimum Tilt Angle and Orientation of Photovoltaic Thermal System for Application in Greater Toronto Area, Canada. Sustainability 2019, 11, 6443. [Google Scholar] [CrossRef] [Green Version]
- Liu, W.; Li, J.; Li, S.; Luo, J.; Jiang, X. Research on optimum tilt angle of photovoltaic module based on regional clustering of influencing factors of power generation. Int. J. Energy Res. 2021, 45, 11002–11017. [Google Scholar] [CrossRef]
- Rediske, G.; Siluk, J.C.M.; Gastaldo, N.G.; Rigo, P.D.; Rosa, C.B. Determinant factors in site selection for photovoltaic projects: A systematic review. Int. J. Energy Res. 2019, 43, 1689–1701. [Google Scholar] [CrossRef]
- Khan, S.; Hasan, M. Climate classification of Pakistan. Int. J. Econ. Environ. Geol. 2019, 10, 60–71. [Google Scholar] [CrossRef]
- Shahid, M.; Cong, Z.; Zhang, D. Understanding the impacts of climate change and human activities on streamflow: A case study of the Soan River basin, Pakistan. Theor. Appl. Climatol. 2018, 134, 205–219. [Google Scholar] [CrossRef]
- Kim, M.; Kim, H.; Jung, J.H. A Study of Developing a Prediction Equation of Electricity Energy Output via Photovoltaic Modules. Energies 2021, 14, 1503. [Google Scholar] [CrossRef]
- Sharaf, M.; Huzayyin, A.S.; Yousef, M.S. Performance enhancement of photovoltaic cells using phase change material (PCM) in winter. Alex. Eng. J. 2021, 61, 4229–4239. [Google Scholar] [CrossRef]
- Umer, F.; Aslam, M.S.; Rabbani, M.S.; Hanif, M.J.; Naeem, N.; Abbas, M.T. Design and optimization of solar carport canopies for maximum power generation and efficiency at Bahawalpur. Int. J. Photoenergy 2019, 2019, 6372503. [Google Scholar] [CrossRef] [Green Version]
- Khan, T.Y.; Soudagar, M.E.M.; Kanchan, M.; Afzal, A.; Banapurmath, N.R.; Akram, N.; Mane, S.D.; Shahapurkar, K. Optimum location and influence of tilt angle on performance of solar PV panels. J. Therm. Anal. Calorim. 2020, 141, 511–532. [Google Scholar] [CrossRef]
- Hartner, M.; Ortner, A.; Hiesl, A.; Haas, R. East to west–The optimal tilt angle and orientation of photovoltaic panels from an electricity system perspective. Appl. Energy 2015, 160, 94–107. [Google Scholar] [CrossRef]
- Babatunde, A.A.; Abbasoglu, S.; Senol, M. Analysis of the impact of dust, tilt angle and orientation on performance of PV Plants. Renew. Sustain. Energy Rev. 2018, 90, 1017–1026. [Google Scholar] [CrossRef]


| Value | HelioScope | PVSyst | SAM | PV*SOL |
|---|---|---|---|---|
| Modelling timestep | Hourly | Hourly | Hourly | Hourly |
| Decomposition of global horizontal irradiance (GHI) | Erbs model | Erbs model | N/A | Reindl |
| Transposition model | Perez model | Perez model | Perez model | Hay-Davies |
| Module model | Shockley’s single diode model | Shockley’s single diode model | CEC single diode model | Enhances single diode |
| Temperature model | Sandia model | Thermal balance equation | NOCT | Thermal balance equation |
| Radiation components | GHI and DHI | User selection | DNI and DHI | GHI |
| Albedo | 0.2 | 0.2 | 0.2 | 0.2 |
| Module cover/IAM loss | ASHRAE | ASHRAE | Model dependent | ASHRAE |
| DC-AC ratio | user selection | user selection | 1.2 | user selection |
| Mismatch losses | Calculated | 1% | 2% | 2% |
| DC wiring losses | Calculated | 1.5% | 2% | Calculated |
| Total DC derate | Calculated | 0.95 | 0.96 | 0.975 |
| AC wiring/cabling losses | 0.50% | 0% | 1% | N/A |
| Data | Parameters |
|---|---|
| Azimuth angle | 180° |
| Orientation. | Landscape (horizontal) |
| Frame size | 2 and 1 |
| Interrow spacing | 4.0 feet |
| Alignment | Central |
| Setback from edges | 2.0 feet |
| Combiner poles | 12.0 |
| String size | 6.0–20.0 PV modules. |
| Parameter | Value |
|---|---|
| Rated Maximum Power (Pmax) | 535.0 W |
| Cells | Mono 144 (6 × 24) |
| Power Tolerance | 0~ +5 W |
| Maximum Power Voltage (Vmp) | 41.470 V |
| Open Circuit Voltage (Voc) | 49.450 V |
| Temp Coefficient of Voc (β_Voc) | −0.275%/°C |
| Short Circuit Current (Isc) | 13.790 A |
| Temp Coefficient of Isc (α_Isc) | 0.04500%/°C |
| Maximum Power Current (Imp) | 12.900 A |
| Temp Coefficient of Pmax (γ_Pmp) | −0.350%/°C |
| Module Efficiency (η) | 21.30% |
| Maximum Series Rating of Fuse | 25.0 A |
| Junction Box | IP68, 3 Diodes |
| Safety Class | Class II |
| Fire Performance | UL Type 1 |
| Maximum Static Load (Front) | 5400.0 Pa (112.0 lb/ft²) |
| Maximum Static Load (Back) | 2400.0 Pa (50.0 lb/ft²) |
| Irradiance (W/m2) | VOC (V) | ISC (A) | VMP (V) | IMP (A) | Power | dPmp/dT | dVmp/dT | dVoc/dT |
|---|---|---|---|---|---|---|---|---|
| 1000 | 49.4 | 13.79 | 41.1 | 13.04 | 535.6 | −0.35% | −0.37% | −0.30% |
| 800 | 49.1 | 11.03 | 41.3 | 10.41 | 429.6 | −0.35% | −0.37% | −0.30% |
| 600 | 48.6 | 8.27 | 41.3 | 7.79 | 321.8 | −0.35% | −0.37% | −0.31% |
| 400 | 47.9 | 5.52 | 41.2 | 5.17 | 213.0 | −0.35% | −0.38% | −0.32% |
| 200 | 46.7 | 2.76 | 40.6 | 2.57 | 104.2 | −0.36% | −0.39% | −0.33% |
| 100 | 45.5 | 1.38 | 39.7 | 1.27 | 50.2 | −0.37% | −0.41% | −0.35% |
| Parameter | Value |
|---|---|
| Model | MAX 1000 KTL |
| Maximum input current per MPP tracker | 26.0 A |
| Maximum short-circuit current per MPP tracker | 32.0 A |
| Maximum DC voltage | 1100.0 V |
| Start voltage | 250.0 V |
| No of MMPT tracker | 7 |
| No. of PV strings per MPP tracker | 2 |
| AC nominal power | 100,000.0 W |
| Maximum alternating current apparent power | 111,000.0 VA |
| Range of nominal AC voltage | (288 V/500 V) 425–540 VAC |
| Maximum output current. | 128.6 A |
| AC grid frequency | 50.0/60.0 Hz |
| AC grid connection type | 3W + PE |
| THDi | <3.0% |
| Maximum efficiency | 98.60% |
| MPPT efficiency | 99.9% |
| AC/DC surge protection | Type II/Type II |
| Operating temperature range | −25 °C to +60 °C |
| Interrow Spacing | Installed Capacity | Annual Production | Performance Ratio | Load Ratio |
|---|---|---|---|---|
| 1 feet | 1.50 MW | 2.168 GWh | 82.3% | 1.0 |
| 2 Feet | 1.50 MW | 2.175 GWh | 82.5% | 1.0 |
| 3 Feet | 1.50 MW | 2.176 GWh | 82.6% | 1.0 |
| 4 Feet | 1.48 MW | 2.149 GWh | 82.6% | 0.99 |
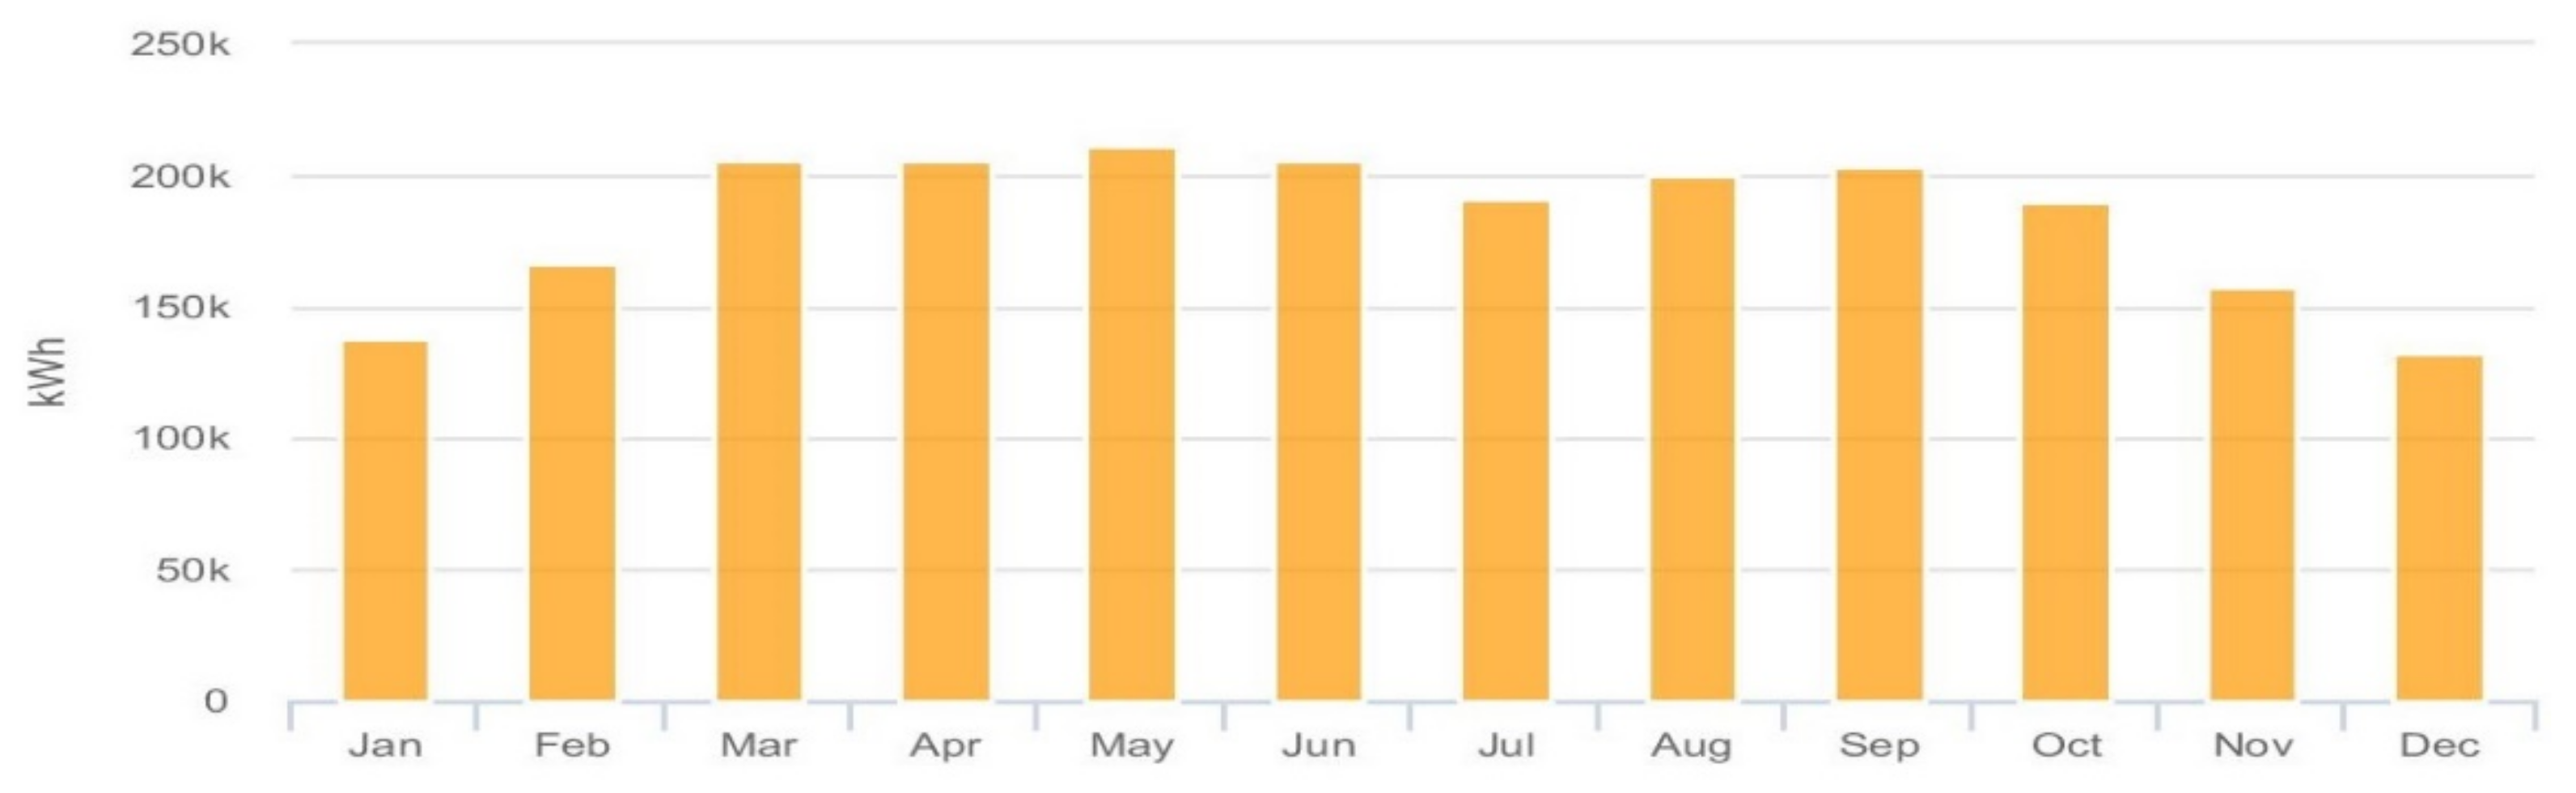
| Month | GlobHor Irradiance (GHI) (kWh/m2) | Plane of Array (POA) (kWh/m2) | Shaded (kWh/m2) | Nameplate (kWh) | Monthly Power Injected into Grid (kWh) |
|---|---|---|---|---|---|
| January | 88.6 | 96.1 | 95.9 | 134,558.1 | 124,667.5 |
| February | 106.7 | 113.9 | 113.7 | 160,475.8 | 146,111.0 |
| March | 147.5 | 153.9 | 153.6 | 217,730.9 | 193,025.1 |
| April | 166.3 | 169.7 | 169.3 | 240,651.1 | 209,177.0 |
| May | 186.8 | 188.2 | 187.7 | 267,035.9 | 227,374.7 |
| June | 187.1 | 187.2 | 186.8 | 265,681.6 | 227,126.5 |
| July | 170.8 | 171.3 | 170.8 | 242,782.7 | 208,826.2 |
| August | 169.1 | 171.6 | 171.2 | 243,460.0 | 209,408.4 |
| September | 155.9 | 161.1 | 160.7 | 228,087.4 | 197,689.1 |
| October | 130.9 | 138.3 | 137.9 | 195,068.6 | 171,256.3 |
| November | 101.1 | 109.5 | 109.2 | 153,545.6 | 138,602.9 |
| December | 86.9 | 95.4 | 95.1 | 133,113.3 | 122,419.1 |
| Description | Output | % Delta | |
|---|---|---|---|
| Irradiance (kWh/m2) | Annual Global Horizontal Irradiance | 1697.8 | − |
| POA Irradiance | 1756.2 | 3.4% | |
| Shaded Irradiance | 1752.0 | −0.2% | |
| Irradiance after Reflection | 1689.7 | −3.6% | |
| Irradiance after Soiling | 1655.9 | −2.0% | |
| Total Collector Irradiance | 1655.9 | 0.0% | |
| Energy (kWh) | Nameplate | 2,482,191.0 | − |
| Output at Irradiance Levels | 2,469,427.8 | −0.5% | |
| Output at Cell Temperature Derate | 2,304,327.7 | −6.7% | |
| Output after Mismatch | 2,227,150.4 | −3.3% | |
| Optimal DC Output | 2,217,694.4 | −0.4% | |
| Constrained DC Output | 2,217,688.9 | 0.0% | |
| Inverter Output | 2,186.616.8 | −1.4% | |
| Energy to Grid | 2,175,683.7 | −0.5% | |
| Temperature Metrics | Avg. Operating Ambient Temp | 26.8 °C | |
| Avg. Operating Cell Temp | 36.5 °C | ||
| Interrow Spacing | Installed Capacity | Annual Production | Performance Ratio | Load Ratio |
|---|---|---|---|---|
| 1 feet | 1.50 MW | 2.146 GWh | 79.3% | 1.0 |
| 2 Feet | 1.50 MW | 2.218 GWh | 82.0% | 1.0 |
| 3 Feet | 1.50 MW | 2.227 GWh | 82.3% | 1.0 |
| 4 Feet | 1.48 MW | 2.215 GWh | 82.6% | 0.99 |
| Month | GlobHor Irradiance (GHI) (kWh/m2) | Plane of Array (POA) (kWh/m2) | Shaded (kWh/m2) | Nameplate (kWh) | Monthly Power Injected into Grid (kWh) |
|---|---|---|---|---|---|
| January | 88.6 | 103.1 | 102.0 | 144,078.0 | 133,209.4 |
| February | 106.7 | 120.4 | 119.6 | 169,631.0 | 154,137.4 |
| March | 147.5 | 159.3 | 158.2 | 224,993.8 | 199,073.1 |
| April | 166.3 | 172.2 | 170.8 | 243,269.2 | 211,190.4 |
| May | 186.8 | 188.5 | 186.9 | 266,226.6 | 226,544.7 |
| June | 187.1 | 186.2 | 184.7 | 262,968.7 | 224,712.9 |
| July | 170.8 | 170.8 | 169.3 | 240,919.6 | 207,111.4 |
| August | 169.1 | 173.1 | 171.6 | 244,544.6 | 210,128.2 |
| September | 155.9 | 165.3 | 164.0 | 233,404.5 | 201,966.1 |
| October | 130.9 | 144.8 | 143.7 | 204,071.2 | 178,783.0 |
| November | 101.1 | 117.2 | 116.1 | 164,181.1 | 147,835.7 |
| December | 86.9 | 103.3 | 102.1 | 144,000.3 | 132,069.2 |
| Description | Output | % Delta | |
|---|---|---|---|
| Irradiance (kWh/m2) | Annual Global Horizontal Irradiance | 1697.8 | − |
| POA Irradiance | 1804.4 | 6.3% | |
| Shaded Irradiance | 1789.0 | −0.9% | |
| Irradiance after Reflection | 1730.6 | −3.3% | |
| Irradiance after Soiling | 1696.0 | −2.0% | |
| Total Collector Irradiance | 1696.0 | 0.0% | |
| Energy (kWh) | Nameplate | 2,542,288.7 | − |
| Output at Irradiance Levels | 2,530,304.5 | −0.5% | |
| Output at Cell Temperature Derate | 2,359,288.1 | −6.8% | |
| Output after Mismatch | 2,279,680.0 | −3.4% | |
| Optimal DC Output | 2,269,759.1 | −0.4% | |
| Constrained DC Output | 2,269,753.4 | 0.0% | |
| Inverter Output | 2,237,951.4 | −1.4% | |
| Energy to Grid | 2,226,761.7 | −0.5% | |
| Temperature Metrics | Avg. Operating Ambient Temp | 26.8 °C | |
| Avg. Operating Cell Temp | 36.8 °C | ||
| Interrow Spacing | Installed Capacity | Annual Production | Performance Ratio | Load Ratio |
|---|---|---|---|---|
| 1 feet | 1.50 MW | 2.091 GWh | 75.7% | 1.0 |
| 2 Feet | 1.50 MW | 2.195 GWh | 79.5% | 1.0 |
| 3 Feet | 1.50 MW | 2.247 GWh | 81.4% | 1.0 |
| 4 Feet | 1.50 MW | 2.265 GWh | 82.0% | 1.0 |
| Month | GlobHor Irradiance (GHI) (kWh/m2) | Plane of Array (POA) (kWh/m2) | Shaded (kWh/m2) | Nameplate (kWh) | Monthly Power Injected into Grid (kWh) |
|---|---|---|---|---|---|
| January | 88.6 | 109.5 | 107.5 | 152,505.4 | 140,684.6 |
| February | 106.7 | 126.3 | 124.8 | 177,654.7 | 161,177.1 |
| March | 147.5 | 163.8 | 161.9 | 230,795.0 | 203,967.2 |
| April | 166.3 | 173.7 | 171.5 | 244,369.4 | 212,067.0 |
| May | 186.8 | 187.7 | 185.2 | 263,811.6 | 224,561.3 |
| June | 187.1 | 184.2 | 181.7 | 258,717.8 | 221,191.0 |
| July | 170.8 | 169.4 | 167.0 | 237,687.1 | 204,426.7 |
| August | 169.1 | 173.6 | 171.3 | 244,143.8 | 209,753.1 |
| September | 155.9 | 168.5 | 166.5 | 237,238.3 | 205,110.6 |
| October | 130.9 | 150.6 | 148.7 | 211,761.7 | 185,264.5 |
| November | 101.1 | 124.3 | 122.3 | 173,731.0 | 156,122.2 |
| December | 86.9 | 110.7 | 108.2 | 153,325.2 | 140,183.8 |
| Description | Output | % Delta | |
|---|---|---|---|
| Irradiance (kWh/m2) | Annual Global Horizontal Irradiance | 1697.8 | − |
| POA Irradiance | 1842.1 | 8.5% | |
| Shaded Irradiance | 1816.5 | −1.4% | |
| Irradiance after Reflection | 1760.2 | −3.1% | |
| Irradiance after Soiling | 1725.0 | −2.0% | |
| Total Collector Irradiance | 1725.0 | 0.0% | |
| Energy (kWh) | Nameplate | 2,585,741.1 | − |
| Output at Irradiance Levels | 2,574,315.5 | −0.4% | |
| Output at Cell Temperature Derate | 2,399,045.8 | −6.8% | |
| Output after Mismatch | 2,318,348.5 | −3.4% | |
| Optimal DC Output | 2,308,234.9 | −0.4% | |
| Constrained DC Output | 2,308,229.3 | 0.0% | |
| Inverter Output | 2,275,888.4 | −1.4% | |
| Energy to Grid | 2,264,509.0 | −0.5% | |
| Temperature Metrics | Avg. Operating Ambient Temp | 26.8 °C | |
| Avg. Operating Cell Temp | 37.0 °C | ||
| Interrow Spacing | Installed Capacity | Annual Production | Performance Ratio | Load Ratio |
|---|---|---|---|---|
| 1 feet | 1.50 MW | 1.973 GWh | 70.4% | 1.0 |
| 2 Feet | 1.50 MW | 2.137 GWh | 76.3% | 1.0 |
| 3 Feet | 1.50 MW | 2.206 GWh | 78.7% | 1.0 |
| 4 Feet | 1.50 MW | 2.257 GWh | 80.5% | 1.0 |
| Month | GlobHor Irradiance (GHI) (kWh/m2) | Plane of Array (POA) (kWh/m2) | Shaded (kWh/m2) | Nameplate (kWh) | Monthly Power Injected into Grid (kWh) |
|---|---|---|---|---|---|
| January | 88.6 | 115.2 | 109.9 | 156,598.1 | 143,349.0 |
| February | 106.7 | 131.3 | 127.8 | 182,560.2 | 165,074.5 |
| March | 147.5 | 167.3 | 163.2 | 233,119.8 | 205,657.8 |
| April | 166.3 | 174.1 | 169.3 | 241,630.5 | 209,467.0 |
| May | 186.8 | 185.9 | 180.3 | 257,147.7 | 218,755.6 |
| June | 187.1 | 181.1 | 175.7 | 250,411.5 | 214,037.8 |
| July | 170.8 | 167.1 | 161.8 | 230,608.6 | 198,197.3 |
| August | 169.1 | 173.0 | 168.0 | 239,848.0 | 205,885.0 |
| September | 155.9 | 170.8 | 166.2 | 237,391.8 | 204,964.6 |
| October | 130.9 | 155.4 | 151.2 | 216,021.8 | 188,547.9 |
| November | 101.1 | 130.6 | 125.5 | 179,040.3 | 159,860.3 |
| December | 86.9 | 117.3 | 110.8 | 157,959.7 | 142,954.5 |
| Description | Output | % Delta | |
|---|---|---|---|
| Irradiance (kWh/m2) | Annual Global Horizontal Irradiance (GHI) (kWh/m2) | 1697.8 | − |
| POA Irradiance (kWh/m2) | 1869.0 | 10.1% | |
| Shaded Irradiance (kWh/m2) | 1809.7 | −3.2% | |
| Irradiance after Reflection | 1757.9 | −2.9% | |
| Irradiance after Soiling | 1722.7 | −2.0% | |
| Total Collector Irradiance | 1722.7 | 0.0% | |
| Energy (kWh) | Nameplate | 2,582,388.1 | − |
| Output at Irradiance Levels | 2,570,955.7 | −0.4% | |
| Output at Cell Temperature Derate | 2,396,155.5 | −6.8% | |
| Output after Mismatch | 2,310,501.0 | −3.6% | |
| Optimal DC Output | 2,300,328.7 | −0.4% | |
| Constrained DC Output | 2,300,323.0 | 0.0% | |
| Inverter Output | 2,268,092.0 | −1.4% | |
| Energy to Grid | 2,256,751.6 | −0.5% | |
| Temperature Metrics | Avg. Operating Ambient Temp | 26.8 °C | |
| Avg. Operating Cell Temp | 37.0 °C | ||
| Interrow Spacing | Installed Capacity | Annual Production | Performance Ratio | Load Ratio |
|---|---|---|---|---|
| 1 feet | 1.50 MW | 1.868 GWh | 66.1% | 1.0 |
| 2 Feet | 1.50 MW | 2.042 GWh | 72.2% | 1.0 |
| 3 Feet | 1.50 MW | 2.155 GWh | 76.3% | 1.0 |
| 4 Feet | 1.50 MW | 2.206 GWh | 78.0% | 1.0 |
| Month | GlobHor Irradiance (GHI) (kWh/m2) | Plane of Array (POA) (kWh/m2) | Shaded (kWh/m2) | Nameplate (kWh) | Monthly Power Injected into Grid (kWh) |
|---|---|---|---|---|---|
| January | 88.6 | 120.2 | 107.5 | 153,687.2 | 137,497.0 |
| February | 106.7 | 135.6 | 129.4 | 185,444.2 | 166,804.9 |
| March | 147.5 | 169.8 | 163.3 | 233,639.1 | 205,660.4 |
| April | 166.3 | 173.6 | 166.1 | 237,153.2 | 205,271.8 |
| May | 186.8 | 182.9 | 174.4 | 248,706.2 | 211,337.6 |
| June | 187.1 | 177.1 | 168.8 | 240,457.9 | 205,336.7 |
| July | 170.8 | 163.9 | 155.8 | 222,060.8 | 190,595.7 |
| August | 169.1 | 171.5 | 163.8 | 233,873.3 | 200,476.2 |
| September | 155.9 | 172.0 | 164.9 | 235,788.8 | 203,236.8 |
| October | 130.9 | 159.3 | 152.5 | 218,287.6 | 189,894.4 |
| November | 101.1 | 136.1 | 124.9 | 178,793.8 | 157,353.8 |
| December | 86.9 | 123.3 | 106.1 | 151,636.3 | 132,178.9 |
| Description | Output | % Delta | |
|---|---|---|---|
| Irradiance (kWh/m2) | Annual Global Horizontal Irradiance | 1697.8 | − |
| POA Irradiance | 1885.1 | 11.0% | |
| Shaded Irradiance | 1777.5 | −5.7% | |
| Irradiance after Reflection | 1728.7 | −2.7% | |
| Irradiance after Soiling | 1694.2 | −2.0% | |
| Total Collector Irradiance | 1694.2 | 0.0% | |
| Energy (kWh) | Nameplate | 2,539,528.5 | − |
| Output at Irradiance Levels | 2,527,686.8 | −0.5% | |
| Output at Cell Temperature Derate | 2,357,095.7 | −6.7% | |
| Output after Mismatch | 2,257,961.4 | −4.2% | |
| Optimal DC Output | 2,248,236.9 | −0.4% | |
| Constrained DC Output | 2,248,231.1 | 0.0% | |
| Inverter Output | 2,216,727.8 | −1.4% | |
| Energy to Grid | 2,205,644.3 | −0.5% | |
| Temperature Metrics | Avg. Operating Ambient Temp | 26.8 °C | |
| Avg. Operating Cell Temp | 36.8 °C | ||
Publisher’s Note: MDPI stays neutral with regard to jurisdictional claims in published maps and institutional affiliations. |
© 2022 by the authors. Licensee MDPI, Basel, Switzerland. This article is an open access article distributed under the terms and conditions of the Creative Commons Attribution (CC BY) license (https://creativecommons.org/licenses/by/4.0/).
Share and Cite
Tamoor, M.; Habib, S.; Bhatti, A.R.; Butt, A.D.; Awan, A.B.; Ahmed, E.M. Designing and Energy Estimation of Photovoltaic Energy Generation System and Prediction of Plant Performance with the Variation of Tilt Angle and Interrow Spacing. Sustainability 2022, 14, 627. https://doi.org/10.3390/su14020627
Tamoor M, Habib S, Bhatti AR, Butt AD, Awan AB, Ahmed EM. Designing and Energy Estimation of Photovoltaic Energy Generation System and Prediction of Plant Performance with the Variation of Tilt Angle and Interrow Spacing. Sustainability. 2022; 14(2):627. https://doi.org/10.3390/su14020627
Chicago/Turabian StyleTamoor, Muhammad, Salman Habib, Abdul Rauf Bhatti, Arslan Dawood Butt, Ahmed Bilal Awan, and Emad M. Ahmed. 2022. "Designing and Energy Estimation of Photovoltaic Energy Generation System and Prediction of Plant Performance with the Variation of Tilt Angle and Interrow Spacing" Sustainability 14, no. 2: 627. https://doi.org/10.3390/su14020627
APA StyleTamoor, M., Habib, S., Bhatti, A. R., Butt, A. D., Awan, A. B., & Ahmed, E. M. (2022). Designing and Energy Estimation of Photovoltaic Energy Generation System and Prediction of Plant Performance with the Variation of Tilt Angle and Interrow Spacing. Sustainability, 14(2), 627. https://doi.org/10.3390/su14020627