Article

A Multivariate Analysis of the Links between Transport Noncompliance and Financial Uncertainty in Times of COVID-19 Pandemics and War

by
Kamer-Ainur Aivaz
1,*,
Ionela Florea Munteanu
2,*,
Mari-Isabella Stan
3 and
Alina Chiriac
2
1
Faculty of Economic Studies, Ovidius University of Constanta, Aleea Universitatii no.1, 900470 Constanta, Romania
2
Accounting Department, Bucharest University of Economic Studies, 1 Tache Ionescu Street, 010352 Bucharest, Romania
3
Faculty of Law and Administrative Sciences, Ovidius University of Constanta, Aleea Universitatii No.1, 900470 Constanta, Romania
*
Authors to whom correspondence should be addressed.
Sustainability 2022, 14(16), 10040; https://doi.org/10.3390/su141610040
Submission received: 19 June 2022 / Revised: 4 August 2022 / Accepted: 10 August 2022 / Published: 13 August 2022
(This article belongs to the Collection Business Performance and Socio-environmental Sustainability)

Abstract

:
Sanctions should improve business compliance and mitigate the risks of non-conformity. This premise motivated our research and led to very interesting results for the trinomen business performance—transport infrastructure and local development strategies—public control. We used a customized Brunswik lens model to illustrate the decision-making process based on the interactions between the analysis of sanctions in the transport sector and the projected financial judgement, as we have traditionally understood and experienced them. We clustered 186,671 cases of noncompliance sanctioned by the Romanian authorities and created a chromatic map with accents on the risks of nonconformities. We employed principal component analysis to find patterns and correlations between faulty behavior in transport activities and the evolution of financial indicators, such as exports and imports. The ROC curve was used to investigate the credibility of a possible connection between transport sanctions and the development of regional exports and imports. We found multiple challenges that interfere with the projection of a trustworthy financial judgement in transport and offer insights and recommendations for integrated local governance practices and strategies aimed at mitigating the risks of noncompliance and promoting sustainable development in transport.

1. Introduction

When we think about the performance of public services and when we hope to improve our living conditions, we tend to have a series of expectations. Based on current or past information, these expectations can crystalize into a prediction of results. However, it is somewhat difficult to establish exactly whether these expectations will materialize, as the following question arises: Can we trust our prediction or not? Sustainable economic development relies on prediction or balance, but crises bring uncertainty and pressure mainly on the financial decisions that interest or impact the public [1]. The hope for a comfortable life, for “a safe tomorrow”, becomes a worry, and everyone’s attention is mainly focused on the measures taken by public authorities to soften financial shocks.
Today, the global economy faces new challenges and profound imbalances caused by the pandemic context [2] and augmented by the state of war in Ukraine [3]. Economic insecurity is a hot research topic in such a context [4]. Globally, stopping or hampering access to certain resources, the desire or necessity for people to travel as a result of the lifting of traffic bans imposed during the pandemics, and the influx of immigrants during the war are associated with insecurity, instability, and significant disturbances in economic flows. These situations have triggered chaos in the transport sector [5]. The formulation of relevant forecasts of economic sustainability is a topic that requires extensive research. Public governance faces new challenges in the process of adapting administrative and fiscal policies to become efficient, both in economically favorable and unfavorable times [6]. The implementation of sustainable measures in the transport of resources becomes vitally important.
Various studies have investigated the consequences of economic imbalances, such as the effects of Brexit on Global Equity Markets [7], political instability, and the impact on state budget indicators [8]. Recently, the interest in research into the effects of the pandemic [9] or the war in Ukraine has increased considerably. Assuming that although there are many situations in which we cannot trust hypothetical judgment, Broomell [10] argues for the use of statistical analyses on the effects of various events to increase the confidence or predictability of future decisions. This paper agrees with Broomell’s proposal and follows the results of Todd and Gigerenzer’s study [11] as well. According to these scholars, the investigation of various aspects of heuristic learning leads to the idea that judgment must be analyzed in line with the entire decision-making context, emphasizing the importance of the interactions between these two approaches.
At the same time, several studies have tackled the sanctions imposed by the authorities and analyzed their impact from various perspectives, such as the impact of financial sanctions on publicly traded companies [12] or their economic implications [13,14]. These studies proposed various analysis directions to answer questions about the effectiveness of sanctions or the extent to which various forms of punitive measures could contribute to legislative changes. The research impetus is driven by the need to provide strong arguments to analyze the issuance of sanctions from the perspective of their economic efficiency or the achievement of change goals when sanctions are issued in advance [15]. This article fills a research gap concerned with the study of sanctions in transport businesses and argues that a link is important to be established between the risk of nonconformity and the key financial indicators directly linked with transport, such as exports and imports. The paper expands the research on noncompliance in the area of managerial decision-making and addresses concerns about the need for performance of corporate governance systems. Starting from the analysis of errors (of the incidence and specificity of these nonconformities in transport), the managerial approach can provide a rigorous and correct foundation for the implementation of efficient decisions.
Our research was developed in stages. In a first phase, we diachronically analyzed the control exercised by the state to verify compliance of transport operators with the administrative and fiscal measures in force in the transport sector. In the context preceding the emergence of a high level of uncertainty in the global transport circuits of resources and services, this analysis allowed for the mapping of the Romanian transport network. We emphasized the inflections that noncompliance imprints, both in the activity of transport operators and the need to improve the investment decisions taken by local authorities, concerning the transport infrastructure. The nonconformities found in the transport sector were grouped into clusters according to three criteria for assessing transport performance: 1. Driving and rest times, 2. Compliance with the weight and dimensions of transport units and 3. Meeting the legal conditions in the profession of a road carrier. Good knowledge of past nonconformities in the field of transport directly contributes to a strategic foreshadowing of future measures for sustainable economic development or efficient crisis management. We investigated the noncompliant behavior of economic operators according to specific social regulations (Ordinance no. 37/2007 and G.D. no. 69/2012) and the regulations regarding the protection of transport infrastructure and road safety (Ordinance no. 43/1997). This research brings a new perspective to the field of road transport, connecting the dots between poor business behavior, performance, driving safety rules, and the evolution of import and exports. Based on the analysis of the errors found, the proposed analysis model is innovative, and therefore, capable of providing a quantitative assessment of probabilistic financial judgement in the transport sector.

2. Literature Review

2.1. Theoretical Review

Including a complex network of public and private entities, transport is an essential sector of the economy that provides goods and services to both the population and businesses. It represents an important area of economic and social activity under the Sustainable Development Goals (SDGs) set out in the 2030 Agenda for Sustainable Development of the United Nations. The interest in the research carried out in this field stems from the fact that, being a field with a strong multidimensional imprint in terms of connections and dependencies with the economy, society, and the natural environment [16,17], it has continuously required changes in terms of sustainable development [18].
Several scientific studies have analyzed the transport sector in terms of economic, social, and environmental challenges. They have all agreed that transport represents an area of increasing interest as a catalyst for sustainable economic development, both at the EU and global levels [19]. An interesting study by Kuo and his colleagues [20] concludes that transport plays a crucial role in an expanding the economy because it connects production with the trade of goods, while ensuring the mobility of citizens. Meersman and Nazemzadeh [21] considered that the magnitude of the impact of a transport system on the national economy is subject to the level of economic development and varies in rural and urban areas. They proposed transport systems as being among the main determinants of an economy, because through them, economic operators provide transport services at the request of customers who can be public or private entities.
Kumar and Anbanandam [22] addressed the social dimension of transport, as one of the key pillars of the sustainability measurement framework. They emphasized that the subject can be approached through the prism of transport companies carrying out domestic or international transport activities—of people or goods—and thus providing jobs. Through the jobs create, a whole series of social problems faced by communities should be solved, thus improving the quality of life. In terms of equity and disadvantaged people, Stefaniec et al. [23] considered that the social sustainability of transport entails that people should not benefit from this to the detriment of each other. Therefore, road transport operators are expected to operate in such a way that their concern for streamlining their business should not be inconsistent with a fair and sustainable business climate.

2.2. Findings on Transport Performance and Sustainability

Recent studies on services with a great potential to improve transportation sustainability [24] have shown that, worldwide, transport has a considerable impact on public health, with issued related to quality of life, such as noise, air pollutants, and road safety. Regarding other determinants that can affect the public health, Țăran et al. [25] high-lighted that the COVID-19 pandemic continues to have a negative impact, repercussions, and consequences on the whole of society. The overcrowding of large cities and the occupation of larger and larger areas of land as an effect of urban sprawl have also inevitably generated a host of negative effects on the environment; therefore, attention was primarily focused on road transport [26,27], which is characterized by an increase in the number of accidents and a higher level of carbon emissions.
Although sustainable development is often associated with a sustainable transport system, due to the well-known impact of transport on the environment and society [28], recently, in the context of the COVID-19 pandemic and the war in Ukraine, there have been unprecedented challenges in achieving the goals of sustainable transport [29,30].
Among all models of transportation, road transport has a special complexity due to the impact of economic and investment constraints, as well as institutional policies. The organizational structure of the public institutions that implement transport policy together constitutes a force responsible for ensuring effective supervision of the regulations and procedures of a large number of entities that carry out transport activities. To maintain the sustainability of the transport system, it is necessary to develop transport system control procedures and powerful measurement and decision-making tools [18].
The constant pressure to innovate and improve performance has led public sector organizations to look for more efficient management methods and tools [31]. Road transport was considered a development priority for the national Romanian transport policy, including investments in infrastructure and the creation of a sustainable partnership with the business environment. Employers’ organizations for national and international carriers, together with public authorities, establish (through social dialogue) how to carry out road transport at national and international levels, bearing in mind that legislation, policies, and contracts assign specific strategic, tactical, and operational tasks to public and private entities [32]. Although the transport sector has a considerable impact on safety issues, Grinerud et al. [33] stated that the way management decisions can affect the ability of businesses to develop an appropriate safety culture is related to employees living outside the physical confines of the workplace. Therefore, to improve transport services, companies must constantly improve the quality of training for safety reasons. Such effort will lead to a reduction in road safety nonconformities, which influence the frequency of road accidents and the excessive pressure on road infrastructure, thus reducing, in general, economic costs and the expected impact on the environment.

2.3. Nonconformity and Control of Transport Businesses

This study starts from the premise that compliance in transport activities is essential to establish the balance between supply and demand, contributes to the development of local businesses, and also ensures resilience against crisis situations. The paper also analyzes the connections and interdependencies generated by the trinomen business performance—transport infrastructure and local development strategies—public control, using an algorithm that determines the reasoning inspired by the lens model developed by Brunswik [34]. Businesses operating in the road transport industry faces various challenges, ranging from a series of internal determinants in the area of management and organization, to external interference caused by the control exercised by public authorities. The situation of road infrastructure is determined by public strategies and the state’s plan for the development of road networks, storage, and transport facilities [35]. To develop road transport in a safe and efficient way, as part of a sustainable transport system, the control force performs several tests on the issue of conformity. In general, controls investigate aspects such as the following: the access to the labor market; the fairness of competition; different social issues, such as driving time and rest; the compliance with the tolling system, or other international agreements. The civil sanctions imposed by control institutions must correct the way in which the relevant legislation is complied with, on the one hand, and, on the other hand, they may trigger the loss of the credibility of a road transport operator, depending on the number of infringements. Therefore, the implementation of strict and fair controls should lead to the improvement of the business environment, the enhancement of competition between transport operators, and finally, to economic growth, social sustainability, and environmental protection. Wang et al. states that in some countries, the inefficient use of resources can prevent the promotion of financial activities to achieve high economic growth [36]. We have not identified studies that develop qualitative or quantitative statistical analyses on the connection between punitive measures applied by authorities and the effects of these measures on financial indicators strongly interconnected with the transport sector, such as imports or exports. Against that background, this research fills the gap and proposes a reflective analysis.
In Romania, the national transport system plays a key role in the economy and consists of a complex set of elements: carriers, beneficiaries of transport services, controllers, and decision-makers. All of these entities are interacting and integrated into the geographical area through multiple and complex mutual relationships. Road transport is an important part of the global national transport network, along with rail, sea, and air transport. At the national level, the permanent specialized technical body that ensures the inspection and control of compliance with national and international regulations in the field of road transport is the State Inspectorate for Control in Road Transport (I.S.C.T.R.) Within this body, I.S.C.T.R. inspectors perform controls both in traffic and at the headquarters of road transport operators.
The activity of control in road transport is complex and carried out according to several normative acts, by different authorities with attributions in the transport sector or in adjacent fields. Thus, to improve road safety, the I.S.C.T.R. carries out joint actions with other state institutions with control competencies, such as: Traffic Police, Romanian Gendarmerie, Border Police, National Agency for Fiscal Administration—General Directorate for Fiscal Antifraud, National Company of Motorways and National Roads in Romania, National Sanitary Veterinary and Food Safety Authority, and Labor Inspection.
This paper analyzes the results of the control activities carried out by authorities in the transport sector and relates them to two key financial indicators specific to this sector. The authors of this study started from the premise that the reduction in the incidence of risk in making economic decisions and the outline of predictability premises are highly dependent on the performance of the public control of transport.

2.4. Concerns about Transport Inbalances

Global pandemic transport and socialization bans created imbalances in the supply chains of goods and services, and thereby created social instability [37] and severely affected economic sectors or small businesses with increased financial fragility [38]. The context of the war against Ukraine has brought about serious social and environmental challenges, as well as economic pressures with a severe global impact [3]. Considering that social imbalances and hampered access to food or energy resources can entail serious cross-border effects, the development of transport research is of strategic importance. To create the preconditions for ensuring transit flows capable of effectively contributing to the implementation of economic recovery measures, it is necessary to carefully identify the preexistence of nonconformities in the transport sector.
Romania’s geopolitical position has polarized the attention of specialists who are particularly interested in this country from the perspective of unblocking the transport of resources from the territories at war toward European states. At the same time, in accounting for the requirements of a rapid increase in transport flows, due to the interest in developing common strategies to streamline transport, the Romanian governance has a major responsibility for managing the flows of transported goods and improving the current infrastructure.
The relationship between people’s expectations and financial decision-making processes is gaining momentum, especially in times of global destabilization. Public confidence needs to be directed toward governance factors, and the demand for stability sometimes crystalizes into expectations for a concrete and sustainable state action plan. Such an expectation could be formulated as follows: How effectively does the state control the transport activity, and how efficient are the measures for streamlining the resource networks? This research aimed to identify the answers to these questions.

3. Proposed Approach

3.1. Reflections on the Choice of the Research Model

The relationship between people’s perception of economic phenomena and economic conjunctural developments cannot be seen as one of mutual causality. It is more an interconnected relationship or a correlative-explanatory expression. The theory of a probabilistic environment or the decision-making process developed by Brunswik [34], based on the lens model, inspired this study in the sense of proposing an algorithm to determine the predicted results starting from a series of verifiable conjunctural cues.
During periods of economic imbalance, the need for security in the financial decision-making process has a major impact on both the business environment [39] and decision-makers in the governance mechanism or the general public. Dima et al. [40] found evidence that for European countries, higher levels of credibility and effectiveness of public policies and institutions have a positive and robust impact on society in general and businesses in particular. Stability is gaining vital importance in the supply chain. Thus, the analysis of the conjunctural context and the interdependencies of the factual analyses that compete for the formulation of probabilistic scenarios impel the need for research. The general hypothesis proposed for testing is as follows: How do the control measures ordered by public authorities, which have resulted in fines for several nonconformities, contribute to the streamlining of transport circuits and to the improvement of macroeconomic financial indicators, determined by the efficiency of transport networks?
As shown in Figure 1, this study was conducted in several stages, structured in an algorithm inspired by the lens model developed by Brunswik [34]. Each stage of research contributed to the achievement of the general objective of the research, that is, investigating the inflections triggered by the signaling of non-conformities in the formulation of probabilistic reasoning.
The analysis of probabilistic reasoning, based on the lens model, starts from the factual decision-making processes, from the verifiable results integrated in the information resulting from previous activities—the right side of the graph in Figure 1. The connection of the constructed reasonings with various other environmental cues allows the “connection of benchmarks” and the formulation of hypothetical conclusions or judgements—the left side of the graph in Figure 1. For example, a large number of fines imposed by the authorities should discourage future misconduct; in other words, these fines would be expected to boost voluntary compliance and streamline transport-specific processes.
Studies based on judgement algorithms have developed significantly [41,42,43]. Starting from the equation developed by Hammond [44] and other similar research studies [45], this paper proposes to examine the accuracy of hypothetical judgment, which is analyzed in the context of environmental cues, in correlation with factual judgement (1):
R = R j f × R j h + I R
where R = achievements, Rjf = factual results, Rjh = predictability, IR = residual knowledge.
The importance of the research model extends to practical utility in three ways. On the one hand, business performance can be stimulated by better compliance with the legislative repertoire, while reducing specific operational risks and allocating fewer resources to fines. On the other hand, the detection and sanctioning of transport nonconformities and the provision of a set of appropriate administrative reforms to reduce the risk of noncompliance could lead to the development of local public infrastructure or strategies related to transport activities that play a significant role in sustainable local development. Third, deepening the study on the sanctions imposed and the infringed regulations could actively contribute to the improvement of control procedures and risk-prevention techniques. The results of this study have identified the need for strategic coordination of governance and operational streamlining processes in the transport of resources and products.

3.2. Experimental Method

To verify expectations regarding the practical utility of some factual results derived from administrative acts of control, the development of the research in several stages was necessary. In the preliminary research stage, the database was created by collecting and systematizing publicly available data on sanctions applied in the transport sector. The database was compiled from data from the Romanian State Inspection of Road Transport Control-ISCTR.
As a first step, the indicators were investigated from a critical perspective, with a special focus on noncompliance. The incidence of nonconformities with specific transport regulations and the incidence or persistence of certain types of errors in different geographical areas offer new research directions. An objective of this first stage was to analyze the extent to which noncompliance research can contribute to the broader objective of reducing nonconformities in transport and enhancing operational efficiency.
Given that the statistical variables employed—nonconformities—are numerical in nature, to group the territorial units analyzed into homogeneous clusters of units, the hierarchical cluster and the K-means cluster were utilized. The hierarchical cluster aimed to form homogeneous clusters of statistical units so that the units belonging to a cluster were as “close” as possible in terms of the values recorded for statistical variables, and the units belonging to different clusters were as “distant” as possible. In other words, the aim was to minimize the internal variance in each cluster—the intra-cluster variance—and maximize the variance between the clusters—the inter-cluster variance. After identifying the optimal number of clusters, the K-means cluster method allowed for the characterization of the statistical units in each cluster by calculating the average levels of variables per cluster [46]. The results also allowed for the mapping of the sanctions applied in territorial units, the chromatic hues being amplified by the agglomeration of sanctions in a territorial unit. The situation of the maps with chromatic hues—per year and per the three regulatory directions in the transport sector—is presented in Appendix A.
The second stage of the study aimed to identify the connections or associations between statistical variables and reduce the size of the data to an optimal number of linear combinations of variables—principal components—to obtain the greatest differences between statistical units. To achieve these objectives, we used the principal component analysis (PCA) method [46]. This exploratory method was introduced to identify the indications that support or disprove the following hypothesis:
H1. 
Nonconformities and sanctions are risk indicators that influence the evolution of financial indicators strongly interconnected with the transport sector, such as the value of imports and exports.
This study started from the premise that the size of imports but also mainly of exports is strongly influenced by the quality of roads, the quality of public services at customs, the observance of legal transport conditions, and working/rest times. Therefore, one of the expectations the study set out to test was to what extent improvement or worsening of compliance with transport regulations influenced the evolution of the value of imports (CIF) or exports (FOB).
In the third stage, the results obtained via PCA were further tested by analyzing the operating characteristic of the receiver (ROC curve) [47]. The evolution of the number of fines in transport activities was investigated in relation to the evolution of some macroeconomic financial indicators strongly influenced by the transport sector, such as the evolution of the value of exports and imports of goods and products from/to Romania. The evolution of absolute variables was transformed into indexes calculated with the base chained. The tested hypothesis was:
H2. 
There is a significant connection between the decrease in the number of sanctions issued for transportation nonconformities and the increase in the value of exports and imports of goods and products.

4. Results and Discussion

4.1. Indicators’ Description and Data Classification

The diachronic investigation of the incidence of errors allowed for mapping of the transport network according to the risk of noncompliance, with areas of more or less nonconformities being marked by different chromatic hues. The analysis was carried out in three legally regulated directions to evaluate the conformity of transport activity on Romanian territory: with legal conditions to exercise the occupation of a road carrier (GD 69/2012), driving and rest times (GO 37/2007), and limits on the weights and dimensions of the transport units (GO 43/1997). The indicators used are explained in Table 1. The study analyzed 186,671 nonconformities in connection with the regulations in force, sanctioned by the authorities with control attributions on the Romanian territory, between 2016 and 2021.
According to Romanian regulations, the value of the sanctions applied by the control authorities is established according to certain legal criteria and the professional reasoning of the inspectors with control attributions. Regardless of the quantum value of the sanctions applied based on the three regulatory directions studied, the infringer has the legal right to pay less than the imposed value of the respective fine, within a given time. As a result, the value of civil sanctions applied by the authorities during the analysis period was not considered sufficiently relevant; the number of sanctions applied by the control authorities was chosen as an indicator for the analysis.
As shown in Table 1, between 2016 and 2021, most civil sanctions were applied for minor nonconformities related to regulations on the legality of transport services (GD no. 69/2012); with regard to the nonconformities found in connection with the observance of driving/ rest times (GO no. 37/2007) or the observance of the weight and/or dimensions allowed by legislation (GO no. 43/1997), the applied sanctions were mainly for serious cases. Most nonconformities sanctioned in the analyzed period were related to the breach of the provisions of GO no. 37/2007 regarding the driving time, the periods of compulsory rest in the driving schedule, the salary according to the risk criteria for safe driving, drawing up tachograph diagrams, etc.
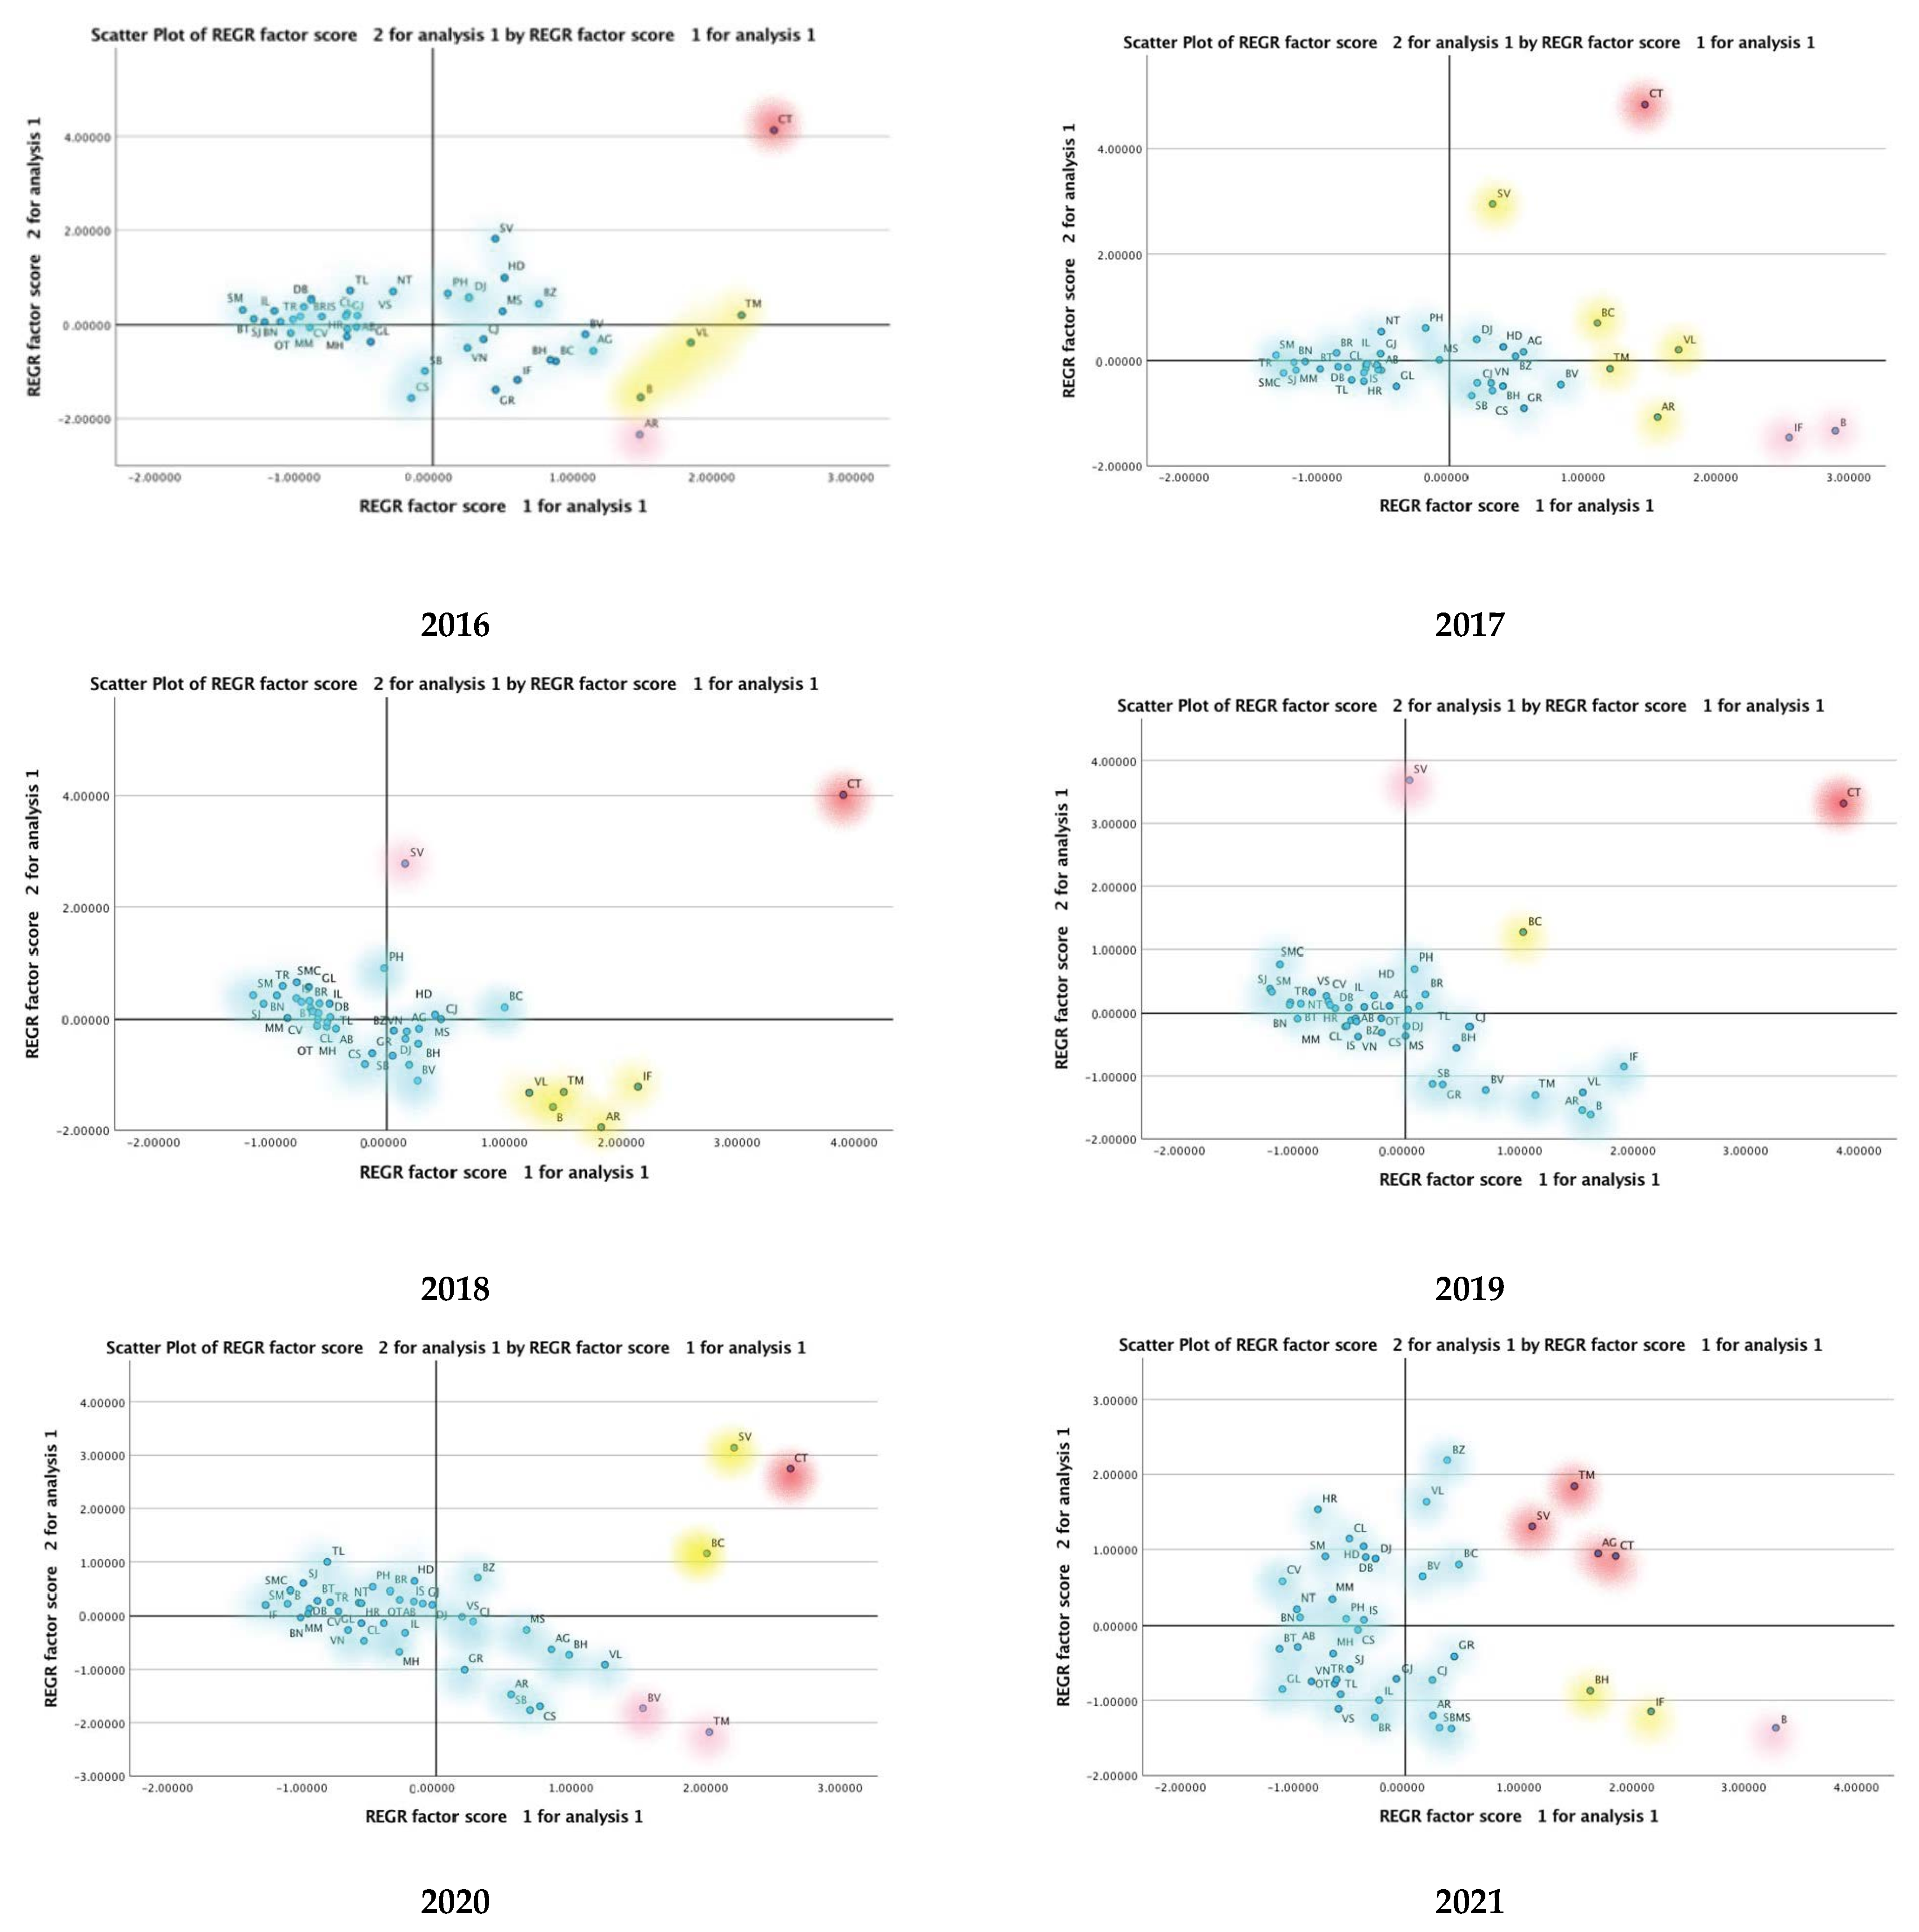
The next stage of the study aimed to create a territorial profile of the offences, that is, map the predilection for offences with the chromatic accentuation of the areas with an increased risk of noncompliance. The methods used in this analysis stage were hierarchical clustering and K-means clustering. The structure of the clusters, resulting from the cluster membership outputs corresponding to each analyzed year, is presented in Figure 2.
After choosing the optimal number of clusters where the data could be grouped—in our case, four—for the purpose of their characterization, we applied the ANOVA statistical test, considering the formed clusters as dependent variables; as far as the independent variables were concerned, we took into account the nine quantitative variables pursued, i.e., the number of sanctions applied for: failure to meet the legal conditions when performing the profession of road carrier (GD 69/2012) with very serious, serious, or medium nonconformity; noncompliance with the regulations on driving and rest times (GO 37/2007) with very serious, serious, or medium nonconformity; noncompliance with the limits on the weights and dimensions of transport units (GO 43/1997) with very serious, serious, or medium nonconformity.
Table 2 shows the values of the significance tests resulting from the application of the ANOVA method. The estimated parameters with ANOVA are presented in Appendix B.
The results show that, for a significance threshold of 0.05, there are significant differences between the averages on the four clusters of the following variables: GD69No_VS, GD69No_S, GD69No_M, GO37No_VS, GO37No_S, GO37No_M, and GO37No_M. These results show that all these variables have a statistically significant influence on the grouping of units into clusters. The only variable that does not contribute significantly to clustering is GO43No_M.
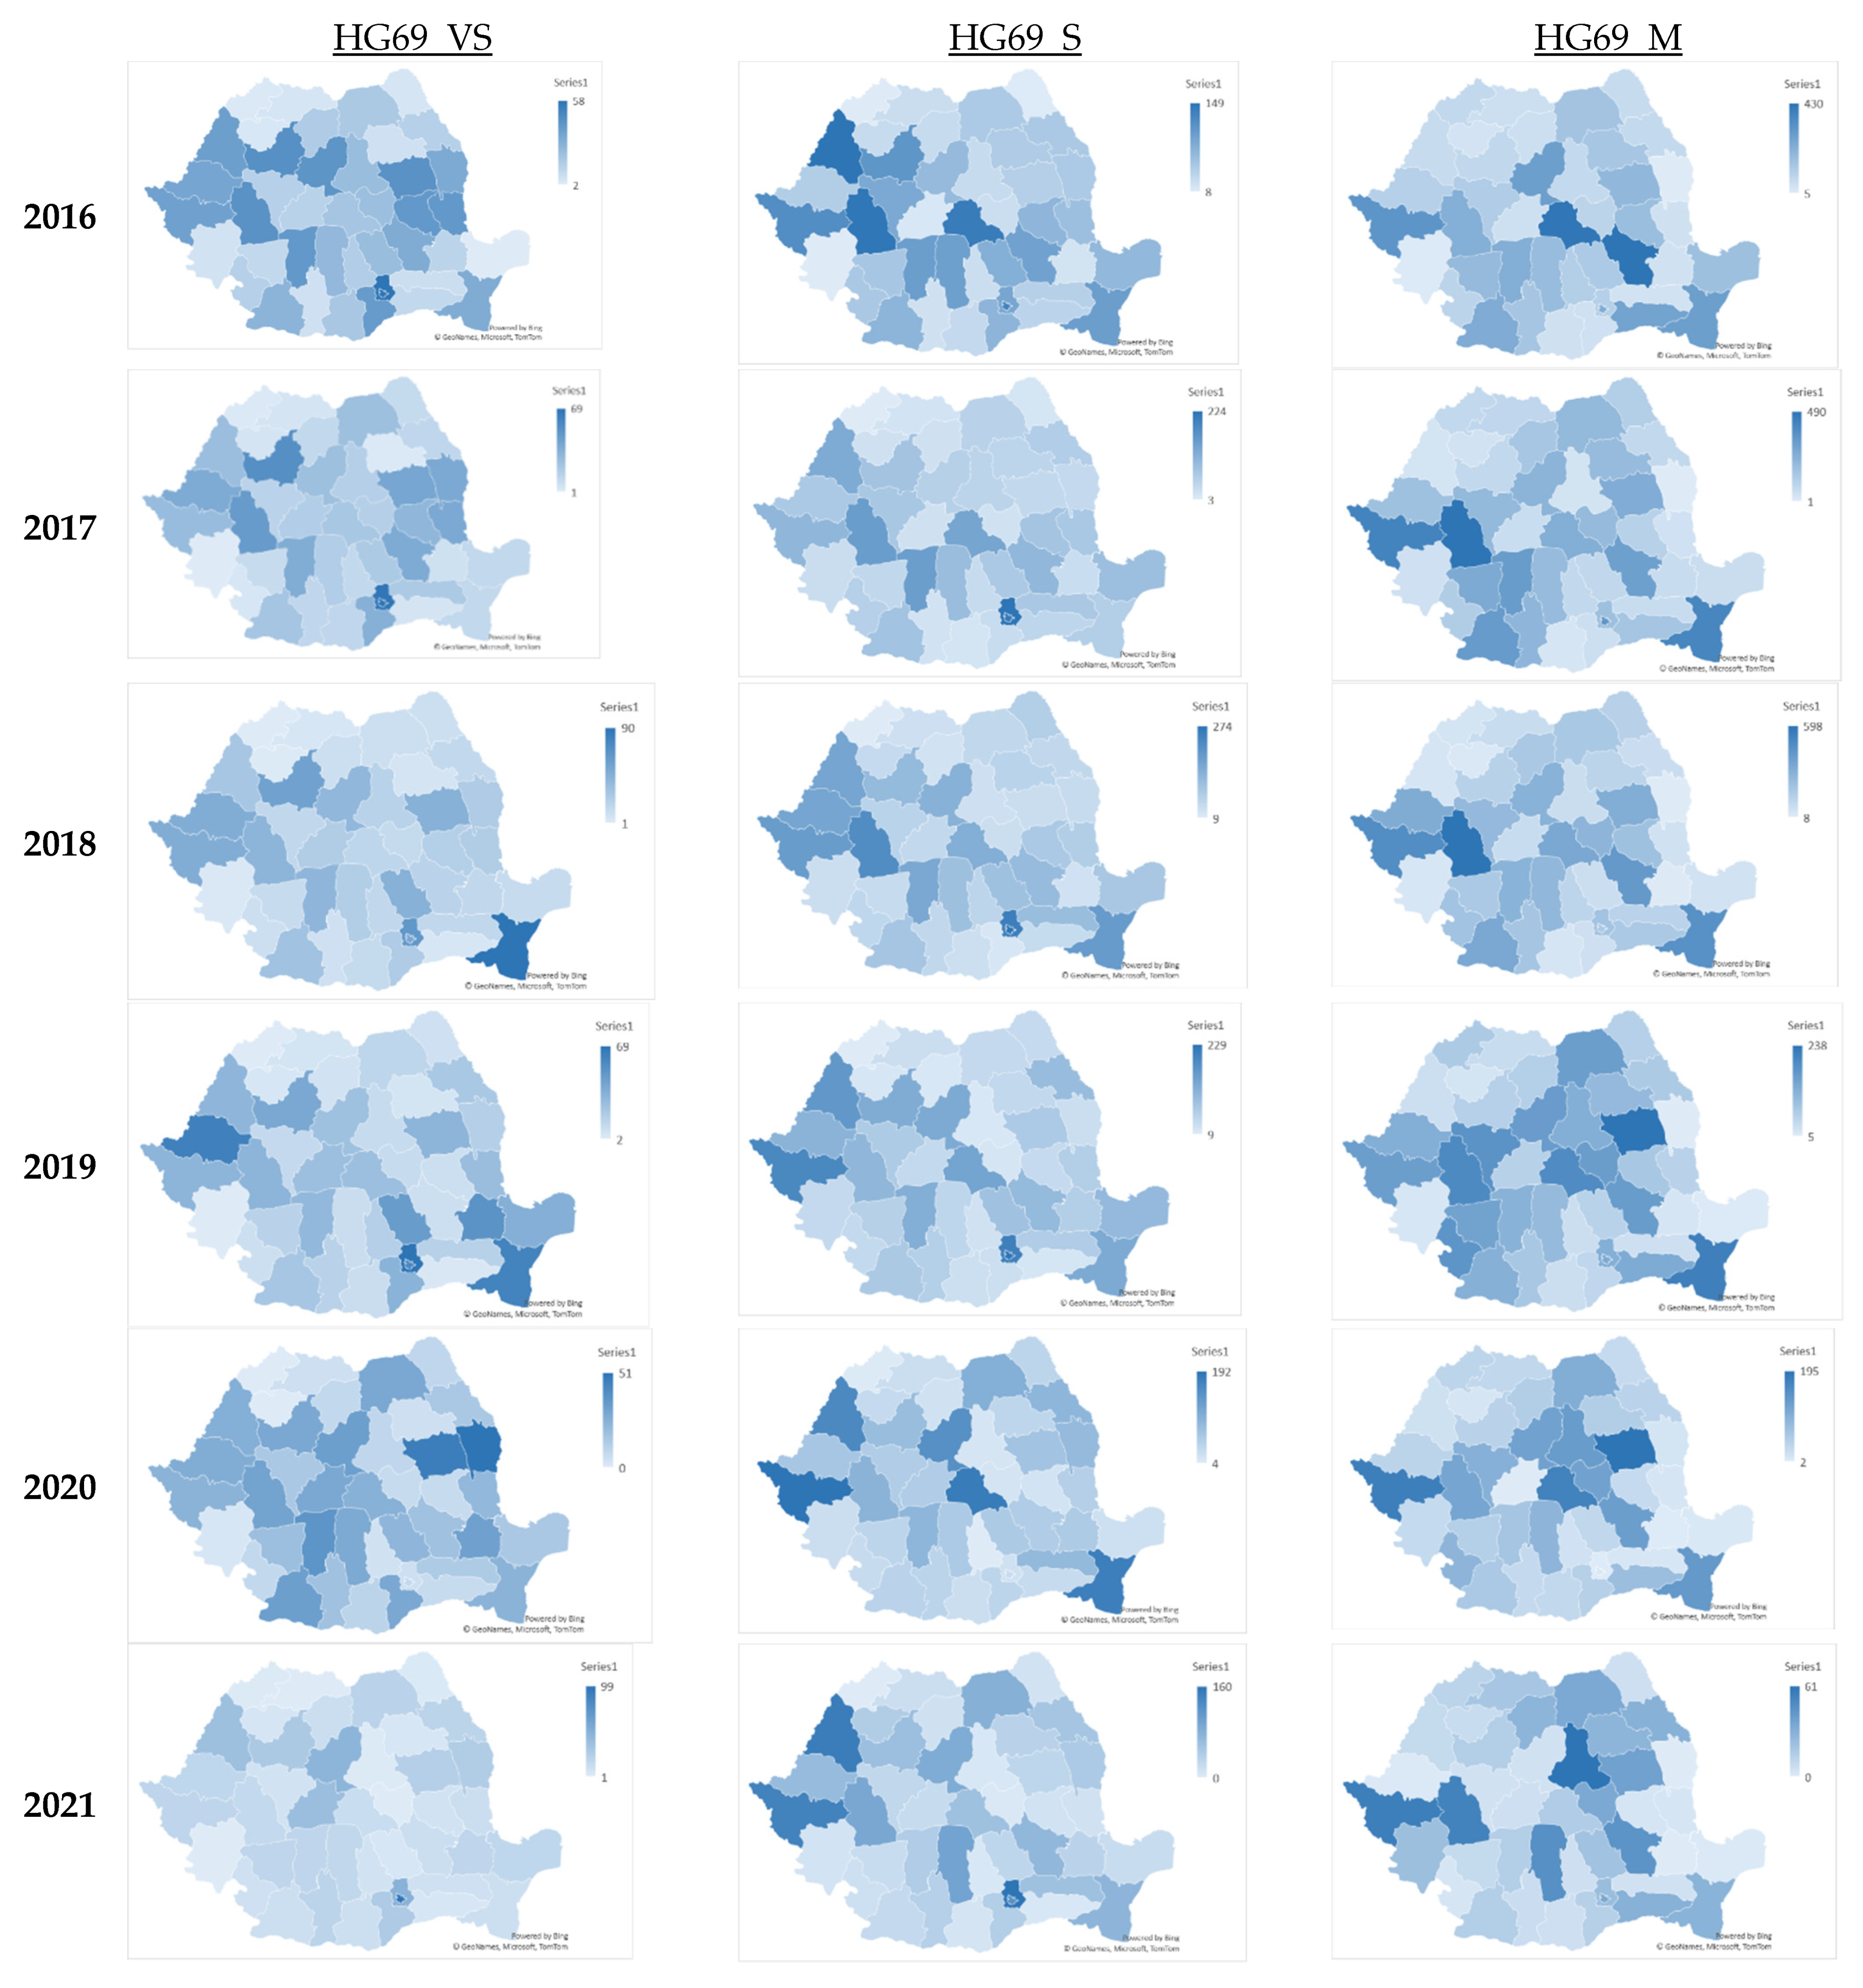
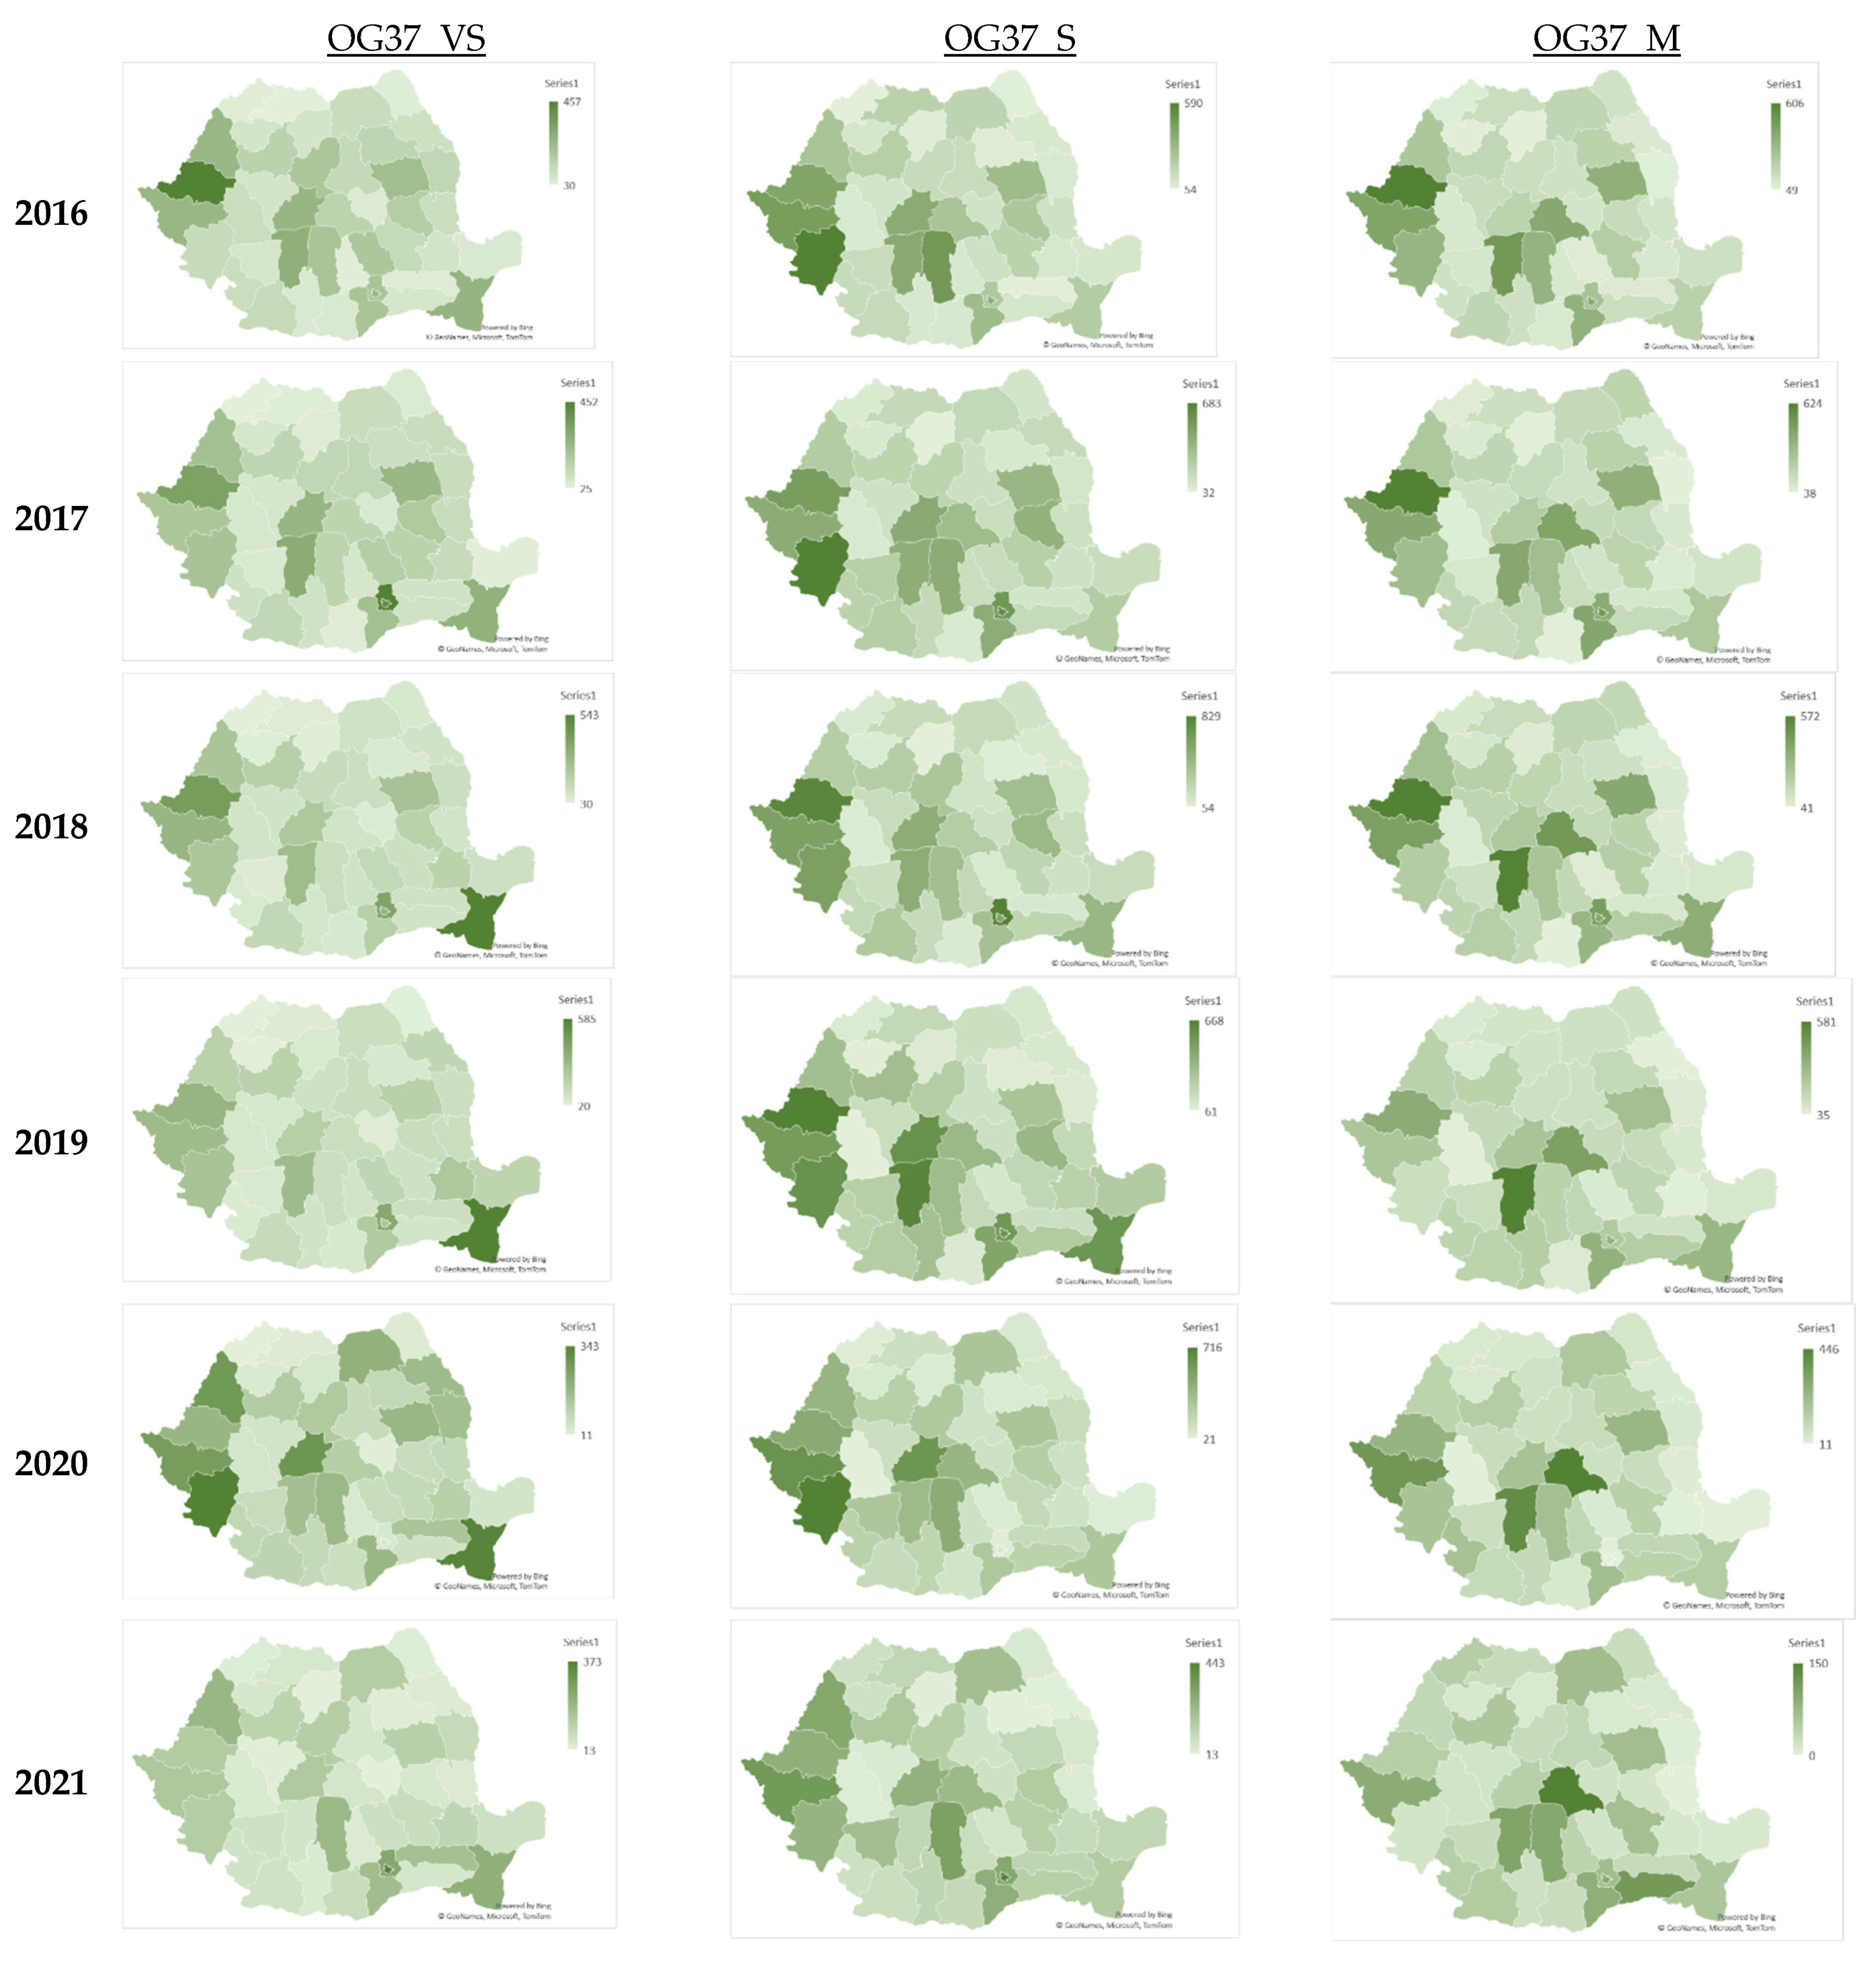
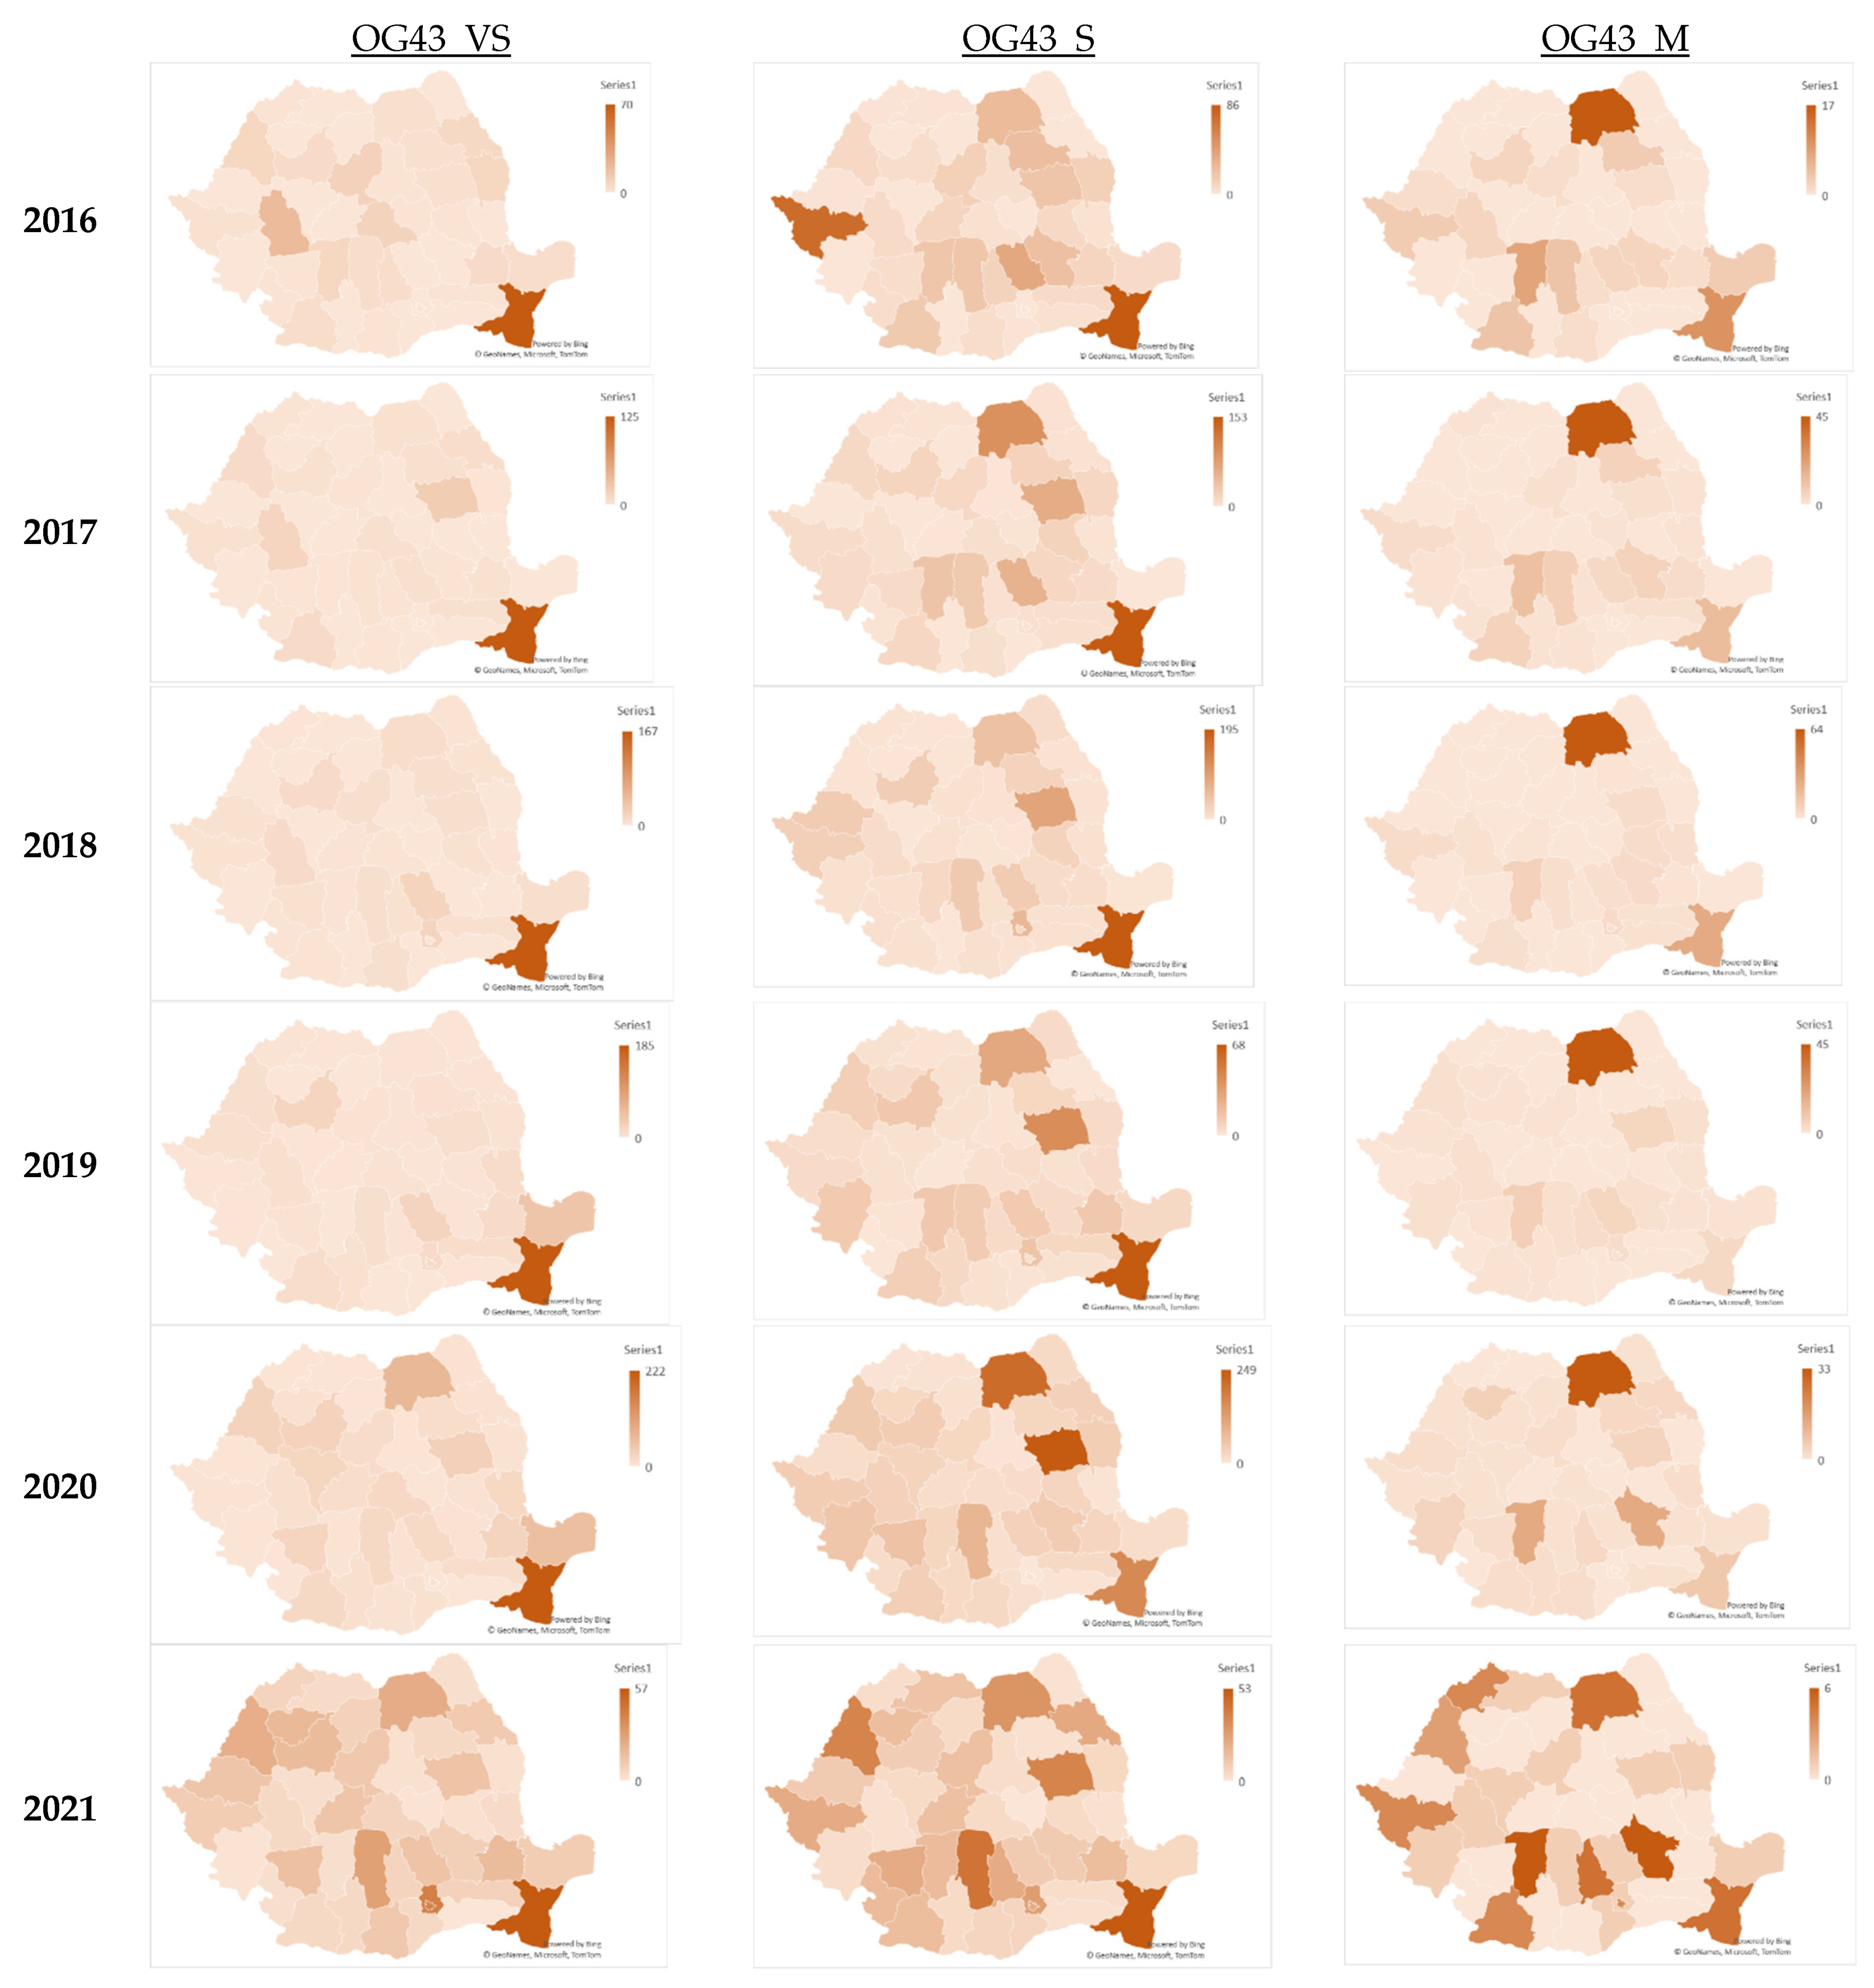
The territorial graphs resulting from the analysis are presented in Appendix A. The results of the analysis indicate that border areas, port areas, and road junctions present a high risk of noncompliance, and the number of sanctions applied by the authorities was concentrated in such areas.
It should also be noted that in terms of deviations from road regulations and the violation of the maximum weight and/or dimensions allowed by law, the counties of Suceava and Constanta have played a leading role as far as the number of sanctions is concerned.
Given that the grouping of nonconformities by geographical areas and types revealed certain zonal concentrations over time, the study left unresolved the question of the extent to which the results of the controls carried out by the Romanian transport authorities influenced the measures taken to resolve the situation. The study instead sought to analyze the impact of nonconformities on some indicators regarding investments in road infrastructure, in the fluidization of transport networks, or on some macroeconomic indicators. As the indicators of the investment made by the authorities for the improvement of road infrastructure could not be based on publicly available comparable information, the study continued to investigate the influence of control measures on economic indicators, such as the value of imports and exports of goods.

4.2. Dimension Reduction of Data with the PCA Method

The database was processed to obtain comparable indicators. In this regard, the numerical indicators were transformed into annual indices calculated with the base chained.
The statistical relevance [48] of the analysis was verified by the Kaiser–Meyer–Olkin (KMO) indicator. The result, i.e., 0.726, indicated a good relevance or adequacy of the sampling based on the available data, as shown in Table 3.
The correlation matrix (Table 4) indicated a series of statistically significant connections between the indicators analyzed. However, the connections between the export (FOB) or import (CIF) financial indicators and the indicators used to express the number of non-conformities were not statistically significant, being outside the range of ±0.05. The prediction based on which civil sanctions applied for nonconformities in the transport sector could make a significant contribution to the development of export or import indicators could not be validated.
A statistically significant relationship was observed in the relationship between the nonconformities sanctioned by the authorities regarding the observance of driving/rest times (GO37) and the compliance with the legality of transport services (GD69). The strong connection between these indicators suggests that the fines issued by the authorities are often combined, thus increasing the likelihood of a combined sanction of nonconformities.

4.3. Sensitivity and Specificity Analysis with the ROC Curve

In the global context, the Romanian transport sector is under pressure from the effects of economic imbalances. However, in addition to external challenges, a significant local challenge is represented by outdated infrastructure and the rising operational costs. Given the changes in consumer behavior and resource flows, road freight transport in Romania has increased in recent years. The need to improve infrastructure investment should be complemented by the modernization of railway networks. An expected logical consequence, which encourages research as this has not yet been proven, is that the adaptation of the transport regulation package and the objectives of the decision-making strategies adopted by the government have improved as a result of the punitive measures imposed after the controls carried out by the authorities. Considerations around how this can be determined still require a solution.
Although the preference for the use of the PCA method has animated studies by several researchers, the advantages and disadvantages of its use also have a long history of debate [
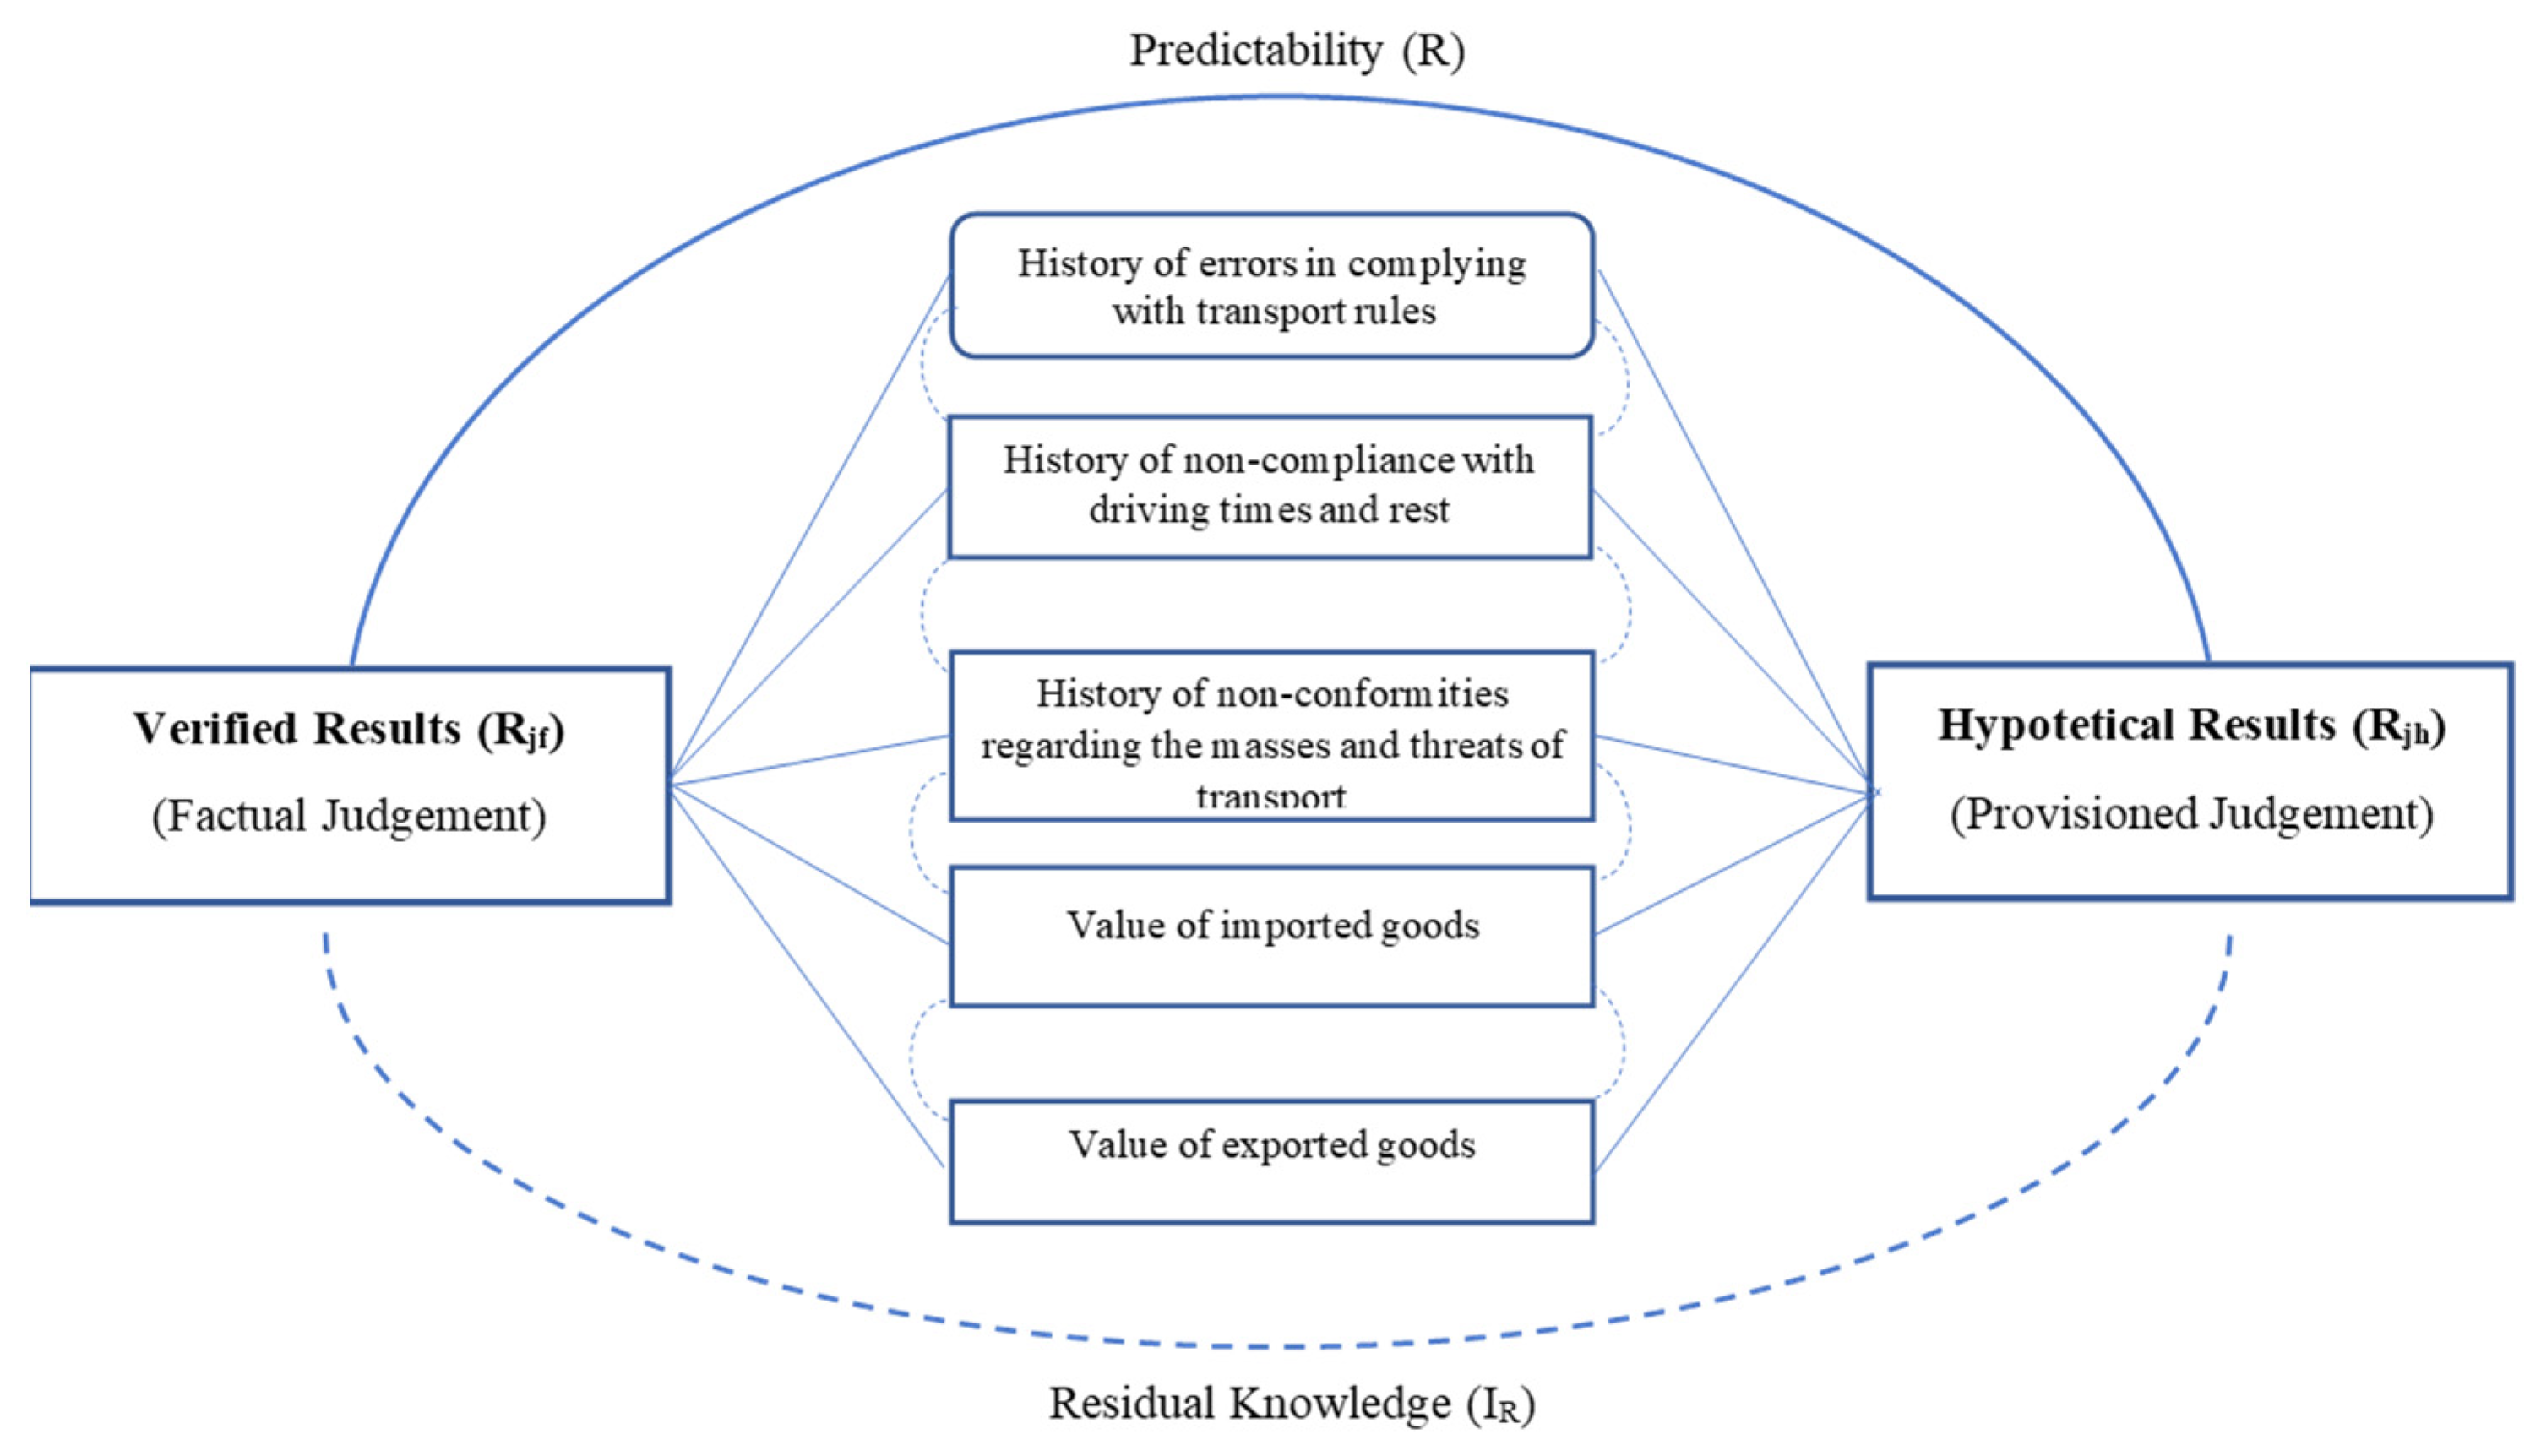
49]. In many cases, theorists have reached a consensus on the need to test the results of PCA and other methods of econometric analysis. Our study addressed the need to further test the results by analyzing the operating characteristic of the receiver—the ROC curve—to investigate the predictable results in the context of a preexisting verifiable judgment.
The development of studies using the ROC curve has had an extensive course; the method is applied mainly in the medical field, natural sciences, and machine learning, and has been recently developed in economics [39,47]. The ROC curve can be very useful to visualize the sensitivity and specificity of the predicted results. According to previous studies, the use of the ROC curve can prove very effective to present and further verify the accuracy of different estimated judgments modeled with the Brunswik lens algorithm. [47].
Starting from the nonconformities sanctioned by the Romanian authorities with control attributions in the transport sector, we attempted to identify a connection between the noncompliance risk indicators—the applied fines and the possibility to improve the exports and imports.
To test this hypothesis, the evolution of the number of fines applied in transport activities was shown in the indices, and the positive evolution was associated with the nominal indicator of the evolution of the nonconformities found by control authorities (EV_GD69, EV_GO37, EV_GO43). The degrees of severity of the nonconformities were also kept in the study: very severe (VS), severe (S), and medium (M). If the number of fines applied by categories of sanctions increased, the nominal indicator of the evolution was “yes”, and if the number of nonconformities decreased, the nominal indicator was “no”.
The null hypothesis (H0) tested at this stage was the following: There is a significant connection between the decrease in the number of fines issued for transportation nonconformities and the increase in the value of exports and imports of goods and products. The analysis was performed with differentiated tests for exports and imports, respectively.
The distribution of the evolution of cases of the number of civil sanctions issued for the nonconformities found by authorities in the transport sector is shown in Table 5. In 79 of the cases of decrease in the number of fines, increases in the evolution of exports were observed.
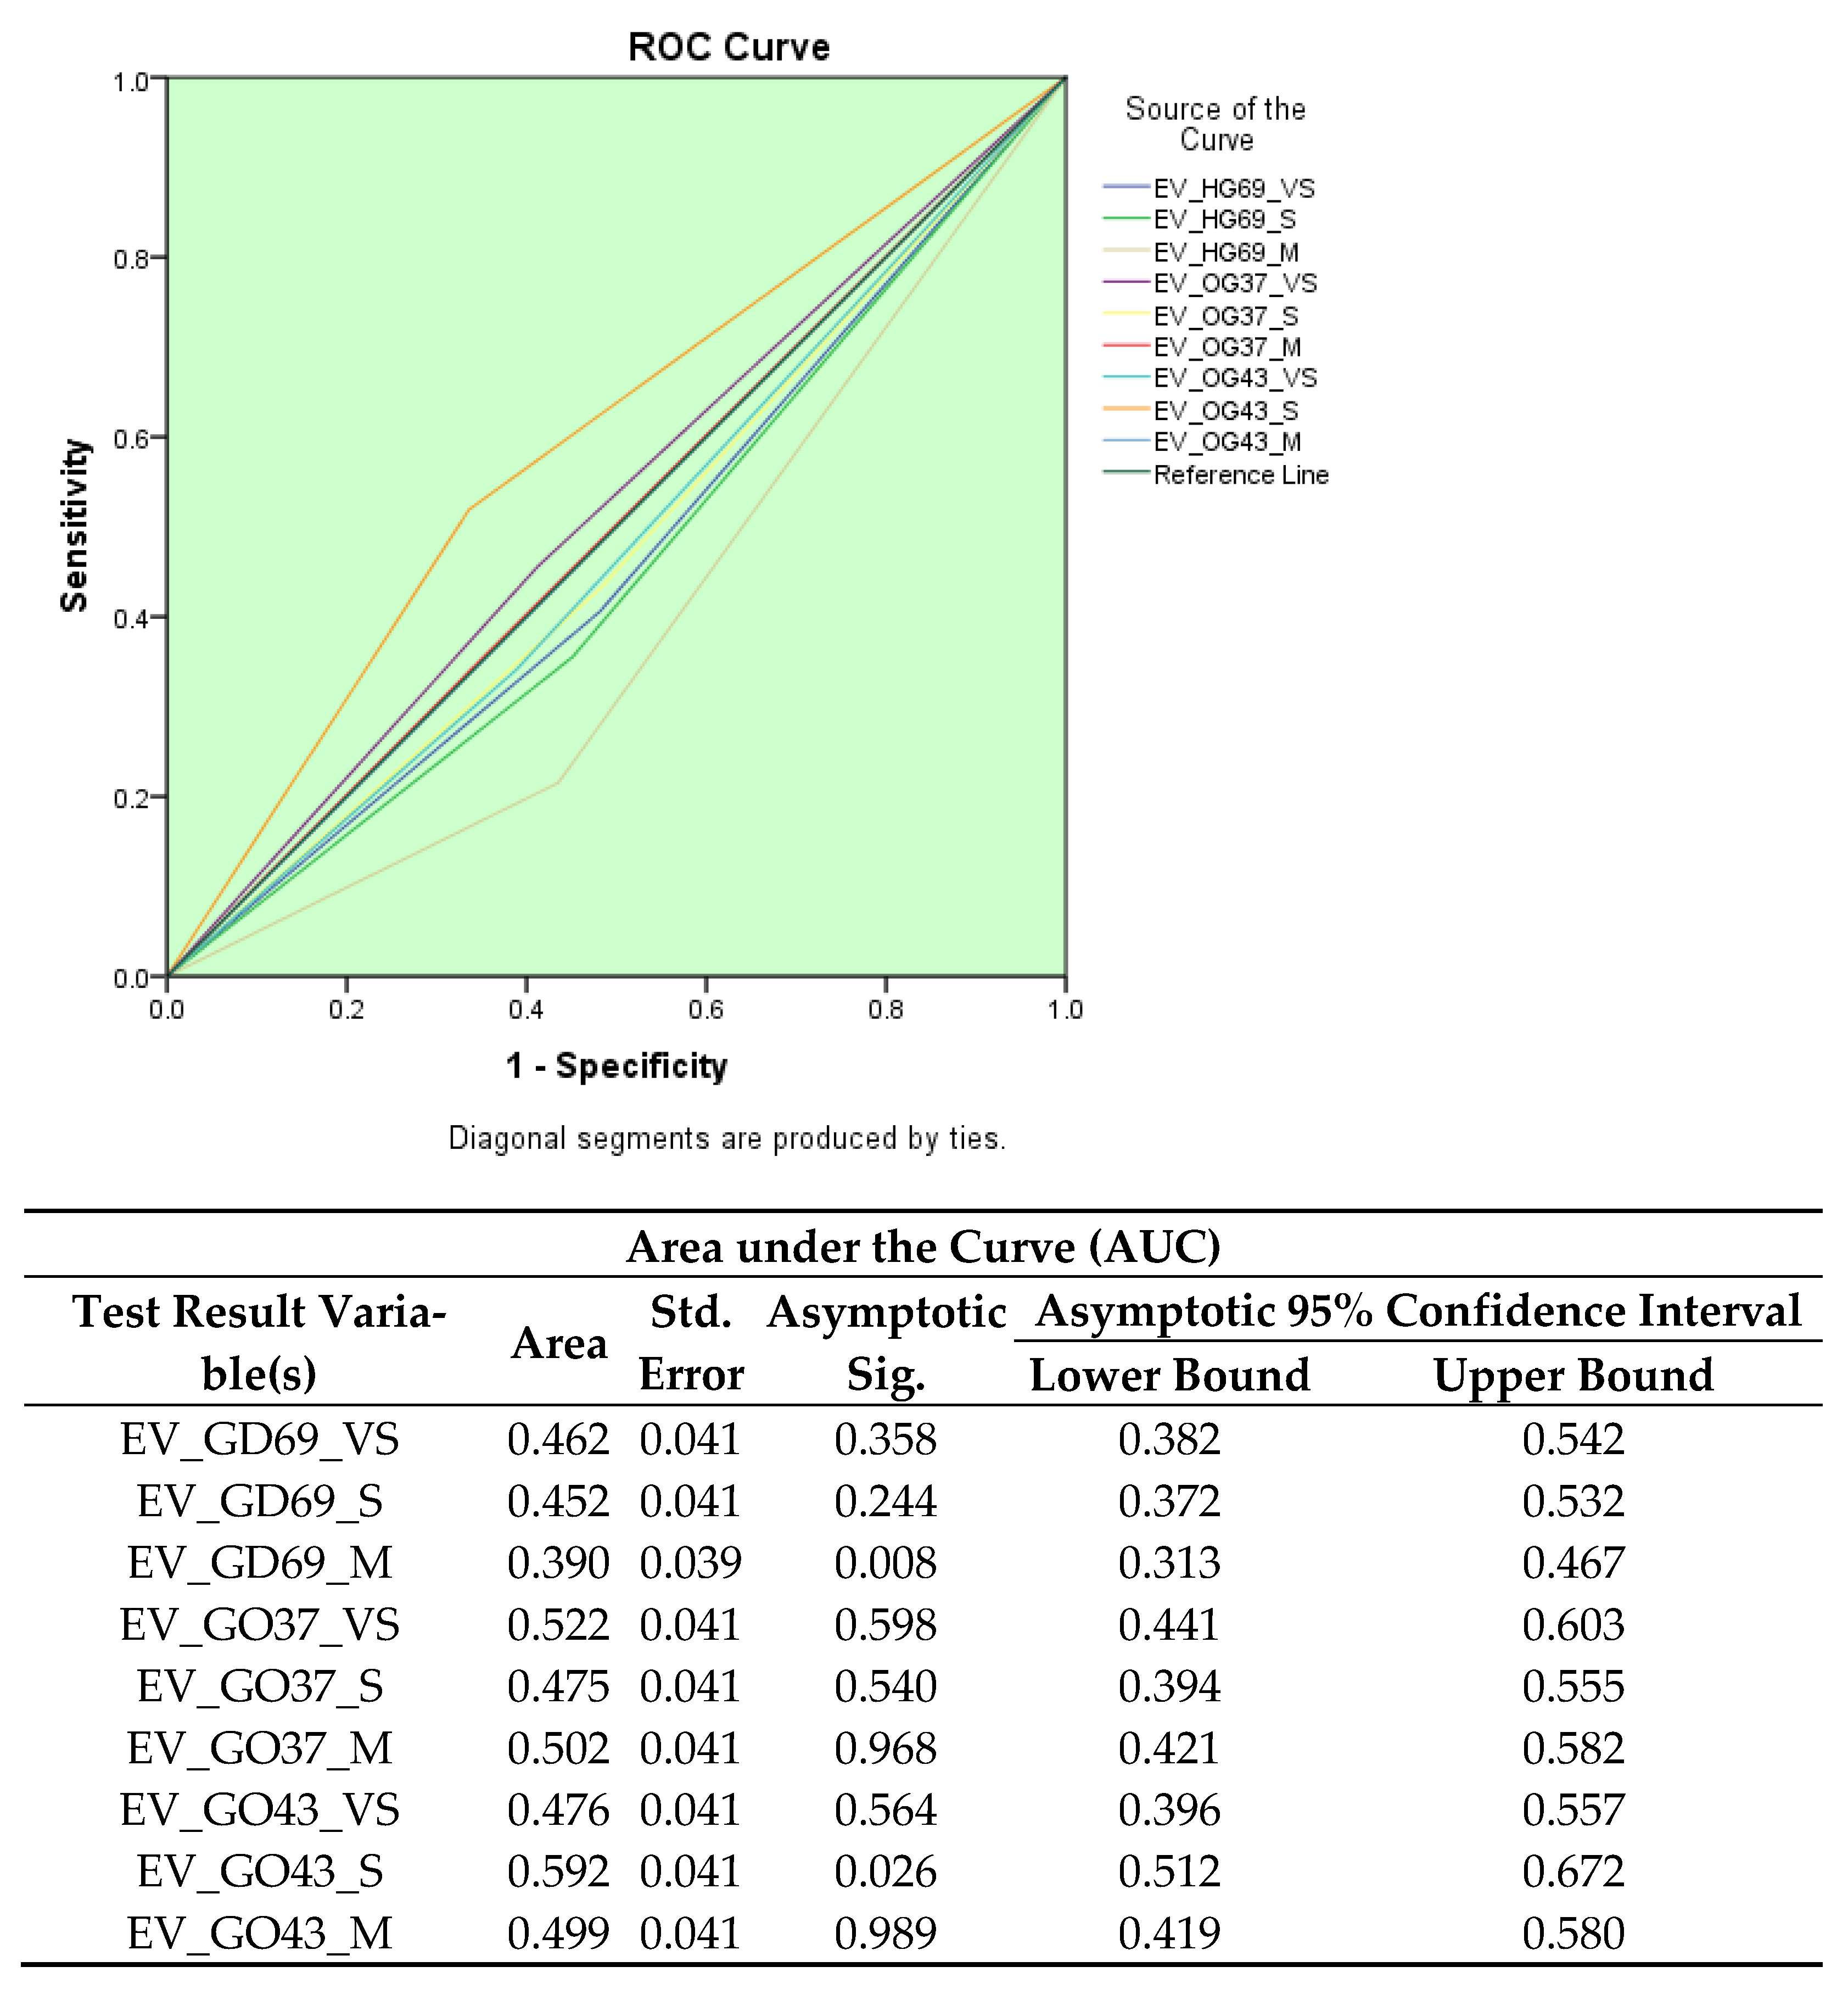
Figure 3 shows the centralized dynamics of nine ROC curves calculated for the evolution of each category of fines issued: EV_GD69, EV_GO37, and EV_GO43, for each level of severity: VS, S, and M, in relation to the evolution of exports of goods and products.
The graphical representation of the ROC curves showed significant connections between the evolution of exports only in relation to the evolution of the severe fines applied under GO43; in all other cases, the null hypothesis (H0) was rejected. In other words, the analysis of current data showed a statistically significant connection between the value evolution of exports only in relation to the results of the sanctions for serious noncompliance with road regulations by exceeding the weight and/or maximum dimensions allowed by law. In all other cases, the sanctions failed to show that they influenced the value of exports.
The results were not statistically significant for any other connections between the evolution of indicators of the nonconformities in the transport sector and the evolution of the value of exports over the analyzed period. The area under the ROC curve (AUC) was calculated based on the “two-by-two” principle for each connection of the indicators analyzed in correlation with the evolution of exports. p > 0.5 and AUC < 0.5 curve did not support a statistically significant relevance of the calculated results.
Similarly, the evolution of the number of fines applied for nonconformities found by the transport authorities was analyzed in relation to the evolution of the value of imports. As shown in Table 6, in 63 cases of decreases in the number of fines, increases in the evolution of imports were observed.
Figure 4 shows the centralized dynamics of nine ROC curves calculated for the evolution of each category of civil fines (EV_GD69, EV_GO37, EV_GO43) for each level of severity (VS, S, M), in relation to the evolution of the imports of goods and products.
The graphical representation of the ROC curves did not indicate significant connections between the evolution of imports and the evolution of the number of fines in the transport sector over the period analyzed. The reduced values calculated for AUC, together with p > 0.05, led to the conclusion that the H0 hypothesis was rejected.

4.4. Reflections on the Results and Limitations of the Study

The importance of sanctions and their effectiveness has long been a hot research topic. The debate on whether a sanctions regime can be smart or efficiently enforced has found several operational challenges and political intricacies [50]. The critical review of the specialized literature focused on the issue of sanctions identified various directions of analysis [14], situations of identification of positive results determined by the punitive approach [51], or, in contrast, multiple situations of limitations or inconsistencies between the sanctionable actions and the intended purpose of compliance [14]. Studies have shown that the implications of sanctions in the field of transport can also have various repercussions, either on aggressive driving attitude, stress or the work environment [51], or traffic conditions or safety [52,53].
Noncompliance in the field of transport is a complex phenomenon, with social, safety, and regulatory repercussions, and also with a pronounced economic impact. The evolution of businesses is strongly influenced by the volumes transported, the safety, and the fluidity of the transport. The financial indicators of any dynamic economic activity are directly related to the appropriateness and compliance of the transport conditions. From a managerial perspective, the punitive approach in the field of transport is generating intense interest. Drezner argued that the implementation of smart sanctions may prove to be a useful focal point for key stakeholders, while it may not yield policy improvement in a targeted country [54]. In another line of research, the analysis of managerial interest in the dynamics of sanctioning polarized nonconformity in the sphere of interactions between export control and economic sanctions correlated with policy and regulatory inferences [55].
Research on sanctions and their effects, immediate or delayed, was reviewed with different approaches, but we were unable to identify research studies with a similar objective that contained comparable quantitative data from another state. One of the limitations of this study was the difficulty or impossibility of accessing comparable official data regarding the sanctions applied by authorities in the field of transport that would allow comparative analyses to be carried out in extended geographical regions or between countries, or in a dynamic timeframe.
Beyond this, the limitations of studies of coercive measures in the field of transport are multiple. The idea that the evolution of sanctions is not an independent tool of the public authority is widely accepted, but our study argues for the idea that the information disseminated by the authorities on transport nonconformity that has been found should not be fragmented but instead analyzed systemically and easily correlated with other close macroeconomic indicators. The evolution of sanctions in the field of transport should be corrected, together with the results of appeals on the measures imposed by the authorities, and resolved in favor of the offenders, as practice shows that often such corrections can be significant. At the same time, the analysis of the dynamics of sanctions applied in the field of transport should be analyzed in close connection with the evolution of investments in the field of transport, with the dynamics of transport flows, and with reflection on the evolution of the volumes of exported and imported goods. Although we tried several options for analysis in this direction, the publicly available data did not allow for the creation of comparable and relevant databases to that end.

5. Conclusions

This study proposes a set of econometric analyses anchored in the logic of Brunswik’s lens model on a significant number of nonconformities sanctioned by the authorities with control attributions in Romania’s transport sector. The validity of several predicted judgements was illustrated, tested, and analyzed, starting from a factual context, with the reference being set on nonconformities and their territorial situation. The general objective was to determine whether the control measures ordered by public authorities, which resulted in sanctions, contributed to the optimization of transport circuits and the improvement of macroeconomic financial indicators, determined by the efficiency of transport networks.
The territorial graphs resulting from the investigation indicated that border areas, port areas, and road junctions present a high risk of nonconformities, and the number of sanctions applied by the authorities are concentrated in such areas. The synthesis of the conclusions was crystalized in maps with chromatic hues for the agglomerations of the sanctions applied over the analyzed period. The multivariate analysis carried out by imagistic or statistical-econometric methods aimed at solving the dilemma regarding the extent to which the sanctions applied on the controls performed by the Romanian authorities in the transport sector influenced other subsequent decisions, such as taking preventive measures to diminish future nonconforming behavior, enhancing the investment in infrastructure to improve transport networks, and the improving the dynamics of the circuit of imported or exported goods. Thus, the results of the research around the H1 hypothesis were that nonconformities and sanctions in the transport sector are not significant risk indicators that influence the evolution of imports and exports. Similarly, the results of research around the H2 hypothesis were that there is no significant connection between the decrease in the number of fines issued for transportation nonconformities and the increase in the value of exports and imports of goods and products.
Although the results obtained did not lead to the achievement of relevant statistical values, they point to very important conclusions. This study highlights a broken connection that strongly needs to be repaired: the strategic connection between the punitive measures ordered by the state (its sanctions) needs to be connected to preventive risk-mitigation plans oriented to the future increase of voluntary compliance in the transport sector. Furthermore, the analysis of sanctions should be integrated in the strategic governance transport plan. The amounts of fines should not be analyzed separately from the rest of the decision tree, as they impact on the investments in road infrastructure, the quality and productivity, and streamlining the distribution of resources.
The challenges of economic imbalances caused by the pandemic and war are driving an increase in empirical research studies. A significant future research direction in such a context is represented by the nonconformities in the transport sector, the resource circuit being strongly interconnected with all branches of economic and social life. This study has brought a quantitative dimension to a context that predates the onset of the effects of crises; nevertheless, the research in this direction should be extended. It is necessary to develop similar future analyses of wider territorial areas, develop comparisons with the situations in other countries, and promote new measures of sustainable economic development that take the errors into account and turn them into ‘lessons learned’ for the future.

Author Contributions

Conceptualization, K.-A.A. and I.F.M.; Data curation, M.-I.S. and A.C.; Formal analysis, K.-A.A. and I.F.M.; Funding acquisition, M.-I.S. and A.C.; Investigation, K.-A.A. and I.F.M.; Methodology, K.-A.A. and I.F.M.; Project administration, K.-A.A.; Resources, K.-A.A. and I.F.M.; Software, K.-A.A. and I.F.M.; Supervision, K.-A.A. and I.F.M.; Validation, K.-A.A., I.F.M., M.-I.S. and A.C.; Visualization, M.-I.S.; Writing – original draft, I.F.M.; Writing – review & editing, K.-A.A. and I.F.M. All authors have read and agreed to the published version of the manuscript.

Funding

This research received no external funding.

Institutional Review Board Statement

Not applicable.

Informed Consent Statement

Not applicable.

Data Availability Statement

Not applicable.

Conflicts of Interest

The authors declare no conflict of interest.

Appendix A

Comparative chromatic maps of the sanctions issued for nonconformities in transport
Figure A1. Comparative chromatic maps of the sanctions issued for nonconformities according to HG69/2012. Source: Own research.
Sustainability 14 10040 g0a1
Figure A2. Comparative chromatic maps of the sanctions issued for nonconformities according to OG37/2007. Source: Own research.
Sustainability 14 10040 g0a2
Figure A3. Comparative chromatic maps of the sanctions issued for nonconformities according to OG43/1997. Source: Own research.
Sustainability 14 10040 g0a3

Appendix B

Presentation of the estimated parameters in ANOVA analysis.
Table A1. Estimated parameters with ANOVA for the year 2016. Source: Own research.
ANOVA 2016
ClusterErrorFSig.
Mean SquaredfMean Squaredf
HG69No_VS_2016773.7823200.691383.8560.017
HG69No_S_20165548.60331294.296384.2870.011
HG69No_M_201675,150.95635793.4583812.972<0.001
OG37No_VS_201674,468.70232714.9033827.430<0.001
OG37No_S_2016173,601.17935334.8543832.541<0.001
OG37No_M_2016206,965.62333317.9903862.377<0.001
OG43No_VS_2016226.6833115.305381.9660.135
OG43No_S_20161264.2583251.363385.0300.005
OG43No_M_201610.337310.507380.9840.411
Table A2. Estimated parameters with ANOVA for the year 2017. Source: Own research.
ANOVA 2017
ClusterErrorFSig.
Mean SquaredfMean Squaredf
HG69No_VS_20171708.5563168.3793910.147<0.001
HG69No_S_201718927.88731229.6573915.393<0.001
HG69No_M_2017134,163.18336356.8753921.105<0.001
OG37No_VS_2017106,311.90232705.8443939.290<0.001
OG37No_S_2017305,444.11736354.8413948.065<0.001
OG37No_M_2017196,440.26337418.7453926.479<0.001
OG43No_VS_20171150.4693305.719393.7630.018
OG43No_S_20171425.0933752.066391.8950.146
OG43No_M_20179.026355.985390.1610.922
Table A3. Estimated parameters with ANOVA for the year 2018. Source: Own research.
ANOVA 2018
ClusterErrorFSig.
Mean SquaredfMean Squaredf
HG69No_VS_20182376.7983204.9653911.596<0.001
HG69No_S_201824,572.31432648.650399.277<0.001
HG69No_M_2018149,111.447310,081.3413914.791<0.001
OG37No_VS_2018123,686.09933775.4923932.760<0.001
OG37No_S_2018431,048.22838471.1233950.884<0.001
OG37No_M_2018166,100.75438551.8873919.423<0.001
OG43No_VS_20184371.6533354.5063912.332<0.001
OG43No_S_201811,148.6203327.7263934.018<0.001
OG43No_M_2018102.6623109.089390.9410.430
Table A4. Estimated parameters with ANOVA for the year 2019. Source: Own research.
ANOVA 2019
ClusterErrorFSig.
Mean SquaredfMean Squaredf
HG69No_VS_20191785.4613204.354398.737<0.001
HG69No_S_201914,077.76832094.074396.723<0.001
HG69No_M_201913,030.53333443.488393.7840.018
OG37No_VS_2019131,900.61432932.9463944.972<0.001
OG37No_S_2019409,542.92633495.79039117.153<0.001
OG37No_M_2019111,818.30436014.4023918.592<0.001
OG43No_VS_20195549.5493440.7683912.591<0.001
OG43No_S_2019813.1803101.295398.028<0.001
OG43No_M_201911.132349.899390.2230.880
Table A5. Estimated parameters with ANOVA for the year 2020. Source: Own research.
ANOVA 2020
ClusterErrorFSig.
Mean SquaredfMean Squaredf
HG69No_VS_2020555.7813130.480394.2600.011
HG69No_S_202012,638.77031519.241398.319<0.001
HG69No_M_20209516.87332229.989394.2680.011
OG37No_VS_202079,112.79332046.9263938.650<0.001
OG37No_S_2020312,378.65336116.3903951.072<0.001
OG37No_M_2020105,183.22633284.8233932.021<0.001
OG43No_VS_20207401.7343768.255399.634<0.001
OG43No_S_202025,604.9673898.8643928.486<0.001
OG43No_M_2020111.173325.721394.3220.010
Table A6. Estimated parameters with ANOVA for the year 2021. Source: Own research.
ANOVA 2021
ClusterErrorFSig.
Mean SquaredfMean Squaredf
HG69No_VS_20212905.495394.5213830.739<0.001
HG69No_S_202114,405.8203705.9523820.406<0.001
HG69No_M_2021338.2843274.095381.2340.311
OG37No_VS_202165,521.31931078.8913860.730<0.001
OG37No_S_2021120,335.74331935.2283862.182<0.001
OG37No_M_20214945.3503908.380385.4440.003
OG43No_VS_2021742.499395.327387.789<0.001
OG43No_S_2021633.3253120.921385.2380.004
OG43No_M_20214.01033.681381.0890.365

References

  1. Baker, S.R.; Farrokhnia, R.A.; Meyer, S.; Pagel, M.; Yannelis, C. How does household spending respond to an epidemic? Consumption during the 2020 COVID-19 pandemic. Rev. Asset Pricing Stud. 2020, 10, 834–862. [Google Scholar] [CrossRef]
  2. Barro, R.J.; Ursúa, J.F.; Weng, J. The Coronavirus and the Great Influenza Pandemic: Lessons from the ‘Spanish Flu’ for the Coronavirus’s Potential Effects of Coronavirus on Mortality and Economic Activity. NBER Working Papers; National Bureau of Economic Research. 2020. Available online: http://www.nber.org/papers/w26866 (accessed on 14 April 2022).
  3. Kammer, A.; Azour, J.; Selassie, A.A.; Goldfajn, I.; Rhee, C. How War in Ukraine Is Reverberating Across World’s Regions. IMF Blog, 15 March 2022. Available online: https://blogs.imf.org/2022/03/15/how-war-in-ukraine-is-reverberating-across-worlds-regions/ (accessed on 10 May 2022).
  4. Altig, D.; Baker, S.; Barrero, J.M.; Bloom, N.; Bunn, P.; Chen, S.; Davis, S.J.; Leather, J.; Meyer, B.; Mihaylov, E.; et al. Economic uncertainty before and during the COVID-19 pandemic. J. Public Econ. 2020, 191, 104274. [Google Scholar] [CrossRef] [PubMed]
  5. Caggiano, G.; Castelnuovo, E.; Kima, R. The global effects of Covid-19-induced uncertainty. Econ. Lett. 2020, 194, 109392. [Google Scholar] [CrossRef] [PubMed]
  6. Jones, C.; Philippon, T.; Venkateswaran, V. Optimal mitigation policies in a pandemic: Social distancing and working from home. Rev. Financ. Stud. 2021, 34, 5188–5223. [Google Scholar] [CrossRef]
  7. Burdekin, R.C.K.; Hughson, E.; Gu, J. A first look at Brexit and global equity markets. Appl. Econ. Lett. 2018, 25, 136–140. [Google Scholar] [CrossRef]
  8. Salvatore, D. Growth and trade in the United States and the world economy: Overview. J. Policy Model. 2020, 42, 750–759. [Google Scholar] [CrossRef]
  9. Jordà, Ò.; Singh, S.R.; Taylor, A.M. Longer-run economic consequences of pandemics. Rev. Econ. Stat. 2022, 104, 166–175. [Google Scholar] [CrossRef]
  10. Broomell, S.B. Global-local incompatibility: The misperception of reliability in judgment regarding global variables. Cogn. Sci. 2020, 44, e12831. [Google Scholar] [CrossRef]
  11. Todd, P.M.; Gigerenzer, G. What is ecological rationality? In Ecological Rationality: Intelligence in the World; Todd, P.M., Gigerenzer, G., ABC Research Group, Eds.; Oxford University Press: Oxford, UK, 2012; pp. 3–30. [Google Scholar] [CrossRef]
  12. Ghasseminejad, S.; Jahan-Parvar, M.R. The impact of financial sanctions: The case of Iran. J. Policy Model. 2021, 43, 601–621. [Google Scholar] [CrossRef]
  13. Kaempfer, W.H.; Lowenberg, A.D. The political economy of economic sanctions. Handb. Def. Econ. 2007, 2, 867–911. [Google Scholar] [CrossRef]
  14. Peksen, D. When do imposed economic sanctions work? A critical review of the sanctions effectiveness literature. Def. Peace Econ. 2019, 30, 635–647. [Google Scholar] [CrossRef]
  15. Smeets, M. Can Economic Sanctions Be Effective? Staff Working Paper ERSD-2018-03, Economic Research and Statistics Division; World Trade Organization: Geneva, Switzerland, 2018; Available online: https://www.wto.org/english/res_e/reser_e/ersd201803_e.pdf (accessed on 10 May 2022).
  16. Gudmundsson, H.; Höjer, M. Sustainable development principles and their implications for transport. Ecol. Econ. 1996, 19, 269–282. [Google Scholar] [CrossRef]
  17. Kadłubek, M. Examples of Sustainable Development in the Area of Transport. Procedia Econ. Financ. 2015, 27, 494–500. [Google Scholar] [CrossRef]
  18. Patlins, A. Improvement of Sustainability Definition Facilitating Sustainable Development of Public Transport System. Procedia Eng. 2017, 192, 659–664. [Google Scholar] [CrossRef]
  19. European Economic and Social Committee. Role of Transport in Realising the Sustainable Development Goals, and Consequent Implications for EU Policy-Making (Own-Initiative Opinion). 2018. Available online: https://www.eesc.europa.eu/en/our-work/opinions-information-reports/opinions/role-transport-realising-sustainable-development-goals-and-consequent-implications-eu-policy-making-own-initiative (accessed on 10 May 2022).
  20. Kuo, K.-C.; Yu, H.-Y.; Lu, W.-M.; Le, T.-T. Sustainability and Corporate Performance: Moderating Role of Environmental, Social, and Governance Investments in the Transportation Sector. Sustainability 2022, 14, 4095. [Google Scholar] [CrossRef]
  21. Meersman, H.; Nazemzadeh, M. The contribution of transport infrastructure to economic activity: The case of Belgium. Case Stud. Transp. Policy 2017, 5, 316–324. [Google Scholar] [CrossRef]
  22. Kumar, A.; Anbanandam, R. Development of social sustainability index for freight transportation system. J. Clean. Prod. 2019, 210, 77–92. [Google Scholar] [CrossRef]
  23. Stefaniec, A.; Hosseini, K.; Assani, S.; Hosseini, S.M.; Li, Y. Social sustainability of regional transportation: An assessment framework with application to EU road transport. Socio-Econ. Plan. Sci. 2021, 78, 101088. [Google Scholar] [CrossRef]
  24. Lindkvist, H.; Melander, L. How sustainable are urban transport services? A comparison of MaaS and UCC. Res. Transp. Bus. Manag. 2022, 43, 100829. [Google Scholar] [CrossRef]
  25. Țăran, A.M.; Mustea, L.; Vătavu, S.; Lobonț, O.R.; Luca, M.M. Challenges and Drawbacks of the EU Medical System Generated by the COVID-19 Pandemic in the Field of Health Systems’ Digitalization. Int. J. Environ. Res. Public Health 2022, 19, 4950. [Google Scholar] [CrossRef]
  26. Chen, X.; Miao, Z.; Wang, K.; Sun, C. Assessing eco-performance of transport sector: Approach framework, static efficiency and dynamic evolution. Transp. Res. Part D Transp. Environ. 2020, 85, 102414. [Google Scholar] [CrossRef]
  27. Raza, S.A.; Shah, N.; Sharif, A. Time frequency relationship between energy consumption, economic growth and environmental degradation in the United States: Evidence from transportation sector. Energy 2019, 173, 706–720. [Google Scholar] [CrossRef]
  28. Ševčenko-Kozlovska, G.; Čižiūnienė, K. The Impact of Economic Sustainability in the Transport Sector on GDP of Neighbouring Countries: Following the Example of the Baltic States. Sustainability 2022, 14, 3326. [Google Scholar] [CrossRef]
  29. Kramarz, M.; Dohn, K.; Przybylska, E.; Knop, L. Scenarios for the Development of Multimodal Transport in the TRITIA Cross-Border Area. Sustainability 2020, 12, 7021. [Google Scholar] [CrossRef]
  30. Dvorak, Z.; Rehak, D.; David, A.; Cekerevac, Z. Qualitative Approach to Environmental Risk Assessment in Transport. Int. J. Environ. Res. Public Health 2020, 17, 5494. [Google Scholar] [CrossRef]
  31. Felício, T.; Samagaio, A.; Rodrigues, R. Adoption of management control systems and performance in public sector organizations. J. Bus. Res. 2021, 124, 593–602. [Google Scholar] [CrossRef]
  32. Hirschhorn, F.; van de Velde, D.; Veeneman, W.; ten Heuvelhof, E. The governance of attractive public transport: Informal institutions, institutional entrepreneurs, and problem-solving know-how in Oslo and Amsterdam. Res. Transp. Econ. 2020, 83, 100829. [Google Scholar] [CrossRef]
  33. Grinerud, K.; Aarseth, W.K.; Robertsen, R. Leadership strategies, management decisions and safety culture in road transport organizations. Res. Transp. Bus. Manag. 2021, 41, 100670. [Google Scholar] [CrossRef]
  34. Brunswik, E. The Conceptual Framework of Psychology, International Encyclopedia of Unified Science; University of Chicago Press: Chicago, IL, USA, 1952. [Google Scholar]
  35. Petrișor, A.I. A diversity-based approach to the spatial development of socioecological systems. Urban. Archit. Constr. 2017, 8, 143–162. [Google Scholar]
  36. Wang, K.H.; Liu, L.; Adebayo, T.S.; Lobonț, O.R.; Moldovan, N.C. Fiscal decentralization, political stability and resources curse hypothesis: A case of fiscal decentralized economies. Resour. Policy 2021, 72, 102071. [Google Scholar] [CrossRef]
  37. Coibion, O.; Gorodnichenko, Y.; Weber, M. Labor Markets during the COVID-19 Crisis: A Preliminary View; NBER Working Papers 27017; National Bureau of Economic Research, Inc. 2020, pp. 1–13. Available online: http://www.nber.org/papers/w27017 (accessed on 10 February 2022).
  38. Bartik, A.W.; Bertrand, M.; Cullen, Z.; Glaeser, E.L.; Luca, M.; Stanton, C. The impact of COVID-19 on small business outcomes and expectations. Proc. Natl. Acad. Sci. USA 2020, 117, 17656–17666. [Google Scholar] [CrossRef] [PubMed]
  39. Li, D.; Xu, K.; Li, Y.; Jiang, Y.; Tang, M.; Lu, Y.; Cheng, C.; Wang, C.; Mo, G. Financial Distress Prediction for Digital Economy Firms: Based on PCA-Logistic. J. Risk Anal. Crisis Response 2022, 12, 1. [Google Scholar] [CrossRef]
  40. Dima, B.; Lobonţ, O.-R.; Moldovan, N.-C. Does the quality of public policies and institutions matter for entrepreneurial activity? Evidences from the European Union’s member states. Panoeconomicus 2016, 63, 425–439. [Google Scholar] [CrossRef]
  41. Kozyreva, A.; Hertwig, R. The interpretation of uncertainty in ecological rationality. Synthese 2021, 198, 1517–1547. [Google Scholar] [CrossRef]
  42. Zellweger, T.M.; Zenger, T.R. Entrepreneurs as scientists: A pragmatist approach to producing value out of uncertainty. Acad. Manag. Rev. 2021, 1–54. [Google Scholar] [CrossRef]
  43. Ferrati, F.; Muffatto, M. Reviewing equity investors’ funding criteria: A comprehensive classification and research agenda. Ventur. Cap. 2021, 23, 157–178. [Google Scholar] [CrossRef]
  44. Hammond, K.R. The Integration of Research in Judgement and Decision Theory; Report no.226; University of Colorado, Institute of Behavioral Science. 1980. Available online: https://apps.dtic.mil/sti/pdfs/ADA088471.pdf (accessed on 20 March 2022).
  45. Harrison, T.M.; Luna-Reyes, L.F. Cultivating trustworthy artificial intelligence in digital government. Soc. Sci. Comput. Rev. 2022, 40, 494–511. [Google Scholar] [CrossRef]
  46. Pintilescu, C. Analiza Statistica Multivariata; Editua Universitatii Alexandru Ioan Cuza: Iași, Romania, 2007; pp. 193–259. ISBN 978-973-703-229-4. [Google Scholar]
  47. Munteanu, F.I. Impactul Guvernantei Corporative Asupra Nivelului de Raportare Financiara; Pro Universitaria: Bucuresti, Romania, 2021; pp. 48–176. ISBN 978-606-26-1458-4. [Google Scholar]
  48. Krishnan, V. Constructing an Area-Based Socioeconomic Index: A Principal Components Analysis Approach. Edmonton, Alberta: Early Child Development Mapping Project. 2010. Available online: https://www.ualberta.ca/community-university-partnership/media-library/community-university-partnership/research/ecmap-reports/seicupwebsite10april13-1.pdf (accessed on 6 June 2022).
  49. Candes, E.J.; Li, X.; Ma, Y.; Wright, J. Robust Principal Component Analysis? J. Assoc. Comput. Math 2011, 58, 11. [Google Scholar] [CrossRef]
  50. Tostensen, A.; Bull, B. Are Smart Sanctions Feasible? World Politics 2002, 54, 373–403. [Google Scholar] [CrossRef]
  51. Montoro, L.; Useche, S.; Alonso, F.; Cendales, B. Work Environment, Stress, and Driving Anger: A Structural Equation Model to Predict Traffic Sanctions of Public Transport Drivers. Int. J. Environ. Res. Public Health 2018, 15, 497. [Google Scholar] [CrossRef]
  52. Lee, J.; Park, B.J.; Lee, C. Deterrent effects of demerit points and license sanctions on drivers’ traffic law violations using a proportional hazard model. Accid. Anal. Prev. 2018, 113, 279–286. [Google Scholar] [CrossRef] [PubMed]
  53. Liu, Z.; Li, R.; Wang, X.C.; Shang, P. Noncompliance behavior against vehicle restriction policy: A case study of Langfang, China. Transp. Res. Part A Policy Pract. 2020, 132, 1020–1033. [Google Scholar] [CrossRef]
  54. Drezner, D.W. Sanctions Sometimes Smart: Targeted Sanctions in Theory and Practice. Int. Stud. Rev. 2011, 13, 96–108. [Google Scholar] [CrossRef]
  55. McGlone, W.M.; Burton, M.L. Economic Sanctions and Export Controls. Int. Trade 2000, 34, 383. Available online: https://scholar.smu.edu/til/vol34/iss2/5 (accessed on 4 April 2022).
Figure 1. Dynamic representation of the decision-making process using the lens model. Source: Authors’ representation inspired by Brunswik’s Lens Model.
Sustainability 14 10040 g001
Figure 2. Cluster membership. Source: Own research.
Sustainability 14 10040 g002
Figure 3. Representation of the ROC curve with the AUC analysis in relation to the evolution of exports. Source: Own research.
Sustainability 14 10040 g003
Figure 4. Representation of the ROC curve together with the AUC analysis in relation to the evolution of imports. Source: Own research.
Sustainability 14 10040 g004
Table 1. Presentation of indicators used in this study.
AbbreviationIndicatorShare of Total Nonconformities per RegulationShare of Total Nonconformities Found
Nonconformities according to GD 69/2012
GD69_VSNumber of very serious nonconformities10.99%2.96%
GD69_SNumber of serious nonconformities33.35%8.98%
GD69_MNumber of minor nonconformities55.66%14.99%
According to Government Decision no. 69/2012, nonconformities represent breaches of the provisions regarding the possession of a transport license or the obligatory documents required by law for the provision of transport services, the performance of other transport services according to the traffic schedule, the hiring of drivers with errors in the preparation of the documentation provided by law, noncompliance with the maximum authorized weight for vehicles, etc.
Nonconformities according to GO 37/2007
GO37_VSNumber of very serious nonconformities 25.27%17.44%
GO37_SNumber of serious nonconformities 44.24%30.54%
GO37_MNumber of minor nonconformities 30.49%21.04%
According to Government Ordinance no. 37/2007, nonconformities are breaches of the provisions including exceeding the driving time, forgoing the compulsory rest period during driving hours, being remunerated according to risk criteria for safe driving (such as speed of delivery, distance traveled or quantity transported), errors in drawing up tachograph charts, etc.
Nonconformities according to GO43/1997
GO43_VSNumber of very serious nonconformities 32.54%1.32%
GO43_SNumber of serious nonconformities 59.48%2.41%
GO43_MNumber of minor nonconformities 7.98%0.32%
According to Government Ordinance no. 43/1997, nonconformities represent breaches of the regulations regarding the road regime, or exceeding the maximum weight and/or dimensions allowed by the legislation.
CIFValue of importsValue of all goods entering Romania from other states
FOBValue of exportsValue of all goods exiting Romania to go to other states
Source: Own research.
Table 2. ANOVA significance levels.
Regulation of SanctionsSig.
201620172018201920202021
GD69No_VS0.017<0.001<0.001<0.0010.011<0.001
GD69No_S0.011<0.001<0.001<0.001<0.001<0.001
GD69No_M<0.001<0.001<0.0010.0180.0110.311
GO37No_VS<0.001<0.001<0.001<0.001<0.001<0.001
GO37No_S<0.001<0.001<0.001<0.001<0.001<0.001
GO37No_M<0.001<0.001<0.001<0.001<0.0010.003
GO43No_VS0.1350.018<0.001<0.001<0.001<0.001
GO43No_S_0.0050.146<0.001<0.001<0.0010.004
GO43No_M0.4110.9220.4300.8800.0100.365
Source: Own research.
Table 3. KMO and Bartlett’s test results.
KMO and Bartlett’s Test
Kaiser–Meyer–Olkin Measure of Sampling Adequacy0.726
Bartlett’s Test of SphericityApprox. Chi-Squared992.909
Df55
Sig.0.000
Source: Own research.
Table 4. Correlation matrix.
GD69_VSGD69_SGD69_MGO37_VSGO37_SGO37_MGO43_VSGO43_SGO43_MFOBCIF
GD69_VS1.000
GD69_S0.3761.000
GD69_M−0.0020.0781.000
GO37_VS0.6190.4940.0591.000
GO37_S0.4810.4980.2220.8491.000
GO37_M0.4100.4550.3050.8010.8911.000
GO43_VS0.0220.0630.0140.0620.0380.0441.000
GO43_S0.0130.026−0.0040.0290.0160.0060.2951.000
GO43_M−0.049−0.0420.244−0.0490.0150.041−0.037−0.0191.000
FOB−0.008−0.041−0.0080.071−0.007−0.040−0.135−0.209−0.0911.000
CIF0.007−0.029−0.007−0.001−0.033−0.065−0.174−0.191−0.0090.6671.000
Source: Own research.
Table 5. Summary of the calculation of the rationale for the analysis of the ROC curve, connecting the dynamics of nonconformities with the evolution of exports (EV_FOB).
EV_FOBValid N
Positive79
Negative131
Source: Own research.
Table 6. Summary of the calculation of the rationale for the analysis of the ROC curve, connecting the dynamics of nonconformities with the evolution of imports (EV_CIF).
EV_CIFValid N (Listwise)
Positive63
Negative147
Source: Own research.
Publisher’s Note: MDPI stays neutral with regard to jurisdictional claims in published maps and institutional affiliations.

