Abstract
Transportation systems require many challenges in providing seamless door-to-door mobility. The main initiatives are encouraging a shift from private to other transport modes by providing a fully integrated multimodal service in which the coordination and data sharing among different stakeholders are required. The idea of this paper is to analyze the mode choice, as well as the variables that affect the travelers’ airport access mode choice. For that purpose, we used multinomial logistics (MNL) regression to determine probability of mode choice given various multimodal chain alternatives. The inputs of the proposed model were based on the answers from the participants of the online survey which was disseminated in Europe. Through more than 2000 answers to the survey, we collected the data related to the factors that influence the airport access mode choice, travelers’ attitude, motives for traveling, as well as the socio-demographics of participants. Afterwards, we investigated the influence of the main factors that have an impact on the non-coordination in the multimodal travel chain. The obtained results highlight the impact of the factors “reliability” and “waiting time” in making mode choice.
1. Introduction
Transport systems are facing many challenges in providing efficient mobility solutions regarding both users’ and transport authorities’ perspectives. There are numerous local initiatives of policymakers in mitigating the issue (i.e., traffic congestions, noise, and pollutions) which is mainly caused by the widespread use of private cars (see [1]). The problem with congestions on roads, to and from the airports, is also part of the challenge, with more people using air transport each year. A multimodal passenger transport system that includes air transport is one of the concepts towards the sustainable practice which should result in more use of public transport (PT) systems, and further, in reduction of pollution and alleviation of road congestion [2].
The idea of this paper is to investigate the opportunities and the aspects to be managed for providing seamless door-to-door (D2D) multimodal trips that consist of several transport modes, with the air transport mode as the main leg in the multimodal chain. Specifically, the seamless D2D multimodal trip should provide the coordinated trip and service to the travelers, from origin to destination, by including several transport modes (bus, train/metro, car, taxi) for arriving to the airport, as well as for departing from the airport to the final destination. The introduction of such a multimodal service requires many aspects to be managed, e.g., integrating airport access into city planning, the shift from private to other transport modes, etc. Most airports have more than one ground option that provides access to/from the airport for people. Thus, when making mode choice decisions, passengers are affected by many factors, particularly journey time, cost, travel time reliability, etc. [3]. Travel time reliability proved to be an important attribute of the transport system for passengers because of the potential risk of the late arrival and missing the flight [4]. Moreover, differences in mode choice airport accessibility are partly explained by demographic differences, e.g., age, education, etc. [5,6].
Supporting this concept, we analyzed several aspects for creating multimodal trip service considering passenger behavior and mode choice when traveling to and from the airport, as well as the impact of the non-coordination in multimodal trip. For that purpose, we designed and disseminated, in different European countries, a survey related to the transport mode choice, travel habits vs. travel purpose, frequency, factors influencing mode choice of the trips, as well as socio-demographic characteristics. After collecting the answers from the survey (this survey was conducted online due to world pandemic of COVID-19, for the purpose of the SYN+AIR project (894116) from the H2020-SESAR-2019-2 call. Respondents were mostly from Greece, Italy, Spain and Serbia (where project partners originated from), as well as from the other countries in Europe), firstly, we analyzed travelers’ habits and the opportunities for creating integrated multimodal transport. For that purpose, we provided correlation analysis, in which we were able to determine the explanatory variables that affect the travelers’ airport access mode choice (e.g., travel cost, travel time, reliability, waiting time, etc.). Secondly, to determine the influence of the mode choice question, and to assess the behavior of travelers in choosing the multimodal travel alternative, we performed the multinomial logistics (MNL) regression based on three proposed scenarios [7].
Therefore, the main questions that arise are: (i) If “train”, “taxi (or ridesharing services like Uber of Lyft)”, “metro”, “combination of modes (bus or train)”, “car (someone drops me off/pick me up)”, “car (park at/near the airport)”, and “bus” modes are available, which one is the most commonly chosen to travel to/from the airport? (ii) What are the factors that affect transport airport access mode choice? Furthermore, we analyzed the influence of the factor “reliability” and “waiting time”, as well as the impact of non-coordination in the multimodal travel chain.
This research aims to conduct and update the results of previous studies on airport accessibility at the European level. It provides valuable information about the available transport services and their use at many airports in Europe. Moreover, the survey data reveal a different situation in some countries in terms of transport infrastructure, as well as different passenger’s perception of factors that influence mode choice (cost, travel time, waiting time, reliability, security, etc.). All the obtained data helped in exploring existing ground access behavior and factors that may encourage PT use and decrease use of private cars and taxi, as well as providing some insights on demographic characteristics of passengers ready to change their attitude towards PT.
The result of the study differs from the existing literature in providing comprehensive statistical analysis that covers transport systems in terms of mode characteristics. Furthermore, according to our knowledge, there is a lack of studies that are based on large surveys. In this paper, we provided the results based on the survey conducted in different countries with 2199 responses and 25 questions related to motives, preferences, and travel behaviors, as well as sociodemographic profile. In addition, we proposed a method to handle answers given on Likert scale to be used in statistical analysis.
The structure of the paper is organized as follows. In the Section 2, we provide the literature review related to the airport access mode choice. The Section 3 is dedicated to data and methodology, while the results are provided in the Section 4. In the Section 5, the impact of the non-coordination in multimodal trip is discussed, while the Section 6 is dedicated to the conclusion and further developments.
2. Literature Review
At most large airports in Europe, the landside access modes and systems are based on the road and railway transport modes, such as cars, taxis, buses, subway/metro, regional/national conventional, and HSR (high-speed rail). The influencing factors for airport access mode choice are availability, access time, access cost, transport service frequency, reliability, punctuality, convenience of the arrival time at the airport, existence of transfer, and convenience of handling luggage. The access time and price have been approximately linearly correlated with the airport access distance at almost all land-side access modes and their systems across many European and US airports [8]. Air travelers’ access mode choice models are based on individual characteristics (gender, age, car ownership, income, etc.) and alternative specific attributes. In order to understand airport accessibility, researchers take into account trip purpose (business or leisure air trip), so-lo/group journey, the size of passenger group, number of baggage items, etc.
A brief overview of selected papers on mode choice (published in last 15 years) is presented in Table 1. It points out the case study, model used, and main findings of the research.

Table 1.
Some selected papers on airport access mode choice.
Airport ground accessibility has been largely investigated in different ways as: access mode choice in the light of passengers’ preferences and behaviors [9,12], modal split to determine market share [17], integrated airport choice and access mode choice, integrated choice of airport, airline and access mode choice in an airline type choice context—low-cost carriers and full-service carriers [18], modal split for relocated airports, or an assessment of the introduction of a new mode [10,16].
However, this work differs from the existing literature in providing comprehensive statistical analysis based on the survey conducted in different European countries covering heterogeneities of their transport systems in terms of mode characteristics and service supply. Taking into consideration that the survey sample size is very large (2199 respondents), diversity of passengers’ behavior and attitudes towards airport access mode is captured. Moreover, this research investigates the impact of non-coordination of multimodal transport system by estimating explanatory variables that affect the mode choice behavior.
3. Data and Methodology
This section provides the methodology for determining travelers’ habits. According to the obtained survey results, we performed a correlation analysis to determine the main questions that influence the multimodal travel choice for the airport access, which are used in MNL regression.
The comparison among multimodal trip alternatives have been distinguished by three proposed cases: (i) Case A in which the mode choice “Train” is defined as a reference category; (ii) Case B in which the mode choice “Combination of modes” is defined as a reference category; and (iii) Case C in which we applied a resampling technique and used “Combination of modes” as a reference category.
3.1. Description of the Survey
The survey was designed considering three parts related to mobility profile, travel preferences, and sociodemographic of travelers. The main scope of the survey was to “quantify the tradeoffs that users consider when selecting travel alternatives and identify traveler characteristics that reflect their emotions, attitude, and travel behavior” [30]. The survey was disseminated online due to COVID-19 pandemic restrictions, translated in five languages (Italian, Greek, Serbian, Spanish, and English).
In order to obtain reliable results and to ensure the quality survey process, a careful specification of survey procedure was designed. After identification of the main scope of the survey, the target respondents were identified as air travelers mainly from four countries involved in research, but also from other European countries, with required sample size of minimum 1200 respondents. The questionnaire design passed through several phases in which a team of researchers from Greece, Italy, Spain, and Serbia, based on literature research as well as researchers’ previous experience, developed questions within multiple internal brainstorming sessions. That resulted in the questionnaire structure which enabled to obtain information related to: (i) the socio-demographics of travelers (i.e., gender, age, average income); (ii) the travelers’ habits, travel purpose, and trips’ frequency; and (iii) the factors that affect the choice of travel mode. After conducting a pilot survey, the questionnaire was refined and a final version with 25 questions (a few of which included several sub-questions) was obtained.
Finally, the data collection started on 31 March 2021 and lasted until 18 May 2021, with in total 2251 collected responses. For dissemination of the questionnaire, official social networks (e.g., LinkedIn), SYN+AIR’s website and some similar projects’ websites, portals concerning aviation, and different passengers’ associations were used. Data collection was constantly monitored in order to obtain a quality sample as a prerequisite for reliable survey results. Through this consistent monitoring process, some challenges with the online survey were successfully avoided. For example, having too many unemployed respondents or students in a sample is a common pitfall in online surveys, or difficulties reaching the older population. In this research, such challenges were prevented with well-chosen distribution channels and constant monitoring of the sample. After noticing that some groups of respondents appeared in a sample more than expected, distribution channels were redirected in order to fill this gap (for example, after receiving high number of responses from female respondents, the questionnaire was distributed through one aviation portal whose followers are mainly men and gender inequality in the sample was fixed).
The obtained dataset was analyzed and in the cleaning process, 52 responses were rejected which resulted in a total of 2199 answers, which were further examined (194 answers from Spain, 719 from Greece, 444 from Italy, 562 from Serbia, and 280 from other counties). The fact that the questionnaire was offered in five languages (English, Italian, Greek, Serbian, and Spanish) additionally contributed to reaching the targeted sample and getting desired feedback from different groups of air passengers (different by ages, gender, trip purpose, frequency of travel, etc.), as well as to reaching this valuable sample size.
3.2. Correlation Analysis
For selected variables, we applied Pearson’s correlation to determine meaningful correlations. The Pearson’s correlation coefficient is a measure of the covariance between two variables and , divided by the product of their standard deviations, as reported in Equation (1) [31]. Here, are element of the variables and , is the size of sample, and are the mean of variables and .
The Pearson correlation represents a linear association between two variables, which can take a value between −1 and 1, so that value −1 indicates a perfectly negative correlation, while 0 value indicates no correlation between two variables [31]. Since answers related to multiple-choice question were (usually) independent, we transformed them in a new binary variable, and we calculated the Pearson correlation among them with Phi coefficient. In this way, positive correlation Phi coefficient indicates a high number of common answers between two binary variables (both affirmative and negative answers). We considered only the correlation where the Pearson’s coefficients greater than 0.1 are defined as positive correlation, while the values lower than −0.1 are defined as negative correlation.
3.3. Multinomial Logistics Regression
In this section, we provide a short description of MNL regression analyses that we used to determine the users’ perspective for making multimodal choices in their travel, based on the outputs from survey. Based on correlation and descriptive analysis from the disseminated survey, we determined explanatory variables that affect the airport access mode choice. Consequently, the question related to mode choice (“If all of the following transport modes are available, which one would you choose to travel to/from the airport?”) was analyzed to identify and understand the main travel attributes that determine the users’ perspective for making multimodal travel choices.
MNL regression is conceptually similar as the binary logistics regression, but the main difference is that the method provides parameters related to the choice between more than two alternatives. In such a way, it examines the relationship between the dependent variable and a set of independent variables. To describe such type of dependent variable (i.e., question related to mode choice), the method needs to compare alternatives , one by one, with the baseline category . For example, in the case of baseline category logit, the log of ratio of probability is calculated as follows [32]:
where is the constant of alternative, are explanatory variables, and is the parameter of alternative related to explanatory variables that can be binary, categorical, ordinal, or continuous.
4. Results
In this section, we report the main findings from the conducted survey, correlation analysis, and MNL regression. In the Section 4.1, we provided descriptive statistics of the considered questions from the survey related to the mobility profile and travel preferences of respondents. The results of the Cramer’s V and Pearson correlations for questions related to the mode choice, as well as the factors that influence mode choice, are described in the Section 4.2. Finally, Section 4.3 is devoted to the results of the MNL regression, in which we distinguished three cases for determining explanatory variables that affect the traveler’s choice.
4.1. Descriptive Statistics Related to Considered Questions from Survey
In this section, we focus on the descriptive analysis of the conducted survey. Through 2199 collected answers, we obtained the information of respondents related to the socio-demographic (i.e., gender, age, average salary), travel frequency, the factors that influence the travel mode choice, etc. Related to the socio-demographic characteristics, it can be observed that 54.43% of respondents were female, and 44.52% of them were male (the rest of respondents declared either as other or rather not say), with an average age of 39 years. In addition, most of the participants, 61.07%, have an average household income, while 20.55% of them have high income [30].
Some of the main findings of the survey are summarized as follows. The first part of the survey, related to mobility profile, analyzed the most common motives for traveling by airplane such as “mostly for business”, “only for business (meetings, conferences, etc.), “mostly for leisure”, and “only for leisure (vacation, visiting family, etc.)”. According to the answers, “mostly for leisure” was selected as the most common purpose of travel for most of the respondents, resulting in 42.02%, Figure 1. On the other hand, the lowest number of respondents, 3.14% of them, selected “only for business”.
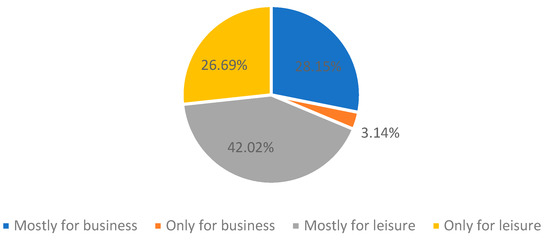
Figure 1.
The most common motives for traveling by airplane.
The second part of the survey was related to the travel preferences of passengers, where respondents selected transport options for arriving to/from the airport among “train”, “taxi (or ridesharing services like Uber of Lyft)”, “metro”, “combination of modes (bus or train)”, “car (someone drops me off/pick me up)”, “car (park at/near the airport)”, “bus” mode choice alternatives. As expected, most of the respondents (40.11%) selected “car (someone drops me off/pick me up)”, while “bus” was the chosen by the least number of respondents (2.59%), Figure 2.
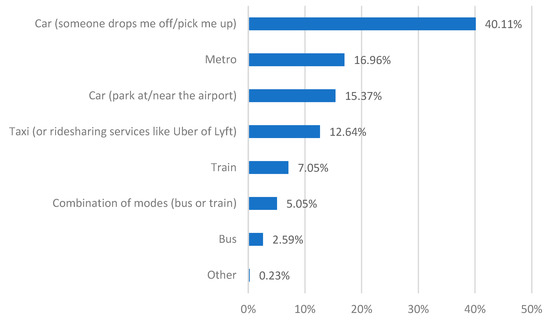
Figure 2.
Travel preferences of passengers related to airport access mode choice.
Moreover, the respondents were able to determine the importance of the factors that influence their decision in selecting travel mode choice though the relative scale of importance (not important, less important, important, more important, and most important). These factors were related to the waiting time, travel time, travel costs, reliability, security, weather, crowdedness, trip purpose, and familiarity of the city. For example, the factor “reliability” was rated as “more important” and “most important” more than other factors, when making the mode choice, by 34.88% and 33.97% of respondents, respectively. In addition, the factor “travel time” was rated as “important” by 42.25% of participants when selecting the mode of transport. Furthermore, the factor “travel costs” was selected to be “important” when making the mode choice by 39.79% of the respondents, while the factor “waiting time” was selected as “important” by 42.20% of respondents. Furthermore, in all the cases, less than 10% of the answers rated factors “reliability”, “travel costs”, and “waiting time” as “not important”. Therefore, these factors demonstrate high influence on the attitude and mode choice of travelers.
4.2. Results of Correlation Analysis
The structure of the survey was made from the total of 44 variables (22 nominal string variables with more than 2 answer choices, 13 numeric (Likert) variables, 7 binary variables, and 2 continuous/scale questions (complete questionnaire can be seen in [30])). However, we concentrated on the questions related to the mode choice and the factors that influence mode choice. Related to those selected variables, since most of them are nominal, we first performed Cramer’s V test to get an insight into the strength of the relationship between observed categorical variables. Figure 3 presents a heatmap with the results of Cramer’s V test which measure association between the airport access mode choice and all other variables from the survey. Based on the obtained results, variables with Cramer’s V test statistics value higher than 0.1 were further transformed into quantitative (dichotomous) categorical variables and Pearson’s correlation was applied to determine meaningful correlations.
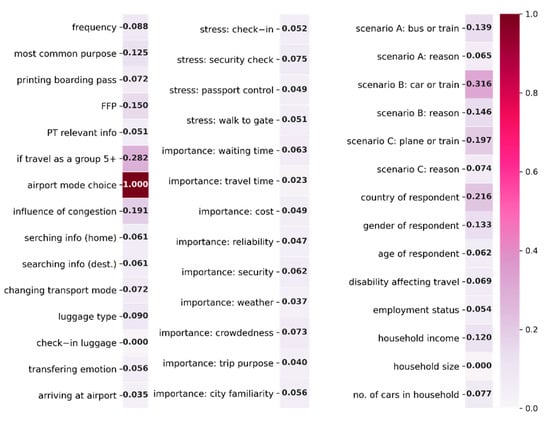
Figure 3.
Heatmap of Cramer’s V correlation between initial categorical variables and airport access mode choice.
In Table 2, we reported the results of the meaningful correlations related to the mode choice selection among “Car (someone drops me off/picks me up)”, “Car (park at/near the airport)”, “Train”, “Bus”, “Metro”, “Taxi (or ridesharing services like Uber or Lyft)”, “Combination of modes (e.g., bus and train)”, and “Other” mode choice alternative. Specifically, we reported the variables with a Pearson correlation coefficient greater than 0.14 in absolute value, while “bus”, “combination of modes”, and “other” mode choices have been omitted due to weak values of Pearson correlation. For example, the choice of the “Car (someone drops me off/picks me up)” alternative is positively correlated with female respondents who travel “only for leisure”, have Greek residence, and belong to the age group between “18 and 29” years. On the other hand, it is negatively correlated with male respondents with Spanish residence, who travel “mostly for business”, and are members of frequent flyer program (FFP). Furthermore, respondents with Greek residence were positively correlated with “comfort” as a factor for choosing the “Car (park at/near the airport)” alternative in Scenario B (Car or Train). The respondents with Serbian residence were negatively correlated to “travel cost” factor when choosing the “Car (park at/near the airport)” mode in Scenario B (Car or Train). Moreover, respondents with a permanent residence in Serbia were positively correlated with selecting the “Taxi (or ridesharing services like Uber or Lyft)” alternative for traveling to/from the airport, since taxi prices in Serbia are lower compared to other countries. On the other hand, the respondents with Serbian residence were negatively correlated with preferring public transport when traveling as a group of five or more people. Furthermore, the “train” mode involved only two main negative correlations, while “metro” mode showed positive correlations related to the influence of traffic congestion, when deciding the mode choice for reaching the airport [30].
Table 2.
Main Pearson correlations related to the question (If all of the following transport modes are available, which one would you choose to travel to/from the airport?).
4.3. Results of Multinomial Logistics Regression
The multinomial analysis was applied to determine explanatory variables that affect the traveler’s choice. As shown in Figure 4, the categorical dependent variable (question related to mode choice) is formed by seven alternatives with a different number of answers, ranging from 57 for the mode “Bus”, and 882 for the choice “Car (someone drops me off/picks me up)”. The independent variable considers the importance of significant attributes “waiting time”, “travel time”, “travel costs”, and “reliability” in the question related to the factors that influence the mode choice, as well as socio-demographic information. In the case of the question as a dependent variable, we merged the alternatives in two choice sets: private and public transport. As shown in Figure 4, the considered sample of a total of 2083 cases was formed by 1220 respondents who preferred private modes of transport, and 863 that opted for public modes of transport.
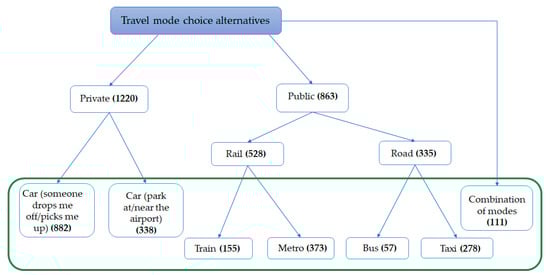
Figure 4.
Multinomial choice related to public and private modes.
To apply MNL regression, we proposed three cases as Case A, Case B, and Case C. In Case A, we referred to “Train” mode choice as a reference category, while in Case B we defined “Combination of modes” as a reference category. However, according to the results of the survey, we faced an unbalanced number of responses related to the transportation mode choice question (i.e., “If all of the following transport modes are available, which one would you choose to travel to/from the airport?”). Therefore, in Case C, we applied the resampling technique for capturing and analyzing the concept of multimodality in which we have the equal preferences (the equal number of responses) related to each travel mode alternative. For that purpose, we selected as a benchmark the total number of 111 answers related to the “Combination of modes” alternative. Since we faced a higher number of responses for car and taxi alternative, as well as a lower number of responses for metro, bus, and train alternatives, we applied a resampling technique in which we randomly extracted the answers from other transport modes to reach a balanced sub-sample. Specifically, we randomly selected 111 responses from the initial database related to the five travel mode choice alternatives (i.e., “Car (park at/near the airport)”, “Car (someone drops me off/picks me up)”, “Combination of modes”, “Train/Metro/Bus”, and “Taxi”) to match with the 111 responses collected for “Combination of modes” alternative. In this case, from the initial 2199 responses, we randomly selected 111 replies of each transportation mode to match with the 111 responses collected for “Combination of modes” alternative, which corresponds to a total of 555 answers.
The MNL regression is reported by providing the comparison among the travel mode choices alternatives considering Case A, Case B and Case C. In general, the result of the MNL regression, considering all transportation alternatives, showed that the included variables can correctly predict the 40.3% of cases (variance scores % by Cox and Snell, and % by Nagelkerke), as reported in Table 3. However, we can conclude that the model is much more accurate for those who preferred the alternative “Car (someone drops me off/picks me up)”, resulting in 91.8% correct predictions.
Table 3.
Classification matrix of the MNL regression—Case A and Case B.
As previously mentioned, the imbalance of replies showed the tendency of classifying most of the answers into category “Car (someone drops me off/picks me up)”. Accordingly, the prediction of alternative “Car (someone drops me off/picks me up)” resulted in 810 replies over total 882 (see Figure 4), which led to the probability of 91.8% (i.e., the ratio between 810 and 882 is 0.918). However, other transportation mode alternatives showed a much lower percentage, less than 20%, such as the “metro” alternative with the prediction of 13.7%, i.e., 51 cases of 373 total. For example, “bus” and “combination of modes” alternatives had a prediction of 0% since the total answers for such alternative were 57 and 111, respectively.
4.3.1. Case A (Reference Category “Train”)
The Case A was implemented to observe the differences between the various available travel alternatives with the “Train” mode as a reference category for public transport mode. For example, the comparison of the private and taxi alternatives versus train mode, regarding the factor “reliability”, showed the preference of public alternatives versus private ones. This can be interpreted as a better response of the public transport system to react to any unexpected events, during the journey to and from the airport. Additionally, the rating of importance of the factor “waiting time”, is lower for the alternative “train” versus the others. This result highlights the greater willingness of facing with higher waiting times for those who prefer to use the train, compared to the other modes.
Specifically, in Table 4, we report the detailed results of the MNL for Case A by distinguishing comparisons of other transportation mode alternatives with “Train” as a reference category as follows:
Table 4.
Results of multinomial logistic regression (Case A)—95% confidence level.
- Bus versus Train mode;
- Car (park at/near the airport) versus Train mode;
- Car (someone drops me off/picks me up) versus Train mode;
- Combination of modes (e.g., bus and train) versus Train mode;
- Metro versus Train mode;
- Taxi versus Train mode.
The column reports the significance level—values less than 0.05 in Table 4 (or between 0.05 and 0.1 in Table 5) for the Wald statistic based on its Chi-square distribution, where the Wald statistic (considering variables having a single degree of freedom) is the squared ratio of and its standard error The can take the values between the lower and upper limits considering the confidence level of 95% (or of 90% in Table 5). Most of the analyzed variables were significant on 5% level and those are reported with 95% confidence intervals, while a smaller number of variables showed significance on the 10% level and are reported with 90% confidence intervals.
Table 5.
Results of multinomial logistic regression (Case A)—90% confidence level and significance level between 0.05 and 0.1.
As observed from Table 4, the independent variables “business travel purpose”, and “reliability”, with a significant coefficient less than or equal to 0.1, negatively affected the probability of choosing the “Bus” versus “Train” odd ratio lower than 1 (OR < 1). Differently, a positive effect on the probability of choosing the “Bus” versus “Train” was related to female users (OR > 1). However, the significant variables for selecting “Car (park at/near the airport)” vs. Train mode alternative were related to factors such as “waiting time”, “reliability”, “travel cost”, “business travel purpose”, “female gender”, and the “age group from 50 to 65”. Therefore, one unit increase of the importance related to the factors “reliability”, “travel cost”, “business travel purpose”, as well as the age group from 50 to 65, negatively affected the probability of selecting the “Car (parking near the airport)” versus “Train”, Table 4 and Table 5. On the other hand, the factors “waiting time”, and female gender had a positive effect on the probability of selecting the “Car (parking near the airport)” versus “Train”. In the second situation of selecting Car (someone drops me off/picks me up) vs. Train mode alternative, the “age group from 50 to 65”, “business travel purpose”, and one unit increase of the importance of the factor “Reliability”, negatively affected the probability of choosing the “Car (someone drops me off/picks me up)” versus the “Train” mode, see Table 5. However, we can observe the positive effect of the one unit increase of the importance regarding the factor “Waiting time” and “female gender”, on the probability of choosing a “Combination of modes” versus the “Train”. In addition, one unit increase of the importance of the factor “waiting time”, “female gender”, and “high-income level” positively affected the probability of using the “Metro” versus “Train”, while the business motivation to travel was related to a negative effect. In the situation of “Taxi” vs. the “Train” mode, one unit increase of the importance regarding the factor “waiting time”, “female gender”, and “high-income level” positively affected the probability of choosing “Taxi” vs. the “Train”.
4.3.2. Case B (Reference Category “Combination of Modes”)
Case B of the multinomial analysis was carried out to investigate the attitudes of respondents related to the choice between one mode and combination of modes for accessing the airport. Therefore, the chosen reference alternative was “Combination of modes”. According to the results, in this regression we observed that, in some cases, the factor “travel time” assumed a lower importance for respondents who preferred the solution “Combination of mode”. Such result perceives a major travel time of such multimodal travel alternative, also because it did not include any form of coordination between transportation systems. More detailed results of the Case B by distinguishing comparisons of transportation mode alternatives with “Combination of modes” as a reference category were investigated as follows:
- Bus versus Combination of modes;
- Car (park at/near the airport) versus Combination of modes;
- Car (someone drops me off/picks me up) versus Combination of modes;
- Metro versus Combination of modes;
- Taxi versus Combination of modes.
The results of the MNL regression for Case B related to the significance level with values less than 0.05 are reported in Table 6, while in Table 7 the values considering the significance level between 0.05 and 0.1 are reported. According to Table 6, we can observe that one unit increase of the importance regarding the factors “waiting time” and “reliability” negatively affected the probability of using the “Bus” versus the “Combination of modes”, while the factor “travel time” had a positive effect. One unit increase of the importance related to the factors “travel cost” and “age group from 50 to 65” negatively affected the probability of preferring the “Car (parking near the airport)” versus the “Combination of modes”. On the other hand, the importance of the factor “travel time” had a positive effect on choosing “Car (parking near the airport)” versus the “Combination of modes”. Concerning the results of the comparison between the mode “Car (someone drops me off/picks me up)” versus the “Combination of modes”, it was observed that “female gender” had a positive effect, while belonging to the age group from 50 to 65 shows a negative influence. However, the probability of using the “Metro” versus the “Combination of modes” was positively influenced by a high income level. One unit increase of the importance regarding the factor “travel time”, “high income”, and “business purpose” positively affected the probability of choosing “Taxi” versus the “Combination of modes”, while the factor “travel cost” had a negative effect. In addition, one unit increase of the importance regarding the factors “waiting time” and “female gender” negatively affected the probability of choosing the “Train” versus the “Combination of modes”.
Table 6.
Results of multinomial logistic regression (Case B)—95% confidence level.
Table 7.
Results of multinomial logistic regression (Case B)—90% confidence level and significance level between 0.05 and 0.1.
4.3.3. Case C
In Case C, we referred to the “Combination of modes” alternative, and then we randomly extracted the same number of cases from other transport modes to reach a balanced sub-sample. Furthermore, the number of alternatives was reduced by merging the alternatives “Metro”, “Bus”, and “Train” in one new dummy category. In summary, the rating of the factor “travel time” positively affected the choice of the “Car (park at/near the airport)”, while the importance of “travel cost” and “reliability” pointed out negative influence. The category “Train/Metro/Bus” emerged as the positive effect of the importance related to the factor “reliability”. The higher rating of the variable “waiting time” positively affected the probability of choosing the alternative Taxi versus the combination of modes. On the other hand, the importance of factor “travel cost” showed a negative influence. Next, we report the results of the MNL regression of the Case C for the following situations:
- Bus versus Combination of modes
- Car (park at/near the airport) versus Combination of modes
- Train/Metro/Bus versus Combination of modes
- Taxi versus Combination of modes
According to the results in Table 8, the resampling strategy reached a lower percentage of total correctly predicted cases compared to the regression considering the whole sample (34.1 < 40.3). However, considering the prediction of each alternative, the obtained percentage was more uniformly distributed. The variables included in the model correctly predicted 34.1% of cases. Furthermore, in this case, results were more accurate for those who preferred the alternative “Car (someone drops me off/picks me up)” (48.6%) than for other modes. Additionally, the results of the model are reported considering the variance scores % by Cox and Snell, and % by Nagelkerke. Accordingly, we can observe that the obtained variance scores of the multinomial logistic regression considering resampling strategy were higher than the multinomial logistic regression of the whole sample. This is due to the equal number of 111 replies that were initially randomly selected for each one of the 5 considered alternatives. In this way, the probability of selecting each one of the considered alternatives was much more accurate, as well as the total prediction regarding the ratio of predicted and total number of responses for each alternative (e.g., the correct prediction of 54 for “Car (someone drops me off/picks me up)” over 111 of the total answers led to the overall prediction of 48.6%), as reported in Table 8.
Table 8.
Classification matrix of the MNL regression—Case A and Case B.
Further, we report the results of the MNL regression of the Case C related to the significance level (lower than 0.05) in Table 9, and significance level between 0.05 and 0.1 in Table 10. Considering the comparison between the alternatives “Car (someone drops me off/picks me up)” versus “Combination of modes” in Table 9, we can observe only one significant factor as “female gender” that showed a positive influence on this mode choice. However, one unit increase of the importance regarding the factor “travel time” positively affected the probability of using the “Car (park at/near the airport)” versus the “Combination of modes”. On the other hand, a negative effect was related to the independent variables concerning the importance of “travel cost” and “reliability”, while belonging to the age group from 50 to 65 showed a negative influence. Additionally, a single significant independent variable emerges as the result of the comparison between the “Train/Metro/Bus” versus “Combination of modes”. In particular, this independent variable regarded the importance of “reliability”, where a growing level of the latter positively affected the probability of choosing the group of three modes of transport “Train/Metro/Bus”. Moreover, one unit increase regarding the variable “waiting time”, and business travel purpose positively affected the probability of choosing the “Taxi” versus the “Combination of modes”. Differently, the importance of the variable “travel cost” showed a negative effect.
Table 9.
Results of multinomial logistic regression (Case C)—95% confidence level.
Table 10.
Results of multinomial logistic regression (Case C)—90% confidence level and significance level between 0.05 and 0.1.
5. The Impact of Non-Coordination in Multimodal Trip
The results of the three cases of MNL analysis reflect the actual situation related to transportation mode choices, which is dominated by non-coordination among TSPs. To assess the impact of non-coordination, we performed further analysis, starting from the interpretation of the coefficients in the MNL analysis related to the statistically significant independent variables. Specifically, we were able to estimate the change in the probability of a certain choice by varying a single independent variable and keeping all the others constant. In this way, we estimated the Likert scale factors that influenced mode choice (“How much do the following factors influence your choice of mode when travelling to and from the airport?”), such as “waiting time, and “reliability”.
Thus, we represented the ranking of the airport access mode choice preference, according to the importance of the factor “waiting time”. According to Figure 5 and the presented ranking, the probability of choosing “Taxi” was higher than the probability of choosing other modes when the factor “waiting time” was highly important, while the choice of the “Bus” mode would correspond to the situation in which “waiting time” was a less important factor. Such outcome confirms what is expected regarding the preference of private transport modes and “Taxi” compared to “Train”, in which travelers prefer these mobility solutions when the waiting time or delays are of significantly higher importance. For example, the probability of choosing “Taxi” is 1.6 times higher than choosing “Train”. This can be observed from the results of the MNL analysis regarding the OR ratio, as follows:
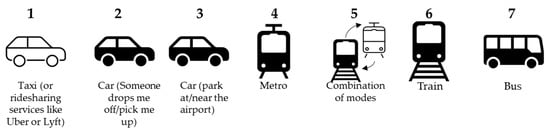
Figure 5.
The ranking of mode choices regarding the importance of factor “waiting time”.
- Combination of modes, (OR = 1.375)
- Metro, (OR = 1.441)
- Car (park at/near the airport), (OR = 1.466)
- Car (Someone drops me off/pick me up), (OR = 1.543)
- Taxi, (OR = 1.643)
We can state that the importance of “waiting time” resulted in higher probability of choosing “Car (as passengers or drivers)” in the case of the non-coordination among TSPs. However, we can expect lower waiting time if the coordination among TSPs exists, and therefore, higher probability of choosing the public transport modes.
In Figure 6 is reported the ranking of mode choice according to the one unit increase in the importance of the factor “reliability”. We can observe low preference regarding the choice of “Bus”, “Car”, and “Taxi” mode, according to the one unit increase of the factor reliability factor. Therefore, we can state that the importance of the reliability causes the higher probability of choosing public modes versus private ones, which can be confirmed with the B values, as follows:
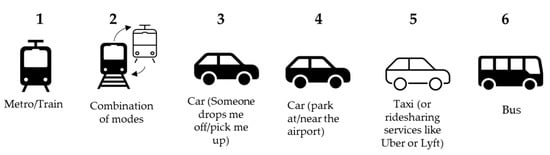
Figure 6.
The ranking of mode choices regarding the importance of factor “reliability”.
- Bus, (B = −0.418)
- Taxi, (B = −0.239)
- Car (park at/near the airport), (B = −0.220)
- Car (Someone drops me off/pick me up), (B = −0.199)
The importance of factor “reliability” is not significant when comparing “Car (as passengers)” with “Combination of modes” in Case C. Moreover, the comparison of “Car (as driver)” with “Combination of modes” in Case C, results in a lower negative value of parameter B = −0.277. Accordingly, we can observe the higher importance of the factor reliability for “Combination of modes”, as well as a positive effect for the union of “Train/Metro/Bus” which resulted in B = 0.284. On the other hand, the importance of the factor “reliability” for “Bus” mode is lowest due to the following reasons: (i) the importance of the factor “reliability” for Bus mode is lower than “Train” mode; (ii) the number of the answers for “Bus” mode is significantly lower than the other modes.
6. Conclusions
In this paper, we analyzed the travelers’ mode choice behavior, as well as the factors that influence their airport access mode choice. The outcome of the analysis investigates the opportunities for shifting from private to public transport modes. Specifically, we provided correlation analysis to reveal the main factors that influence travelers’ mode choice and consequently, we provided MNL regression to assess the probability of selecting certain travel modes. The model has been applied to a real-case study considering the answers obtained from the participants in the SYN+AIR’s survey, [30].
According to the results of the meaningful correlations, the participants who preferred private solutions i.e., car (as passenger/driver) were positively correlated with: (i) traveling for leisure by plane; (ii) not being a frequent flyer; (iii) not being influenced by traffic congestion; (iv) having a low income level; and (v) traveling mostly for business (those who chose Taxi). Furthermore, these respondents belong to the younger age groups, and mostly, they perceive waiting and travel time as more important factors than reliability and travel cost, when choosing the airport access mode. On the other hand, travelers who opted for public modes, were positively correlated with: (i) being influenced by the traffic congestion (those who preferred train and metro); (ii) being mostly males (those who opted for the train); (iii) declaring a high income level; and (iv) preferring to travel within the groups of 5 people (those who preferred metro and Taxi), e.g., respondents from Spain (preferring Bus) and Serbia (preferring Taxi). These respondents perceived as more important the reliability and travel cost than waiting and travel time when choosing the airport access mode.
The main finding of our model confirmed previously found factors that influence the airport access mode choice, but also provided a new insight with respect to the multi-modal service with air transport as a main leg. Namely, after performing MNL regression, it was shown that the factor “reliability” has the highest importance for the Train/Metro union in the case of non-coordination among TSPs. Nevertheless, even in this case, we can notice that the reliability has a significant impact when selecting more than one transport mode choice. Thus, the impact of reliability should be supported even in the case of coordination among TSPs in order to minimize the risk of missing the flight. Furthermore, the waiting times in between should be balanced and reduced to improve passengers’ experience. Attractive service features tailored to air passengers in terms of improved reliability and reduced waiting times will result in higher probability of choosing public transport modes, such as metro and train. Consequently, transport operators (and the environment too) should benefit from an increase of the share of travel demand shifted from the private car. Moreover, through the attributes (i.e., waiting time and reliability) are given the terms for establishing coordinated multimodal services in the practical applications. One of the practical applications is to push Mobility as a Service (MaaS) technology, where, in the process of journey planning, the MaaS operators receive the data from the network, TSP’s services, and users’ preferences to plan the journey and optimize travel routes. In this way, the reliability would be an important factor for providing a seamless journey considering the following perspectives:
- From users’ perspective, we can introduce better reliability of public modes (bus, train, metro) by offering coordinated multimodal timetables. In the MaaS, this could be achieved through the demand prediction by obtaining information from passengers (i.e., origin, destination, time of requested service). At the same time, the better timetable coordination will result in reduced delays and waiting time.
- From public authorities’ perspective, we can achieve better reliability by providing infrastructure accessibility that will encourage users to use more sustainable travel modes.
- From the policy making perspective, the reduced waiting times and increase of reliability could be helpful for shifting the demand from private cars to other travel modes.
However, this study has certain limitations related to the period of time when survey was conducted. Namely, the pandemic situation influenced passenger responses since they needed to recall to their last travel by air. Also due to pandemic, we were forced to conduct online survey. Although we are aware of the challenges of online surveys and tried to avoid pitfalls, we believe that a face-to-face survey would provide more reliable results.
For further developments, we aim to deepen the concept of the coordination among different TSPs considering the data that need to be shared among them, as well as the development of smart contract frameworks. This would enable the possibility for passengers to have a seamless D2D journey with “single ticket” experience, as well as accessibility to the real-time information in the multimodal chain.
Author Contributions
Conceptualization, A.C., S.G.P., K.K., M.K., S.D., D.B. and M.O.; methodology, S.G.P. and A.C.; validation, S.G.P. and A.C.; formal analysis, S.G.P., A.C. and K.K.; investigation, A.C., S.G.P., K.K., M.K., S.D., D. B. and M.O.; writing—original draft preparation, A.C.; writing—review and editing, A.C., S.G.P., K.K., M.K., S.D., D.B. and M.O.; visualization, A.C., S.G.P., K.K., M.K., S.D., D.B. and M.O.; supervision, M.O. All authors have read and agreed to the published version of the manuscript.
Funding
This work was developed within the project SYN+AIR: “Synergies between transport modes and air transportation”. Both the research and the APC were funded by SESAR Joint Undertaking under the European Union’s Horizon 2020 research and innovation program under grant agreement No. 894116.
Institutional Review Board Statement
Not applicable.
Informed Consent Statement
Not applicable.
Data Availability Statement
Not applicable.
Acknowledgments
Parts of this study were supported by SESAR Joint Undertaking within the project “Synergies between transport modes and Air transportation” (SYN+AIR) under grant agreement No. 894116 and the Ministry of Education, Science, and Technological Development, Republic of Serbia, as part of projects TR36033 and TR36002 (2011–2022).
Conflicts of Interest
The authors declare no conflict of interest.
References
- European Commission Eu Action. CO2 Emission Performance Standards for Cars and Vans. 2022. Available online: https://ec.europa.eu/clima/eu-action/transport-emissions/road-transport-reducing-co2-emissions-vehicles/co2-emission-performance-standards-cars-and-vans_en (accessed on 20 July 2022).
- Litman, T. Introduction to Multi-Modal Transportation Planning; Victoria Transport Policy Institute: Victoria, BC, USA, 2017. [Google Scholar]
- Pasha, M.M.; Hickman, M.D.; Prato, C.G. Modeling Mode Choice of Air Passengers’ Ground Access to Brisbane Airport. Transp. Res. Rec. 2020, 2674, 756–767. [Google Scholar] [CrossRef]
- Tam, M.L.; Lam, W.H.K.; Lo, H.P. Modeling air passenger travel behavior on airport ground access mode choices. Transportmetrica 2008, 4, 135–153. [Google Scholar] [CrossRef]
- Choo, S.; You, S.; Lee, H. Exploring characteristics of airport access mode choice: A case study of Korea. Transp. Plan. Technol. 2013, 36, 335–351. [Google Scholar] [CrossRef]
- Chang, Y.C. Factors affecting airport access mode choice for elderly air passengers. Transp. Res. Part E Logist. Transp. Rev. 2013, 57, 105–112. [Google Scholar] [CrossRef]
- Ottomanelli, M.; Colovic, A.; Pilone, S.G.; Binetti, M.; Dožić, S.; Babić, D.; Kalić, M.; Kukić, K.; Simić, T.K.; Stroumpou, I.; et al. SYN + AIR: D4.2 Report on Network Sensitivity Analysis, H2020-SESAR-2019-2. Available online: https://syn-air.eu/ (accessed on 7 June 2022).
- Janić, M. Landside Accessibility of Airports, Analysis, Modelling, Planning, and Design; Springer International Publishing AG, Part of Springer Nature: Cham, Switzerland, 2019. [Google Scholar]
- Tam, M.L.; Lam, W.; Lo, H.P. The Impact of Travel Time Reliability and Perceived Service Quality on Airport Ground Access Mode Choice. J. Choice Model. 2011, 4, 49–69. [Google Scholar] [CrossRef] [Green Version]
- Jou, R.; Hensher, D.; Hsu, T. Airport ground access mode choice behaviour after the introduction of a new mode: A case study of Taoyuan International Airport in Taiwan. Transp. Res. Part E Logist. Transp. Rev. 2011, 47, 371–381. [Google Scholar] [CrossRef]
- Alhussein, S.N. Analysis of ground access modes choice King Khaled international airport, Riyadh, Saudi Arabia. J. Transp. Geogr. 2011, 19, 1361–1367. [Google Scholar] [CrossRef]
- Akar, G. Ground access to airports, case study: Port Columbus International Airport. J. Air Transp. Manag. 2013, 30, 25–31. [Google Scholar] [CrossRef]
- Yazdanpanah, M.; Hosseinlou, M.H. The influence of personality traits on airport public transport access mode choice: A hybrid latent class choice modeling approach. J. Air Transp. Manag. 2016, 55, 147–163. [Google Scholar] [CrossRef]
- Gokasar, I.; Gunay, G. Mode choice behavior modeling of ground access to airports: A case study in Istanbul, Turkey. J. Air Transp. Manag. 2017, 59, 1–7. [Google Scholar] [CrossRef]
- Zaidan, E.; Abulibdeh, A. Modeling ground access mode choice behavior for Hamad International Airport in the 2022 FIFA World Cup city, Doha, Qatar. J. Air Transp. Manag. 2018, 73, 32–45. [Google Scholar] [CrossRef]
- Birolini, S.; Malighetti, P.; Redondi, R.; Deforza, P. Access mode choice to low-cost airports: Evaluation of new direct rail services at Milan-Bergamo airport. Transp. Policy 2019, 73, 113–124. [Google Scholar] [CrossRef]
- Bergantino, A.S.; Capurso, M.; Hess, S. Modelling regional accessibility to airports using discrete choice models: An application to a system of regional airports. Transp. Res. Part A Policy Pract. 2020, 132, 855–871. [Google Scholar] [CrossRef]
- Zijlstra, T. A border effect in airport choice: Evidence from Western Europe. J. Air Transp. Manag. 2020, 88, 101874. [Google Scholar] [CrossRef]
- Pamucar, D.; Deveci, M.; Canıtez, F.; Lukovac, V. Selecting an airport ground access mode using novel fuzzy LBWA-WASPAS-H decision making model. Eng. Appl. Artif. Intell. 2020, 93, 103703. [Google Scholar] [CrossRef]
- Gunay, G.; Gokasar, I. Market segmentation analysis for airport access mode choice modeling with mixed logit. J. Air Transp. Manag. 2021, 91, 102001. [Google Scholar] [CrossRef]
- Lu, J.; Meng, Y.; Timmermans, H.; Zhang, A. Modeling hesitancy in airport choice: A comparison of discrete choice and machine learning methods. Transp. Res. Part A 2021, 147, 230–250. [Google Scholar] [CrossRef]
- Bruderer Enzler, H. Air travel for private purposes. An analysis of airport access, income and environmental concern in Switzerland. J. Transp. Geogr. 2017, 61, 1–8. [Google Scholar] [CrossRef]
- Koo, T.; Wu, C.L.; Dwyer, L. Ground travel mode choices of air arrivals at regional destinations: The significance of tourism attributes and destination contexts. Res. Transp. Econ. 2010, 26, 44–53. [Google Scholar] [CrossRef]
- Budd, T. An exploratory examination of additional ground access trips generated by airport ‘meeter-greeters’. J. Air Transp. Manag. 2016, 53, 242–251. [Google Scholar] [CrossRef] [Green Version]
- Yang, C.W.; Liao, P.H. Modeling the joint choice of access modes and flight routes with parallel structure and random heterogeneity. Transp. Res. Part E Logist. Transp. Rev. 2016, 95, 19–31. [Google Scholar] [CrossRef]
- Jehanfo, S.; Dissanayake, D. Modelling airport surface access using discrete choice methods: A Case Study in Newcastle upon Tyne. In Proceedings of the 11th World Conference on Transport Research World Conference on Transport Research Society, Berkley, CA, USA, 24–28 June 2007. [Google Scholar]
- Tsamboulas, D.; Evmorfopoulos, A.P.; Moraiti, P. Modeling airport employees commuting mode choice. J. Air Transp. Manag. 2012, 18, 74–77. [Google Scholar] [CrossRef]
- Lee, J.K.; Yoo, E.K.; Song, H.K. A study on travelers’ transport mode choice behavior using the mixed logit model: A case study of the Seoul-Jeju route. J. Air Transp. Manag. 2016, 56, 131–137. [Google Scholar] [CrossRef]
- Keumi, C.; Murakami, H. The role of schedule delays on passengers’ choice of access modes: A case study of Japan’s international hub airports. Transp. Res. Part E Logist. Transp. Rev. 2012, 48, 1023–1031. [Google Scholar] [CrossRef]
- Mavromatis, K.; Kalić, M.; Kukić, K.; Ottomanelli, M.; Colovic, A. SYN + AIR: D3.1 Report on Customer Journeys, H2020-SESAR-2019-2. Available online: https://syn-air.eu/ (accessed on 14 February 2022).
- Everitt, B.S.; Skrondal, A. The Cambridge Dictionary of Statistics, 4th ed.; Cambridge University Press: New York, NY, USA, 2010; pp. 1–480. [Google Scholar]
- McFadden, D. Conditional Logit Analysis of Qualitative Choice Behavior, 4th ed.; University of California: Verkeley, CA, USA, 1974; pp. 105–142. [Google Scholar]
Publisher’s Note: MDPI stays neutral with regard to jurisdictional claims in published maps and institutional affiliations. |
© 2022 by the authors. Licensee MDPI, Basel, Switzerland. This article is an open access article distributed under the terms and conditions of the Creative Commons Attribution (CC BY) license (https://creativecommons.org/licenses/by/4.0/).