Abstract
Solar radiation is considered the main renewable energy source which reshapes the global sustainability plan for future development. Due to the lack of solar radiation measurements, this work investigates the performance of several temperature-based hybrid solar radiation models combining the parametric, statistical and satellite data approaches to estimate the global solar radiation on a horizontal surface. Over 35 years of meteorological data in the new location, Arar City, KSA (Latitude 30°96′ N and longitude 41°05′ E) are employed to establish and validate the models. These models are validated using two datasets with different averaging time spans to investigate the accuracy and reliability of different models as forecasting tools for the solar radiation. The mostly common statistical indicators are calculated to identify the most accurate model. The results show that Model (1) has the best performance among all models with high reliability as a solar radiation forecasting tool in this new location. This model is also validated against the widely-used datasets, namely NASA, On-Site measurements and PVGIS-SARAH data. The model shows excellent values for statistical indicators with high values of coefficient of determination, R2 > 0.955, presenting the best performance regardless of the time span of the validation datasets.
1. Introduction
Due to the expanding consumption of fossil fuels because of the population increase and economic activities along with instability of oil prices and the contamination of the air pollution and greenhouse gas emissions, the interest in sustainable sources of energy, particularly solar energy, is continuously increasing [1,2,3,4,5]. The proper knowledge of solar radiation data is the initial stage in assessing solar energy availability in solar energy research [6,7,8,9,10,11,12]. Solar radiation is also the basic input for a variety of solar energy applications [13,14,15,16]. Various solar radiation models are proposed for solar radiation estimation because of the high cost of measurement equipment, calibration and maintenance [17,18,19]. Numerous studies have been carried out in attempt to develop models for estimating global solar radiation, including the use of machine learning algorithm [20,21,22], day of the year information [23], geographical information [24] and meteorological parameters [25,26,27,28]. R. Urraca et al. investigated five estimation methods for global solar radiation for central Spain as a case study. Discarding the hybrid techniques, the investigated approaches are parametric modeling, statistical modeling, interpolated ground-based measurements, a satellite-based dataset and a reanalysis dataset. The study shows the strengths and weaknesses for each approach and gives a deeper understanding for the selection of the adequate estimation technique. The results show that SARAH satellite-based dataset is the most accurate method with high spatial and temporal resolution and fairly accurate estimations and is highly independent of cloudiness [16].
Generally, the basic model for calculating global solar radiation using sunshine duration is presented by Angstrom [29]. This model is adjusted by Prescott [30], and it is immensely utilized for global solar radiation evaluation across the world [31,32,33]. Many studies are carried out to determine the suitability of various solar models for a given site or a number of places throughout the world. Fariba Besharat et al., for example, examined various empirical models for calculating global solar radiation and presented a case study for Yazd, Iran. O.O. Ajayi et al. [34] introduced a novel model for calculating daily global solar radiation across Nigeria. A comparative assessment of total, direct and diffuse solar radiation by using various models on inclined and horizontal surfaces over Cairo, Egypt is carried out by Samy A.Khalil and A.M. Shaffe [35]. Similarly, three simple new correlations based on meteorological parameters for predicting global solar radiation on a horizontal surfaces in Egypt are proposed by El-Metwally [36]. The collected findings revealed that the presented models outperformed Supit–Van Kappel model [37] and with lower differences than the Angstrom–Prescott model [30]. Mohamed Salah Mecibah et al. [38] conducted a study to introduce the best model for estimating the monthly average daily global solar radiation on a horizontal surface for six Algerian sites. Similarly, H. Khorasanizadeh and K. Mohammadi [39] presented the most accurate model for predicting monthly average global solar radiation across six major Iranian cities. The efficacy of 52 sunshine-based models in predicting the monthly average global solar radiation values on horizontal surfaces in Jouf, Saudi Arabia was reported by Al-Mostafa, Z.A. et al. [40]. The gained results showed that certain models are completely inappropriate for these locations, while others function differently.
The most frequent parameter employed for predicting global solar radiation is sunshine duration and the sunshine-based models have accurate estimates [39,40]. Recently, different development efforts for empirical models including calibration and evaluation and performance enhancement are achieved for different geographical area and climate conditions [4,5,10,11,12,17,18,41,42,43]. However, compared to ambient temperature data at normal meteorological stations [44], sunshine data is not as readily available, and the ambient temperature is simply recorded for most conventional meteorological activities [45]. As a result, models based on sunshine duration are challenging to be applied in regions where sunshine data is not available [46,47]. Therefore, new models based on the other meteorological parameters, especially temperature data, are developed as alternative models to predict solar radiation at various sites across the world.
For the temperature-based models, a simple model based on maximum and minimum temperatures to predict solar radiation is introduced by Hargreaves and Samani [48]. Annandale et al. [49] updates Hargreaves and Samani’s model to calculate the impact of reduced altitude and atmospheric thickness on global solar radiation by proposing a correction factor. Hassan et al. [28] explored how 31 non-sunshine-based models performed while predicting the monthly average of daily global solar radiation on a horizontal surface. The models are grouped into six groups: (1) solely based on temperature; (2) solely based on cloud cover; (3) solely based on relative humidity; (4) solely based on alien solar energy and solar declination angle; (5) solely based on temperature; (6) solely based on temperature and relative humidity. The obtained results showed that some models are inappropriate for use in the research area, while others differ in prediction performance. Hassan et al. [50] also introduced novel ambient-temperature-based models for evaluating global solar radiation as alternative models to the widely used models based on sunshine data. According to the results, the local formula for the most accurate model, from these novel temperature-based models, gives accurate estimations for global solar radiation at various sites. Furthermore, the most accurate model (both local and general formulae) from these models outperforms the two most accurate sunshine-based models in the literature.
The aim of this work is to study the performance of four different empirical solar radiation models based on ambient temperature data to predict the monthly average daily global solar radiation values on a horizontal surface. These four temperature-based solar radiation models are selected due to their high accuracy and good performance based on the literature, [28]. To achieve this purpose, the measured weather data at the study location, Arar City, KSA (Lat. 30°51′ N and long. 29°34′ E), are employed to develop and validate the suggested temperature-based solar radiation models. Although this region is selected to develop different solar-energy-based projects because it is located in the most favorable solar belt with the highest potential to receive solar radiation, there is a lack for solar radiation ground measured data. Consequently, the need to solar radiation modeling is the acceptable solution to perform the solar energy availability assessment which is used for design and performance evaluation for different solar applications. The following points can be considered some of the novelties and contributions of the current study:
- Evaluating solar radiation potential at the study location, Arar City, KSA.
- Assessing performance for one of the best Temp-Based Models, which has been presented recently, for predicting global solar radiation at new location with different weather conditions, Arar City, KSA.
- Evaluation and performance comparison of temperature-based models in estimating monthly average daily global solar radiation on a horizontal surface.
- Investigate the effect of using long-term and short-term validation datasets (validation using average data of three years and data of one year) on models’ performance and accuracy.
- To investigate the stability and reliability of these models as temperature-based forecasting tools for the global solar radiation providing accurate predictions of solar radiation values for engineers and designers, which can be employed in the design and evaluation of performance for different solar applications in this region.
The models’ prediction is compared with the measured values of monthly average daily global solar radiation. Long- and short-term validation datasets are used to evaluate the performance and stability of these models as accurate and reliable forecasting tools for global solar radiation. Furthermore, the majority and the most commonly statistical errors such as mean absolute percentage error, MAPE, root mean square error, RMSE, mean absolute bias error, MABE, relative error, , t-Test, coefficient of determination, R2 and correlation coefficient, , are calculated to evaluate models’ performance [51,52,53]. The most accurate, stable and reliable model is identified based on the results of the validation process with the measured data for the global solar radiation. Moreover, the performance of the developed models is also validated and verified with different measured data of global solar radiation from different available sources, namely On-Site Data and Photovoltaic Geographical Information System (PVGIS) Data. Furthermore, a comparison between the accuracy of the current work and the previous studies are achieved showing good enhancement by the current work.
2. Models
2.1. Global Solar Radiation Models
Several novel temperature-based models for estimating global solar radiation on a horizontal surface as alternatives models for sunshine-based models are presented by Hassan et al. [39]. The most accurate model from these novel models is compared with another three temperature-based models [28] which also provided very good performance in estimating monthly average global solar radiation. These models are defined as follows:
where and are the global solar radiation and extraterrestrial solar radiation on horizontal surface (MJ/m2 day); , , , , are the monthly average of daily ambient, minimum, maximum and temperature difference (°C), respectively. a, b and c are the empirical coefficients.
2.2. Extraterrestrial Solar Radiation
Extraterrestrial solar radiation, , is the solar radiation above the atmosphere and its equation given by [54]:
where is the solar constant, equal to 1367 W/m2 [35,55], f, , and are the eccentricity correlation factor of the earth’s orbit, hour angle at sunset (°), solar declination angle (°) and location’s latitude, successively. , f and δ are defined by the following [56]:
where indicates to day of the year number starting from 1 January.
3. Data Set and Models Validation
In this work, over 35 years of long-term measured meteorological data from Jan. 1984 to Dec. 2019 are utilized to build the studied models as well as validate their performance and applicability in estimating the monthly average values of daily global solar radiation on a horizontal surface. All these meteorological data are collected for the study location, Arar City, KSA (Lat. 30°96′ N and long. 40°05′ E). Arar region is located in northern Saudi Arabia near the Iraqi border where the climate is classified according to Köppen–Geiger climate classification system as an arid desert with hot and dry climate conditions. The maximum minimum temperature varies between 40 and 3 °C and the relative humidity varies between 15% in summer and 58% in winter. All used parameters—global solar radiation, ambient temperature, minimum and maximum temperature data—are obtained from power data access of NASA Surface Meteorology and Solar Energy website, which are used and utilized in many studies [23,28,50,57]. The values of monthly average for various parameters and extraterrestrial solar radiation as well as declination angle are computed by in-house computer program.
Furthermore, the performance of the developed models is also validated and verified with different measured data of global solar radiation from different available sources namely; On-Site Data and Photovoltaic Geographical Information System (PVGIS) Data. Regarding the On-Site Data, it is collected by Arar Technical Institute (Arar-TVTC) Solar Resource Monitoring Station. The station is considered as one of the stations participating in the Renewable Resource Monitoring and Mapping (RRMM) Program which related to King Abdullah City for Atomic and Renewable Energy. The data is available through the online Renewable Resource Atlas [58]. The On-Site Data (Monthly) is available from 1 December 2014 to 1 March 2021, where 2015, 2016 and 2019 have the only complete data for the twelve months of the year. Similarly, PVGIS Data is obtained from the PVGIS web interface providing the solar radiation data and photovoltaic system energy production between 2005 and 2016 based on SARAH satellite dataset, for different regions around the world [16].
In order to investigate the performance of several temperature-based models in predicting global solar radiation, the majority of commonly statistical indicators, such as MPE, MBE, RMSE, MAPE, MABE,, t-Test, and R2, are calculated to evaluate models performance of [51,52,53]. RMSE values provide information about the short-term performance for the developed model; its value always positive and zero is the ideal case, where smaller value refers to better performance. The values of MBE supply information about the long-term model performance, where positive value refers to overestimation in the model prediction and the negative one refers to underestimation. The smaller values consider the desired values, and they refer to better performance. The t-Test allows models to be compared at the same time and indicates whether a model’s prediction is statistically significant or not, where smaller value refers to better performance for the model [27,59]. The relative percentage error () shows agreement between measured and calculated value of , which confirmed for each month and preferable values between −10 and +10%. Coefficient of determination (R2) values provides information about the goodness of fit for the proposed model, where its values fall between zero and one and the largest value is the desired one. values, similarly, which close from unity (1) are the desired value and points to good model performance. The acceptable range for these statistical indicators, RMSE, MBE, MPE, MABE, MAPE, are between ±10% [27,34,41]. These indicators are defined as follows:
where , are the values of th predicted and the measured global solar radiation respectively, is the mean estimated global solar radiation, is the mean measured global solar radiation and is the number of observations which taken into account.
4. Results and Discussion
To check the applicability and the accuracy of the selected models in predicting monthly average daily global solar radiation values, a long-term of recorded data of daily global solar radiation are employed. This data of global solar radiation is divided into two sets and averaged to obtain the values of monthly average. The first subset from January 1984 to December 2016 is used for establishing models using regression analysis [33,34,39]. These regression coefficients are calculated and summarized in Table 1. On the other side, the validation process is performed using other range of metrological data from January 2017 to December 2019 which is different from the data set used for model developing and training avoiding the probability of the overfitting for the model predictions. The validation process is conducted using two validation sets based on the time period between 2017 on 2019. The first one is the average data of three years for the monthly-average-daily-global solar radiation, from January 2017 to December 2019, and the second validation set is the data of one year, 2019 for the monthly-average-daily-global solar radiation. These two validation sets are utilized for evaluating and validating the developed models. Furthermore, the long term (average of three years) validation dataset is used to evaluate the accuracy and general performance of the models while the short term (one year) validation dataset is used to evaluate the reliability of the models as forecasting tools for global solar radiation. The models’ prediction, Equations (1)–(4), are compared with the measured values of monthly-average-daily global solar radiation and the statistical indicators, RMSE, MBE, MPE, MAPE, MABE, t-Test, and R2 are computed using equations Equations (9)–(17). The comparison between the predictions of the models using the two validation sets is shown in the following sections.

Table 1.
Regression coefficients for the developed Models (1–4) at study location.
For the validation using average data of three years, from January 2017 to December 2019, the measured data of daily global solar radiation and temperature, as well as extraterrestrial solar radiation, are averaged to receive monthly average data, where this period starts from January 2017 to December 2019. All statistical indicators are calculated for all models and summarized in Table 2. According to the obtained results, the most accurate model is identified by comparing its statistical errors with those of the other models having the largest value of R2. The best model is indicated in bold as shown in Table 2.
Table 2.
Statistical indicators for the proposed Models (1–4) at study location (Validation with average data of three years, 2017–2019).
According to the measured data, statistical parameters for the estimated values of global solar radiation, , from all models are in the acceptable range ±10%, all models showed very good performance. The best performance is obtained by Model 1 and its statistical errors, MPE, MBE, RMSE, MAPE, MABE, t-Test, and R2 are −4.0972%, −0.6283 MJ/m2, 1.0878 MJ/m2, 5.0289%, 0.8801 MJ/m2, 2.3463, 0.9952 and 0.96896, respectively. Model 4 ranked the second one, with R2 equals 0.96469, followed by Model 2, Model 3, respectively. In fact, all models demonstrated good performances, and their performances are slightly close to each other with excellent R2. The values of correlation coefficient () are larger than 0.99, and coefficient of determination values (R2) for all models are higher than 0.96, which indicates a good fitting and Model 1 gives the most accurate estimation. According to the revealed results, the proposed models are ranked based on their performance and presented in Table 2. Figure 1 and Figure 2 shows the overall performance for all developed models, including the best model, Model 1, compared with the measured values for the Three-years-averaged and Single Year Validation dataset, respectively.
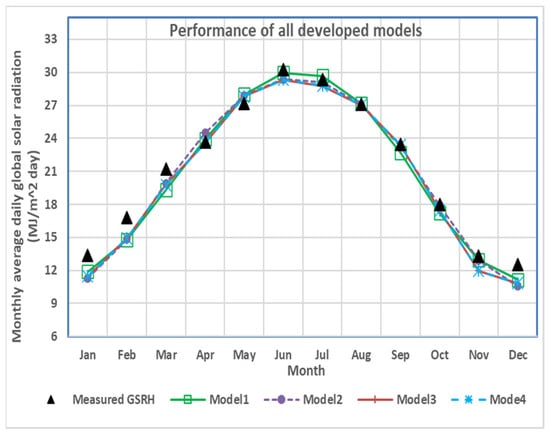
Figure 1.
Prediction of all models including the best model (Model 1) compared with the measured values (Three-Years Averaged Validation dataset).
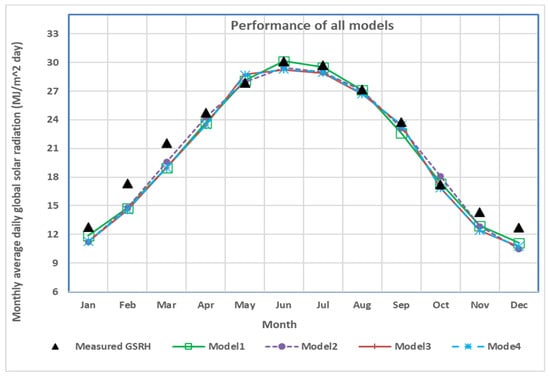
Figure 2.
Prediction of all models including the best model (Model 1) compared with the measured values (Single Year Validation dataset).
Based on the obtained results from validation dataset 1, the average data of three years, it can be concluded that the developed models (four models; Equations (1)–(4)) have good estimation for global solar radiation with excellent R2 values. Model 1, Hassan et al. [39] (Equation (1)), proved to be the most suitable model for predicting the monthly average daily global solar radiation on a horizontal surface at the study location, Arar City. The statistical errors for all models (1)–(4) are shown in Figure 3 (Three Years Validation). Table 3 illustrates the values of relative percentage errors for all the months for every model. The results show that the obtained values are within the acceptable range, ±10%; except, for winter months, it is slightly outside the range, −10.9%, −11.2% and −12.1% in Dec., Jan. and Feb., respectively. This can be explained by different weather conditions especially in winter season, such as cloud covers and rains. Moreover, it can be seen that the values of relative error in Nov. for Model 1 and Model 2 are within the range (±10%) compared with Model 3 and 4 whose values slightly exceeded the range, −3.1%, −3.2%, −10.4%, −10.2%, respectively. Based on these results, Model 1 gives the minimum errors leading to the best accuracy compared with other models.
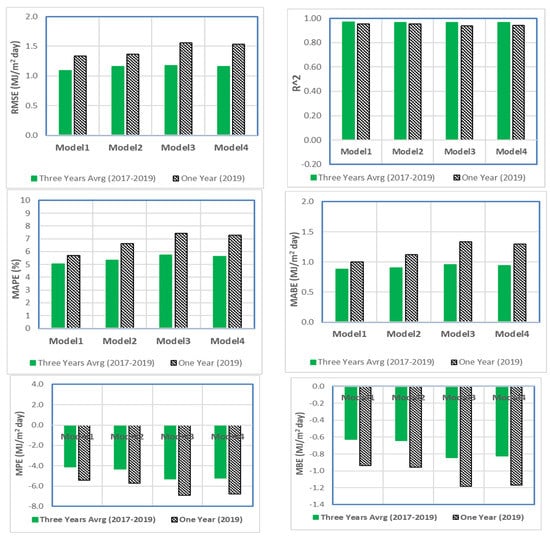
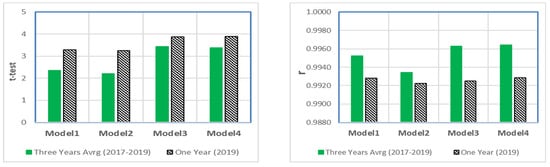
Figure 3.
Statistical indicators graphs for all models using average data of three years and one year validation.
Table 3.
Relative errors for all developed Models (1–4) at study location (Three-Years Averaged Validation dataset).
In order to investigate the effect of the time span of the validation dataset on the accuracy and performance of the models, a single year measurements data is used as a short time span validation dataset. The validation results of the multi-year averaging datasets are compared with those for the single year measurements dataset. The validation with the multi-year averaging gives an indication about general performance of the model while validation with single year data indicates the effectiveness of the model as a forecasting tool. If the accuracy of the model is not largely affected by the time span of the validation set, this proves the stability of the model predictions against time, indicating the high reliability of the model as a forecasting tool for global solar radiation.
The measured data of single year, from Jan. 2019 to Dec. 2019, is used as a short time-span validation dataset. The same procedure is used where the data are averaged to find monthly average data, and all statistical parameters are computed for all models and presented in Table 4. The obtained results showed that Model 1 also provides the most accurate estimations having the largest value of R2 (0.95466). The best model is indicated in bold as shown in Table 4.
Table 4.
Statistical indicators for the proposed Models (1–4) at study location (Single Year Validation dataset).
The results revealed that all developed models have good performance in estimating monthly average daily global solar radiation and statistical indicators for predicted values, , within the acceptable range ±10%. Model 1 displayed the best performance followed by Model 2, Model 4 and Model 3, respectively, and its statistical errors, MPE, MBE, RMSE, MAPE, MABE, t-Test, and R2 are −5.4339%, −0.9395 MJ/m2, 1.3347 MJ/m2, 5.6970%, 1.0004 MJ/m2, 3.2867, 0.9928 and 0.95466, successively. It can be noted that the performance of Model 1 (R2 = 0.95466) slightly changed compared to its performance when the average of three years data validation set is used (R2 = 0.96896), which means that it has accurate estimation for global solar radiation regardless of the time span of validation dataset. Furthermore, it is cleared that the performance of both the third and fourth models are affected, obviously compared to their performance when three years validation is used; 0.93812, 0.94004 and 0.96400, 0.96469, respectively. The models are ordered based on their performance, as seen in Table 4. Moreover, models’ performances are showed in Figure 2.
Overall, based on the revealed results from dataset 2, the one-year validation dataset, it can be assumed that the presented models (Equations (1)–(4)) also have good prediction for monthly average global solar radiation with good R2 > 0.938. Model 1, Hassan et al. [39], also showed the best performance compared with others models; therefore, it is the most proper model for evaluating the monthly-average-daily global solar radiation on a horizontal surface at the study location. The statistical indicators for all models (1–4) are clarified in Figure 3 (one-year validation). Furthermore, Table 5 shows the relative error values for all months for all models, as well as the best model (Model 1). The results indicate that the majority of the months’ values are in the range ±10%, except for some months where the range is exceeded—mostly during the winter season.
Table 5.
Relative errors for all developed Models (1–4) at study location (Single Year Averaged Validation dataset).
To study the effect of using short and long data sets on models’ performance and accuracy, the statistical indicators for all models for two validation datasets (average data of three years and average data of one year) are compared together, as appeared in Figure 3. It can be seen that the values of statistical errors are slightly increased, especially for Model 1, when one year validation dataset is used, but all errors’ values in the acceptable range except values of relative error for some months are slightly out the range. In general, almost all the statistical parameters for all models have good values and are within the acceptable range. Moreover, the performance of Model 1 has nearly inconsiderable change where it still has accurate predictions with high accuracy (R2 values between 0.9547 and 0.9689).
In order to investigate the spatial validation of the suggested model, the accuracy of Model 1, which shows the best performance compared with others models, is investigated in two other locations. The first location is Riyadh city, which is the capital of KSA, located at the center of the Kingdom (24°38′ N 46°43′ E) and south of ARAR city, having a hot desert climate with long, extremely hot summers and short, very mild winters. The ambient temperature varies between 43.6 and 9 °C, and the relative humidity varies between 10% in summer and 47% in winter. The other location is Tabuk city, located at the north west of KSA (28°23′50″ N 36°34′44″ E) and west of ARAR city, having tropical and subtropical desert climate. The ambient temperature varies between 36.1 and 1.2 °C, and the relative humidity varies between 18% in summer and 44% in winter. The long term of recorded data from January 1984 to December 2016 including daily global solar radiation and temperature are used to establish the models using regression analysis. The regression coefficients for Model 1 are calculated for Riyadh and Tabuk cities compared to those for Arar city and summarized in Table 6. The validation process is performed using an other range of metrological data from January 2017 to December 2019, which is different from the data set used for model developing and training, avoiding the probability of the overfitting for the model predictions. The model validation for different locations is performed based on the average data of three years from January 2017 to December 2019 and also based on single year data for 2019.
Table 6.
Regression coefficients for Model (1) at different locations for spatial validation.
Table 7 summarizes all statistical indicators calculated for Model 1 at different locations either for averaged three years or single year validation data sets. According to the obtained results, Model (1) gives accurate predictions with good values of different statistical indicators at different locations. The performances of Model (1) at different locations are slightly close to each other with excellent R2 higher than 0.94, indicating good fitting for both the validation datasets. Table 8 shows the values of relative percentage errors for all the months for Model (1) at different locations either for averaged three years or single year validation data sets. The results show that the values of the errors obtained at Riyadh and Tabuk cities for all months based on both the validation datasets are within the acceptable range, ±10%. These values are better than the values predicted at Arar city where some values slightly exceed the acceptable range during the winter season. In general, the obtained results show the good performance of Model 1 at different locations, which confirms the spatial validation of Model 1. These results are consistent with results predicted by Hassan et al. (2016) [50] where the accuracy of different temperature-based models including the current model is tested at different locations in Egypt. Finally, the performance of the developed models is validated and verified with other measured data for global solar radiation from different available data sources, namely the On-Site measured data and PVGIS-SARAH satellite-based data, at the same location. The On-Site Data (monthly) is available from 1 December 2014 to 1 March 2021, where 2015, 2016 and 2019 are the only years with complete data for the twelve months of the year [48].
Table 7.
Statistical indicators for the Models (1) predictions at different locations for different validation data sets.
Table 8.
Relative errors for Models (1) at different locations for different validation data sets.
The results of validation using the On-Site measured data in 2019 are presented in Table 9 and Table 10. It can be noted that all statistical indicator values are in the acceptable ranges ±10%, as seen in Table 9. Moreover, the models show good performance with slightly lower accuracy than that obtained when validated with NASA dataset (Table 4). Model 1 still has the best performance compared with the other models, R2~95%. Generally, it can be noticed that the models’ performance is marginally affected but still has good performance, especially Model 1. On the other side, the revealed values of relative errors are improved compared to those obtained when validated with NASA dataset (Table 5). For example, the relative error values for the best model (Model 1) only surpassed the preferred range in February and December as shown in Table 10, not February, March, November and December as shown in Table 5.
Table 9.
Statistical indicators for the proposed Models (1–4) at study location compared against On-Site Data in 2019.
Table 10.
Relative errors for all developed Models (1–4) at study location compared against On-Site Data in 2019.
The statistical error values for both validation data sets (On-Site Dataset and NASA Dataset) are compared together and presented in Figure 4. Models’ performance, R2, is approximately similar. The relative error values are considerably improved when On-Site Data is used. Figure 5 shows the best model’s prediction compared with the measured data from both the On-Site Data and NASA Data in 2019. The results indicate that both the On-Site Data and NASA Data are very close to each other all over the year, with overestimations of the NASA data compared to the On-Site data during only May and June. Moreover, the predictions for the best model (Model 1) are very close for both the On-Site measured data or NASA dataset, with underpredictions for February, March, November and December values.
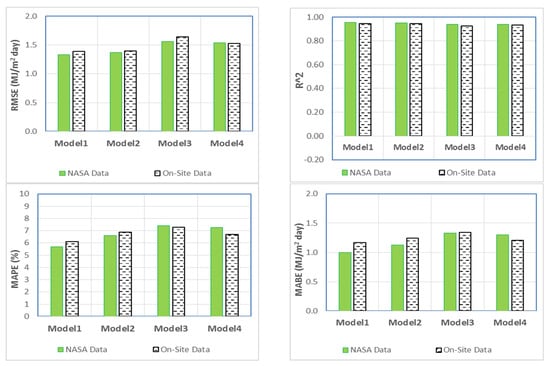
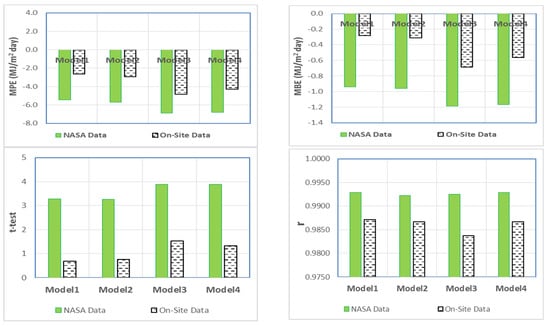
Figure 4.
Statistical indicators comparison for all developed models using different measured data of global solar radiation (On-Site Data and NASA Data) in 2019.
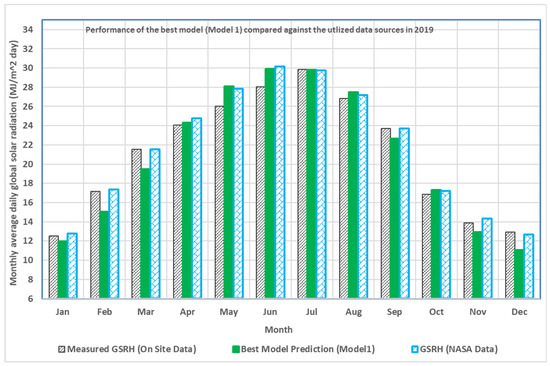
Figure 5.
Performance of the best model (Model 1) compared against the utilized data sources of the global solar radiation (On-Site Data and NASA Data) in 2019.
Comparing the values of the RMSE calculated for different models, Table 9, with those obtained by R. Urraca et al. [11] for five different nonhybrid solar radiation estimation techniques, all the models used in the current work have RMSE values less than that obtained by R. Urraca et al. for the parametric–Antonanzas method with a value of 2.68 ± 0.2. This can be explained by the fact that the models used in the current study are based on the hybrid technique between parametric, statistical and satellite data approaches which enhances their performance compared to the pure parametric method having the lowest RMSE value obtained by R. Urraca et al. [11]. Moreover, NASA satellite data for more than 30 years are used to establish the models in the current study, which enhances the performance because the satellite data-based method is found to be the most accurate nonhybrid technique by R. Urraca et al. [11]. Furthermore, Model 1 with the best performance in the current study has a RMSE value of 1.38 which is in the same range of the RMSE value of 1.49 ± 0.16 for the satellite SARAH dataset-based technique representing the best performance obtained by R. Urraca et al. [11]. These results show how the hybrid approach based on parametric, statistical and satellite data techniques can enhance the performance of the stand-alone techniques showing the ability to overcome the weaknesses of each technique, especially the parametric approach, if implemented separately.
For long-term validation with On-Site dataset, the On-Site Data for 2015 and 2016 are averaged and also used to evaluate the best model’s performance (Model 1). The obtained results showed that Model 1 has excellent performance, with minor changes compared to those for one-year On-Site validation showing R2 value also greater than 96%. Its statistical errors, MPE, MBE, RMSE, MAPE, MABE, t-Test, and R2 are −5.0411%, −0.8986 MJ/m2, 1.2232 MJ/m2, 5.5887%, 1.0439 MJ/m2, 3.5913, 0.9940 and 0.96384, respectively. All these revealed results as a validation with On-Site measurements refer that Model 1, Hassan et al. [40], can be used and employed for estimating global solar radiation on a horizontal surface with high accuracy.
In order to validate the model predictions with one of the widely used solar radiation datasets, the PVGIS-SARAH satellite-based data, which is considered the most accurate nonhybrid approach for solar radiation estimation [11], is used. Because PVGIS-SARAH solar radiation data are available only between 2005 and 2016, the available 2016 data of the global solar radiation from the On-Site measurements, NASA dataset and PVGIS-SARAH dataset are used to validate the predictions of the most accurate model (Model 1), as shown in Table 11 and Figure 6. The results show that the On-Site Data, NASA Data and PVGIS-SARAH data are relatively close to each other all over the year. Moreover, the predictions for the best mathematical model (Model 1) are relatively close with the same trend to all the available datasets, especially PVGIS-SARAH data and noticeable underpredictions specially during winter months.
Table 11.
Statistical indicators for the utilized data sources of the global solar radiation as well as the best model prediction compared against the On-Site Data in 2016.
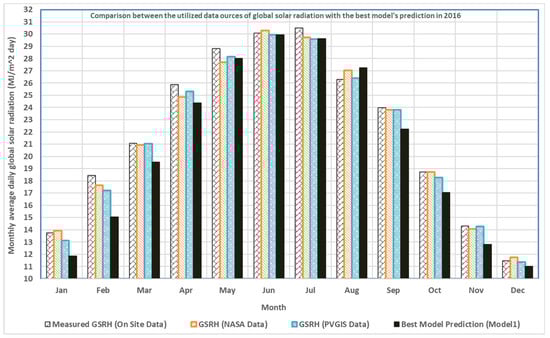
Figure 6.
Comparison between the utilized data sources of global solar radiation (On-Site Data, NASA Data and PVGIS Data) and the best model’s predictions in 2016.
Generally, it can be concluded that the proposed four models have good predictions with good R2 values larger than 0.93 and the most accurate estimation is provided by Model 1, Hassan et al. [39], with R2 > 0.95 even for single year validation datasets based on the most widely used sources of data including the NASA data, On-Site measurements and PVGIS-SARAH satellite data. This best model performs well in this new location, Arar City, KSA, with approximately different atmospheric conditions compared to those mentioned in the previous study [40]. Therefore, Model 1 can be considered the most accurate and stable temperature-based solar radiation model for estimating the monthly-average-daily global solar radiation on a horizontal surface at different locations with varies climate conditions, [40]. Moreover, the stability of the results for Model 1 regardless of the time span of the validation datasets proves its reliability as a forecasting tool to predict the global solar radiation, providing valuable information for engineers and designers during design and evaluation for future projects. Furthermore, this model can be established for different locations around the world using the same methodology to calculate regression coefficients based on the available NASA satellite dataset for more than 35 years for the required location. The regression coefficients can also be annually recalculated according to the recent measured satellite data provided by NASA dataset to update the model with the highest possible accuracy as a forecasting too
5. Conclusions
Using more than 35 years of measured data for daily global solar radiation and ambient temperatures for the study location, Arar City, KSA, the performance of four temperature-based global solar radiation empirical models is evaluated for estimating the monthly-average-daily global solar radiation on a horizontal surface. Two validation datasets with different time spans, namely the multi-year averaging and single year measurements, are used to validate and evaluate the performance of the models and investigate the effectiveness of the models as forecasting tools. According to the obtained results, all developed models in this study performed well in predicting monthly average daily global solar radiation on horizontal surface. Model 1, which is based on extraterrestrial radiation and ambient temperature, provides the most accurate estimations with the highest accuracy and excellent values for statistical indicators compared with those for other models. Unlike the other three models, Model 1 gives the largest coefficient of determination values, showing the best performance for both the three-year averaging and single year measurements validation datasets. This high accuracy and stable performance for Model 1 without a noticeable effect due to the time span of the validation datasets, especially for the single year validation, indicates the high reliability and effectiveness of the model as a forecasting tool for global solar radiation. The spatial validation for Model 1 is also investigated on other two locations, Riyadh and Tabuk, and the results confirm the applicability of the model on other locations with high model performance. Moreover, this temperature-based model is validated against different sources of widely-used solar radiation datasets, namely NASA data, On-Site measurements and PVGIS-SARAH satellite data showing high accuracy of predictions with a simplicity of implementation depending on the most available meteorological data. This model which is based on a hybrid technique between parametric, statistical and satellite data approaches shows the ability to overcome the weaknesses of each approach if implemented separately. Simplicity of implementation; dependence on the temperature, which is the most available meteorological data; long period historical satellite data (35 years) to develop the model; and showing high accurate predictions compared with the most widely-used solar radiation datasets are the main strengths of this hybrid approach. Consequently, this reliable hybrid model can be used as a forecasting assistant tool providing valuable information for engineers and designers in the feasibility evaluation for different solar-energy-based future projects, satisfying different sustainable Development Goals (SDGs) for different promising regions around the world.
Author Contributions
Conceptualization, N.G. and G.E.H.; methodology, G.E.H. and A.A.E.-B.; software, N.B. and A.A.E.-B.; validation, N.G., N.B., M.M.E. and G.E.H.; formal analysis, G.E.H. and N.G.; investigation, G.E.H. and N.G.; resources, A.B. and Y.A.; data curation, Y.A., M.M.E. and A.B.; writing—original draft preparation, G.E.H. and N.G.; writing—review and editing, A.B. and A.A.E.-B.; visualization, Y.A. and M.M.E.; supervision, G.E.H. and A.A.E.-B.; project administration, N.G. and G.E.H.; funding acquisition, N.G. and Y.A. All authors have read and agreed to the published version of the manuscript.
Funding
This research is funded by Deputyship for Research & Innovation, Ministry of Education in Saudi Arabia, grant/project number 503.
Institutional Review Board Statement
Not applicable.
Informed Consent Statement
Not applicable.
Data Availability Statement
All the data generated or analyzed is contained in this article.
Acknowledgments
The authors extend their appreciation to the Deputy of Research & Innovation, Ministry of Education in Saudi Arabia for funding this research work through the project number RDO-503.
Conflicts of Interest
The authors declare no conflict of interest. The funders had no role in the design of the study; in the collection, analyses, or interpretation of data; in the writing of the manuscript, or in the decision to publish the results.
References
- Karaman, Ö.A.; Tanyıldızı Ağır, T.; Arsel, İ. Estimation of solar radiation using modern methods. Alex. Eng. J. 2021, 60, 2447–2455. [Google Scholar] [CrossRef]
- Ellabban, O.; Abu-Rub, H.; Blaabjerg, F. Renewable energy resources: Current status, future prospects and their enabling technology. Renew. Sustain. Energy Rev. 2014, 39, 748–764. [Google Scholar] [CrossRef]
- Hassan, G.E.; Ali, M.A.; Yousef, M.E. Solar Energy Availability in Suez Canal’s Zone—Case study: Port Said and Suez cities, Egypt. In Proceedings of the the International Maritime Transport and Logistics Conference, Alexandria, Egypt, 19–21 March 2017. [Google Scholar]
- Mirzabe, A.H.; Hajiahmad, A.; Keyhani, A. Assessment and categorization of empirical models for estimating monthly, daily, and hourly diffuse solar radiation: A case study of Iran. Sustain. Energy Technol. Assess. 2021, 47, 101330. [Google Scholar] [CrossRef]
- ul Rehman Tahir, Z.; Hafeez, S.; Asim, M.; Amjad, M.; Farooq, M.; Azhar, M.; Amjad, G.M. Estimation of daily diffuse solar radiation from clearness index, sunshine duration and meteorological parameters for different climatic conditions. Sustain. Energy Technol. Assess. 2021, 47, 101544. [Google Scholar]
- Tao, H.; Ewees, A.A.; Al-Sulttani, A.O.; Beyaztas, U.; Hameed, M.M.; Salih, S.Q.; Armanuos, A.M.; Al-Ansari, N.; Voyant, C.; Shahid, S.; et al. Global solar radiation prediction over North Dakota using air temperature: Development of novel hybrid intelligence model. Energy Rep. 2020, 7, 136–157. [Google Scholar] [CrossRef]
- Feng, Y.; Gong, D.; Zhang, Q.; Jiang, S.; Zhao, L.; Cui, N. Evaluation of temperature-based machine learning and empirical models for predicting daily global solar radiation. Energy Convers. Manag. 2019, 198, 111780. [Google Scholar] [CrossRef]
- Ouali, K.; Alkama, R. A New Model of Global Solar Radiation based on Meteorological Data in Bejaia City (Algeria). Energy Procedia 2014, 50, 670–676. [Google Scholar] [CrossRef] [Green Version]
- Hassan, G.E.; Ali, M.A. Performance Evaluation of Artificial Neural Networks in Estimating Global Solar Radiation, Case Study: New Borg El-arab City, Egypt. Int. J. Environ. Sci. Sustain. Dev. 2017, 2, 1–8. [Google Scholar] [CrossRef]
- Khorasanizadeh, H.; Sepehrnia, M. Solar exergy evaluation and empirical model establishment; case study: Iran. Heliyon 2020, 6, e05638. [Google Scholar] [CrossRef] [PubMed]
- Li, M.-F.; Guo, P.-T.; Dai, S.; Luo, H.; Liu, E.; Li, Y. Empirical estimation of daily global solar radiation with contrasting seasons of rain and drought characterize over tropical China. J. Clean. Prod. 2020, 266, 121915. [Google Scholar] [CrossRef]
- Feng, Y.; Gong, D.; Jiang, S.; Zhao, L.; Cui, N. National-scale development and calibration of empirical models for predicting daily global solar radiation in China. Energy Convers. Manag. 2020, 203, 112236. [Google Scholar] [CrossRef]
- Hai, T.; Sharafati, A.; Mohammed, A.; Salih, S.Q.; Deo, R.C.; Al-Ansari, N.; Yaseen, Z.M. Global Solar Radiation Estimation and Climatic Variability Analysis Using Extreme Learning Machine Based Predictive Model. IEEE Access 2020, 8, 12026–12042. [Google Scholar] [CrossRef]
- Bounoua, Z.; Ouazzani, C.L.; Mechaqrane, A. Estimation of daily global solar radiation using empirical and ma-chine-learning methods: A case study of five Moroccan locations. Sustain. Mater. Technol. 2021, 28, e00261. [Google Scholar]
- Li, D.H.; Lou, S.; Lam, J.C. An Analysis of Global, Direct and Diffuse Solar Radiation. Energy Procedia 2015, 75, 388–393. [Google Scholar] [CrossRef] [Green Version]
- Urraca, R.; Martinez-De-Pison, E.; Sanz-García, A.; Antonanzas, J.; Antonanzas-Torres, F. Estimation methods for global solar radiation: Case study evaluation of five different approaches in central Spain. Renew. Sustain. Energy Rev. 2017, 77, 1098–1113. [Google Scholar] [CrossRef]
- Almorox, J.; Voyant, C.; Bailek, N.; Kuriqi, A.; Arnaldo, J. Total solar irradiance’s effect on the performance of empirical models for estimating global solar radiation: An empirical-based review. Energy 2021, 236, 121486. [Google Scholar] [CrossRef]
- Chang, K.; Zhang, Q. Development of a solar radiation model considering the hourly sunshine duration for all-sky conditions—A case study for Beijing, China. Atmos. Environ. 2020, 234, 117617. [Google Scholar] [CrossRef]
- Ahmed, M.; Mahmood, A.N.; Hu, J. A survey of network anomaly detection techniques. J. Netw. Comput. Appl. 2016, 60, 19–31. [Google Scholar] [CrossRef]
- Guijo-Rubio, D.; Durán-Rosal, A.; Gutiérrez, P.; Gómez-Orellana, A.; Casanova-Mateo, C.; Sanz-Justo, J.; Salcedo-Sanz, S.; Hervás-Martínez, C. Evolutionary artificial neural networks for accurate solar radiation prediction. Energy 2020, 210, 118374. [Google Scholar] [CrossRef]
- Ahmad, T.; Chen, H. A review on machine learning forecasting growth trends and their real-time applications in different energy systems. Sustain. Cities Soc. 2020, 54, 102010. [Google Scholar] [CrossRef]
- Qazi, A.; Fayaz, H.; Wadi, A.; Raj, R.G.; Rahim, N.; Khan, W.A. The artificial neural network for solar radiation prediction and designing solar systems: A systematic literature review. J. Clean. Prod. 2015, 104, 1–12. [Google Scholar] [CrossRef]
- Hassan, G.E.; Youssef, M.E.; Ali, M.A.; Mohamed, Z.E.; Shehata, A.I. Performance assessment of different day-of-the-year-based models for estimating global solar radiation—Case study: Egypt. J. Atmos. Sol.-Terr. Phys. 2016, 149, 69–80. [Google Scholar] [CrossRef]
- Tadros, M.T.Y.; Mustafa, M.A.M. Estimation of the Global Horizontal Solar Radiation in Iraq. Int. J. Emerg. Technol. Adv. Eng. 2014, 4, 587–605. [Google Scholar]
- Fan, J.; Chen, B.; Wu, L.; Zhang, F.; Lu, X.; Xiang, Y. Evaluation and development of temperature-based empirical models for estimating daily global solar radiation in humid regions. Energy 2018, 144, 903–914. [Google Scholar] [CrossRef]
- Mousavi, S.M.; Mostafavi, E.S.; Jaafari, A.; Jaafari, A.; Hosseinpour, F. Using measured daily meteorological parameters to predict daily solar radiation. Measurement 2015, 76, 148–155. [Google Scholar] [CrossRef]
- Khalil, S.A.; Shaffie, A.M. Performance of Statistical Comparison Models of Solar Energy on Horizontal and Inclined Surface. Int. J. Energy Power 2013, 2, 8–25. [Google Scholar]
- Youssef, M.E.; Hassan, G.E.; Mohamed, Z.E.; Ali, M.A. Investigating the performance of different models in estimating global solar radiation. Adv. Nat. Appl. Sci. 2016, 10, 379–389. [Google Scholar]
- Angstrom, A. Solar and terrestrial radiation. Report to the international commission for solar research on actinometric investigations of solar and atmospheric radiation. Q. J. R. Meteorol. Soc. 1924, 50, 121–126. [Google Scholar] [CrossRef]
- Prescott, J.A. Evaporation from water surface in relation to solar radiation. Trans. R. Soc. Aust. 1940, 46, 114–118. [Google Scholar]
- El-Sebaii, A.; Al-Hazmi, F.; Al-Ghamdi, A.; Yaghmour, S. Global, direct and diffuse solar radiation on horizontal and tilted surfaces in Jeddah, Saudi Arabia. Appl. Energy 2010, 87, 568–576. [Google Scholar] [CrossRef]
- El-Sebaii, A.; Trabea, A. Estimation of Global Solar Radiation on Horizontal Surfaces Over Egypt. Egypt. J. Solids 2005, 28, 163–175. [Google Scholar]
- Besharat, F.; Dehghan, A.A.; Faghih, A.R. Empirical models for estimating global solar radiation: A review and case study. Renew. Sustain. Energy Rev. 2013, 21, 798–821. [Google Scholar] [CrossRef]
- Ajayi, O.; Ohijeagbon, O.; Nwadialo, C.; Olasope, O. New model to estimate daily global solar radiation over Nigeria. Sustain. Energy Technol. Assess. 2014, 5, 28–36. [Google Scholar] [CrossRef]
- Khalil, S.A.; Shaffie, A. A comparative study of total, direct and diffuse solar irradiance by using different models on horizontal and inclined surfaces for Cairo, Egypt. Renew. Sustain. Energy Rev. 2013, 27, 853–863. [Google Scholar] [CrossRef]
- El-Metwally, M. Simple new methods to estimate global solar radiation based on meteorological data in Egypt. Atmos. Res. 2004, 69, 217–239. [Google Scholar] [CrossRef]
- Supit, I.; Van Kappel, R.R. A simple method to estimate global radiation. Sol. Energy 1998, 63, 147–160. [Google Scholar] [CrossRef]
- Mecibah, M.S.; Boukelia, T.E.; Tahtah, R.; Gairaa, K. Introducing the best model for estimation the monthly mean daily global solar radiation on a horizontal surface (Case study: Algeria). Renew. Sustain. Energy Rev. 2014, 36, 194–202. [Google Scholar] [CrossRef]
- Khorasanizadeh, H.; Mohammadi, K. Introducing the best model for predicting the monthly mean global solar radiation over six major cities of Iran. Energy 2013, 51, 257–266. [Google Scholar] [CrossRef]
- Al-Mostafa, Z.; Maghrabi, A.; Al-Shehri, S. Sunshine-based global radiation models: A review and case study. Energy Convers. Manag. 2014, 84, 209–216. [Google Scholar] [CrossRef]
- Makade, R.G.; Chakrabarti, S.; Jamil, B. Development of global solar radiation models: A comprehensive review and sta-tistical analysis for Indian regions. J. Clean. Prod. 2021, 293, 126208. [Google Scholar] [CrossRef]
- Saud, S.; Jamil, B.; Upadhyay, Y.; Irshad, K. Performance improvement of empirical models for estimation of global solar radiation in India: A k-fold cross-validation approach. Sustain. Energy Technol. Assess. 2020, 40, 100768. [Google Scholar] [CrossRef]
- Naserpour, S.; Zolfaghari, H.; Firouzabadi, P.Z. Calibration and evaluation of sunshine-based empirical models for estimating daily solar radiation in Iran. Sustain. Energy Technol. Assess. 2020, 42, 100855. [Google Scholar] [CrossRef]
- Li, H.; Cao, F.; Wang, X.; Ma, W. A Temperature-Based Model for Estimating Monthly Average Daily Global Solar Radiation in China. Sci. World J. 2014, 2014, 128754. [Google Scholar] [CrossRef] [PubMed] [Green Version]
- Yacef, R.; Mellit, A.; Belaid, S.; Şen, Z. New combined models for estimating daily global solar radiation from measured air temperature in semi-arid climates: Application in Ghardaïa, Algeria. Energy Convers. Manag. 2014, 79, 606–615. [Google Scholar] [CrossRef]
- El-Metwally, M. Sunshine and global solar radiation estimation at different sites in Egypt. J. Atmos. Sol.-Terr. Phys. 2005, 67, 1331–1342. [Google Scholar] [CrossRef]
- Kumar, R.; Aggarwal, R.; Sharma, J. Comparison of regression and artificial neural network models for estimation of global solar radiations. Renew. Sustain. Energy Rev. 2015, 52, 1294–1299. [Google Scholar] [CrossRef]
- Hargreaves, G.H.; Samani, Z.A. Estimating Potential Evapotranspiration. J. Irrig. Drain. Div. 1982, 108, 225–230. [Google Scholar] [CrossRef]
- Annandale, J.; Jovanovic, N.; Benadé, N.; Allen, R. Software for missing data error analysis of Penman-Monteith reference evapotranspiration. Irrig. Sci. 2002, 21, 57–67. [Google Scholar]
- Hassan, G.E.; Youssef, M.E.; Mohamed, Z.E.; Ali, M.A.; Hanafy, A.A. New Temperature-based Models for Predicting Global Solar Radiation. Appl. Energy 2016, 179, 437–450. [Google Scholar] [CrossRef]
- Chen, J.-L.; Li, G.-S.; Xiao, B.-B.; Wen, Z.-F.; Lv, M.-Q.; Chen, C.; Jiang, Y.; Wang, X.-X.; Wu, S.-J. Assessing the transferability of support vector machine model for estimation of global solar radiation from air temperature. Energy Convers. Manag. 2015, 89, 318–329. [Google Scholar] [CrossRef]
- Manzano, A.; Martín, M.; Valero, F.; Armenta-Deu, C. A single method to estimate the daily global solar radiation from monthly data. Atmos. Res. 2015, 166, 70–82. [Google Scholar] [CrossRef]
- Korachagaon, I.; Bapat, V.N. General formula for the estimation of global solar radiation on earth’s surface around the globe. Renew Energy 2012, 41, 394–400. [Google Scholar] [CrossRef]
- Ayodele, T.; Ogunjuyigbe, A. Prediction of monthly average global solar radiation based on statistical distribution of clearness index. Energy 2015, 90, 1733–1742. [Google Scholar] [CrossRef]
- Camacho, E.; Berenguel, M.; Rubio, F.; Martínez, D. Solar Energy Fundamentals. Control of Solar Energy Systems; Springer: Berlin/Heidelberg, Germany, 2012; Chapter 1; pp. 1–23. [Google Scholar]
- Kalogirou, S. Environmental Characteristics. Control of Solar Energy Systems, 1st ed.; Elsevier, Inc.: Philadelphia, PA, USA, 2009; Chapter 2; pp. 49–120. [Google Scholar]
- Hassan, G.; Youssef, E.; Ali, M.; Mohamed, Z.; Hanafy, A. Evaluation of different sunshine-based models for predicting global solar radiation—Case study: New Borg El-Arab city, Egypt. Therm. Sci. 2018, 22, 979–992. [Google Scholar] [CrossRef]
- Renewable Resource Atlas, King Abdullah City for Atomic and Renewable Energy (K.A.CARE), Saudi Arabia. Available online: https://rratlas.kacare.gov.sa (accessed on 15 September 2021).
- Fan, J.; Wu, L.; Zhang, F.; Cai, H.; Zeng, W.; Wang, X.; Zou, H. Empirical and machine learning models for predicting daily global solar radiation from sunshine duration: A review and case study in China. Renew. Sustain. Energy Rev. 2019, 100, 186–212. [Google Scholar] [CrossRef]
Publisher’s Note: MDPI stays neutral with regard to jurisdictional claims in published maps and institutional affiliations. |
© 2021 by the authors. Licensee MDPI, Basel, Switzerland. This article is an open access article distributed under the terms and conditions of the Creative Commons Attribution (CC BY) license (https://creativecommons.org/licenses/by/4.0/).