
Geo-Locating and Identifying Wrong-Way Driving Entrance Points in Bexar County Highways by Implementing Mathematical Modeling and Land-Use Impact Assessment


Abstract
:1. Introduction
2. Literature Review
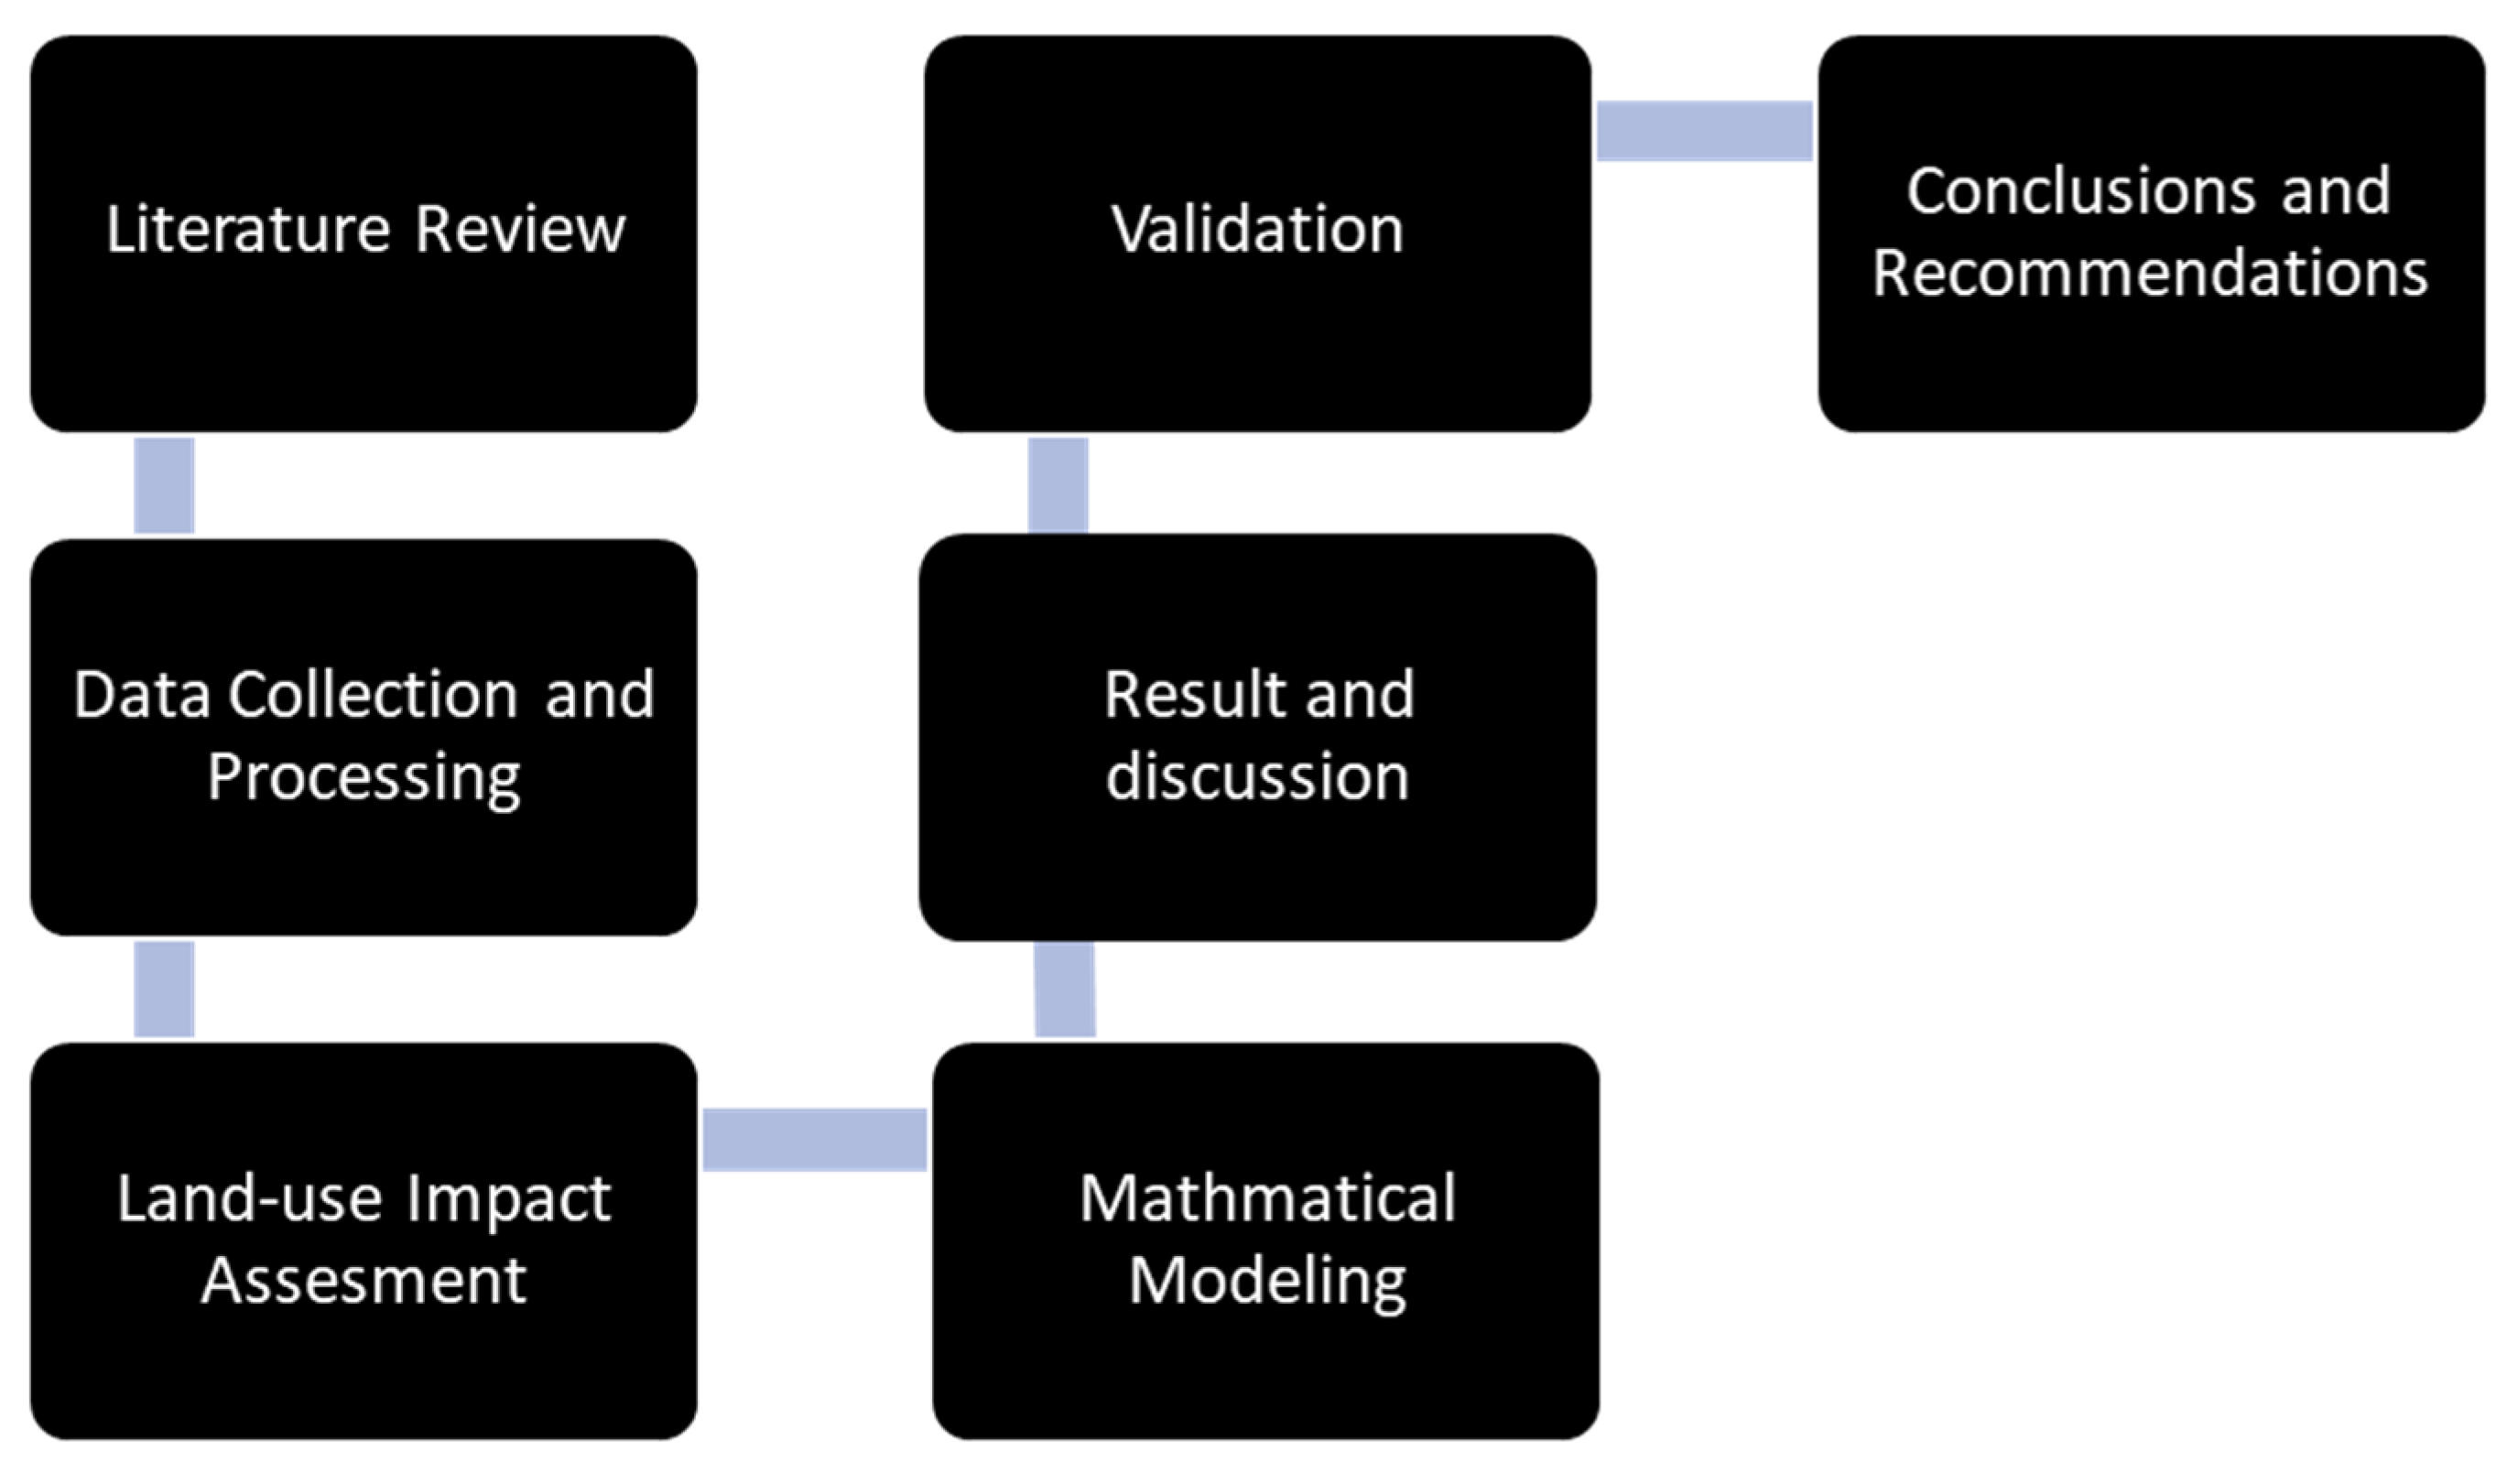
3. Methodology
3.1. Data Collection and Processing
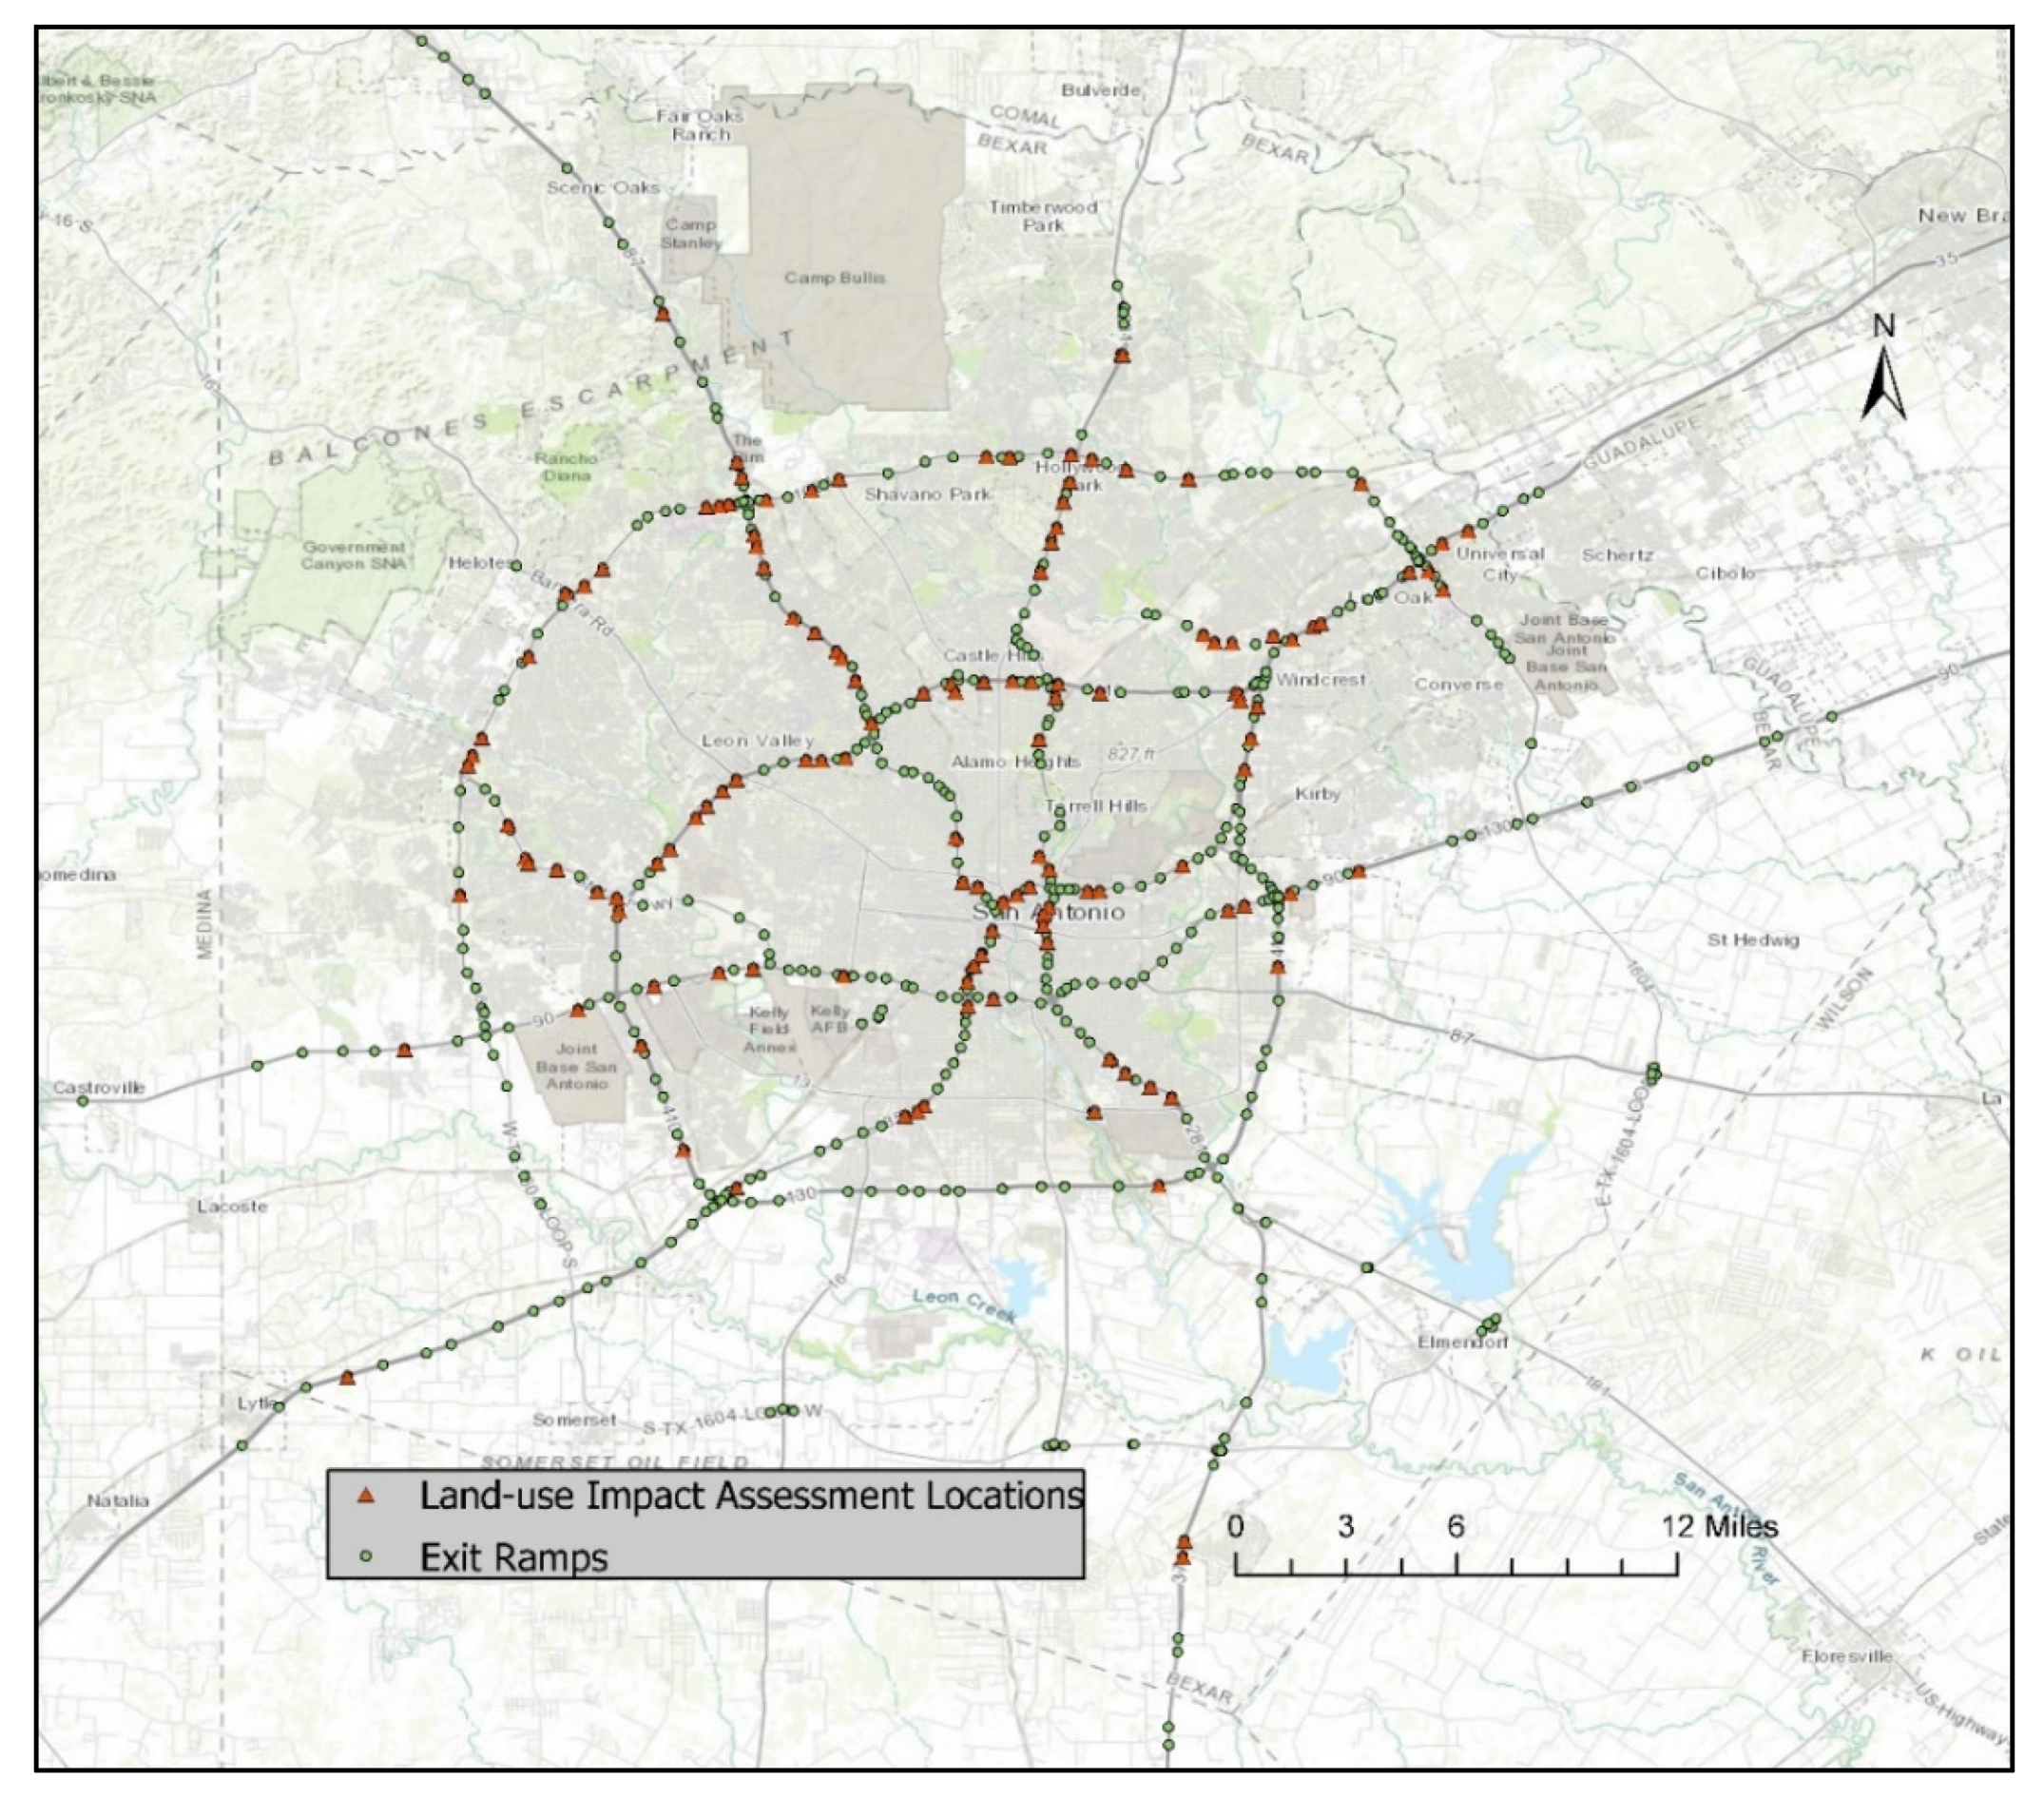
3.2. Land-Use Impact Assessment
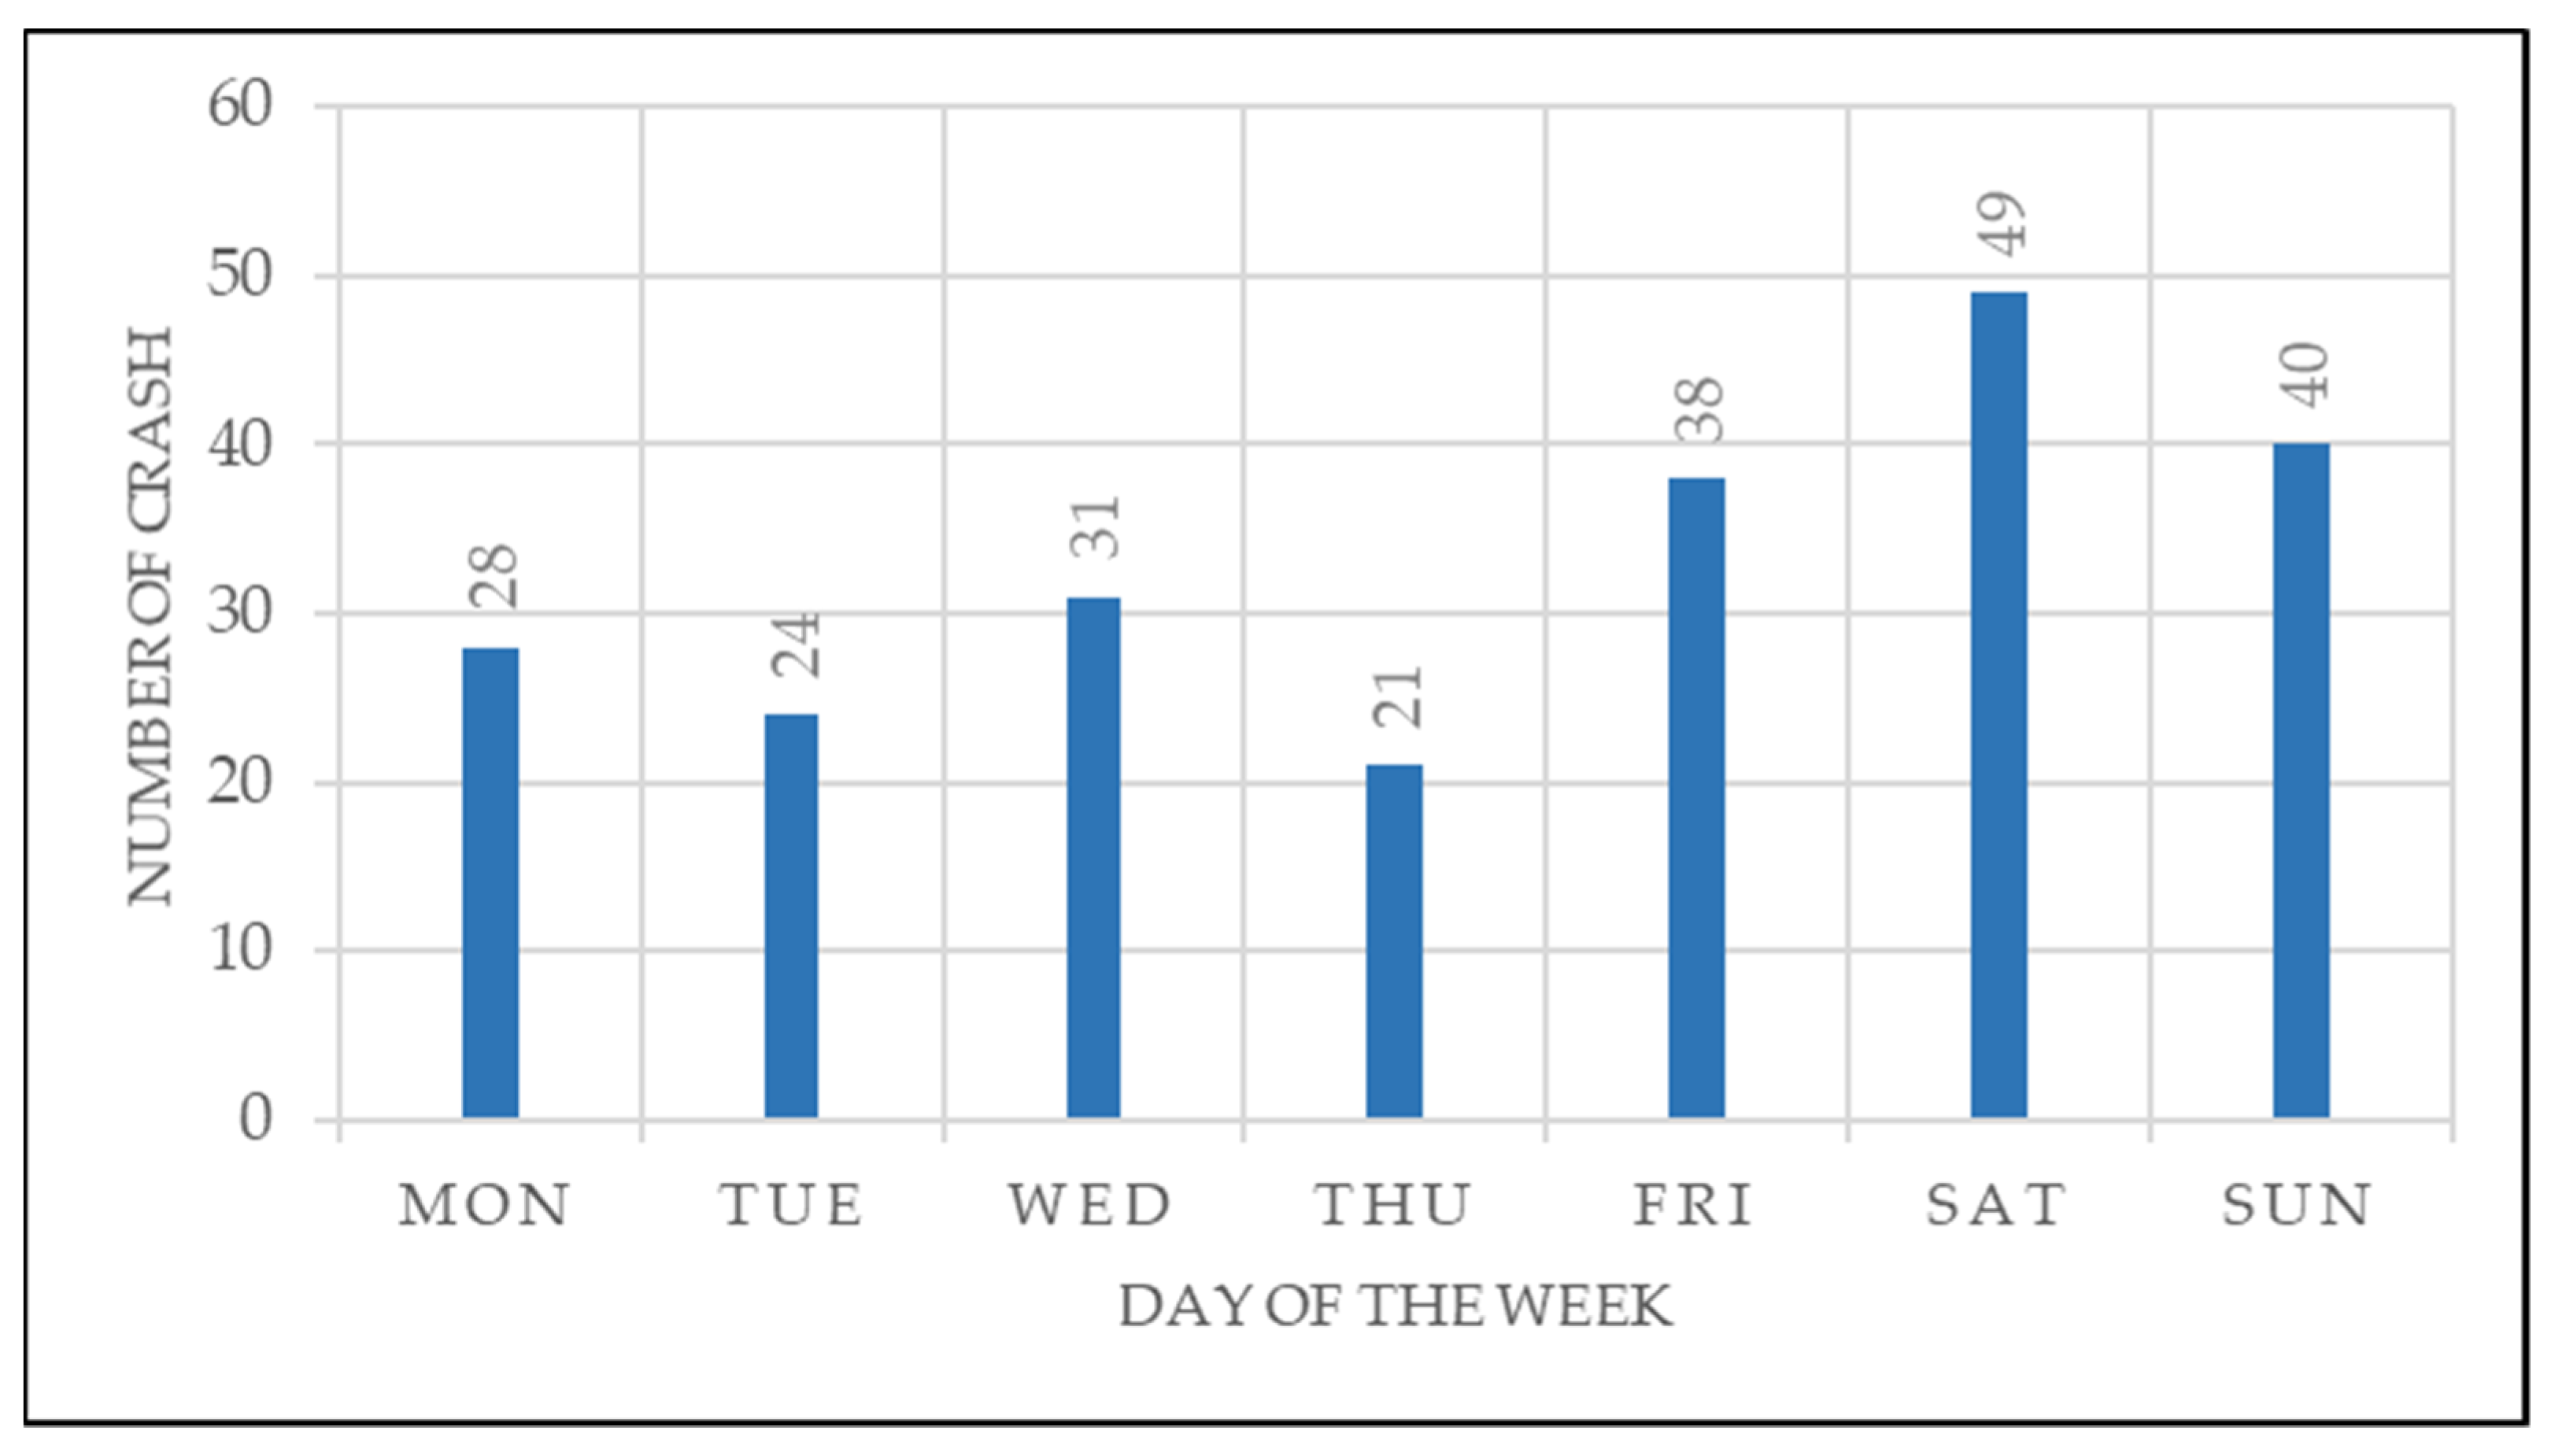
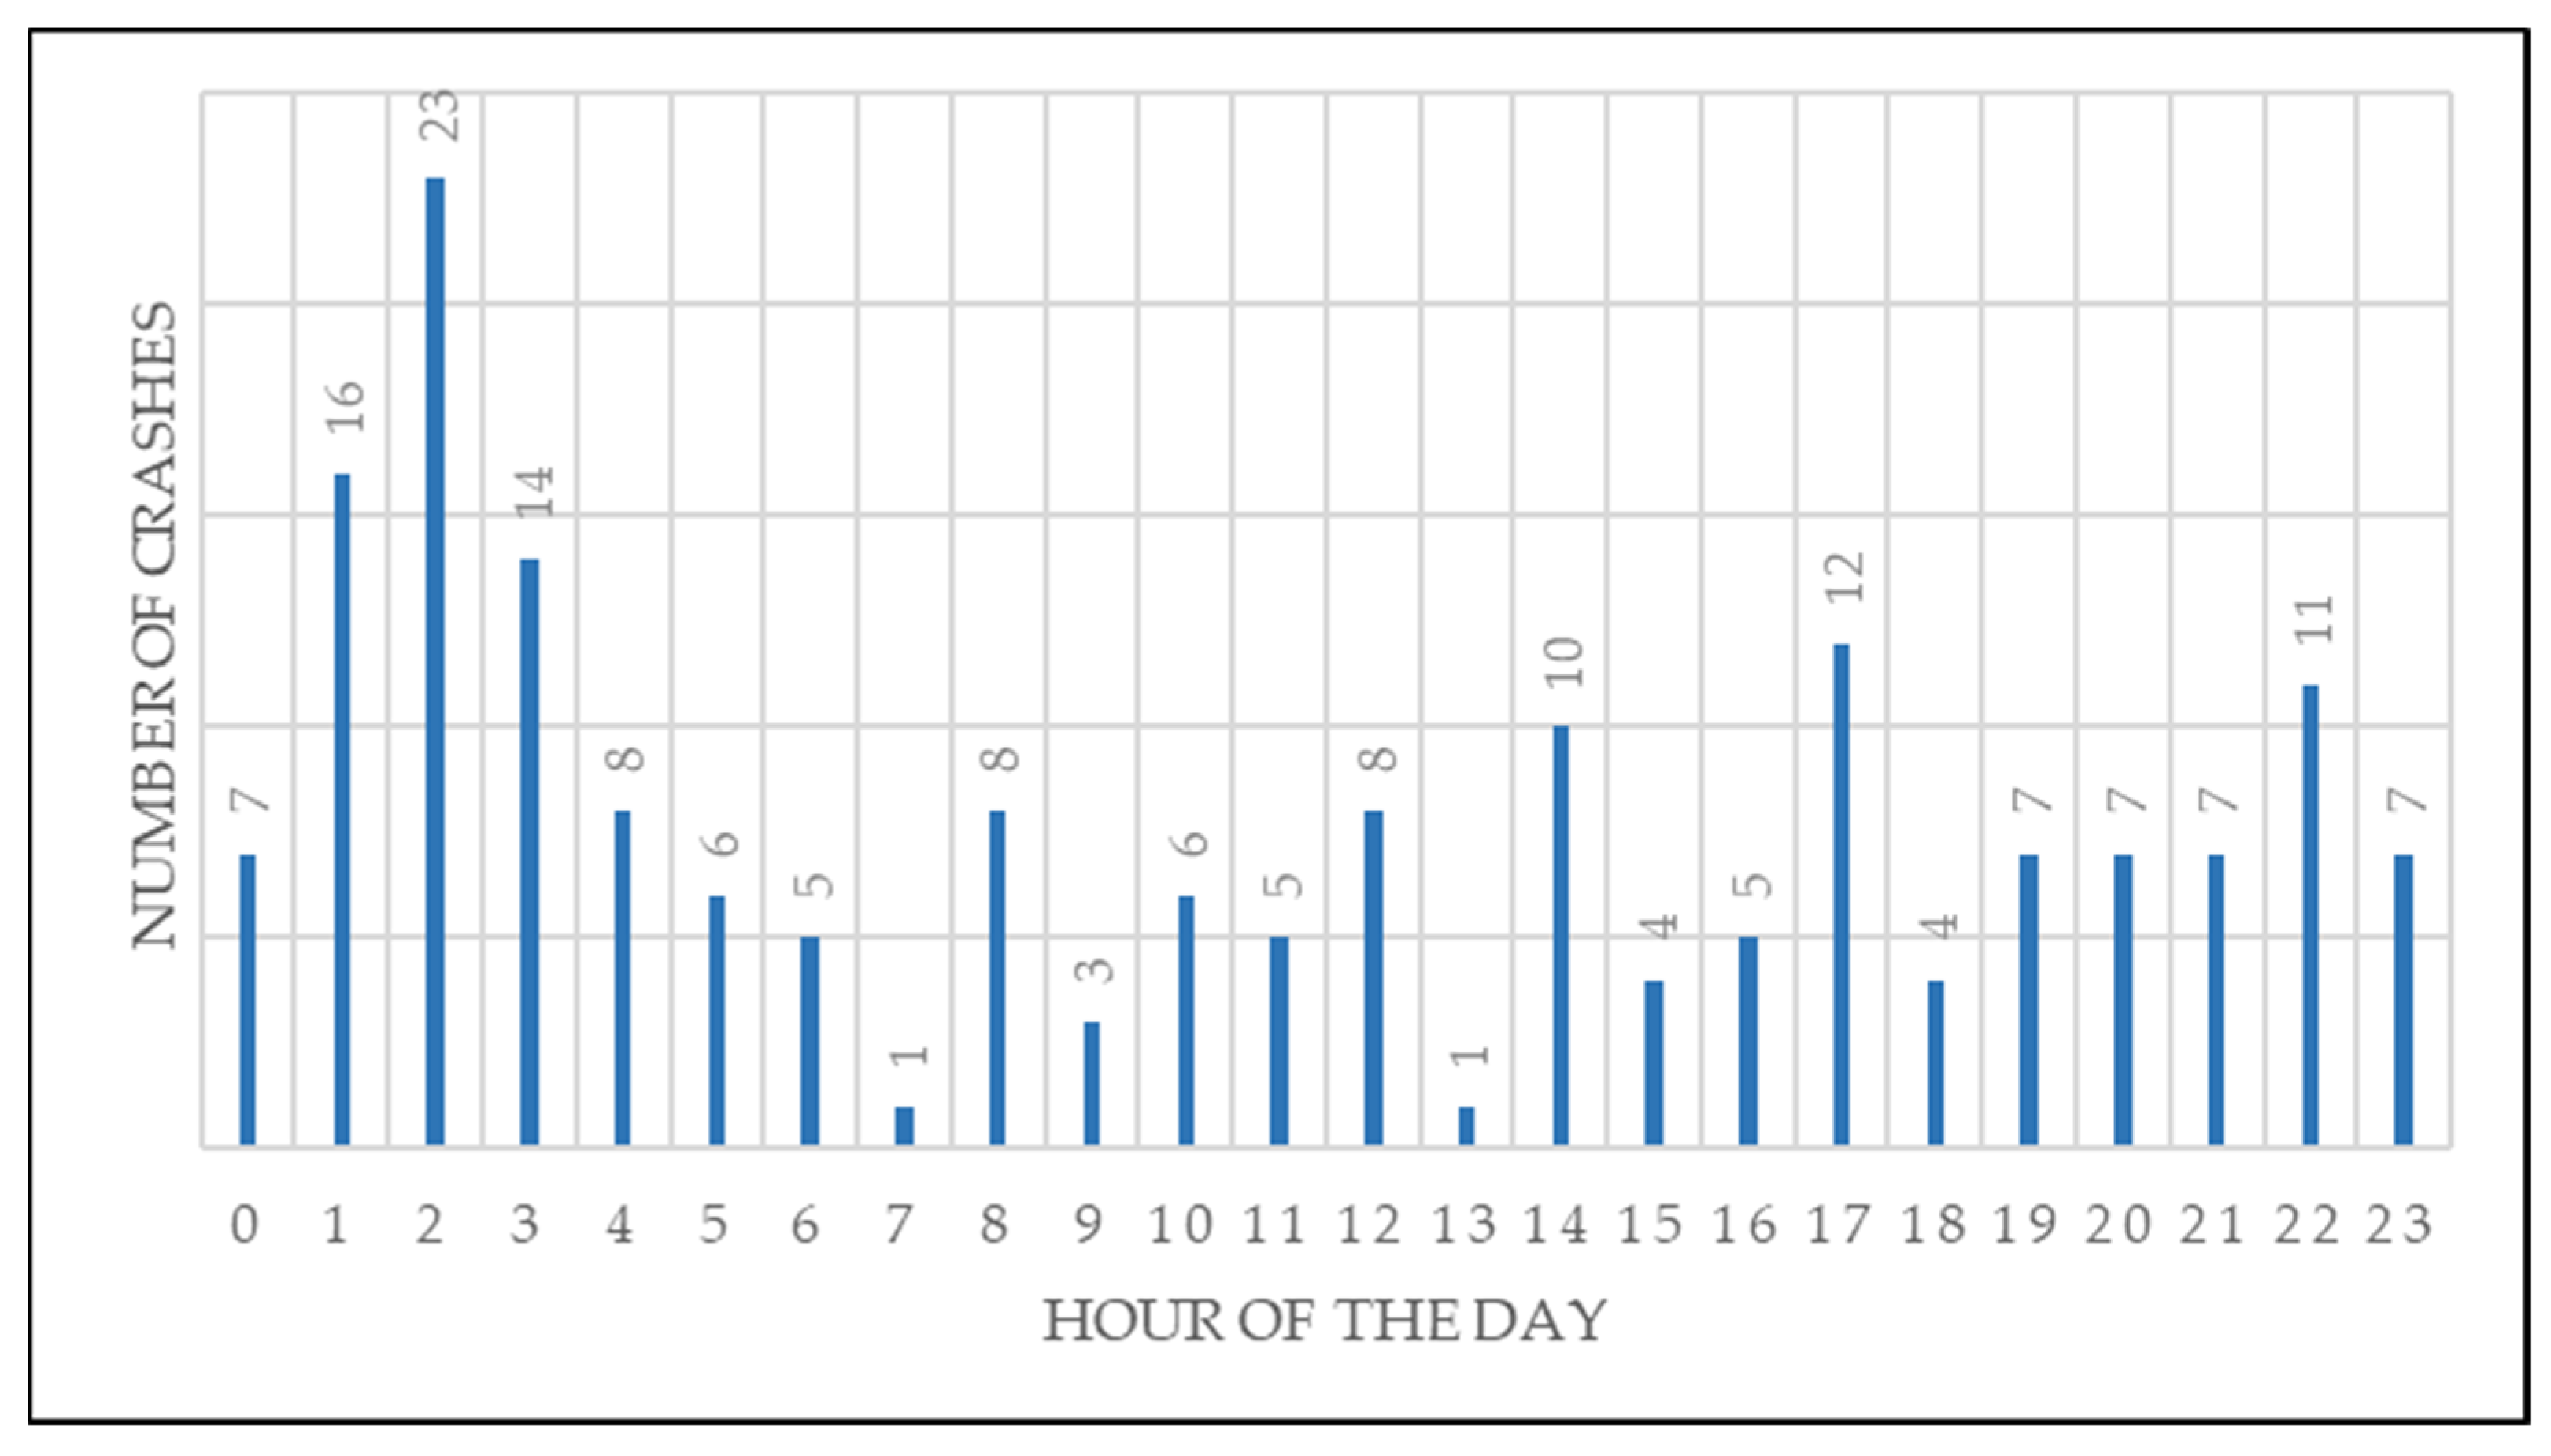
3.3. 911 Calls and Crash Data Analysis
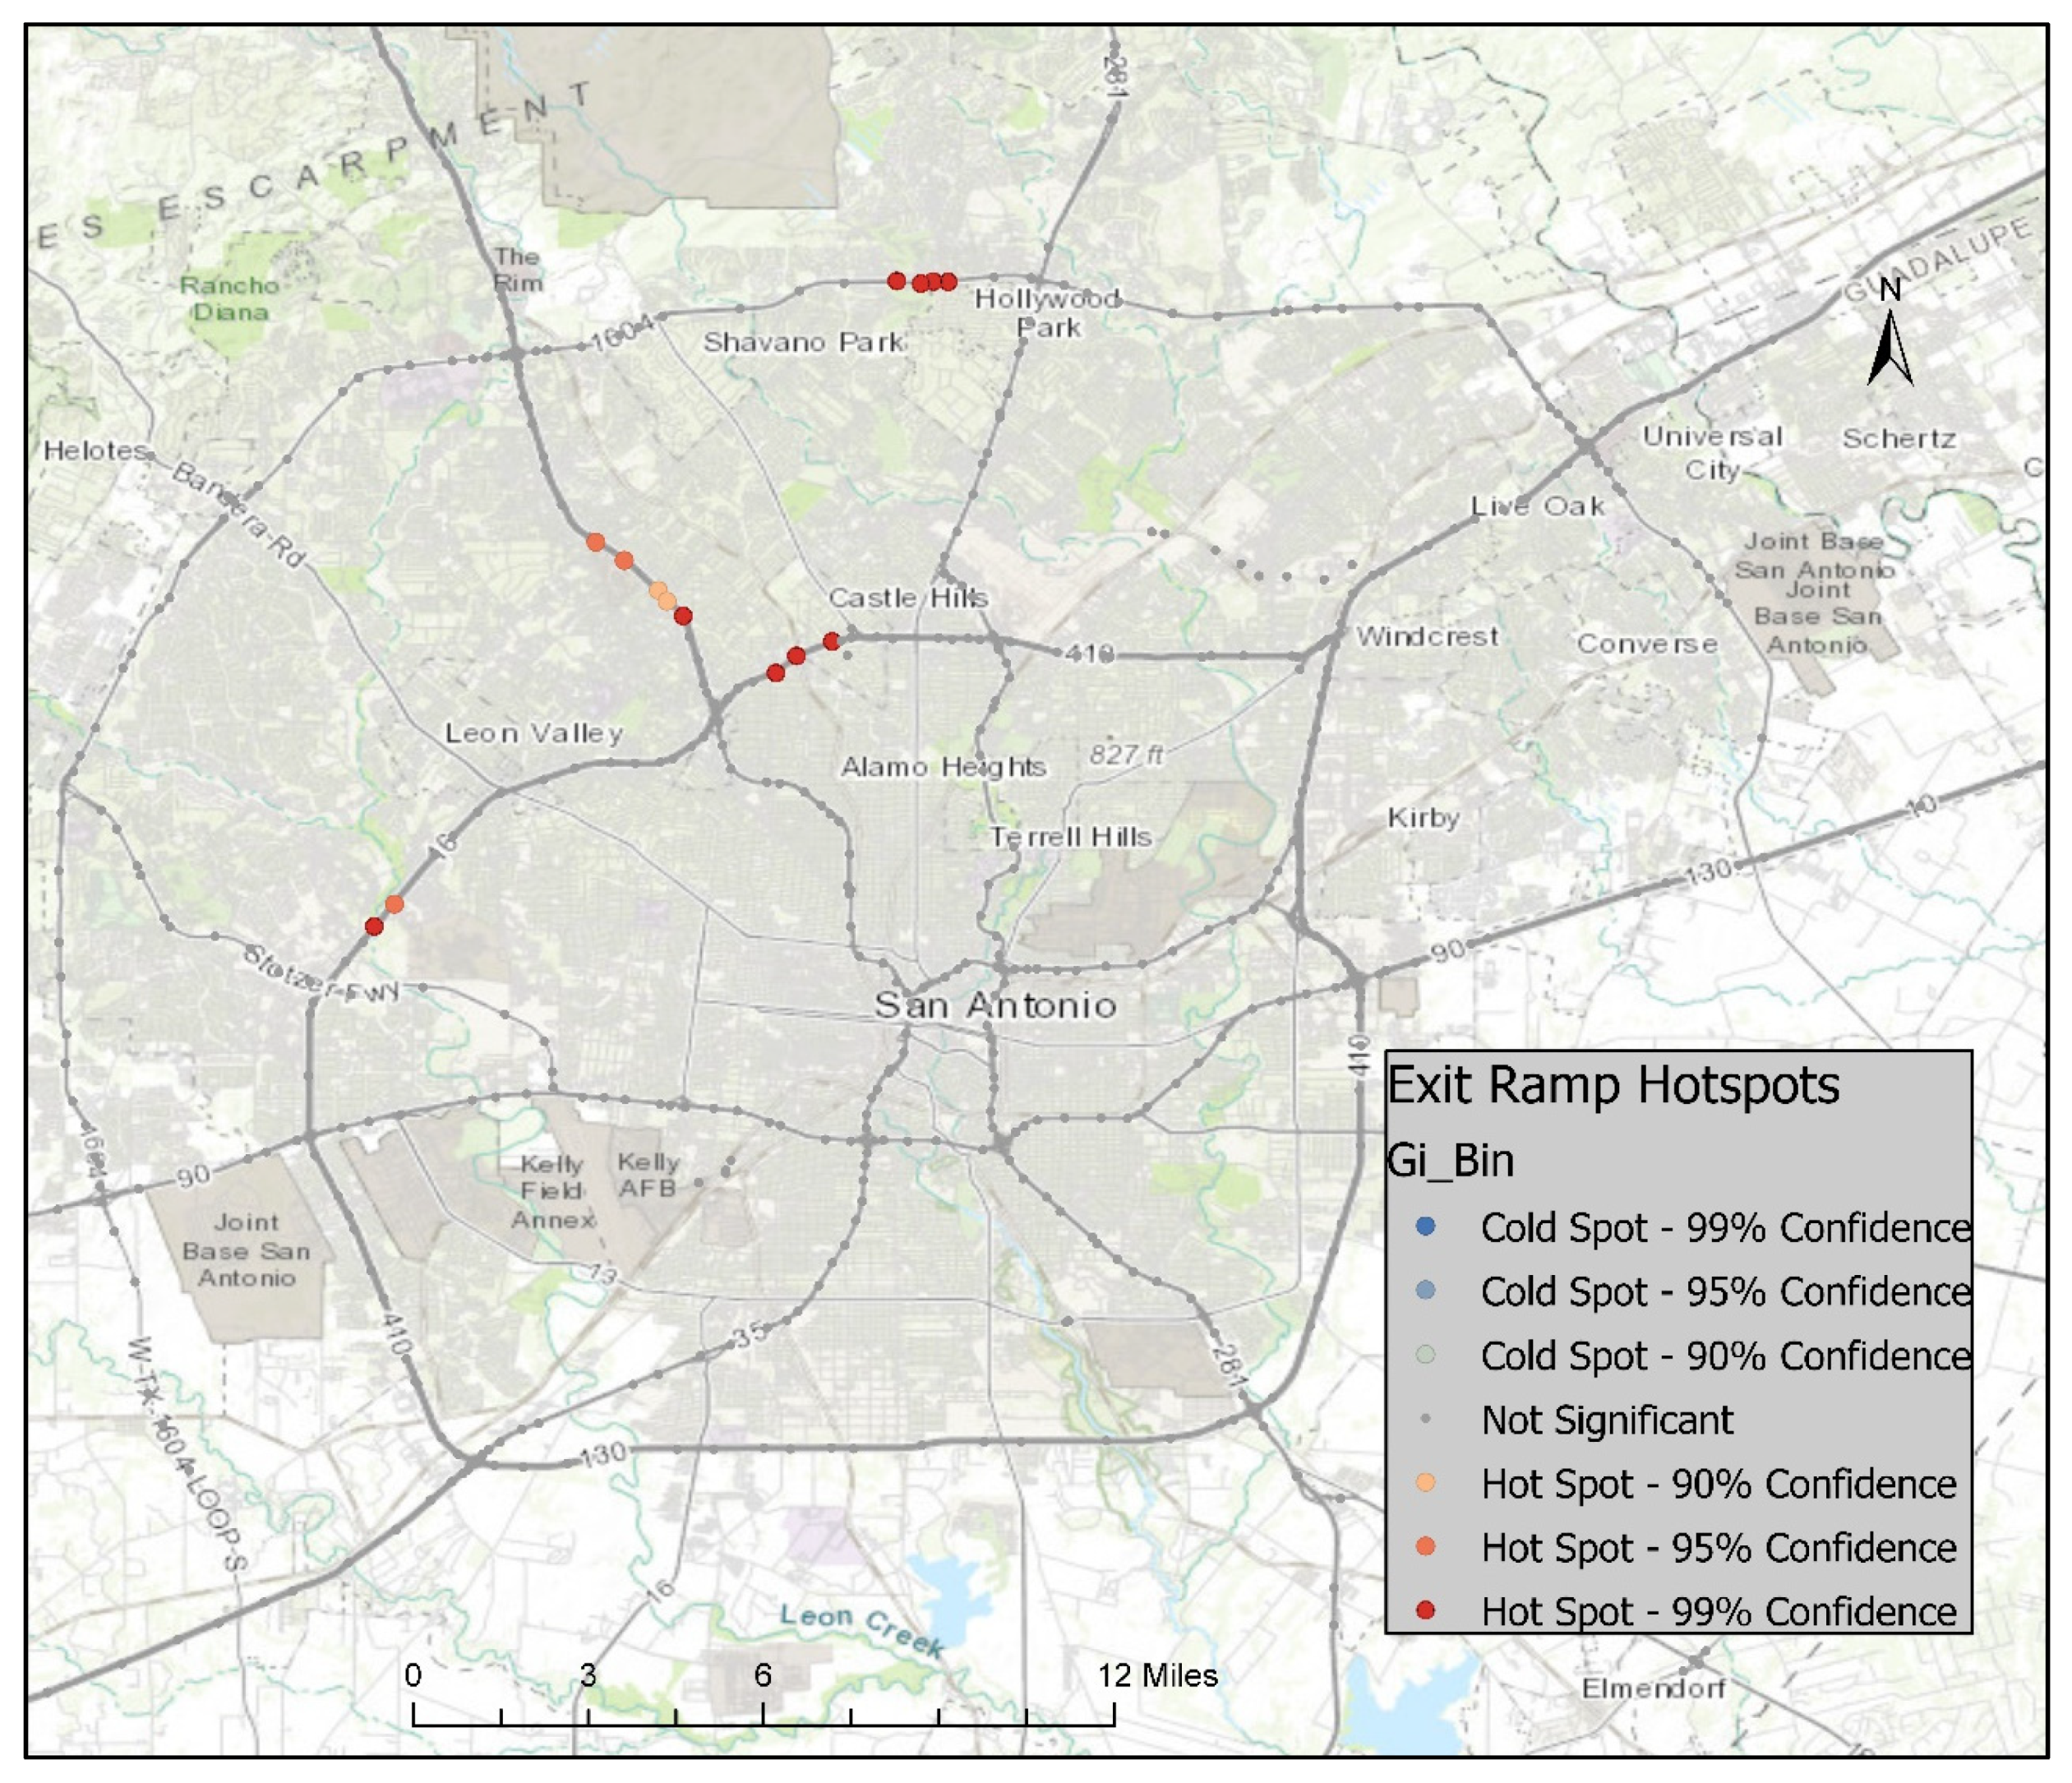
3.3.1. Hotspot Analysis
3.3.2. WWC Analysis Involved No Recorded 911 Call
3.3.3. WWC Analysis Involved 911 Call
3.3.4. 911 Call Analysis Involved No Recorded WWC
4. Results and Discussion
5. Validation
6. Conclusions
Author Contributions
Funding
Institutional Review Board Statement
Informed Consent Statement
Data Availability Statement
Conflicts of Interest
References
- Zhang, B.; Pour-Rouholamin, M.; Zhou, H. Investigation of Confounding Factors Contributing to Wrong-Way Driving Crashes on Partially and Uncontrolled-Access Divided Highways (No. 17-05146). Article 17-05146. In Proceedings of the Transportation Research Board 96th Annual Meeting Transportation Research Board, Washington, DC, USA, 8–12 January 2017; Available online: https://trid.trb.org/view/1439011 (accessed on 10 March 2021).
- Atiquzzaman, M. Modeling the Risk of Wrong-Way Driving at Freeway Exit Ramp Terminals. Ph.D. Thesis, Auburn University, Auburn, AL, USA, 2019. [Google Scholar]
- Department of Transportation, United States. US DOT Public Access Plan Website. 2015. Available online: https://ntl.bts.gov/ntl/public-access (accessed on 12 March 2021).
- Zhou, H.; Zhao, J.; Fries, R.; Gahrooei, M.R.; Wang, L.; Vaughn, B.; Bahaaldin, K.; Ayyalasomayajula, B. Investigation of Contributing Factors Regarding Wrong-Way Driving on Freeways; Illinois Center for Transportation: Rantoul, IL, USA, 2012. [Google Scholar]
- Mia, M.F. Geo-locating and Identifying Wrong-Way Driving Entrance Points in Bexar County Highway System by Implementing Mathematical Modeling and Land-use Impact Assessment. Unpublished Maters’ Thesis, The University of Texas at San Antonio, San Antonio, TX, USA, 2021. [Google Scholar]
- Simpson, S.; Bruggeman, D. Detection and Warning Systems for Wrong-Way Driving (No. FHWA-AZ-15-741); Arizona Department of Transportation (ADOT): Phoenix, AZ, USA, 2015. Available online: https://rosap.ntl.bts.gov/view/dot/29573 (accessed on 22 April 2021).
- Florida Department of Transportation—FDOT. A Data Driven Approach to Implementing Wrong-Way Driving Countermeasures, Final Report; FDOT Contract No. BDV29-977-36; Florida Department of Transportation: Telehesi, FL, USA, 2018. Available online: https://fdotwww.blob.core.windows.net/sitefinity/docs/default-source/research/reports/fdot-bdv29-977-36-rpt.pdf (accessed on 20 March 2021).
- Cooner, S.A.; Cothron, A.S.; Ranft, S.E. Countermeasures for Wrong-Way Movement on Highways: Overview of Project Activities and Findings. 2004. Available online: http://d2dtl5nnlpfr0r.cloudfront.net/tti.tamu.edu/documents/4128-1.pdf (accessed on 23 March 2021).
- Cooner, S.A.; Ranft, S.E. Wrong-Way Driving on Highways: Problems, Issues, and Countermeasures (No. 08-2263). 2008. Available online: https://trid.trb.org/view/848449 (accessed on 23 March 2021).
- Sandt, A.; Al-Deek, H.; Rogers, J.J.H.; Alomari, A.H. Wrong-Way Driving Prevention: Incident survey results and planned countermeasure implementation in Florida. Transp. Res. Rec. 2015, 2484, 99–109. [Google Scholar] [CrossRef]
- Copelan, J.E. Prevention of Wrong Way Accidents on Highways. 1989. Available online: https://trid.trb.org/view/1179706 (accessed on 24 March 2021).
- Doty, R.N.; Ledbetter, C.R. Full Scale Dynamic Tests on One-Way Spike Barriers; State of California: Los Angeles, CA, USA, 1965.
- Gay, C.V. Wrong-way Driving Incidents on Limited Access Divided Highways. 1963. Available online: https://onlinepubs.trb.org/Onlinepubs/hrr/1966/122/122-004.pdf (accessed on 15 April 2021).
- Kemel, E. Wrong-way driving crashes on French divided roads. Accid. Anal. Prev. 2015, 75, 69–76. [Google Scholar] [CrossRef] [PubMed]
- Knight, D.B. Danger! Wrong-Way Driver Ahead! Traffic Safety (Chicago), 83(HS-035 917). 1983. Available online: https://trid.trb.org/view/203400 (accessed on 20 April 2021).
- Parsonson, P.S. Wrong-Way Traffic Movements on Highway Ramps; Georgia Institute of Technology: Atlanta, GA, USA, 1977; Available online: https://smartech.gatech.edu/bitstream/handle/1853/34601/e-20-624_149297.Pdf (accessed on 11 April 2021).
- Rinde, E.A. Off-Ramp Surveillance: Wrong-Way Driving; Department of Transportation, State of California, 1978. Available online: https://www.mcclellanlaw.com/documents/NTSB-Highway-Special-Investigation-Report_Wrong-Way-Driving.pdf (accessed on 29 April 2021).
- Scifres, P.N.; Loutzenheiser, R.C. Wrong-Way Movements on Divided Highways: Technical Paper; Publication FHWA/IN/JHRP-75/13. Joint Highway Research Project; Indiana Department of Transportation and Purdue University: West Lafayette, IN, USA, 1975. [Google Scholar] [CrossRef]
- Tamburri, T.N.; Theobald, D.J. Wrong-Way Driving: Phase II; State of California, Division of Highways, 1965. Available online: http://onlinepubs.trb.org/Onlinepubs/hrr/1966/151/151-003.pdf (accessed on 29 April 2021).
- Tamburri, T. Report on Wrong-Way Automatic Sign, Light and Horn Device; Traffic Department, California Division of Highways, Department of Public Works: Sacramento, CA, USA, 1965.
- Vaswani, N.K. Measures for Preventing Wrong-Way Entries on Highways (No. VHRC 72-R41); Virginia Transportation Research Council: Charlottesville, VA, USA, 1973. Available online: https://rosap.ntl.bts.gov/view/dot/20083 (accessed on 13 April 2021).
- Vaswani, N.K. Further Reduction in Incidences of Wrong-Way Driving (No. VHTRC 77-R45); Virginia Transportation Research Council: Charlottesville, VA, USA, 1977. Available online: https://rosap.ntl.bts.gov/view/dot/20081 (accessed on 13 April 2021).
- Williams, J.K. Wrong Way Movements on Exit Ramps. Bureau of Public Roads, Circular Memorandum to Regional and Division Engineers. 1964. Available online: https://onlinepubs.trb.org/Onlinepubs/hrr/1969/292/292-003.pdf (accessed on 9 April 2021).
- Pour-Rouholamin, M.; Zhou, H.; Zhang, B.; Turochy, R.E. Comprehensive Analysis of Wrong-Way Driving Crashes on Alabama Interstates. Transp. Res. Rec. 2016, 2601, 50–58. [Google Scholar] [CrossRef] [Green Version]
- Zhou, H.; Zhao, J.; Pour-Rouholamin, M.; Tobias, P.A. Statistical Characteristics of Wrong-Way Driving Crashes on Illinois Freeways. Traffic Inj. Prev. 2015, 16, 760–767. [Google Scholar] [CrossRef] [PubMed]
- Kayes, I.; Al-Deek, H.; Sandt, A.; Rogers, J.J.H.; Carrick, G. Analysis of Performance Data Collected from Two Wrong-Way Driving Advanced Technology Countermeasures and Results of Countermeasures Stakeholder Surveys. Transp. Res. Rec. 2018, 2672, 96–105. [Google Scholar] [CrossRef]
- Maldonado, R.D. Wrong Way Driving in San Antonio, Texas: A Transportation Route Study Using Network Analyst. Ph.D. Thesis, University of Southern California, Los Angeles, CA, USA, 2014. Available online: https://spatial.usc.edu/wp-content/uploads/2014/04/MaldonadoRayThesis.pdf (accessed on 2 May 2021).
- Sandt, A.; Al-Deek, H.; Rogers, J.H. Identifying Wrong-Way Driving Hotspots by Modeling Crash Risk and Assessing Duration of Wrong-Way Driving Events. Transp. Res. Rec. 2017, 2616, 58–68. [Google Scholar] [CrossRef]
- Sandt, A.; Al-Deek, H. A Wrong-Way Driving Crash Risk Reduction Approach for Cost-Effective Installation of Advanced Technology Wrong-Way Driving Countermeasures. Transp. Res. Rec. 2018, 2672, 85–95. [Google Scholar] [CrossRef]
- Sandt, A.; Al-Deek, H.; Blue, P.; McCombs, J. Statewide Application of Wrong-Way Driving Crash Risk Modeling and Countermeasures Optimization Algorithm to Identify Optimal Locations for Countermeasure Deployment on Florida Limited Access Facilities. Transp. Res. Rec. 2021, 2672, 0361198120986562. [Google Scholar] [CrossRef]
- Grimm, N.B.; Faeth, S.H.; Golubiewski, N.E.; Redman, C.L.; Wu, J.G.; Bai, X.M.; Briggs, J.M. Global change and the ecology of cities. Science 2008, 319, 756–760. [Google Scholar] [CrossRef] [Green Version]
- Rogers, J.H., Jr.; Sandt, A.; Al-Deek, H.; Alomari, A.H.; Uddin, N.; Gordin, E.; Carrick, G. Wrong-way driving: Multifactor risk-based model for Florida interstates and toll facilities. Transp. Res. Rec. 2015, 2484, 119–128. [Google Scholar] [CrossRef]
- Kayes, I.; Sandt, A.; Al-Deek, H.; Uddin, N.; Rogers, J.H.; Carrick, G. Modeling Wrong-Way Driving Entries at Limited Access Facility Exit Ramps in Florida. Transp. Res. Rec. 2019, 2673, 567–576. [Google Scholar] [CrossRef]
- Harirforoush, H.; Bellalite, L. A new integrated GIS-based analysis to detect hotspots: A case study of the city of Sherbrooke. Accid. Anal. Prev. 2019, 130, 62–74. [Google Scholar] [CrossRef]
- Young, J.; Park, P.Y. Hotzone identification with GIS-based post-network screening analysis. J. Transp. Geogr. 2014, 34, 106–120. [Google Scholar] [CrossRef]
- Plug, C.; Xia, J.C.; Caulfield, C. Spatial and temporal visualization techniques for crash analysis. Accid. Anal. Prev. 2011, 43, 1937–1946. [Google Scholar] [CrossRef] [PubMed]
- Skszek, S.L. Actual Speeds on the Roads Compared to the Posted Limits (No. FHWA-AZ-04-551); Arizona Department of Transportation (ADOT): Phoenix, AZ, USA, 2004. Available online: https://rosap.ntl.bts.gov/view/dot/37366 (accessed on 21 April 2021).
- Billah, K.; Sharif, H.O.; Dessouky, S. Analysis of Pedestrian–Motor Vehicle Crashes in San Antonio, Texas. Sustainability 2021, 13, 6610. [Google Scholar] [CrossRef]
- Billah, K.; Sharif, H.O.; Dessouky, S. Analysis of Bicycle-Motor Vehicle Crashes in San Antonio, Texas. Int. J. Environ. Res. Public Health 2021, 18, 9220. [Google Scholar] [CrossRef] [PubMed]


| Analysis Type | Land-Use Impact Assesment Analysis | WWC Analysis—No Recorded 911 Call | WWC Analysis Involved 911 Call | 911 Call Analysis—No Recorded WWC |
|---|---|---|---|---|
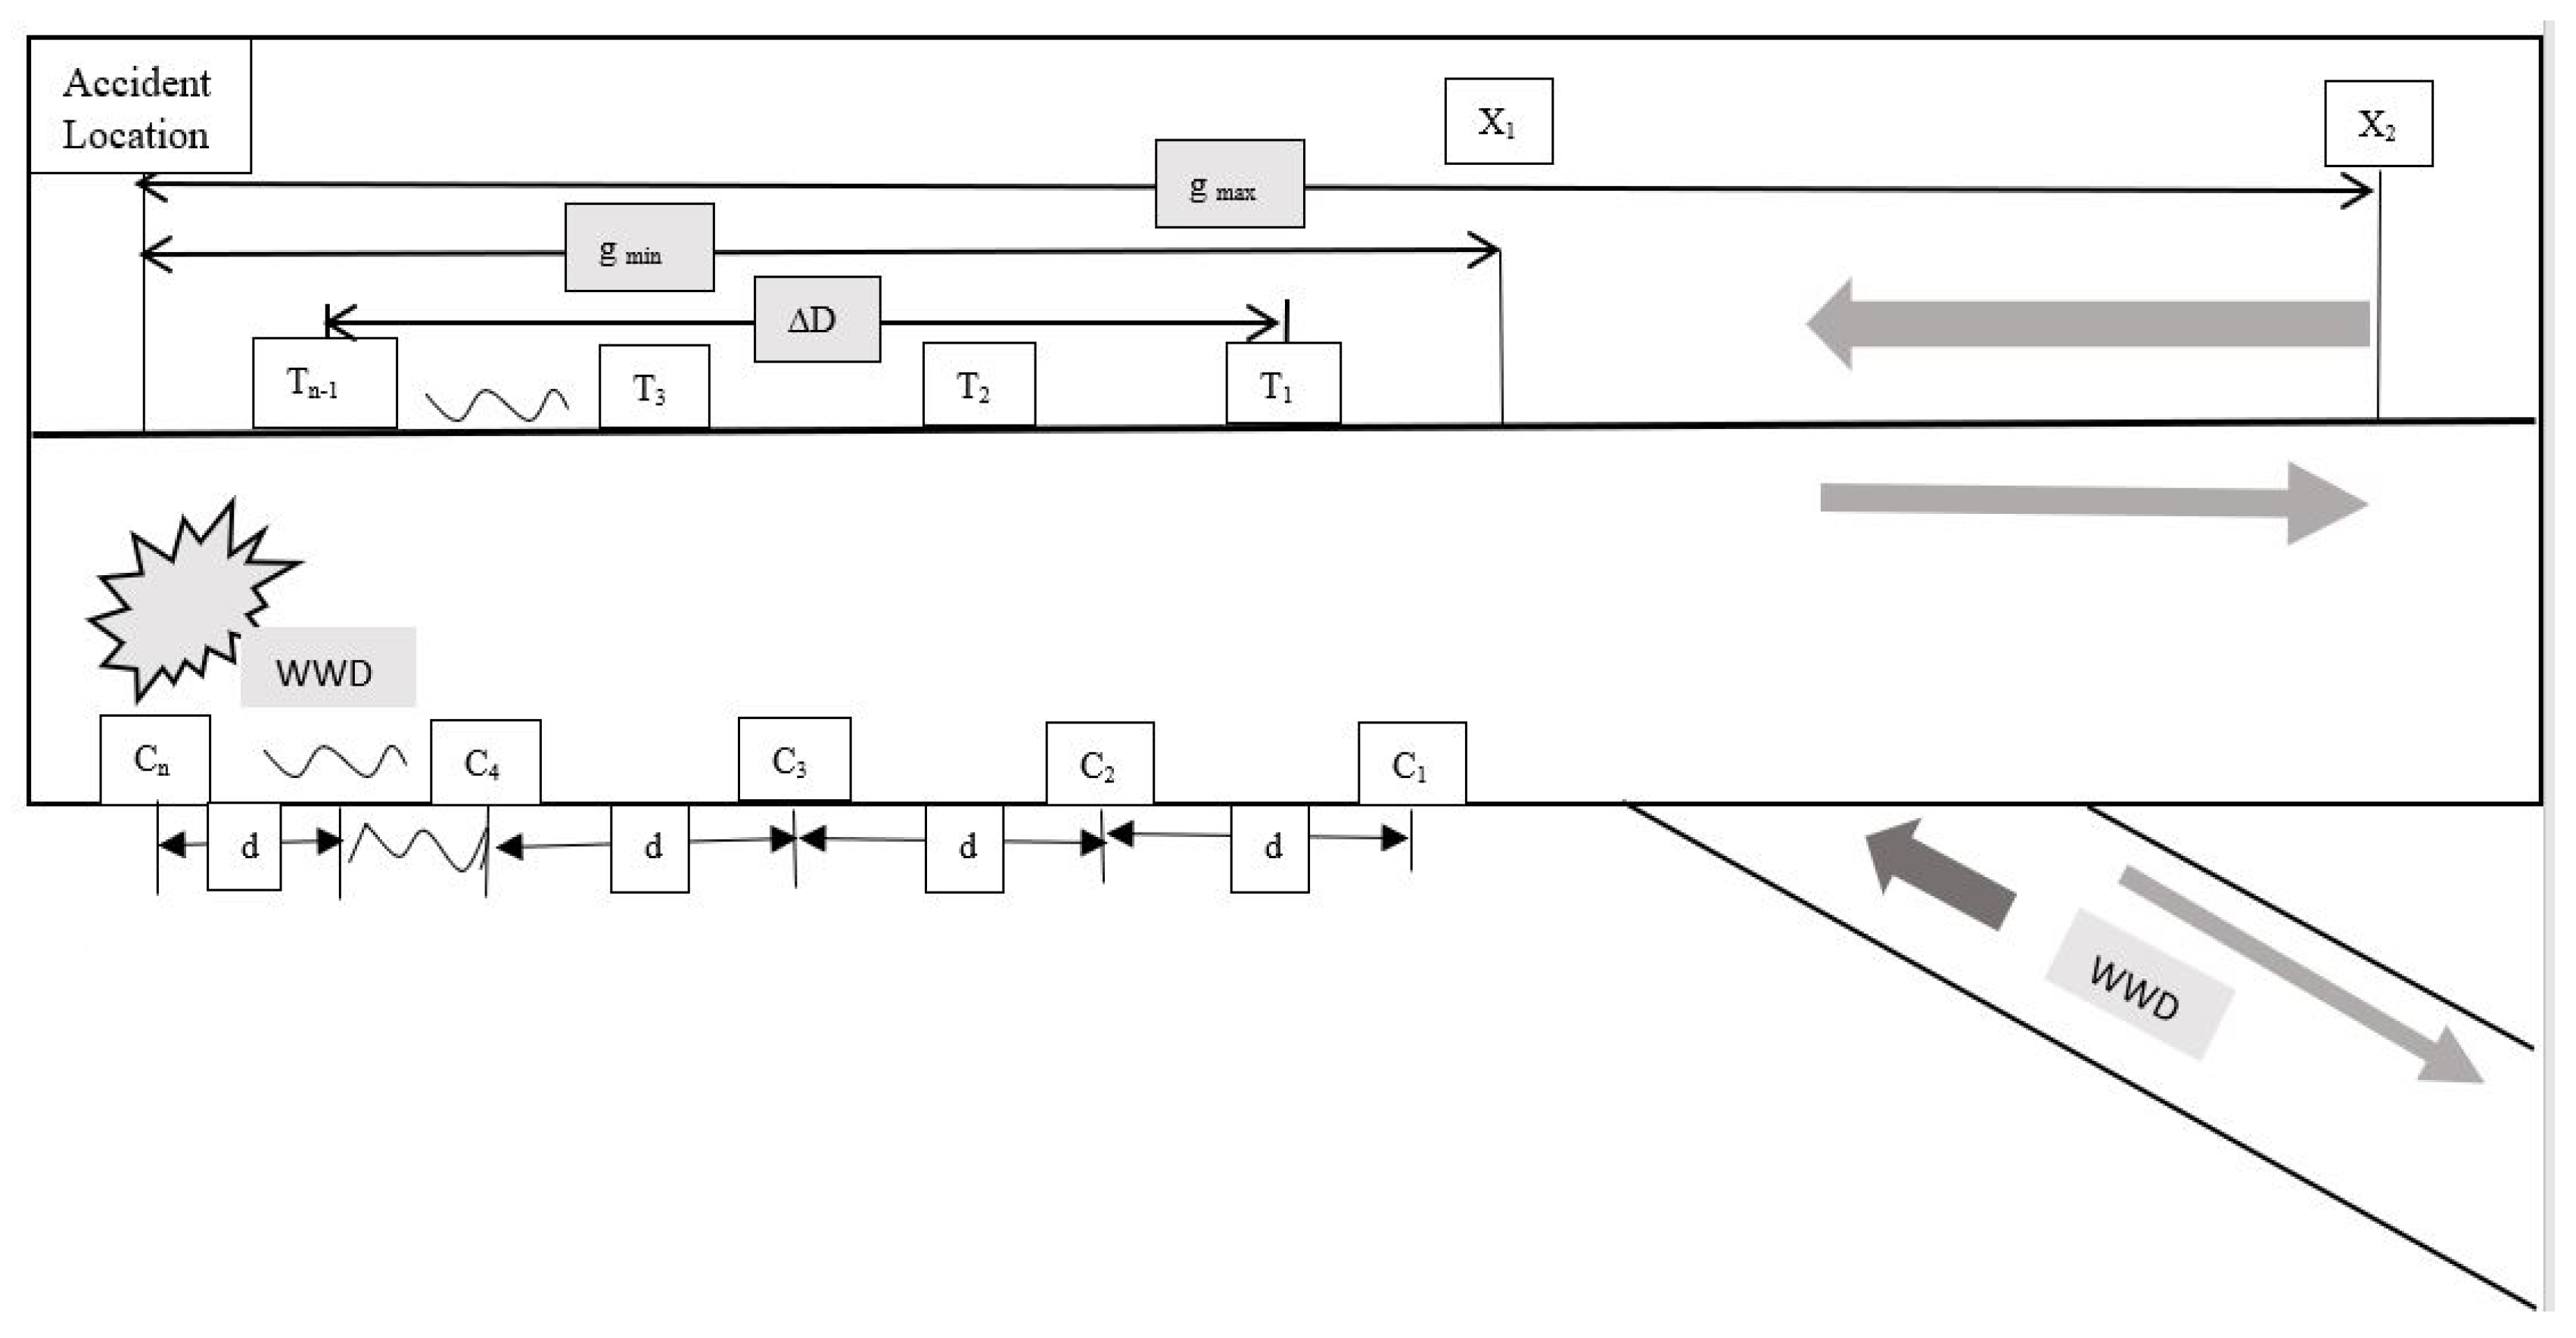
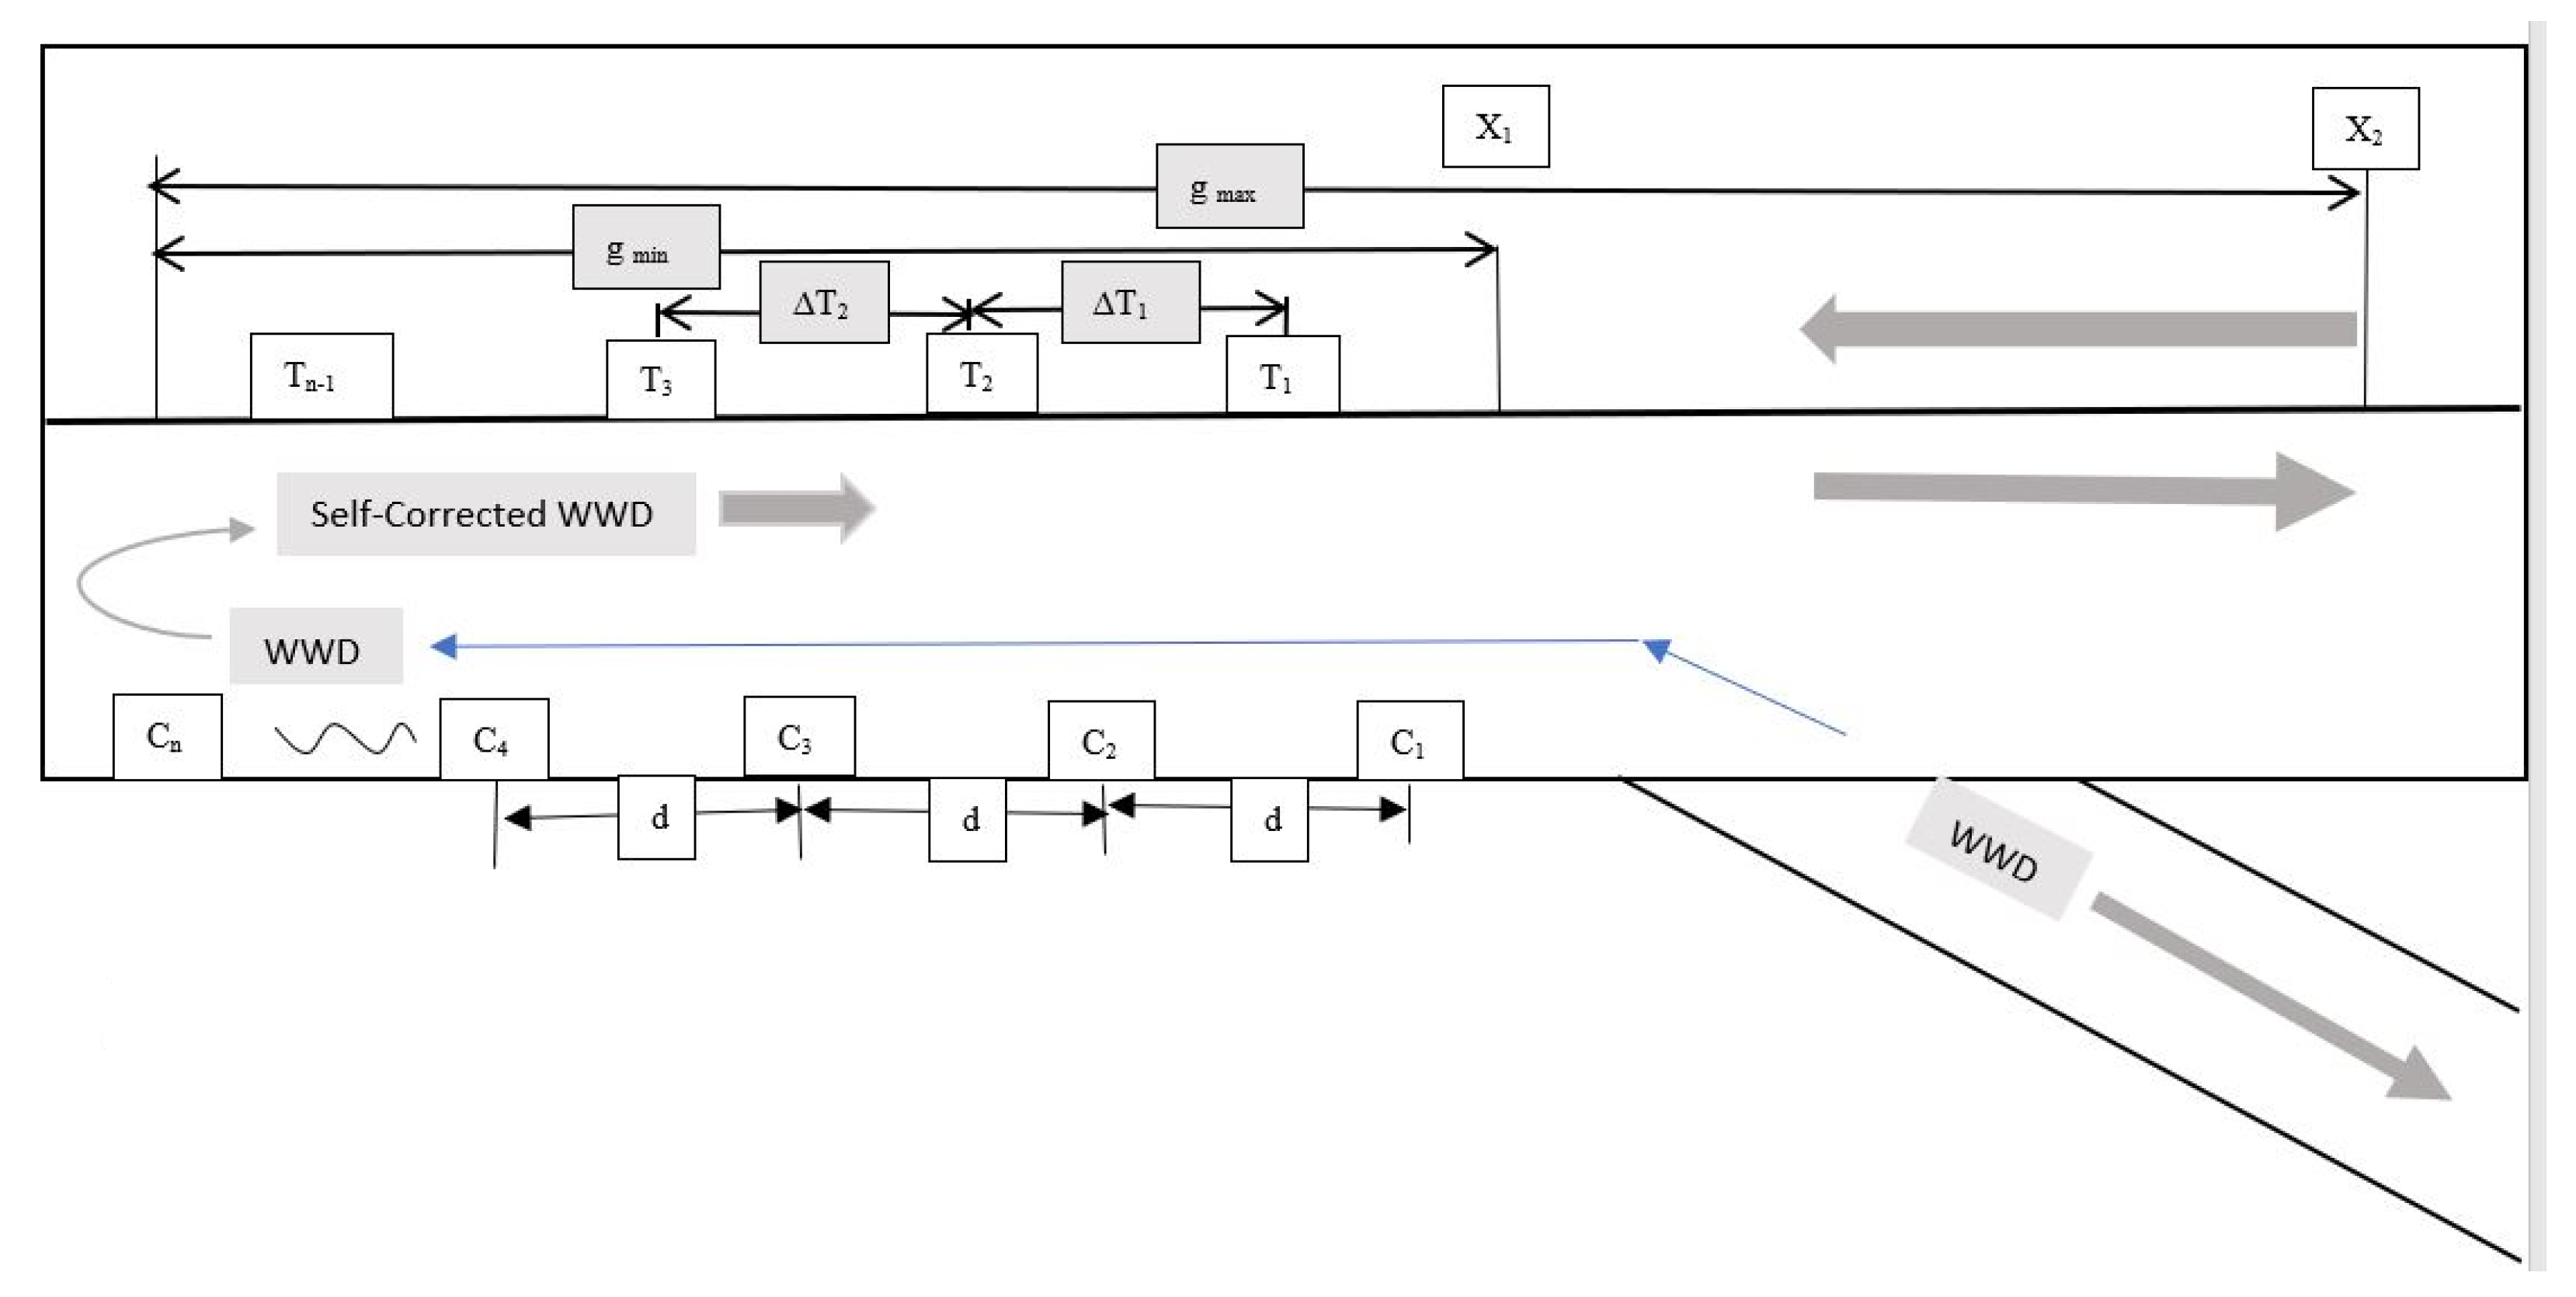
| Description | 543 exit ramps with near proximity to ASE were examined. Those identified exit ramps have been considered potential entrance points of WWD to highways. | 199 WWC from the database which has no 911 involved have been used in this analysis. WWD hits the first exit ramp proximate encountered vehicle on highway leaves no opportunity for other motorists to make 911 call before crash occurred. Approximate speed of the vehicle on highways is used to determine the maximum and minimum possible distance covered by WWD before crash to determine the location of exit ramps responsible for entrance of WWD. | 32 WWC from the database with 911 calls from motorists in near proximity have been used in this analysis. Approximate speed of the vehicle in highways is used to determine the maximum and minimum possible distance covered by WWD before crash to determine the location of exit ramps responsible for entrance of WWD. | 571 distinct events without WWC from 911 calls by motorists in near proximity was used in this analysis. Drivers somehow correct themselves or the authority was able to correct them crash occurred. Approximate speed of vehicles on highways has been used to determine the maximum and minimum distance covered by WWD before correcting the direction to determine the location of exit ramps responsible for entrance of WWD. |
| Number of ramps identified as entrance of WWD | 141 | 132 | 29 | 225 |
Publisher’s Note: MDPI stays neutral with regard to jurisdictional claims in published maps and institutional affiliations. |
© 2021 by the authors. Licensee MDPI, Basel, Switzerland. This article is an open access article distributed under the terms and conditions of the Creative Commons Attribution (CC BY) license (https://creativecommons.org/licenses/by/4.0/).
Share and Cite
Mia, M.F.; Dessouky, S.; Weissmann, J.; Sharif, H.O.; Billah, K. Geo-Locating and Identifying Wrong-Way Driving Entrance Points in Bexar County Highways by Implementing Mathematical Modeling and Land-Use Impact Assessment. Sustainability 2022, 14, 33. https://doi.org/10.3390/su14010033
Mia MF, Dessouky S, Weissmann J, Sharif HO, Billah K. Geo-Locating and Identifying Wrong-Way Driving Entrance Points in Bexar County Highways by Implementing Mathematical Modeling and Land-Use Impact Assessment. Sustainability. 2022; 14(1):33. https://doi.org/10.3390/su14010033
Chicago/Turabian StyleMia, Md Farman, Samer Dessouky, Jose Weissmann, Hatim O. Sharif, and Khondoker Billah. 2022. "Geo-Locating and Identifying Wrong-Way Driving Entrance Points in Bexar County Highways by Implementing Mathematical Modeling and Land-Use Impact Assessment" Sustainability 14, no. 1: 33. https://doi.org/10.3390/su14010033
APA StyleMia, M. F., Dessouky, S., Weissmann, J., Sharif, H. O., & Billah, K. (2022). Geo-Locating and Identifying Wrong-Way Driving Entrance Points in Bexar County Highways by Implementing Mathematical Modeling and Land-Use Impact Assessment. Sustainability, 14(1), 33. https://doi.org/10.3390/su14010033