Abstract
The City of Winnipeg (COW) and the University of Manitoba (UM), Canada, have partnered since 2015 to conduct research on the use of portland limestone cement (PLC), comprising up to 15% limestone filler, in transportation infrastructure such as pavements and bridges. Laboratory tests have substantiated the equivalent or superior resistance of concrete made from PLC, relative to that made from general use (GU) cement (Type I) to durability exposures including acids, sulfate salts and chloride-based deicing salts. Subsequently, a field trial was done in 2018, which involved casting two concrete pavement sections made from PLC and GU cement in Winnipeg, Manitoba, Canada. The current paper reports on the construction and long-term (three years/winter seasons) properties of these pavement sections including fresh properties, strength, absorption and chloride ions penetrability, as well as microstructural features. Cores were taken from mid-slabs and at joints, which are the most vulnerable locations to damage in concrete pavements. The field trial results showed that concrete pavement sections made with PLC had equivalent or superior performance compared with those made of GU in terms of fresh, hardened and durability properties. Thus, it presents a viable option for sustainable construction of concrete flatwork in cold regions.
Keywords:
PLC cement; concrete; durability; suitability; field trial; pavement; microstructural analysis 1. Introduction
In 2008, portland limestone cement (PLC), was introduced as a new type of cement in Canada, which is specified by the Canadian Standards Association (CSA) A3001 [1]. Unlike general use cement (GU, Type I), which may comprise up to 5% limestone powder, PLC is produced by inter-grinding portland cement clinker and gypsum with 5–15% limestone powder during the manufacturing process [2]. Currently, various types of PLC are widely used around the world [3]. For instance, in the U.S., both ASTM C150 [4] and ASTM C595 [5] allow 5 to 15% limestone powder in PLC. In Europe, EN 197-1 [6] describes two classifications of PLC based on the limestone powder content: 6–20% (Types II/A-L and II/A-LL) and 21–35% (Types II/B-L and II/B-LL). In Brazil, NBR 11,578 [7], permits 6–10% limestone content in Type CPII-F portland composite cement, while in Argentina, PLC (IRAM 50000) [8] is permitted to contain up to 25% calcareous materials. In Mexico, NMX C-414-ONNCCE [9] specifies that composite cements may contain from 6% to 35% limestone filler. Due to the replacement of clinker with considerable proportions of limestone powder, PLC is considered more sustainable compared with ordinary portland cement, as less raw materials are required for the calcination process, i.e., less CO2 emissions and lower carbon footprint of produced concrete [3].
Limestone powder has attracted many researchers due to its wide availability and low cost. To properly optimize the use of LS, researchers have conducted a lot of research on the action mechanisms of limestone of different sizes, dosages, dissolution rates and polymorphology on different concrete properties [2,3,10,11,12,13,14,15,16,17]. While limestone powder is considered a partially inert filler, it can positively affect the development of concrete microstructures owing to its fine nature (1000 to 6000 m2/kg) [10], which optimizes particle size distribution and improves particle packing of produced cement [10]. In addition, fine limestone particles (0.7 to 15 µm) [10] were reported to act as nucleation sites for hydration products to precipitate on, and they engage with aluminate phases to form carboalumiante compounds, thus improving microstructural development of hardened paste compared to that produced from hydration of ordinary cement [3,10]. Several laboratory studies have highlighted the benefits of PLC with respect to improving concrete pumpability/workability [3] and increasing its resistance to ingress of fluids, acids, carbonation and chloride-based salts [11,12,13,14,15,16,17]. In addition, the use of PLC in concrete improved its resistance to freezing and thawing cycles with/without de-icers [13,14,16].
Research Significance
Although many studies have been conducted, and corresponding standards have been formulated regarding PLC, there is still a scarcity of long-term field data on using PLC for flatwork applications in harsh environments (e.g., large number of freezing–thawing cycles, high concentrations of de-icing salts, wetting–drying cycles) such as those of the prairie provinces in Canada. Accordingly, the Public Works Department, City of Winnipeg (COW), Manitoba, Canada, in collaboration with the University of Manitoba (UM), made a field trial in 2018 involving the construction of concrete pavement sections in a major urban arterial road in Winnipeg using PLC and GU cement. This article reports on the construction and long-term (three years) properties of these concretes to assess the applicability of using PLC for concrete flatwork applications in cold regions.
2. Field Application
2.1. Materials and Mixtures
Two types of cement were used in this field application: PLC and GU cement. In addition, Class F fly ash, at a constant dosage of 15% as per CW3310 requirements [18], was added to the concrete mixtures. The physical and chemical properties of the aforementioned materials meet the requirements of the CAN/CSA-A3001 [1]. Furthermore, high range water reducing (HRWR) and air entraining (AE) admixtures, which meet the provision of ASTM C494 [19], Type F and ASTM C260 [20], respectively, were added to achieve the target slump (30–70 mm for slip forming and 50–90 mm for hand placement) and air content (5–8%), respectively. Natural gravel (maximum size of 20 mm) with specific gravity and absorption of 2.65 and 1.6%, respectively, was used as coarse aggregate, and well-graded river sand with a specific gravity, absorption and fineness modulus of 2.53, 1.5% and 2.9, respectively, was used as fine aggregate.
Table 1 shows the mix design of the adopted concrete mixtures, based on previous laboratory studies [11,12,13,14], to meet COW criteria for concrete pavements [18]: (i) class of exposure, C-2, plain concrete exposed to chlorides and freezing and thawing as per CSA A23.1-19 [21]; (ii) minimum 28 days compressive strength of 32 MPa; (iii) maximum water-to-binder ratio (w/b) of 0.38 for slipform paving and 0.45 for hand placement; and (iv) minimum cementitious material content of 380 kg/m3.

Table 1.
Mixtures proportions per cubic meter.
Two concrete mixtures, PLC and GU, were placed in a major urban arterial road, one mixture at each direction (northbound and southbound, respectively), in Winnipeg, Manitoba, Canada. The pavement in the test locations was subjected to large temperature fluctuations, as the maximum and minimum air temperatures were +36 °C and –36 °C, respectively. The pavement sections consisted of a 230 mm thick plain jointed concrete pavement with a slab width of 3.70 m on a granular base course and sub-base layers. The test sections were comprised of a two-way divided road in each direction. The speed limit is 60 km/h, and the average week-day daily traffic ranges between 15,000 and 20,000 vehicles over the two lanes of traffic with 5% trucks and buses.
2.2. Pavement Description and Construction Procedures
The placement, consolidation, finishing and curing procedures of the pavement sections complied with the COW construction specifications for surface works [18]. Placement of concrete, in case of machine placement, was done via the discharge chute of ready-mix concrete trucks for continuous supply to the slipform paver, which consolidated fresh concrete using a series of internal vibrators, while the hand placement method was followed at locations with limited access to equipment, such as intersection panels. In this method, the concrete was cast by a mechanical spreader followed by compaction using vibrators; then the surface of the concrete was struck-off. This was immediately followed by finishing and final surfacing. Shortly (30 to 45 min) after the finishing operations, a curing compound complying with ASTM C309 [22] was applied using portable sprayers according to the manufacturer’s recommendations for the rate of application. Visual inspection was mandated to cover any left-out spots “holidays”, where the surface of the pavement sections was uniformly white in color. The pavement slabs were saw-cut approximately 6–8 h after casting to establish the contraction joints with the dimensions of 3 mm wide and 40 mm deep. The joints were cleaned of dust immediately after saw-cutting using a waterjet and air blower and overfilled with curing compound. This method prevents uncontrolled evaporation from the joints, resulting in better microstructural development at these critical locations [23]. The second cut for joint sealing took place two to three weeks after the initial saw-cut with the dimensions of 10 mm wide and 30 mm deep. The joints were subsequently filled with a backer rod and sealed using hot poured joint sealer complying with ASTM D6690, Type IV [24]. Figure 1 shows the procedures for the preparation of joints.
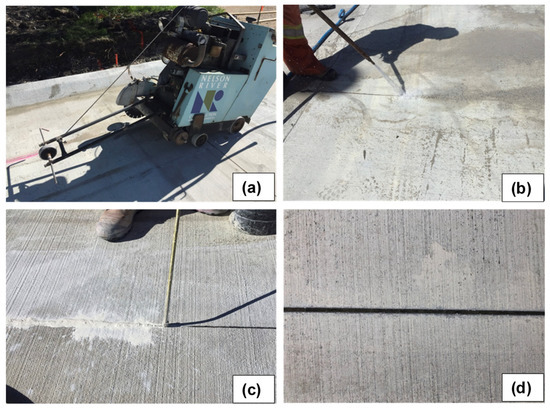
Figure 1.
Joint preparation according to Tiznobaik and Bassuoni (2017) [23]: (a) first joint cutting; (b) joint cleaning; (c) overfilling with curing compound; and (d) joint filling.
2.3. Testing Methods
Initially, the fresh, mechanical, and infiltration properties of both concrete mixtures were investigated (up to 28 days). During construction slump and fresh air content were conducted as per ASTM C143/C143M [25] and ASTM C231/C231M [26], respectively. In addition, 1, 3, 7 and 28 days compressive strength as per ASTM C39 [27] was conducted on cylinders (100 × 200 mm), which were prepared during field placement and kept under similar environmental conditions to the concrete pavement. Another set of cylinders was cured under standard curing conditions (22 ± 2 °C and more than 95 RH) for comparison purposes with field curing conditions. Moreover, the rapid chloride penetrability test (RCPT) (at 28 days) was conducted as per ASTM C1202 [28] on 100 mm diameter and 50 mm thick discs cut from 100 × 200 mm cylinders, which were placed and cured similar to the compressive strength cylinders.
After three years, visual examination was performed in order to classify the surface scaling of the pavement sections according to ASTM C672 [29] visual ratings (0: no scaling to 5: severe scaling). Ten cores (100 mm in diameter and 200 mm in length) were extracted from the northbound and southbound directions, representing different locations (mid-slabs and joints), placement methods (slipform and hand placement) and surface conditions (middle and wheel path) (Table 2 and Figure 2), to assess the performance of PLC and GU concrete pavements.
Table 2.
Cores’ details and testing plans.

Figure 2.
Exemplar locations of cores: (a) wheel path core at joint; (b) joint core away from wheel path (middle); and (c) mid-slab core.
The top 5 mm of each core was removed to avoid the presence of external substances/debris, if any. Two 50 mm discs, representing the top and bottom parts of each core, were then saw-cut for the RCPT after three years. Furthermore, the penetration depth of the chloride ions was measured upon completion of the RCPT by axially splitting and spraying the concrete discs with 0.1 M silver nitrate solution, which reacts with the chloride ions to produce a white precipitate of silver chloride [30]. Fluid absorption of concrete at joint locations was determined as per Tiznobaik and Bassuoni (2018) [31] on cylindrical cores (100 × 200 mm) extracted at joint locations. The test was performed on 50 mm discs extracted from both joint top and bottom parts, similar to the RCPT. The specimens were placed in an oven at 45 ± 2 °C and 40% RH till reaching a constant mass. Then, all surfaces except the top surface and joint walls were sealed by a rapid setting epoxy. Subsequently, the samples were exposed to vacuum pressure (~85 kPa) for 6 h in a sealed desiccator. Afterwards, each side of the joint was immersed in 4% calcium chloride (CaCl2) solution for 6 h, and then the amount of absorption was calculated to the nearest 0.01 g.
To assess the hydrated paste in the PLC and GU concrete mixtures, differential scanning calorimetry and thermogravimetric (TG) analysis were performed on powder samples extracted from the top 1 cm of concrete cores at a constant heating rate of 10 °C/min. The portlandite (CH) content was calculated by multiplying the percentage drop of an ignited mass of the TG curves at a temperature range of 400 to 450 °C by 4.11 (ratio of the molecular mass of CH to that of water). In addition, microstructural analysis on carbon coated concrete chunks, which were extracted from the top 1 cm of concrete cores, was performed using scanning electron microscope (SEM) associated with energy dispersive spectroscopy (EDX).
3. Results and Discussion
3.1. Fresh Properties
The fresh properties of both concrete mixtures are listed in Table 3. The slump and air void contents of all mixtures met COW specifications [18]. The water content for the required slump was similar for both mixtures with PLC and GU cement. However, due to the higher fineness of PLC (460 m2/kg) than of GU cement (390 m2/kg), concrete incorporating PLC cement showed better cohesiveness and thus less bleeding after placement. The initial temperature of the PLC mixture (27–29 °C) attained a higher value compared to the counterpart GU mixture (23–24 °C). This can be ascribed to the nucleation effect of finer PLC particles; thus, faster dissolution of calcium and hydroxyl ions occurred until reaching a critical saturation with respect to calcium hydroxide, resulting in higher initial temperature during the dormant/transport period [3,10]. Accordingly, the skeletal rigidity (final setting time) of the PLC mixture (4 h) was accelerated in comparison with the GU mixture (5 h); thus, the time of saw-cut after paving for the PLC concrete was shortened by 13% and 11% for the slipform and hand placement, respectively, compared to the GU concrete.
Table 3.
Fresh properties during placement and saw-cutting time.
3.2. Hardened Properties after Construction
The compressive strength of the cylinders cured under the same conditions of pavement sections and under standard curing conditions after 1, 3, 7 and 28 days are listed in Table 4. In addition, the RCPT tests were carried out to identify the penetrability class of both concrete mixtures at 28 days (Table 4). All mixtures achieved the COW stipulations for 28 days compressive strength of 32 MPa. In addition, the RCPT results met the requirement of exposure class C-1 (passing charges < 1500 Coulombs), which is more severe than that of required by the COW, indicating the adequacy of both concrete mixtures for this pavement application.
Table 4.
Compressive strengths and RCPT results as well as its ANOVA after construction.
Concrete produced from PLC showed higher compressive strength compared to that of GU cement up to 28 days, with an average increase of 16% and 20% under both field and standard curing conditions, respectively. This can be attributed to the aforementioned fineness and nucleation effects of PLC cement, which led to better degree of hydration and microstructural development [2,3,10]. Furthermore, the coexistence of fine limestone particles in the PLC hardened paste led to efficient particle packing and filler/densification effects in the matrix [3,10,13,16]. Hence, the mixture produced from PLC showed better resistance to the ingress of chloride ions compared to the GU mixture, as the passing charges were reduced by 44%. Statistical analysis by analysis of variance (ANOVA; Table 4) showed that this increase in the compressive strength and chloride penetration resistance of concrete produced with PLC compared to GU was significant. Hence it was reported that if the F-distribution density function exceeds its critical value (Fcr), the tested variable has a significant effect on the mean value of the results [32].
3.3. Long-Term Assessment
3.3.1. Visual Features
After three years, field investigation was conducted for the pavement sections to identify signs of deterioration, if any. As for the examples shown in Figure 3a,b, the condition of the concrete pavements in both directions, after three fairly harsh winters (approximately between 70 to 85 freezing–thawing cycles/year) and multiple applications of de-icing salts (160 kg/lane km at approximately 16 times average frequency/winter), was generally superior with no evident signs of scaling (visual rating of 0), except for the locations where the hand placement PLC mix was used, which showed incidental features of minor scaling in the wheel-path with a visual rating of 1 (Figure 3c). All the joints were clean and sound in both directions for all mixes, and there was no evidence of faulting or spalling (Figure 3d). The field performance correlated well with the results from laboratory tests, as described in the Fluid Transport Properties and Microstructural Analysis sections.

Figure 3.
Visual features of the pavement sections after three years: (a) PLC; (b) GU; (c) marginal scaling at wheel path locations for PLC mix with hand placement; and (d) joints.
3.3.2. Fluid Transport Properties
The RCPT and absorption tests were performed on cores extracted from the middle and joints of the pavement sections. Furthermore, the average depth of the silver chloride precipitate was determined along the diameter of specimens. This depth is considered to be an indication of the ease of ingress of external fluids and thus the tortuosity of the microstructure [30]. The specimens extracted from the pavement slabs that were cast by the hand placement method (e.g., intersection panels) had higher passing charges by 20% compared to those of the machine placed slabs (slipform paver). This can be attributed to the higher water content of the former (w/b of 0.45) compared to that of the latter (w/b of 0.38), leading to the development of a coarser and more continuous microstructure.
The passing charges of the PLC and GU specimens varied between 505 and 730 Coulombs, with a chloride penetration depth of less than 10 mm (Figure 4 and Figure 5). This indicated progressive development and densification in the microstructure of mixtures compared to the 28 day results (736–1317 Coulombs), implying “very low” penetrability according to the ASTM C1012 [28] classification. Irrespective of the placement method, the PLC specimens showed marginally better resistance to chloride ions ingress at an average of 8% less passing charges compared to the counterpart GU specimens, which can be attributed to the previously discussed fineness, nucleation and filler effects of the PLC on the densification of the hardened matrix. The significance of the improvements in the RCPT results of concrete produced using PLC was supported by statistical analysis (ANOVA; Table 5), which showed that regardless of the location or the placement method, the F-distribution density function exceeds its critical value (Fcr). It is worth noting that the passing charges of the top discs from each location were higher compared to those of the bottom discs (Figure 4). The bottom part of concrete pavement is considered the baseline for curing efficiency, presumably representing the optimal location in terms of moisture retention, which facilitates cement hydration and microstructural evolution [31]; therefore, the penetrability of the surface concrete pavement is generally higher than the bottom part.

Figure 4.
RCPT results for the cores taken at mid-slabs after three years.
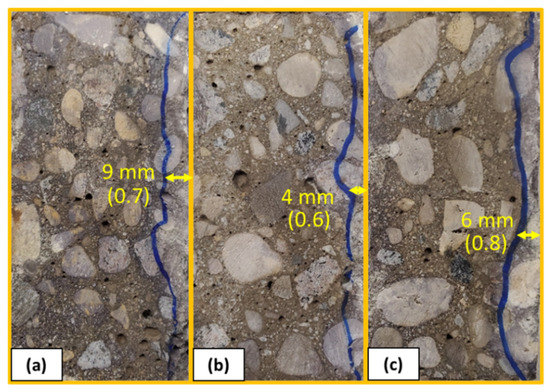
Figure 5.
Exemplar chloride ions penetration depths in (a) PLC-hand placement; (b) PLC-slipform; and (c) GU-slipform. Note: the values between parentheses are the standard deviations.
Table 5.
ANOVA of the RCPT and absorption results after three years of service.
As shown in Figure 6, the absorption results varied between 1.4% and 2.4%, which complied with the RCPT trends in the sense that PLC led to an average reduction of fluid absorption by 16% compared to that of GU. The absorption results of the cores extracted at the joints on the wheel path showed 15% higher absorption in comparison to that of cores extracted from the joint locations away from the wheel path. This can be attributed to the continual mechanical attrition of the vehicles at the wheel path, leading to high potential of micro-/macro-cracking of the matrix and consequently higher vulnerability to fluid penetration. The absorption results also showed that the top part of the cores had higher absorption capacity compared with the bottom part of the cores due to better moisture retention and hydration development, as discussed earlier.
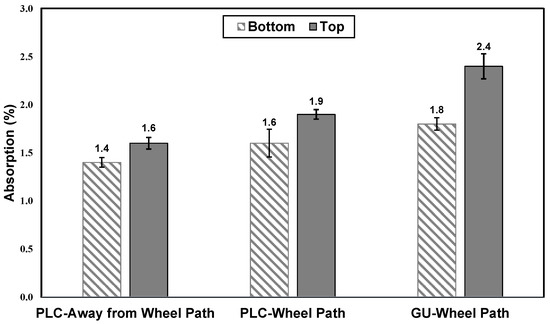
Figure 6.
Absorption results for cores taken at joints after three years. (Note: error bars represent standard deviations).
3.4. Microstructural Analysis
Generally, the thermal analysis for both the PLC and GU mixtures within the top layer of joint cores showed no signs of de-icer chemical attack on the matrix, such as the presence of Friedel’s salt and absence of portlandite (CH). There was indication of continual hydration development of both matrices, with comparable primary ettringite and portlandite peaks at 50 to 120 °C and 400 to 450 °C, respectively (e.g., Figure 7). This conformed to the microscopy analysis (e.g., Figure 8), since PLC and GU matrices attained comparable and homogenous morphologies without visible signs of micro-cracking or infilling of air voids with complex assemblages typically resulting from chemical attack of concrete [13,14,15]. Furthermore, EDX showed the presence of minor chloride traces in the systems, which substantiated the sufficient degree of hydration and high resistance of the mixtures used to the ingress of chloride ions from the applied de-icers, especially in the case of PLC-produced concrete.

Figure 7.
Thermal analysis of the PLC and GU mixtures after three years.

Figure 8.
Scanning electron micrographs and EDX mapping after three years: (a) PLC and (b) GU.
4. Conclusions
Based on the previous laboratory studies and field trial demonstrated herein, concrete incorporating PLC proved to be relatively better or equivalent to the conventional GU concrete used for pavements in terms of the requirements for production, placement, finishing, curing and quality control metrics (strength and penetrability). With the same mix design proportions, pavement concrete made with PLC had higher compressive strength and resistance to ingress of chloride ions after 28 days of placement. This was substantiated by the long-term performance of the pavement sections, as the PLC concrete had no visible signs of damage, except for the hand placement mix with relatively high w/b, which showed marginal surface scaling at the wheel path, after three years in service under harsh winter conditions. Correspondingly, the penetrability and microstructural analysis performed on concrete cores extracted at mid-slab and joint locations after three years showed that concrete incorporating PLC had better resistance to fluid ingress and comparable microstructural features to the counterpart concrete produced with GU cement. Thus, PLC may present a sustainable alternative to GU cement for concrete flatwork applications in cold regions. These conclusions are limited to the materials, methods and exposures adopted herein. Further investigations are recommended on the field performance of PLC-produced concrete under different exposures conditions such as sulphate and acid media with/without freezing and thawing as well as combinations.
Author Contributions
Conceptualization, A.Y., M.B. and A.G.; methodology, A.Y. and M.B.; investigation, A.Y. and A.G.; data curation, A.Y. and A.G.; writing—original draft preparation, A.Y.; writing—review and editing, A.G. and M.B.; supervision, M.B.; project administration, M.B. and A.G.; funding acquisition, A.G. All authors have read and agreed to the published version of the manuscript.
Funding
This research was funded by Mitacs and the City of Winnipeg.
Institutional Review Board Statement
Not applicable.
Informed Consent Statement
Not applicable.
Data Availability Statement
Not Applicable.
Acknowledgments
The authors acknowledge the IKO Construction Materials Testing Facility at the University of Manitoba, which was instrumental to this research.
Conflicts of Interest
The authors declare no conflict of interest.
References
- CSA A3001; Cementitious Materials for Use in Concrete. Canadian Standards Association: Mississauga, ON, Canada, 2018.
- Tennis, P.D.; Thomas, M.D.A.; Weiss, W.J. State-of-the-Art Report on Use of Limestone in Cements at Levels of up to 15%; SN3148; Portland Cement Association: Skokie, IL, USA, 2011. [Google Scholar]
- Wang, D.; Shi, C.; Farzadnia, N.; Shi, Z.; Jia, H. A review on effects of limestone powder on the properties of concrete. Const. Build. Mater. 2008, 192, 153–166. [Google Scholar] [CrossRef]
- ASTM C150/C150M; Standard Specification for Portland Cement. ASTM: West Conshohocken, PA, USA, 2021.
- ASTM C595/C595M; Standard Specification for Blended Hydraulic Cements. ASTM: West Conshohocken, PA, USA, 2021.
- EN 197-1; Cement—Part 1: Composition, Specifications and Conformity Criteria for Common Cements. European Committee for Standardization: Brussels, Belgium, 2000.
- NBR 11578; Cimento Portland Compost. Associação Brasileira de Normas Técnicas: Rio De Janeiro, Brazil, 1991.
- IRAM 50000; Cemento para uso genera. Instituto Argentino de Normalización y Certificación: Buenos Aires, Argentina, 2000.
- NMC-414-ONNCCE; Industria de la Construcción-Cementantes Hidráulicos-Especificaciones y Métodos de Ensayo. la Norma Mexicana: Mexico City, Mexico, 2017.
- Moon, G.D.; Oh, S.; Jung, S.H.; Choi, Y.C. Effects of the fineness of limestone powder and cement on the hydration and strength development of PLC concrete. Const. Build. Mater. 2017, 135, 129–136. [Google Scholar] [CrossRef]
- Amin, M.; Bassuoni, M.T. Response of concrete with blended binders and nanoparticles to sulfuric acid attack. Mag. Concr. Res. 2018, 70, 617–632. [Google Scholar] [CrossRef]
- Amin, M.; Bassuoni, M.T. Performance of concrete with blended binders in ammonium-sulphate solution. J. Sustain. Cem. Based Mater. 2018, 7, 15–37. [Google Scholar] [CrossRef]
- Ghazy, A.; Bassuoni, M.T.; Islam, A.K.M.R. Response of Concrete with blended binders and nanosilica to freezing–thawing cycles and different concentrations of deicing salts. J. Mater. Civ. Eng. 2018, 30, 04018214. [Google Scholar] [CrossRef]
- Ghazy, A.; Bassuoni, M.T. Response of concrete to cyclic environments and chloride-based salts. Mag. Concr. Res. 2019, 71, 533–547. [Google Scholar] [CrossRef]
- Tiburzi, N.B.; Garcia, J.; Drimalas, T.; Folliard, K.J. Sulfate resistance of portland-limestone cement concrete systems: Linking laboratory and field performances. Const. Build. Mater. 2020, 250, 118750. [Google Scholar] [CrossRef]
- Thomas, M.D.; Delagrave, A.; Blair, B.; Barcelo, L. Equivalent durability performance of portland limestone cement. Concr. Int. 2013, 35, 39–45. [Google Scholar]
- Bonavetti, V.; Donza, H.; Rahhal, V.; Irassar, E. Influence of initial curing on the properties of concrete containing limestone blended cement. Cem. Concr. Res. 2000, 30, 703–708. [Google Scholar] [CrossRef]
- CW3310-R17; Portland Cement Concrete Pavement Works. City of Winnipeg Specification, City of Winnipeg: Winnipeg, MB, Canada, 2015.
- ASTM C494/C494M; Standard Specification for Chemical Admixtures for Concrete. ASTM: West Conshohocken, PA, USA, 2019.
- ASTM C260/C260M; Standard Specification for Air-Entraining Admixtures for Concrete. ASTM: West Conshohocken, PA, USA, 2016.
- CSA A23.1; Concrete Materials and Methods of Concrete Construction. Canadian Standards Association: Mississauga, ON, Canada, 2019.
- ASTM C309; Standard Specification for Liquid Membrane-Forming Compounds for Curing Concrete. ASTM: West Conshohocken, PA, USA, 2019.
- Tiznobaik, M.; Bassuoni, M.T. Application of Curing Compounds on Concrete Pavements. Can. J. Civ. Eng. 2017, 44, 452–461. [Google Scholar] [CrossRef] [Green Version]
- ASTM D6690; Standard Specification for Joint and Crack Sealants, Hot Applied, for Concrete and Asphalt Pavements. ASTM: West Conshohocken, PA, USA, 2021.
- ASTM C143/C143M; Standard Test Method for Slump of Hydraulic-Cement Concrete. ASTM: West Conshohocken, PA, USA, 2020.
- ASTM C231/C231M; Standard Test Method for Air Content of Freshly Mixed Concrete by the Pressure Method. ASTM: West Conshohocken, PA, USA, 2017.
- ASTM C39/C39M; Standard Test Method for Compressive Strength of Cylindrical Concrete Specimens. ASTM: West Conshohocken, PA, USA, 2021.
- ASTM C1202; Standard Test Method for Electrical Indication of Concrete’s Ability to Resist Chloride Ion Penetration. ASTM: West Conshohocken, PA, USA, 2019.
- ASTM C672/C672M; Standard Test Method for Scaling Resistance of Concrete Surfaces Exposed to Deicing Chemicals. ASTM: West Conshohocken, PA, USA, 2019.
- Bassuoni, M.T.; Nehdi, M.L.; Greenough, T.R. Enhancing the reliability of evaluating chloride ingress in concrete using the ASTM C 1202 rapid chloride penetrability test. J. ASTM Int. 2005, 3, 1–13. [Google Scholar]
- Tiznobaik, M.; Bassuoni, M.T. A test protocol for evaluating absorption of joints in concrete pavements. J. Test. Eval. 2017, 46, 1636–1649. [Google Scholar] [CrossRef]
- Montgomery, D.C. Design and Analysis of Experiments, 9th ed.; Wiley: Hoboken, NJ, USA, 2017. [Google Scholar]
Publisher’s Note: MDPI stays neutral with regard to jurisdictional claims in published maps and institutional affiliations. |
© 2021 by the authors. Licensee MDPI, Basel, Switzerland. This article is an open access article distributed under the terms and conditions of the Creative Commons Attribution (CC BY) license (https://creativecommons.org/licenses/by/4.0/).