Abstract
Understanding evacuees’ responses to dynamic environmental changes, during an emergency evacuation, is of great importance in determining which aspects are ideal and which aspects should be eliminated or corrected. Evacuees differ in their ability to continually plan escape routes and adapt the routes chosen when they become unsafe owing to moving sources of threat. This is because they have different views and perspectives. The perspectives of evacuees are stochastic and are characterized by a high degree of uncertainty and complexity. To reduce the complexity and control of uncertainty, a model is proposed that can test for variant stochastic representations of evacuees’ perspectives. Two extremely realistic perspectives—the most ideal and the least ideal—are proposed to reasonably limit the range of variance. The success of achieving optimal evacuation is tested when different tendencies towards extreme perspectives are adopted. It is concluded that data toward the most ideal perspectives are capable of demonstrating safer evacuation by reducing the number of simulated burnt agents. This study enables crowd managers and fire safety researchers to test guidance systems as well as configuration of buildings using different perspectives of evacuees.
1. Introduction
Developing intelligent evacuation guidance systems is a major requirement for the correction of evacuees’ decision-making behavior, which can support safe and efficient evacuation under emergency conditions [1,2,3,4]. Computational technology plays a significant role in the design of intelligent evacuation systems [4,5]. It is responsible for investigating dynamic environmental changes that result from cases of emergency, such as the presence of dangerous sources and the prevalence of their threat. The dissemination of such information to evacuees has proven to be effective for optimal evacuation [4,6]. Technology, for example, the signage system, is capable of providing information for evacuees to follow optimal actions which are commensurate with the ongoing threat posed by these environmental changes.
To design reliable guidance systems, researchers must have prior knowledge to determine which aspects are ideal and which need to be eliminated or corrected to achieve an optimal evacuation in high-stress situations [7,8,9,10]. However, there is a poor understanding of individuals’ behavioral responses to threat sources (e.g., fires, earthquakes, terrorism, floods, gas leaks, bomb attacks, and biological agents). Such knowledge is difficult to obtain [11]. This is because the real reactions of individuals cannot be easily observed within the field [12]. On the other hand, conducting a field experiment when safety and ethical restrictions come into effect would be of limited benefit, as producing realistic incentives for fleeing from threat sources is not possible [13,14]. Therefore, evacuation in the presence of sources of threat needs to be simulated as an alternative field to produce the required information and test hypothetical suggestions to develop several intelligence-guiding systems [8,15,16]. This consideration encouraged model developers to improve several computer simulation models that can investigate and integrate different behavioral aspects of evacuees, including their interactions with different dynamic environmental changes during evacuation [15,16]. Knowledge that can be utilized is offered to develop several smart systems [17]. Different approaches for validating the proposed simulation models have been suggested [9,18,19,20]; data collection techniques, such as virtual reality experiments and surveys, have been proposed to reproduce virtual data for calibration and estimation [3,21,22,23]. Optimization strategies have been developed to optimize the configuration of simulated physical environments [23,24,25].
Exit and route choice models have become essential components for enhancing different evacuation model-based simulations, where such models play a crucial role in incorporating the decision-making function to render the evacuation process as realistic as possible. In this regard, the simulated evacuees (denoted here as ‘agents’) are provided with the function of searching for typical emergency exits among alternatives for evacuating in an efficient and safe manner [17]. Risky sources and obstacles were involved, and the impact of the resulting interactions with agents on evacuation efficiency was examined [4,26,27,28,29,30]. Haung et al. [26] modified the static floor field to incorporate the effects of internal obstacles on the evacuation process. Zheng et al. [27] introduced a fire floor field to consider the influence of the fire spreading rate on the evacuation efficiency. Cao et al. [28] introduced the visibility floor field and temperature floor field to simulate pedestrian evacuation during fire emergencies. Zheng et al. [30] introduced the smoke floor field and studied pedestrian movement behavior when the fire and smoke spread dynamically. Further intelligence has been incorporated by endowing particular agents with the function of planning and adapting their routes for overtaking moving threat sources or passing them. Joo et al. [31] developed an affordance-based finite-state automata model to provide agents with the ability to interact with emergent environmental changes, such as the spread of fire, based on the information perceived in the agents’ visible areas. Shuaib [32] provided agents with the ability to assign intermediate points as intermediate destinations on their routes to overtake the spread of fire. Lee et al. [33] considered the transition probability based on a weighted static floor field to allow agents to detour to an exit with the lowest risk.
Route planning strategies in the previous literature do not include variability in the perspectives and decisions of evacuees, particularly when they engage in interactions with threat sources. This is because these strategies mainly rely on the ability of agents to perceive only their own visual area [19,23,31,32,33]. In invisible areas, routes are usually planned by modelers for optimal evacuation, or are left to be planned in a series of future actions within the implementation of the model. In reality, the evacuees differ in anticipation of the dynamic spread of a threat from moving sources. They are diverse in their awareness, exploration, and appreciation of the dynamic behavior of environmental changes brought about by these sources. The variation increases when such sources have structures that hide a part of their background region associated with their destination. Thus, uncertainty becomes a prominent feature in the perspective of agents. There is a lack of experimental and empirical research that can introduce the uncertainty of agents’ perspectives.
This limitation prevents crowd managers and fire safety researchers from applying different realistic evacuation scenarios to reliably test guidance systems and building layouts. This paper contributes to overcoming this shortcoming by enhancing the ability of agent-based models to provide different perspectives of evacuees to cover all potential behavioral aspects of a real evacuation.
The organization of this paper is as follows. Section 2 provides a brief review of literature on evacuation simulation models and decision-making functions related to the process of selecting routes and exits between alternatives. Section 3 describes how a stochastic distribution was developed to present different directions of uncertainty in agents’ perspectives when planning and adapting their paths for safe evacuation. In Section 4, relevant simulations are presented, and in Section 5, the results are analyzed and discussed. Finally, in Section 6, we draw our conclusions.
2. Literature Review
2.1. Evacuation Simulation Models and the Social Force Model
Numerous simulation models have been developed, which are separated into macroscopic and microscopic models. Macroscopic models are more concerned with the behavior of the entire crowd. These models are often based on traffic flow, queuing theory, or fluid or continuum mechanics [34]. The second category comprises microscopic models. The latter models are mainly concerned with detailed interactions among pedestrians and between them and their physical environments. A variety of microscopic models include the social force model (SFM) [35], cellular automata model (CA) [36,37], lattice gas model [38,39], and agent-based models [24,40]. Microscopic models are arguably superior. They are capable of involving detailed interactions and the production of self-organizing phenomena, such as lane formation, clogging at exits, and faster is slower effects. The navigation in microscopic models is within an operational level of behavior, where all aspects of the detailed interactions represent instantaneous decision-making aspects.
The SFM is considered one of the most vital models and is characterized by terms that are capable of formulating and accommodating aspects of crowd dynamics, introducing self-organization phenomena [41,42,43], and reproducing real-life data [44,45]. Extensions of the SFM can enhance the capability for accommodating and controlling various walking behaviors, such as avoiding groups [22,46], penetrating jammed crowds [47] and walking competition [48,49], which are essential factors in comprehending the ‘faster is slower’ phenomenon [50,51]. The agents in the SFM are self-driven particles, where each agent m is motivated to adapt its actual velocity to reach the velocity it prefers to walk, called the preferred velocity. This motivation is expressed as a force called the driven force. The acceleration of the agent’s motion is caused by a semi-Newtonian equation expressed in terms of the driven force and social and physical forces exerted by different objects (e.g., agents and obstacles) surrounding the agent within a physical environment. There are two types of social forces. These forces comprise the repulsion force that represents the model of the repulsive motivation within agent m to avoid agent l, and the attraction force that represents the model of the attractive motivation within agent m toward the agent l [35]. Physical forces arise in a contact situation occurring among agents [50], which are modeled as linear functions in analogy with granular forces. The navigation of agents in the SFM is within an operational level of behavior, where all aspects of its components represent instantaneous decision-making aspects.
2.2. Exit Choice Models
Model developers have introduced a series of improvements in their microscopic simulations to involve realistic aspects of decision making in the evacuation process, such as the abilities of evacuees to find routes, choose exits, and escape from threat sources. The underlying assumption of these aspects is that evacuees are expected to seek a typical emergency exit among the alternative exits to achieve safe evacuation. These aspects fall within tactical level behavior [52]; they are activated by short-range decisions made by evacuees, and result in preferred velocity and direction toward a preferred exit. Within this context, several studies have developed exit and route choice models to be integrated with microscopic simulation models; thus, evacuees’ navigation methods can be implemented according to many behavioral levels. Among them are models applied to CA simulation models, such as game theory-based models [53,54], logit-based exit choice models [21,26,55,56], and agent-based exit choice models [33,40]. Exit choice models have also been integrated within continuous space simulation models [29,57,58,59].
Several strategies have been adopted in exit choice models to implement optimal evacuation (see [29] and references therein). Cost minimization is a common strategy that underlies individual rational decisions during the escape process. In a normal evacuation, agents commonly search for routes that are the shortest or are considered rapid or comfortable the most [57]. Regarding safe routes, they are the instinct choice under risk conditions [29,32,33], where the time disutility computation for every exit is affected by the risk produced by the spread of a threat. The choice model adopted in [29] is the basis underlying the contribution of this paper.
2.3. Rule-Based Exit Choice Model and Problematic Issue
In [29], the main factors that influence the evaluation process for selecting the appropriate exit include the length of the direct route to the exit, the expected crowd that could block the exit upon arrival, and the risks posed by the source threatening the direct route. Based on the three factors indicated, the disutility time for each agent to evacuate from any exit is approximated (see Appendix A). An exit with minimal time disutility is the best option for the agent to choose. The agent replaces the current preferred direction with a new direction towards the best exit which gives the agent a worthwhile utility (see Appendix A). The resulting general direction is used for operational navigation based on the SFM. The model was modified by improving the agents’ capability to design alternative routes for an exit when it is impeded by a risky source [32]. The right and left routes are composed by detecting the right and left intermediate points that connect the agent to the exit. The route with the least time disutility would be the representative route for the exit. The contribution in [32] increased the opportunity to overtake a moving risky source. However, the contribution involves one exceptional perspective when planning and adapting routes, which is proven in this study to represent the least ideal perspective. In real scenarios, evacuees vary in the exploration process within two ideal perspectives: least and most ideal. The guidance provided by the computational instruments is considered the most ideal perspective. Assigning specific values that reflect real evacuees’ perspectives is stochastic. In addition, they are extremely difficult to estimate because of the lack of a behavioral dataset. The contribution in this paper is an extension to the route planning proposed in [32]. Our approach is that route planning is subject to stochastic assignment through a proposed stochastic model, which helps in achieving the objectives of testing and analyzing many different perspectives.
3. Methodology
3.1. Exit and Route Choice Methodology
In most physical environments, it is common to find multiples of predesigned routes to one exit as margins or walkways among blocks of chairs or other fixed objects. Agents are usually simulated to follow one of the predetermined routes that are characterized by a minimum time disutility. When predetermined routes become blocked by obstacles or become unsafe, the straight path connecting the agent to the exit is the default route (direct route) that would intuitively be chosen owing to its minimum time disutility. In the case of an unsafe or impeded direct route, the agent starts exploring the visible left and right areas of the direct route to create new routes. Accordingly, the agent constitutes a new alternative route set for this exit that assists in exiting conveniently or safely [32]. The agent’s exploration would be limited to a reasonable angle from the direct route to both sides, where exceeding such an angle on one side reveals that no routes could be planned for the considered exit. In an expected manner, every impeded direct route is associated with the left and right routes as a temporary set of routes updated and created continually, as long as the direct route is deemed unsafe or obstructed. One of the left and right routes, which has the minimum time disutility, is chosen as the representative exit route. When safe conditions are nonexistent within the considered area of exploration, a temporary set cannot be formed. Thus, this exit is eliminated from the exit choice set. When the exit choice set becomes empty, the agent explores alternatives other than exits, such as corridors, stairs, or moving in a direction against the source of the threat. The last alternatives are considered optimal destinations when conducting the decision-making process. Thereby, a representative route that connects each agent with each exit is presented. Thus, each agent has his own set or representative routes that fit in with the existing exits. As shown in the previous literature, the agent chooses the exit with minimum of time disutility as the best option. When the best option results in a worthwhile utility, the agent replaces the existing preferred direction with a new direction towards the best exit along the associated representative route, and the new direction is used for operational navigation based on SFM. Figure 1 below shows a set of tactical and operational decisions when an evacuation is performed within a single tactical time step. The right-hand portion of the flowchart in Figure 1 shows the algorithm of the decision-making process when assigning a representative route connecting the m-factor to the k-exit.
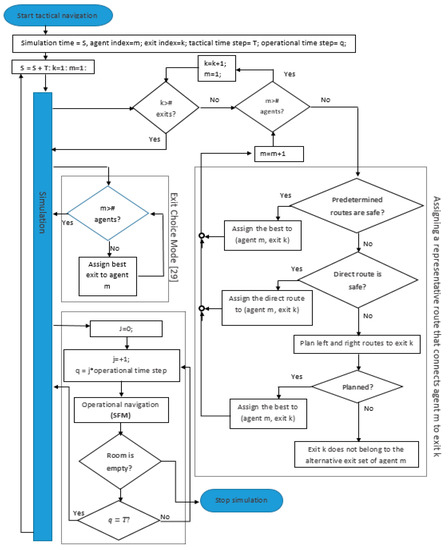
Figure 1.
The flowchart of the evacuation simulation framework resulted from the integration of tactical and operational decision-making processes. The right-hand portion of this flowchart shows the algorithm of the decision-making process when assigning a representative route connecting the m-factor to the k-exit.
3.2. Route Planning Methodology
Evacuation in a safe manner is the strategic goal. This should be taken into account when giving agents the capability to plan their routes. The alternative route (right or left) is generally introduced as a composition of sub-routes, which are connected by a sequence of intermediate points. The process of composing a route is associated with an agent’s ability to detect intermediate points that represent the process of translating long-range spatial explorations into tactical-level behavior. For simplicity, it is presumed that all agents are familiar with the locations of the exits and the environment. Every agent can efficiently explore the observable dynamic behavior of a moving obstacle. The agent can predict the visible area that will be occupied by obstacles in the near future. Therefore, the agent can effectively detect the optimal initial intermediate point. Based on this information, the initial sub-route that connects the agent to the first intermediate point is determined. A similar process is implemented by an agent in the case of encountering a risky source. However, the agent becomes aware of the safest initial intermediate points detected with a minimum distance to the predicted spread of the threat at the moment of arrival (see Figure 2a, for example). At this stage, the agent can only guarantee a safe visible sub-route.
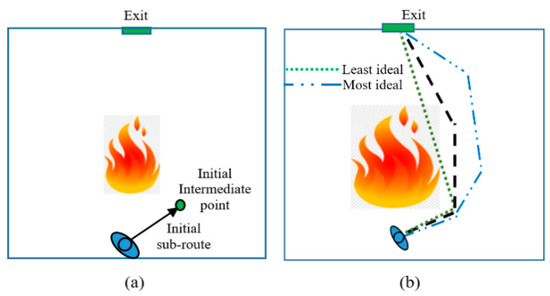
Figure 2.
In (a) the small green circle represents a safe intermediate point in which an agent could arrive before the fire gets near. In (b), three routes are planned for the agent from different perspectives: the green for the least ideal perspective, the blue for the most ideal perspective, and the black route, which is one from infinitely many that can be represented between the extreme routes.
Agents have different perspectives in exploring the back-end design of the sources and the unseen dynamic environmental behavior behind them. Thus, they differ in configuring the remainder of the planned route (remaining sub-routes) and estimating the time disutility for the hidden parts. However, such variation is definitely confined between two extreme perspectives: the perspective that is the least ideal and the perspective that is the most ideal (see Figure 2b).
The least ideal perspective is attributed to agents who neglect the dynamics and structure of the hidden parts of the source. The most ideal perspective is attributed to agents who have an excellent ability to explore the dynamic behavior of hidden parts and are fully aware of their safety and comfort. All the potential perspectives confined by these two extreme perspectives are attributed to the remaining agents. Based on the perspective value, the agent plans for its route and estimates its time disutility. Calculating the time disutility for the planned route is sufficient to make a preference between the alternate sides (left and right) and, accordingly, to follow the initial sub-route on the preferred side. This idea is exploited to provide a stochastic model of agents’ perspectives; thus, there is no need to plan the remaining routes (except for the extreme routes) because the time-disutility computation can be performed in terms of the perspective factor and extreme routes. Note that the initial sub-route setting by an agent is identical, regardless of its perspective. In addition, the agent is highly susceptible to planning a new initial sub-route before or at the initial intermediate point.
3.3. Composing Extreme Route
As presented in the previous subsection, all agents guarantee a safe initial sub-route. However, from the least ideal perspective, the agent is in hope that the second invisible sub-route connects the initial intermediate point safely and directly along the center of the exit. Although it is the worst case of finding a safe route, it produces the minimum time disutility. However, from the most ideal perspective, the detection process for the remaining intermediate points is determined by an iterative algorithm (see Figure 3). In each iteration, based on the input information, an intermediate point and the expected layout of the threat are predicted and introduced as new input information for a new prediction in the next iteration. Consequently, a predictable visible graph is introduced, and a subsequent intermediate point is detected (based on the same principle of detecting the initial intermediate point). This process continues iteratively until the terminal sub-route is created, which is linked to the center of the exit. The resulting route is deemed the ideal route and possesses minimum time disutility with the guarantee of safety.
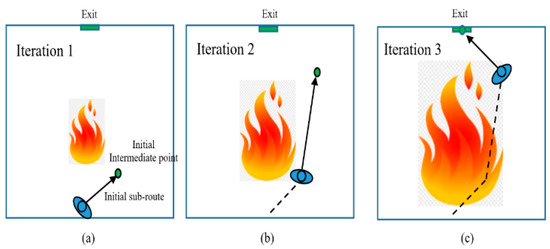
Figure 3.
(a) The initial detection process for safe initial intermediate point. (b) Second iteration in the detection process for second intermediate point, given new location for the agent in the initial intermediate point and the predicted spread of the fire. (c) Third iteration for third intermediate point (in this example the exit is the destination and therefore this is the last iteration).
The input information for every iteration is related to the continuous expansion of the threat. We represent the floor of the layout as a grid of cells that provides a predictable threat at any specific future time. The threat of cell denoted by , represents the expected time in which the cell becomes impassable because it is occupied by the source—harmful, toxic, or deadly. In this study, the spread of the threat is estimated by averaging the speed of the threat over a period ending at the time of the estimate. The value means that the cell is occupied, impassable, toxic, or deadly. A positive value indicates the time required for the cell to hold a value of zero.
Assume that the visible spread behavior is approximately regular and that the shape of the source with its associated threat is a polygon (see Figure 4). Subsequently, it is sufficient to consider only the spread of the far edges seen by the agent. The agent explores two lines that are normal on the boundary and pass through the far left and right edges. Specifically, the agents investigate the cells, which are located on the safe portions of normal lines.
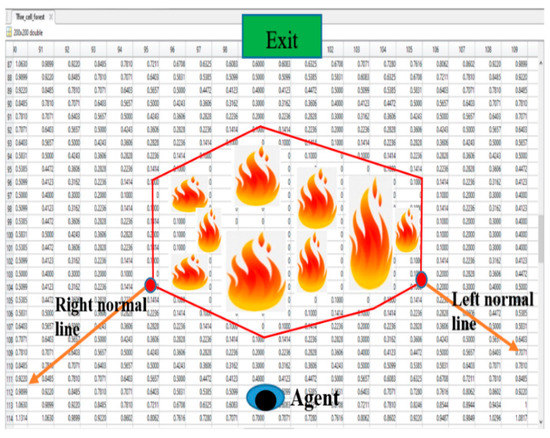
Figure 4.
The threat floor field, which is defined as a grid composed of cells of size . The value of each cell represents the time in which the fire will reach the cell according to the spread average rate of the threat.
The safety of cell to agent , denoted by , represents the discrepancy time between the agent’s arrival time to the cell, and . The safety of cell is computed as follows:
where the factor denotes the precautionary time, which represents the natural evacuees’ behavior that maintains the distance from a source of threat to protect them from an unexpected sudden spread of the threat. Positive and negative values of the imply that the cells are safe and unsafe, respectively. The left and right intermediate points are the cells located at the left and right normal lines, respectively, and have minimum safe times.
3.4. Extreme Route’s Time Disutility
A generalization of the model proposed in [32] is employed to estimate the time disutility of the direct and extreme routes proposed in the previous section. The time disutility of an alternative route for agent m to exit is introduced as:
where the subscript denotes one of the alternatives: left, right, and direct; denotes the sub-route terminated at the intermediate point ; denotes the initial sub-route connecting the agent to the initial intermediate point; the upper bound of the sum, represents the number of intermediate points, including the center of destination: for the direct route and 2 for agents with the least ideal perspective; and is the uncertainty when calculating the disutility of sub-route . Because the exploration process for agents with the most ideal perspective is assumed to be sufficiently accurate and guaranteed to be safe, for all There is no consideration for crowd clogging because all alternatives are related to one exit (. Finally, a time step is utilized as an increment to activate the process of detecting intermediate points, planning the route, and estimating its time disutility in a constant manner. Therefore, route planning is an adaptive model. The time step applied to the exit choice model (see Appendix A) conforms to multiples of , and the latter conforms to multiples of the operational time step applied to the social model. Hereafter, we ignore the independent variable in all route planning equations.
3.5. Stochastic Model for Agents’ Perspectives and Time Disutility
Computing time disutility for an unplanned route (imaginarily planned) is only in order to make the preference between the alternate sides (left and right), and thus, following the initial sub-route on the preferred side. Agents’ perspectives are mostly adopted within the extreme perspectives corresponding to the extreme routes. The value of the agent’s perspective was stochastically assigned at the end of this section. Based on this value, the time disutility of imaginary planned routes is estimated. For the least ideal perspective, a value of 0 is assigned. The most ideal perspective is assigned a value of 1. The range of perspective values lies within the range of [0, 1]. The time disutility for the imaginary route is estimated as a linear combination of the least and most ideal routes as follows:
A high perspective value indicates high time disutility. This increases the probability of leaving the route for an alternative route or exit. As for the low perspective value, it is the opposite.
There are two cases in which extreme routes cannot be planned. The first case is when the initial intermediate point is located outside the environment (the initial sub-route intersects the boundary of the physical environment). No route was considered in this exploration. The second case is when an intermediate point other than the initial one is located outside; thus, the most ideal route is not planned. In the latter case, an intermediate route, , is designed. It is composed of two parts: the sub-routes, which have the agent’s location connected to the intersection point with the boundary, and the sub-routes that are constituted by the margins along with the boundary that connects the intersection point to the exit. The indeterminate route is associated with an intermediate perspective, denoted by the , and is computed as follows:
The agent with a perspective value greater than the eliminates the concerned alternative route from the determined choice set because of the agent’s awareness of its impracticality.
If it is assumed that no perspective is more likely than another, the perspective factor is introduced as a variable that is uniform random, . The uniform random variable has the property that all values between zero and one are equally likely. However, this distribution does not model a variety of datasets. There is a lack of empirical studies that monitor potential trends in evacuees’ perspectives. Conducting a virtual study can help produce useful data that can show the likely direction of evacuees’ perspectives. This is the subject of future research. In this study, in the simulation part, the perspective factor is modeled as a skewed normal distribution, which is a continuous probability distribution that generalizes the normal distribution to allow for non-zero skewness; thus, it is capable of assuming the characteristics of many kinds of distributions and is sufficiently flexible to model various datasets.
3.6. The Decision for the Representative Route
The best route among the alternative route set for exit k is determined as follows:
The decision to replace the best route as a new representative route instead of the current representative route is made when the best route provides a worthwhile utility . Thus, the representative route for exit is as follows.
where
4. Simulation
The goal of this section is to perform simulations to examine the impact of the proposed model. In the 1st subsection, we propose a stochastic distribution that can generate various types of datasets pertaining to the perspective factor. In the 2rd subsection, simulations are conducted. In the 3rd subsection, the results are analyzed, and the factors that affect measurable parameters, such as the number of evacuated agents, burned agents, confined agents, and agents of unknown destiny, are introduced.
4.1. The Suggested Stochastic Distribution
This subsection displays the impacts of various trends in an agent-perspective distribution on the evacuation process and agent status. The perspective data is offered by the skewed normal distribution, which has a probability density function, as shown below:
where denotes the standard normal probability density function and denotes the corresponding cumulative distribution function. The parameters denote the location (mean) and scale (standard deviation) parameters, respectively. The parameter is used to increase and decrease the absolute value of the skewness. If , the distribution is right-skewed. On the other hand, if , the distribution is considered left-skewed. Consequently, we can model symmetric data, right-skewed data that have a trend toward the least ideal perspective (location ), or left-skewed data, which have a trend toward the most ideal perspective (location ). Figure 5 shows two examples of time disutility data produced by applying Equation based on two different trends within a perspective distribution. Accordingly, three sets of simulations are conducted to examine the evacuation process based on three types of perspective data: symmetric perspective data, right-skewed data (most ideal simulation), and left-skewed data (least ideal simulations).
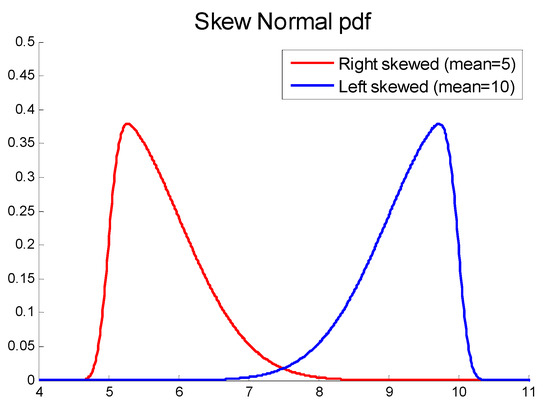
Figure 5.
Two curves to show time disutility confined between least ideal time disutility = 5 and most ideal time disutility = 10, for specific values stated in the figure.
4.2. Simulation
Evacuation of 100 agents is investigated in this study. The agents are distributed randomly into the lower half of the two rooms with dimensions of 20 × 20 m (see Figure 6). The agents intend to leave the simulated environment as quickly as possible by escaping the spread of the threat. The left room has only one exit to the right room, and the right room has two emergent exits located at the right wall. Fire is taken as the source of the threat to be initialized in particular cells, approximately in the middle part of the right room. The fire in each cell spreads horizontally to the four surrounding cells according to the probabilistic random variable and vertically according to . A staircase exists at the upper wall, which leads to an unknown and likely unsafe destination. Thus, it is a choice when there is a lack of alternatives. The simulations are terminated when exits are burned. Such termination leads to the following agent states: evacuated agents, burned agents, confined agents, and unsafe destiny agents. In Table 1, the values of the common parameters used in the simulations are estimated.

Figure 6.
The least ideal simulations: (a) the entering agents are more attentive to the selection of the lower exit; (b) the entering agents gradually alter their choices toward the upper exit; (c) the lower exit becomes completely unsafe and entering agents are collectively walking towards the upper exit; and (d) all exits become under threat, and the remaining agents direct their motions toward the stairs.

Table 1.
The description and values of common parameters that are used in the simulations.
5. Results and Discussion
The initial evacuation behaviors in all the simulations were found to be the same. In the left room, the agents escaped to the right. In the right room, the decision behaviors of agents are primarily governed by their initialized locations: agents initialized in the lower part select the lower exit because of lower time disutility, and other agents initialized in the upper part select the upper exit because of the lighter accumulated crowd found at the exit. When the spread of fire is perceived, agents entering the right room behave differently, according to their perspectives.
In the least ideal simulations, at a physical time that is equal to 4s, the directed routes become impeded, the crowd at exits becomes hidden, and the least ideal route of entering agents moving towards the lower exit is significantly shorter than the least ideal route towards the upper exit. As a result, the entering agents are further attentive to choosing the lower exit (see Figure 6a). As seen in Figure 6b, the area between the fire and the lower wall decreases significantly, and correspondingly, the risk of right routes towards the lower exit increased.
Thus, entering agents gradually alter their choices toward the upper exit. A dramatic change in evacuation behavior is shown in Figure 6c. The lower exit becomes completely unsafe, and accordingly, inappropriate but inevitable evacuation behaviors occur:
- Entering agents are collectively walking towards the upper exit, although it is impractical.
- Agents clogging lower exits are leaving for alternatives (the upper exit and the lower right corner) to escape the threat of fire.
- The accumulated agents at the lower exit are exposed to fire. They are in blocked situations. Thus, pushing behaviors are dominant when escaping from the fire.
- The agents next to the lower wall retreat. Some agents become confined and threatened by fire.
The negative observations are consequences of decisions produced from the least ideal perspective. In Figure 6d, all exits become under threat, and the remaining agents direct their motions toward the stairs. A few agents (entering agents and retreating agents) are confined to the lower left corner of the right room.
In the most ideal simulations, most agents have their planned routes based on the most ideal perspectives. Three seconds after initialization, the entering agents direct their motions toward the upper exit because of less risk-time disutility of routes associated with the upper exit than those associated with the lower exit. This behavior emerges earlier compared to the least ideal simulations because the most ideal right route to the lower exit is longer than the least ideal right route and closer to the right lower wall (that is, smaller cross-sections to the most ideal right route are accounted for, which results in a higher risk value and a higher risk-time disutility). Thus, most entering agents choose the upper exit (see Figure 7a,b). In contrast, a more considerable change in behavior is observed in Figure 7c than that in the least-ideal simulations shown in Figure 6c, which displays a more effective evacuation behavior, as shown below:

Figure 7.
The most ideal simulations: (a) most entering agents direct their motions toward the upper exit; (b) few agents start direct their motions toward the stairs; (c) the number of agents fleeing towards the stairs increases due to the impracticality of the upper exit; (d) all exits become under threat and the remaining agents direct their motions toward the stairs.
- Most agents make decisions by escaping toward the stairs because of the impracticality of the upper exit.
- The lower exit is threatened by fire. However, a few agents accumulate and leave the lower exit to the upper exit.
- No agents were found to be burned by the fire. No blocked agent pushed each other.
- No agents were found retreating back towards the lower wall.
In Figure 7d, fewer agents are confined to the lower left corner of the right room in comparison with the least ideal simulation. These agents were the last to enter the room, and the route towards the stairs was found to be unsafe.
The situation when performing simulations with a symmetric distribution is moderately significant (as recorded in Table 2). Although the same initialization emerges, the agents left the choice of the lower exit earlier. Thus, less accumulation was encountered at the lower exit and there was no retreating back in comparison with the least ideal simulations.
Table 2.
The means of the number of evacuated, burned, confined and unknown destiny agents for the least, moderate and most ideal simulations.
Figure 8 shows the accumulated number of exiting agents from the lower and upper exits versus the time steps for both simulation sets. The evacuation of the accumulated flow from the corresponding upper exits ends at approximately the same time but at a different time from the corresponding lower exits. In fact, the former result is related to the similar spread of fire toward the exits. The latter is attributed to the significant difference in the number of agents evacuated from the lower exit, where the accumulated agents at the lower exit are fewer in the most ideal simulations.

Figure 8.
The accumulated numbers of the exiting individuals for the entire agents.
Table 2 displays the means of the numbers of evacuated, burned, and confined agents for both sets. Unsafe destination agents were also recorded. Within the upper exit, the mean values are approximately equal. In contrast, the mean of the number of agents evacuated from the lower exit in the least ideal simulations was higher than that in the most ideal simulations. This could deceptively suggest that the least perspective agents are more capable of carrying out an efficient evacuation than the agents following an intelligent guiding system or having the most ideal perspectives. Table 2 presents a contrasting conclusion. In the least ideal simulations, there are a significant number of burned agents, whereas in the most ideal simulations, it is rare to find such states. However, the numbers of agents directed toward the stairs are higher in the most ideal simulations than in the least ideal ones. In fact, the unknown destiny of agents following the stairs is a major factor in the judgment of safety and efficiency. It is worth noting that the burned agents are among those who select the lower exit, whereas no such states are found among those who select the upper exit. This is because of the high clogging at the lower exit, and the lack of safe alternatives. The accumulated agents at the lower exit are incapable of finding another choice when their exits become threatened through the acceptance of a choice upward through to the upper exit (unsafe route) and downward to the lower wall.
These findings are important in the real-world context. For the optimal configuration of a building, it is very important to provide facilities that can provide a type of safety close to the exits that are most likely to be chosen during emergency evacuation. When the chosen exits are blocked and alternative exits are not available, these facilities can be the only shelters, increasing the chance of survival.
6. Conclusions
In this study, a stochastic distribution was proposed, and a corresponding route planning model was presented. Two trends were proposed and tested for the perspective data. They comprise data toward a less ideal perspective, which represents the superficial investigation of different environmental changes, and the data toward the most ideal perspective, which represents the perspective provided by intelligent systems. It was concluded that data toward the most ideal perspectives are capable of demonstrating safer evacuation by reducing the number of simulated burned agents. However, the destiny of fleeing agents is mainly determined by the configuration of the simulated physical environment. Therefore, using the proposed model for a comprehensive workflow to test different configurations could enable fire safety researchers to provide an optimal building profile and develop guidance systems. This study demonstrates the significance of developing a decision-support system for crowd management that can acquire accurate information about the existing threat and its dynamic behavior for providing evacuees with accurate information and enabling them to make decisions that are smart and effective.
Testing and validating the proposed model against empirical data are basic requirements for a realistic agent-based model. Because there are no real behavioral data against the spread of fires, a virtual reality experiment will be conducted in our future work to produce virtual data that represent the most likely direction of the perspectives of evacuees. On the other hand, conducting virtual reality experiments is very important for investigating many behavioral factors, such as reluctance to choose routes and utility thresholds for changing decisions. It is recommended that these factors be tested and verified to obtain a realistic route-planning model. Further improvements will be made using the risk factor model. This factor plays a major role in evacuees’ decisions regarding route preference. In addition, the preservation of agents from direct exposure to a threat will be presented by modeling the precautionary time factor based on the maintenance of a dynamically changing minimum distance with respect to agent safety. It is also recommended to run a simulation in a large building to test the impact of our contribution on a large scale.
Funding
This research was funded by Deputyship for Research & Innovation, Ministry of Education in Saudi Arabia, grant number IFG-IMAMU-5101.
Institutional Review Board Statement
Not applicable.
Informed Consent Statement
Not applicable.
Data Availability Statement
Not applicable.
Acknowledgments
The authors extend their appreciation to the Deputyship for Research & Innovation, Ministry of Education in Saudi Arabia, for funding this research work through the project number IFG-IMAMU-5101.
Conflicts of Interest
The author declares no conflict of interest.
Appendix A
In [29]: the time disutility at time for agent for evacuating from exit is approximated based on the following:
where denotes the distance length of the representative route (direct route) of Exit chosen by agent , denotes the average rate of passing Exit , denotes the number of clogging agents predicted by the Agent , and the factor denotes the repulsive effect caused by the presence of a source of threat and its dynamic spread on Exit . The size of time step,, is the assumed simple reaction of agent m for revising its decision. The best exit is the one with a minimum disutility as follows:
The agent replaces his current preferred direction with a new direction toward the best exit that gives the agent a worthwhile utility, denoted by as shown below:
where is the direction used in the preferred velocity of agent in the Social Force Model (SFM).
References
- Wijermans, N.; Conrado, C.; van Steen, M.; Martella, C.; Li, J. A landscape of crowd-management support: An integrative approach. Saf. Sci. 2016, 86, 142–164. [Google Scholar] [CrossRef] [Green Version]
- Martella, C.; Li, J.; Conrado, C.; Vermeeren, A. On current crowd management practices and the need for increased situation awareness, prediction, and intervention. Saf. Sci. 2017, 91, 381–393. [Google Scholar] [CrossRef]
- Haghani, M. Optimising crowd evacuations: Mathematical, architectural and behavioural approaches. Saf. Sci. 2020, 128, 104745. [Google Scholar] [CrossRef]
- Balboa, A.; González-Villa, J.; Cuesta, A.; Abreu, O.; Alvear, D. Testing a real-time intelligent evacuation guiding system for complex buildings. Saf. Sci. 2020, 132, 104970. [Google Scholar] [CrossRef]
- Al-nasur, S.J.; Wadoo, S.A.; Shende, A.; Kachroo, P. Pedestrian Dynamics: Feedback Control of Crowd Evacuation; Springer Science & Business Media: Berlin/Heidelberg, Germany, 2008. [Google Scholar]
- Li, X.; Geng, Z.; Kuang, H.; Bai, X.; Fan, Y. Effect of dangerous source on evacuation dynamics in pedestrian counter flow. Phys. A Stat. Mech. Appl. 2019, 533, 122047. [Google Scholar] [CrossRef]
- Vreugdenhil, B.J.; Bellomo, N.; Townsend, P.S. Using crowd modelling in evacuation decision making. In Proceedings of the ISCRAM 2015 12th International Conference on Information Systems for Crisis Response and Management, Kristiansand, Norway, 24–27 May 2015. [Google Scholar]
- Song, Y.; Liu, J.; Liu, Q. Dynamic decision-making process of evacuees during post-earthquake evacuation near an automatic flap barrier gate system: A broken windows perspective. Sustainability 2021, 13, 8771. [Google Scholar] [CrossRef]
- Wang, H.; Xu, T.; Li, F. A novel emergency evacuation model of subway station passengers considering personality traits. Sustainability 2021, 13, 10463. [Google Scholar] [CrossRef]
- Kim, H.; Kim, J.; Rie, D. A study on the application of the safety practice index to reduce safety accidents in the manufacturing industry. Sustainability 2021, 13, 10990. [Google Scholar] [CrossRef]
- Shipman, A.; Majumdar, A. Fear in humans: A glimpse into the crowd-modeling perspective. Transp. Res. Rec. 2018, 2672, 183–197. [Google Scholar] [CrossRef] [Green Version]
- Haghani, M.; Sarvi, M.; Rajabifard, A. Simulating indoor evacuation of pedestrians: The sensitivity of predictions to directional-choice calibration parameters. Transp. Res. Rec. 2018, 2672, 171–182. [Google Scholar] [CrossRef] [Green Version]
- Berg, M.V.D.; van Nes, R.; Hoogendoorn, S. Estimating choice models to quantify the effect of herding on the decision to evacuate: Application of a serious gaming experimental setup. Transp. Res. Rec. 2018, 2672, 161–170. [Google Scholar] [CrossRef] [Green Version]
- Musharraf, M.; Smith, J.; Khan, F.; Veitch, B.; MacKinnon, S. Incorporating individual differences in human reliability analysis: An extension to the virtual experimental technique. Saf. Sci. 2018, 107, 216–223. [Google Scholar] [CrossRef]
- Wattanasaeng, N.; Ransikarbum, K. Model and analysis of economic- and risk-based objective optimization problem for plant location within industrial estates using epsilon-constraint algorithms. Computation 2021, 9, 46. [Google Scholar] [CrossRef]
- Chanthakhot, W.; Ransikarbum, K. Integrated IEW-TOPSIS and fire dynamics simulation for agent-based evacuation modeling in industrial safety. Safety 2021, 7, 47. [Google Scholar] [CrossRef]
- Kuligowski, E.D.; Peacock, R.D.; Hoskins, B.L. A Review of Building Evacuation Models, 2nd ed.; US Department of Commerce: Washington, DC, USA; National Institute of Standards and Technology: Gaithersburg, MD, USA, 2010.
- Haghani, M.; Sarvi, M. Stated and revealed exit choices of pedestrian crowd evacuees. Transp. Res. Part B Methodol. 2017, 95, 238–259. [Google Scholar] [CrossRef]
- Ransikarbum, K.; Kim, N.; Ha, S.; Wysk, R.A.; Rothrock, L. A highway-driving system design viewpoint using an agent-based modeling of an affordance-based finite state automata. IEEE Access 2017, 6, 2193–2205. [Google Scholar] [CrossRef]
- Sargent, R.G.; Balci, O. History of verification and validation of simulation models. In Proceedings of the 2017 Winter Simulation Conference (WSC), Las Vegas, NV, USA, 3–6 December 2017; pp. 292–307. [Google Scholar] [CrossRef]
- Dias, C.; Lovreglio, R. Calibrating cellular automaton models for pedestrians walking through corners. Phys. Lett. A 2018, 382, 1255–1261. [Google Scholar] [CrossRef]
- Huang, L.; Gong, J.; Li, W.; Xu, T.; Shen, S.; Liang, J.; Feng, Q.; Zhang, D.; Sun, J. Social force model-based group behavior simulation in virtual geographic environments. ISPRS Int. J. Geo-Inf. 2018, 7, 79. [Google Scholar] [CrossRef] [Green Version]
- Zhiming, F.; Xingpeng, X.; Lixue, J.; Xiaolian, L.; Nan, H. Study on the exit-selecting behavior in underground indoor space with fire using a virtual experiment. Tunn. Undergr. Space Technol. 2021, 112, 103936. [Google Scholar] [CrossRef]
- Peizhong, Y.; Xin, W.; Tao, L. RETRACTED: Agent-based simulation of fire emergency evacuation with fire and human interaction model. Saf. Sci. 2011, 49, 1130–1141. [Google Scholar] [CrossRef]
- Xie, Q.-M.; Wang, J.-H.; Wang, P.-C.; Wang, W.; Jiao, Y.; Guo, J. The optimization for location of building evacuation exits considering the uncertainty of occupant density using polynomial chaos expansion and genetic algorithm. Procedia Eng. 2018, 211, 818–829. [Google Scholar] [CrossRef]
- Huang, H.-J.; Guo, R.-Y. Static floor field and exit choice for pedestrian evacuation in rooms with internal obstacles and multiple exits. Phys. Rev. E 2008, 78, 021131. [Google Scholar] [CrossRef] [PubMed]
- Zheng, Y.; Jia, B.; Li, X.-G.; Zhu, N. Evacuation dynamics with fire spreading based on cellular automaton. Phys. A Stat. Mech. Appl. 2011, 390, 3147–3156. [Google Scholar] [CrossRef]
- Cao, S.; Song, W.; Lv, W.; Fang, Z. A multi-grid model for pedestrian evacuation in a room without visibility. Phys. A Stat. Mech. Appl. 2015, 436, 45–61. [Google Scholar] [CrossRef]
- Shuaib, M.M. Incorporating intelligence for typical evacuation under the threat of fire spreading. Saf. Sci. 2018, 106, 1–9. [Google Scholar] [CrossRef]
- Zheng, Y.; Jia, B.; Li, X.-G.; Jiang, R. Evacuation dynamics considering pedestrians’ movement behavior change with fire and smoke spreading. Saf. Sci. 2017, 92, 180–189. [Google Scholar] [CrossRef]
- Joo, J.; Kim, N.; Wysk, R.A.; Rothrock, L.; Son, Y.-J.; Oh, Y.-G.; Lee, S. Agent-based simulation of affordance-based human behaviors in emergency evacuation. Simul. Model. Pract. Theory 2013, 32, 99–115. [Google Scholar] [CrossRef]
- Shuaib, M.; Zainuddin, Z. Incorporating intelligence for overtaking moving threatening obstacles. Int. Arab. J. Inf. Technol. 2020, 17, 598–606. [Google Scholar] [CrossRef]
- Lee, M.; Lee, J.; Jun, C. An extended floor field model considering the spread of fire and detour behavior. Phys. A Stat. Mech. Appl. 2021, 577, 126069. [Google Scholar] [CrossRef]
- Hughes, R.L. A continuum theory for the flow of pedestrians. Transp. Res. Part B Methodol. 2002, 36, 507–535. [Google Scholar] [CrossRef]
- Helbing, D.; Molnár, P. Social force model for pedestrian dynamics. Phys. Rev. E 1995, 51, 4282–4286. [Google Scholar] [CrossRef] [Green Version]
- Blue, V.J.; Adler, J.L. Cellular automata microsimulation for modeling bi-directional pedestrian walkways. Transp. Res. Part B Methodol. 2001, 35, 293–312. [Google Scholar] [CrossRef]
- Burstedde, C.; Klauck, K.; Schadschneider, A.; Zittartz, J. Simulation of pedestrian dynamics using a two-dimensional cellular automaton. Phys. A Stat. Mech. Appl. 2001, 295, 507–525. [Google Scholar] [CrossRef] [Green Version]
- Muramatsu, M.; Irie, T.; Nagatani, T. Jamming transition in pedestrian counter flow. Phys. A Stat. Mech. Appl. 1999, 267, 487–498. [Google Scholar] [CrossRef]
- Guo, X.; Chen, J.; You, S.; Wei, J. Modeling of pedestrian evacuation under fire emergency based on an extended heterogeneous lattice gas model. Phys. A Stat. Mech. Appl. 2013, 392, 1994–2006. [Google Scholar] [CrossRef]
- Zhang, L.; Wang, J.; Shi, Q. Multi-agent based modeling and simulating for evacuation process in stadium. J. Syst. Sci. Complex. 2014, 27, 430–444. [Google Scholar] [CrossRef]
- Helbing, D.; Farkas, I.; Molnar, P. Simulation of pedestrian crowds in normal and evacuation situations. Pedestr. Evacuation Dyn. 2002, 21, 21–58. [Google Scholar]
- Lakoba, T.I.; Kaup, D.J.; Finkelstein, N.M. Modifications of the Helbing-Molnár-Farkas-Vicsek social force model for pedestrian evolution. Simulation 2005, 81, 339–352. [Google Scholar] [CrossRef]
- Siddharth, S.M.P.; Vedagiri, P. Modeling the gender effects of pedestrians and calibration of the modified social force model. Transp. Res. Rec. 2018, 2672, 1–9. [Google Scholar] [CrossRef]
- Johansson, A. Constant-net-time headway as a key mechanism behind pedestrian flow dynamics. Phys. Rev. E 2009, 80, 026120. [Google Scholar] [CrossRef] [PubMed] [Green Version]
- Alia, O.M.; Shuaib, M.M. A harmony search algorithm for the reproduction of experimental data in the social force model. J. Appl. Math. 2014, 2014, 954607. [Google Scholar] [CrossRef]
- Shuaib, M.M.; Alia, O.M.; Zainuddin, Z. Incorporating prediction factor into the investigation capability in the social force model: Application on avoiding grouped pedestrians. Appl. Math. Inf. Sci. 2013, 7, 323–331. [Google Scholar] [CrossRef]
- Shuaib, M.M. Modeling the capability of penetrating a jammed crowd to eliminate freezing transition. Chin. Phys. B 2016, 25, 050501. [Google Scholar] [CrossRef]
- Shuaib, M.M. Preserving socially expected crowd density in front of an exit for the reproduction of experimental data by modeling pedestrians’ rear perception. J. Stat. Mech. Theory Exp. 2014, 2014, P10037. [Google Scholar] [CrossRef]
- Guo, N.; Jiang, R.; Hu, M.-B.; Ding, J.-X. Constant evacuation time gap: Experimental study and modeling. Chin. Phys. B 2017, 26, 120506. [Google Scholar] [CrossRef]
- Helbing, D.; Farkas, I.; Vicsek, T. Simulating dynamical features of escape panic. Nature 2000, 407, 487–490. [Google Scholar] [CrossRef] [Green Version]
- Zhang, G.; Huang, D.; Zhu, G.; Yuan, G. Probabilistic model for safe evacuation under the effect of uncertain factors in fire. Saf. Sci. 2017, 93, 222–229. [Google Scholar] [CrossRef]
- Duives, D.C.; Daamen, W.; Hoogendoorn, S. State-of-the-art crowd motion simulation models. Transp. Res. Part C Emerg. Technol. 2013, 37, 193–209. [Google Scholar] [CrossRef]
- Ehtamo, H.; Heliövaara, S.; Hostikka, S.; Korhonen, T. Modeling evacuees’ exit selection with best response dynamics. In Proceedings of the 4th International Conference on Pedestrian and Evacuation Dynamics, Wuppertal, Germany, 27–29 February 2008. [Google Scholar]
- Braglia, M.; Castellano, D.; Gabbrielli, R. A novel game theory based exit selection model in emergency conditions. Adv. Complex Syst. 2013, 16, 1350018. [Google Scholar] [CrossRef]
- Duives, D.C.; Mahmassani, H.S. Exit choice decisions during pedestrian evacuations of buildings. Transp. Res. Rec. 2012, 2316, 84–94. [Google Scholar] [CrossRef]
- Lovreglio, R.; Fonzone, A.; dell’Olio, L.; Borri, D. A study of herding behaviour in exit choice during emergencies based on random utility theory. Saf. Sci. 2016, 82, 421–431. [Google Scholar] [CrossRef] [Green Version]
- Liao, W.; Wagoum, A.U.K.; Bode, N.W.F. Route choice in pedestrians: Determinants for initial choices and revising decisions. J. R. Soc. Interface 2017, 14, 20160684. [Google Scholar] [CrossRef] [PubMed]
- Wang, J.; Zhang, L.; Shi, Q.; Yang, P.; Hu, X. Modeling and simulating for congestion pedestrian evacuation with panic. Phys. A Stat. Mech. Appl. 2015, 428, 396–409. [Google Scholar] [CrossRef]
- Jiang, Y.; Chen, B.; Li, X.; Ding, Z. Dynamic navigation field in the social force model for pedestrian evacuation. Appl. Math. Model. 2020, 80, 815–826. [Google Scholar] [CrossRef]
Publisher’s Note: MDPI stays neutral with regard to jurisdictional claims in published maps and institutional affiliations. |
© 2021 by the author. Licensee MDPI, Basel, Switzerland. This article is an open access article distributed under the terms and conditions of the Creative Commons Attribution (CC BY) license (https://creativecommons.org/licenses/by/4.0/).