Abstract
Owing to strong winds during the typhoon season, damage to pilotis in the form of dropout of the exterior materials occurs frequently. Pilotis placed at the end exhibit a large peak wind pressure coefficient of the ceiling. In this study, the experimental wind direction angle of wind pressure tests was conducted in seven directions, with wind test angles varying from 0° to 90° at intervals of 15°, centered on the piloti position, which was accomplished using the wind tunnel experimental system. Regardless of the height of the building, the maximum peak wind pressure coefficient was observed at the center of the piloti, whereas the minimum peak wind pressure coefficient was noted at the corners, which corresponds with the wind direction inside the piloti. The distribution of the peak wind pressure coefficient was similar for both suburban and urban environments. However, in urban areas, the maximum peak wind pressure coefficient was approximately 1.4–1.7 times greater than that in suburban areas. The maximum peak wind pressure coefficient of the piloti ceiling was observed at the inside corner, whereas the minimum peak wind pressure coefficient was noted at the outer edge of the ceiling. As the height of the building increased, the maximum peak wind pressure coefficient decreased. Suburban and urban areas exhibited similar peak wind pressure distributions; however, the maximum peak wind pressure coefficient in urban areas was approximately 1.2–1.5 times larger than that in suburban areas.
1. Introduction
Many studies have focused on the aerodynamic optimization of buildings. In a study on the design of affordable housing models for high-rise buildings, Baghaei [1] focused on the use of environmental factors in humid subtropical climates and examined the aerodynamic behavior of wind in an urban environment to optimize the shapes of 40 types of prototype buildings. The results were used to develop a suitable model for residential high-rise buildings in temperate and humid climates; these results also suggest an appropriate approach for the aerodynamic design of high-rise forms and offer appropriate aerodynamic corrections to reduce the wake of vortex areas around high-rise buildings. Similarly, Davenport [2] used aerodynamic model tests to investigate the effects of building forms. The effects of aerodynamic forces [3,4,5], set-back and tapered aerodynamic forms [6,7], spoilers and openings [8,9,10], and spiral or twisted models have been studied. The potential effects of aerodynamic calibration have also been analyzed in terms of economics (cost and available space) [11].
Many types of pilotis are used in high-rise buildings in Korea; however, there has been limited research on this topic. Jo et al. [12], Xi et al. [13], and Kuo et al. [14] found, through numerical and experimental analyses, that the depth of the piloti had an effect on the ceiling and airflow characteristics between a high-rise building with a podium and low-level attached houses. Zeng et al. [15] researched the piloti space, which is an important part of buildings located in an area with hot and humid summers and has not been studied sufficiently. The piloti space can improve the wind environment and provide cooler activity spaces in a city subject to hot and humid summers. This study aims to propose a climatically adapted piloti arrangement and ratio for the design of a residential area. In Lui et al. [16], unsteady flow fluctuations around elevated buildings were analyzed based on energy spectral density. Meanwhile, the periodical wind flow fields around elevated buildings were accurately determined. Kim [17] researched the characteristics of the design wind pressure coefficient distribution for the piloti exterior of tall buildings. Woo et al. [18] presented the wind pressure coefficient for the penetrating pilotis of low- and mid-rise buildings. Ryu et al. [19] and Shin [20] found that the wind pressure coefficient inside through-type and open-type pilotis varies with the piloti size.
The Tamura group [21] conducted comprehensive phosphorus wind tunnel experiments on various building configurations, namely basic (square, circular, rectangular, and oval), angle modification, one-dimensional, narrow, spiral, and composite models. Their results provided useful reference information for design initiatives and further research into building aerodynamics. The aerodynamic form plays an important role in the design of skyscrapers; however, optimization is limited by other design elements. Thus, the available options are limited. [22,23]. Tanaka et al. researched the effect of aerodynamic force and wind pressure on square-plan tall building shapes with various configurations such as chamfered, set-back, and helical [24]. Kwon et al. reviewed the eight international codes and standards for the effect of winds on tall buildings [25]. Kim and Kanda investigated the effects of the spatio-temporal characteristics of pressure fluctuations on tall buildings with taper and set-back forms [26]. Xu and Xie assessed the cross-wind effects on tall buildings with corner modifications, including chamfered and recessed corners, and aerodynamic forms such as tapered, stepped, and twisted [27]. Ciappino et al. presented a building corner aerodynamic optimization procedure for decreasing the effects of wind, based on a surrogate model. Wind forces and pressure distributions have also been measured [28]. Kumar et al. used an experimental approach to examine the wind pressure acting on all four faces of a tall rectangular building [29]. Mou et al. evaluated wind pressure distributions around square-shaped tall buildings based on various ratios, by using computational fluid dynamics techniques [30]. Elshaer et al. presented a building corner aerodynamic optimization procedure to decrease the effects of wind based on a surrogate model [31]. Mittal et al. presented a review of methods for evaluating pedestrian-level wind, different wind comfort criteria, and various techniques for evaluating wind velocity at the pedestrian level [32]. Finally, Bairagi and Dalui analyzed and compared two set-back buildings in terms of pressure, force, and torsional effects [33]. Table 1 summarizes the previous studies conducted on aerodynamic wind design by the aforementioned researchers.

Table 1.
Research on aerodynamic wind designs.
As the influx of people into downtown areas has increased, high-rise buildings in these areas have become increasingly dense. This contributes to problems such as the need for resident parking and pedestrian passages. To address these problems, pilotis have been widely used in high-rise building constructions. Pilotis offer various advantages such as facilitating the provision of parking areas and passages for pedestrians; therefore, they are widely used in apartments and office buildings. Pilotis are typically installed by crossing the lower part or with an opening on one side of the building, and exterior materials are primarily installed on the walls and ceilings inside the piloti. However, in this piloti configuration, when a strong wind blows, a wind path is formed, and wind is concentrated. Owing to such strong winds, the exterior materials on the ceilings and walls of the pilotis may fall, causing damage to parked vehicles and pedestrians.
Mohammad et al. [34] has studied Ultra-High Performance Concrete (UHPC), a new generation of concrete, which shows improved performance and higher strength compared with traditional concrete. Despite the huge potential in application, technical information about this material is still limited, and this contribution presents a study on the dynamic fracture of UHPC. Wanpeng et al. [35] used extract tests, industrial computer tomography (ICT), and scanning electron microscopy (SEM) to observe the extractive content, three-dimensional distribution, and surface structure of the Masson pine needle fibre (MPNF) for each pretreatment. The test results show that, after pretreatment, MPNF can increase the compressive strength, splitting strength, and modulus of rupture of concrete, as well as increase its ductility and toughness. This shows that it is feasible to incorporate MPNF into concrete, resulting in a new type of plant fibre-reinforced concrete composite material.
Korea is affected by typhoons every summer and autumn, which cause significant damage to piloti exterior materials. The Building Structural Standard (KBC2016) provides guidelines for the design of exterior materials, such as the exterior walls and roofs of the buildings, but guidelines for finishing exterior materials for ceilings and roofs inside piloti are insufficient. Because guidelines for the wind pressure coefficient, to be used in the design of exterior finishes of piloti, are not provided in the building structure standards or load guidelines, the risks of damage and dropout of exterior materials used with piloti, when strong winds occur, are significant issues. To reduce these risks, it is important to identify an appropriate wind pressure coefficient in designing exterior materials used with piloti. This was examined in this study through wind tunnel tests. For end-type and corner-type piloti at the bottom of a high-rise building, the variation in the wind pressure coefficient inside the piloti, along with the variation in the height and airflow characteristics of the building, was analyzed.
2. Materials and Methods
2.1. Wind Pressure Coefficient Distribution
Since the unfavorable wind directions for wind effects on rectangular tall buildings are usually perpendicular to the buildings’ surfaces, only the results under incident wind direction of 0° are presented and discussed in the following. The wind pressure coefficient CPi(t) at the pressure tap i on the surface of a model is obtained by normalizing the measured pressures, as follows [36]:
where is the time history of the measured wind pressure, and and are the total pressure and static pressure at the reference height, respectively.
The mean wind pressure coefficient, , and the root-mean-square wind pressure coefficient, , are determined as follows:
where T and N are the sampling time and sampling length, respectively.
As a benchmark tall building model for verification of wind loading measurements at several wind tunnel laboratories, a number of research institutions all over the world have studied the wind pressure distributions on the surfaces of the CAARC (Commonwealth Advisory Aeronautical Council) standard tall building models [34,37,38]. It can be observed that the experimental parameters from the seven research institutions are discrepant due to different experimental settings or lab conditions. The experimental parameters of this study (HNUST) are relatively similar to those of TJU (Huang et al. [39]).
2.2. Experimental Equipment and Wind Field Model
The test objects were square buildings with a length (B) and width (D) of 36 m and heights (H) of 90 m, 120 m, and 150 m. These dimensions correspond to high-rise buildings with aspect ratios of 2.5, 3.3, and 4.2, respectively. The end pilotis were installed on one side of the lower floor, while the corner pilotis were installed at the corners. A total of four piloti types were tested: end-, corner-, open-, and through-types. The length:width ratios (b:d) were 1:0.33 for the end piloti and 1:1 for the corner piloti; the height (h) was 4.5 m. A wind pressure model at a scale of 1/300 was built. For the end-type piloti (Case 1 (H = 90 m), Case 2 (H = 120 m), and Case 3 (H = 150 m)), 55 wind pressure holes were installed, among which 33 were on the ceiling and 22 were on the wall. For the corner-type piloti (Case 4 (H = 90 m), Case 5 (H = 120 m), and Case 6 (H = 150 m)), 45 wind pressure holes were installed, among which 25 were on the ceiling and 10 were on each of the two walls. Figure 1 shows the actual dimensions of the model and the location of the pilotis, and Table 2 lists the dimensions of the buildings and pilotis.
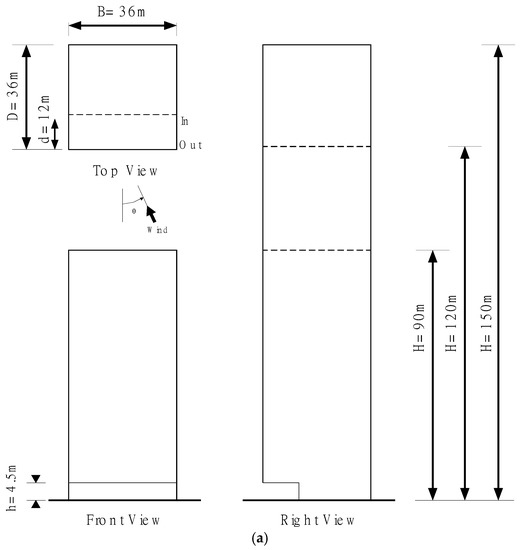
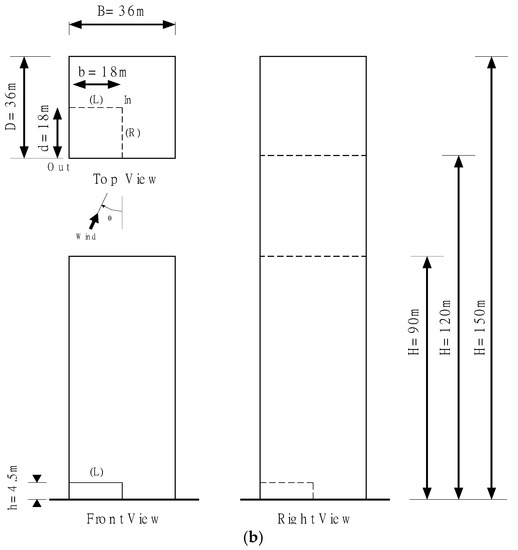
Figure 1.
Test model cases. (a) Case 1 (H = 90 m), Case 2 (H = 120 m), and Case 3 (H = 150 m); (b) Case 4 (H = 90 m), Case 5 (H = 120 m), and Case 6 (H = 150 m).
Table 2.
Building and piloti types and dimensions [unit: m].
2.3. Configuration of Building Model
Wind pressure tests on the ceilings and walls of the pilotis were performed using the Eiffel-type boundary layer wind tunnel system from the boundary floor wind tunnel laboratory of Chonbuk National University. The measurement section of the wind tunnel was 18 m long (L) × 2.1 m wide (W) × 1.7 m high (H), and the wind speed was 0.3–12 m/s. A turbulent boundary layer was applied. Urban area conditions were represented by high-rise building concentration A (α = 0.33), and suburban area conditions were represented by surface roughness C (α = 0.15) with 5–10 stories.
Figure 2 shows the vertical distribution of the mean wind speed and turbulence intensity formed in the wind tunnel. The solid line represents the theoretical results based on the standard, which were calculated using the exponential law and turbulence intensity. Table 3 lists the similarity laws used in the wind tunnel experiment. The airflow in the wind tunnel was measured using a hot-line anemometer (IFA-300). The experimental wind speed was 4.0–6.1 m/s, depending on the height of the building and the change in surface roughness. Table 4 lists the conditions of roughness, piloti type, and wind directions, which are important experimental variables used in this study.
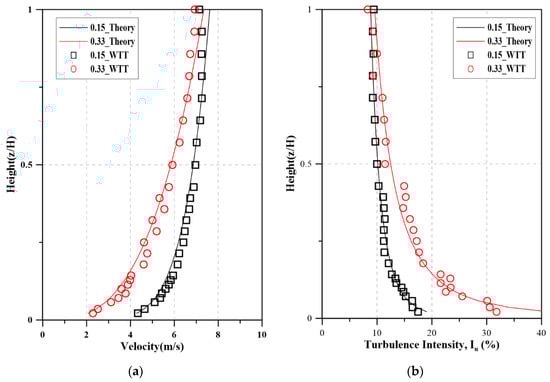
Figure 2.
Vertical distribution of mean wind speed and turbulence intensity. [WTT: wind tunnel test]. (a) Velocity, (b) Turbulent intensity.
Table 3.
Similarity laws used in wind tunnel experiments.
Table 4.
Experimental conditions.
Figure 3 shows the experimental wind direction angle. Wind pressure tests were conducted in seven directions, with wind test angles varying from 0° to 90° at intervals of 15°, centered on the piloti position. The length of the tube used in the wind pressure test was 120 cm, and the wind pressure signal was corrected using a resistor at a specific location in the tube. Figure 4 shows the effect of correction for the pressure transfer characteristics of the gain and phase angle used in the experiment. With regard to the gain, the blue signal indicates the resonance shape generated in the tube before the resistance tube was installed, whereas the red signal indicates the corrected signal after the resistance tube was installed. Each wind pressure measured in the wind pressure test is displayed as a dimensionless value. The maximum and minimum peak wind pressure coefficients are defined in Equations (4) and (5) [40], where, are the reference velocity pressure and reference wind speed from the reference height, respectively.
Figure 3.
Test wind apparatus and wind direction. (a) Setup of wind tunnel test, (b) End-type piloti, (c) Corner-type piloti.
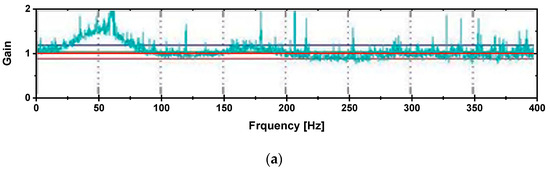
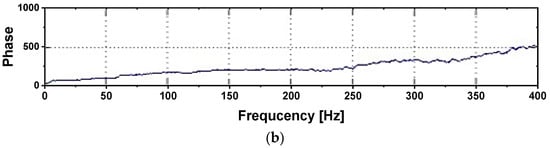
Figure 4.
Tube calibration. (a) Gain, (b) Phase angle.
Maximum peak wind pressure coefficient:
Minimum peak wind pressure coefficient:
Reference velocity pressure:
The surface roughness classification of construction points shall be determined in accordance with Table 5, according to the surface conditions of the surrounding area. Using the basis of Table 2, the experiment was conducted by selecting surface roughness A and C.
Table 5.
Terrain Categories [41].
3. Results and Discussion
3.1. Average Wind Pressure Coefficient Distribution of End-Type Piloti
Figure 5 shows the average wind pressure coefficient [40] (using Equation (7)) at the ceiling of the end-type piloti for wind direction angles of 0°–90°, in the suburban and urban areas. Among the 33 side pressure holes on the ceiling, the average wind pressure coefficient for each of the 11 side pressure holes located at the center showed maximum vales at 0° and minimum vales at 90°, in front and at the side of the piloti, respectively.
here, is the average value of wind pressure (), and is the speed pressure at reference height H.
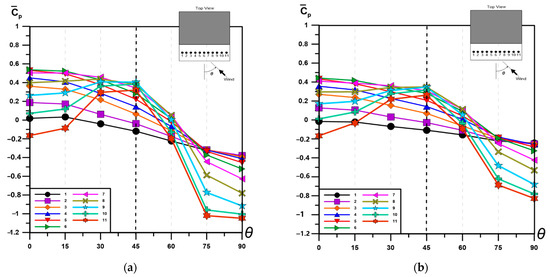
Figure 5.
Mean pressure coefficient at the ceiling (end-type piloti; H = 90 m, and h = 4.5 m). (a) Suburban area, (b) Urban area.
The distribution of the average wind pressure coefficient for each side pressure hole from 0° to 45° is obtained for the suburban area; the wind pressure coefficient increased on an absolute basis for wind direction angles exceeding 45°. Over the range of wind direction angles, the average wind pressure coefficient for each side pressure hole was approximately 0.5 at the central portion (holes 5–7), as the wind blew from the front of the piloti at a wind direction angle of 0°. For holes 1 and 11, the smallest values were approximately 0–0.2 (absolute values).
At a side wind direction angle of 90°, the wind blew from the side of the piloti; because of the influence of the negative pressure caused by the eddy detaching from the corner, the absolute value was 1.0 at side pressure hole 11, nearest to the portion where the wind flowed in. On the opposite side of side pressure hole 1, a large value was observed, while the smallest value was 0.3 (absolute values). The wind pressure coefficient value decreased as the wind blew toward the rear.
The results for the urban area exhibited the same trends as those for the suburban area. At a wind direction angle of 0°, the largest average wind pressure coefficient was approximately 0.4–0.5 at the central portion (holes 5–7); at the left and right corners (holes 1 and 11) where the wind flowed, it was approximately 0–0.2 (absolute values). At a side wind direction angle of 90°, the largest wind pressure coefficient value was approximately 0.8 (absolute value) at side pressure hole 11 nearest to the wind inflow portion, whereas the coefficient was 0.2 (absolute values) at the opposite side pressure hole 1. Thus, the average wind pressure coefficient decreased as the wind blew toward the rear.
3.2. Peak Wind Pressure Coefficient Distribution of End-Type Piloti
Figure 6 and Figure 7 show the distributions of the wind pressure coefficient inside the piloti, when the maximum peak wind pressure coefficient of the end-type piloti was observed at 0° and the minimum peak wind pressure coefficient was observed at 90°, for the suburban and urban areas, respectively. The maximum peak wind pressure coefficient was the highest at the center of the contact between the ceiling and wall, regardless of the height of the building, for a wind direction angle of 0°; the wind pressure coefficient decreased from the center to the outer perimeter. In all cases, the distribution of the maximum peak wind pressure coefficient ranged from 0.3 to 1.3 in the suburban areas and from 0.5 to 1.75 in the urban areas. When the introduced wind came in contact with the inner wall of the piloti and rose upward, the maximum peak wind pressure coefficient was noted at the center of the contact between the ceiling and the wall; this wind pressure coefficient value decreased as the wind flowed toward the outer perimeter.
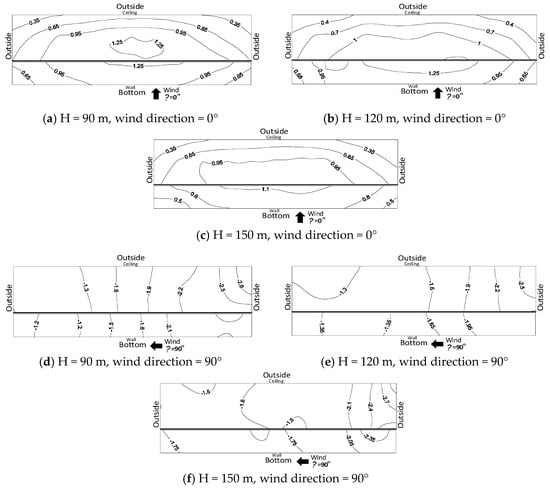
Figure 6.
Distribution of peak pressure in end-type piloti (suburban area).
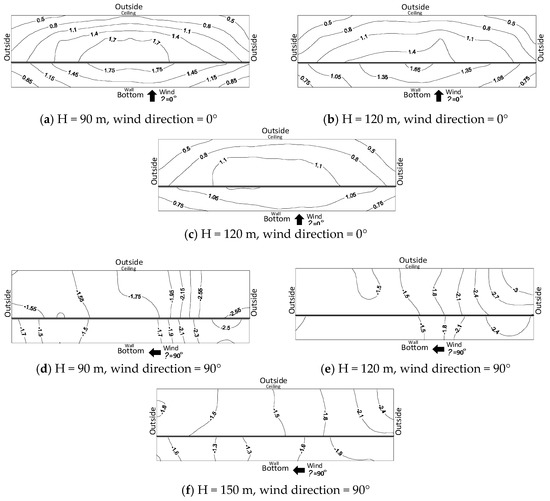
Figure 7.
Distribution of peak pressure in end-type piloti (urban area).
The minimum peak wind pressure coefficient in the piloti was observed at the inlet side of the wind, at an angle of 90°. The minimum peak wind pressure coefficient decreased toward the outlet; for all cases, it ranged from −2.8 to −1.2 in the suburban areas. In the urban areas, the minimum peak wind pressure coefficient ranged from −3.0 to −1.5. The minimum peak value at the ceiling was larger than that at the wall surface, indicating that the effect of negative pressure was more dominant. As the wind flowed into the piloti from the inlet, the minimum peak wind pressure coefficient was attributed to the strong eddy current produced by peeling at the edge of the inlet port. The effect of wind owing to reattachment decreased as it exited from the rear of the inlet port, reducing the minimum peak wind pressure coefficient.
The distribution of the peak wind pressure coefficient was similar for both the suburban and urban areas; however, the maximum peak wind pressure coefficient for the urban areas was approximately 1.4–1.7 times greater than that for the suburban areas. For the end-type piloti (Figure 6 and Figure 7), the flow velocity increased as the interior of the piloti became narrower, and the internal wind pressure coefficient exhibited a similar trend. For the through-type piloti, the internal wind pressure coefficient was affected by the shape of the piloti rather than the height of the building. Therefore, as the aspect ratio increases, as in Figure 6 and Figure 7, the peak pressure decreases, regardless of the wind direction (θ = 0° or 90°).
3.3. Average Wind Pressure Coefficient Distribution of Corner-Type Piloti
To confirm the change in the average wind pressure coefficient for the end-type piloti, the changes in the average wind pressure coefficient were as evaluated for the five wind pressure holes in the ceilings that were the least affected by the eddy currents. Figure 8 shows the change in the average wind pressure coefficient of the ceiling surface according to the wind direction angle in the corner-type piloti. The average wind pressure coefficients of the corner-type piloti for the urban and suburban areas exhibited symmetrical distributions, starting with a wind direction angle of 45°. Beyond a wind direction angle of 45°, the average wind pressure coefficient changed from positive pressure (+) to negative pressure (−) as the wind direction angle decreased or increased. In addition, the wind pressure coefficient decreased as wind entered the piloti. For the suburban areas, the highest wind pressure coefficient was 0.6, which was observed at wind pressure hole 5; this is less than the wind pressure coefficient at a wind direction angle of 45°. Furthermore, the wind pressure coefficient increased by approximately 40% toward the inside rather than the outside, where the wind from the building flowed in. The urban area exhibited a tendency similar to that of the suburbs. At a wind direction angle of 45°, the wind pressure coefficient was the highest at wind pressure hole 5 inside the piloti (0.5); the value outside was approximately 60% greater than that inside.
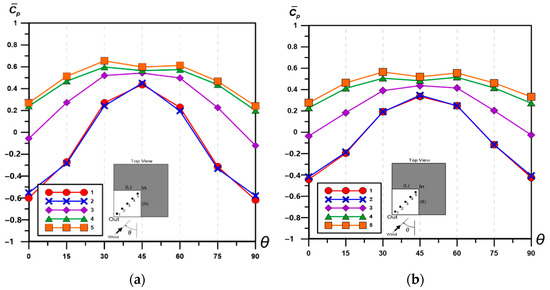
Figure 8.
Mean pressure coefficient at the ceiling (corner-type piloti; H = 90 m, and h = 4.5 m). (a) Suburban area, (b) Urban area.
3.4. Peak Wind Pressure Coefficient Distribution of Corner-Type Piloti
Figure 9 and Figure 10 show the distributions of wind pressure at 45°, where the maximum peak wind pressure coefficient was observed in the corner-type piloti, and, at 90°, where the minimum peak wind pressure coefficient was observed for suburban areas.
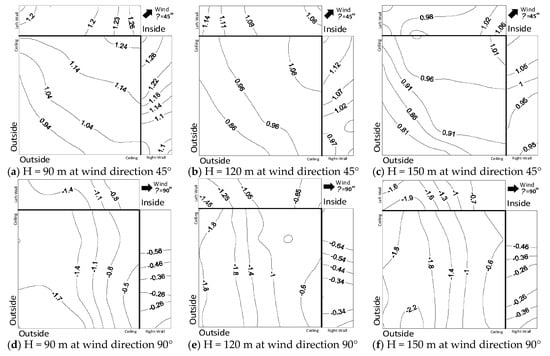
Figure 9.
Distribution of peak pressure in corner-type piloti (suburban area).
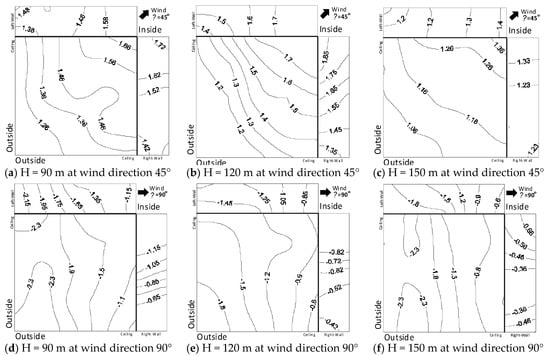
Figure 10.
Distribution of peak pressure in corner-type piloti (urban area).
The maximum peak wind pressure coefficient was observed at the inner edge of the piloti near the ceiling; the wind pressure coefficient inside was less than that outside. Similar to the ceiling, the maximum peak occurred at the wall and tended to decrease toward the outside. It decreased as the wind hit the central wall and flowed outward. The maximum peak wind pressure coefficient ranged from 0.94 to 1.24, 0.88 to 1.06, and 0.81 to 1.01 at the heights of 90 m, 120 m, and 150 m, respectively.
For all cases, the maximum peak wind pressure coefficient ranged from 0.8 to 1.24 for the suburban areas and from 0.97 to 1.87 for the urban areas. The minimum peak wind pressure coefficient was observed at the ceiling and the left wall, and the absolute value of the minimum peak wind pressure coefficient was the lowest inside and increased toward the outside. For all cases, the minimum peak wind pressure coefficients ranged from −2.2 to −0.5 for the suburban areas and from −2.3 to −0.4 for the urban areas. The suburban and urban areas exhibited similar peak wind pressure distributions. However, the maximum peak wind pressure coefficient for the urban areas was approximately 1.2–1.51 times larger than that for the suburbs. For the corner-type piloti (Figure 9 and Figure 10), as the height of the building increases, wind flows through the high-rise portion of the building. Therefore, the influence of wind at the lower portion of the building decreases, and thus, wind speed decreases. The structure of the corner-type piloti has an effect on the wind flow inside as the height of the building increases. Therefore, as the aspect ratio increases, as shown in Figure 9 and Figure 10, the peak pressure decreases, regardless of the wind direction (θ = 45° or 90°).
4. Conclusions
In this study, through wind tunnel tests, the distribution of peak wind pressure coefficients along the ceiling and walls of end- and corner-type pilotis was analyzed according to building height. The following conclusions can be drawn based on the results of these tests:
- (1)
- For the end-type piloti, the peak wind pressure coefficient of the ceiling was high. Regardless of the height of the building, the maximum peak wind pressure coefficient was noted at the center, and the minimum peak wind pressure coefficient was noted at the corner of the inlet. The maximum wind pressure coefficient at the city center was 1.4–1.7 times larger than that in the suburbs. This difference was attributed to the effects of surface roughness.
- (2)
- For the end-type piloti, flow velocity increased as the interior of the piloti became narrower, and the internal wind pressure coefficient exhibited a similar trend. For the through-type piloti, the internal wind pressure coefficient was affected by the shape of the piloti rather than the height of the building.
- (3)
- The maximum wind pressure coefficient for the corner-type piloti was noted at the inside of the corner, whereas the minimum peak wind pressure coefficient was noted at the outer edge of the ceiling. The maximum peak wind pressure coefficient for urban areas was approximately 1.2–1.5 times larger than that in the suburbs. This is attributed to the influence of the velocity and turbulence intensity depending on the surface roughness.
- (4)
- For the corner-type piloti, as the height of the building increases, the wind flows through the high-rise portion of the building. Therefore, the influence of wind at the lower portion of the building decreases; this leads to a decrease in the wind speed. The structure of the corner-type piloti affected the wind flow inside the piloti as the height of the building increased. For the corner- and end-type pilotis, as the aspect ratio increases, the peak pressure decreases, regardless of the wind direction (θ = 45° or 90°).
Author Contributions
J.Y. and C.L. conceived and designed the experiments; J.Y. performed the experiments; C.L. analyzed the data; J.Y. contributed reagents/materials/analysis tools; C.L. wrote the paper. Both authors have read and agreed to the published version of the manuscript.
Funding
This work was supported by the National Research Foundation of Korea (NRF) grant, funded by the Korean government (MSIT). (No. 2019R1A2C1010055).
Institutional Review Board Statement
Not applicable.
Informed Consent Statement
Not applicable.
Data Availability Statement
Not applicable.
Conflicts of Interest
The authors declare no conflict of interest.
References
- Baghaei, D.A. Designing a Model of Affordable Housing in Tall Building with a Focus on the Use of Environmental Factors in Humid Subtropical Climate—Roofing Rasht. Master’s Thesis, Department of Architecture, Islamic Azad University, Rasht, Iran, 2017. [Google Scholar] [CrossRef]
- Davenport, A.G. The response of six building shapes to turbulent wind. Philos. Trans. R Soc. A 1971, 269, 385–394. [Google Scholar] [CrossRef]
- Kwok, K.C.S. Effect of building shape on wind-induced response of tall buildings. J. Wind Eng. Ind. Aerodyn. 1988, 28, 381–390. [Google Scholar] [CrossRef]
- Dutton, R.; Isyumov, N. Reduction of tall building motion by aerodynamic treatments. J. Wind Eng. Ind. Aerodyn. 1990, 36, 739–747. [Google Scholar] [CrossRef]
- Kareem, A.; Kijewski, T.; Tamura, Y. Mitigation of motion of tall buildings with specific examples of recent applications. Wind Struct. 1989, 2, 201–251. [Google Scholar] [CrossRef]
- Cooper, K.R.; Nakayama, M.; Sasaki, Y.; Fediw, A.A.; Resende-Ide, S.; Zan, S.J. Unsteady aerodynamic force measurements on a super-tall building with a tapered cross section. J. Wind Eng. Ind. Aerodyn. 1997, 72, 199–212. [Google Scholar] [CrossRef]
- Kim, Y.; Kanda, J. Characteristics of aerodynamic forces and pressures on square plan buildings with height variations. J. Wind Eng. Ind. Aerodyn. 2010, 98, 449–465. [Google Scholar] [CrossRef]
- Miyashita, K.; Katagiri, J.; Nakamura, O.; Ohkuma, T.; Tamura, Y.; Itoh, M.; Mimachi, T. Wind-induced response of high-rise buildings Effects of corner cuts or openings in square buildings. J. Wind Eng. Ind. Aerodyn. 1993, 50, 319–328. [Google Scholar] [CrossRef]
- Isyumov, N.; Dutton, R.; Davenport, A.G. Aerodynamic Methods for Mitigating Wind-induced Building Motions. In Proceedings of the American Society of Civil Engineering (ASCE) Structures Congress, San Francisco, CA, USA, 1–5 May 1989. [Google Scholar]
- Kelly, D.; Poon, D.; Irwin, P.A.; Xie, J. Wind Engineering Studies for Shanghai Centre Tower; RWDI Report; RWDI: Milton Keynes, UK, 2009. [Google Scholar]
- Tse, K.T.; Hitchcock, P.A.; Kowk, K.C.S.; Thepmongkorn, S.; Chan, C.M. Economic perspectives of aerodynamic treatments of square tall buildings. J. Wind Eng. Ind. Aerodyn. 2009, 97, 455–467. [Google Scholar] [CrossRef]
- Jo, J.H.; Gil, Y.S. Evaluation of Wind Effect for Piloti Space of Buildings Using Numerical Analysis Method; The Wind Engineering Institute of Korea (WEIK): Seongam, Korea, 2014; pp. 47–50. [Google Scholar]
- Xi, T.Y.; Ding, J.H.; Jin, H. Study on the influence of piloti on mean radiant temperature in residential blocks by 3-D unsteady state heat balance radiation calculation. J. Harbin Inst. Tech. 2014, 20, 91–95. [Google Scholar]
- Kuo, C.Y.; Tzeng, C.T.; Ho, M.C.; Lai, C.M. Wind tunnel studies of a pedestrian-level wind environment in a street canyon between a high-rise building with a podium and low-level attached houses. Energies 2015, 8, 10942–10957. [Google Scholar] [CrossRef]
- Zhou, Z.; Deng, Q.; Mochida, A. Climatically Adapted Piloti Arrangement and Ratio of Residential Blocks in a Subtropical Climate City. In Proceedings of the ICUC9: 9th International Conference on Urban Climate, Toulouse, France, 20–24 July 2015. [Google Scholar]
- Liu, J.; Niu, J.; Mak, C.M.; Xia, Q. Pedestrian level turbulent wind flow around an elevated building. Procedia Eng. 2017, 205, 1004–1010. [Google Scholar] [CrossRef]
- Kim, G.H. Characteristics of Design Wind Pressure Coefficient Distribution for Piloti Exterior of Tall Buildings. Master’s Thesis, Chonbuk National University, Jeonju, Korea, 2018. [Google Scholar]
- Woo, S.H.; Shin, D.H.; Ryu, H.J.; Ha, Y.C. Estimation of wind pressure coefficients for wind resistance design on penetration piloti of middle and low-rise buildings. J. Wind Eng. Inst. Korea 2019, 23, 57–65. [Google Scholar]
- Ryu, H.J.; Shin, D.H.; Woo, S.H.; Ha, Y.C. Proposed wind pressure coefficients for wind resistance design on penetration and all open piloti of high-rise buildings. J. Wind Eng. Inst. Korea 2020, 24, 23–35. [Google Scholar] [CrossRef]
- Shin, D.H. Proposed Wind Pressure Coefficients for Wind Resistance Design on Penetration and All Open Piloti of High-Rise Buildings. Master’s Thesis, Kumoh National Institute of Technology, Gyeongbuk, Korea, 2020. [Google Scholar]
- Tanaka, H.; Tamura, Y.; Ohtake, K.; Nakai, M.; Kim, Y.C.; Bandi, E.K. Aerodynamic and flow characteristics of tall buildings with various unconventional configurations. Int. J. High Rise Build. 2013, 2, 213–228. [Google Scholar]
- Yi, L.; Zhang, J.W.; Li, Q.S. Experimental investigation of characteristics of torsional wind loads on rectangular tall buildings. Struct. Eng. Mech. 2014, 49, 129–145. [Google Scholar] [CrossRef]
- Huang, S.; Li, R.; Li, Q.S. Numerical simulation on fluid-structure interaction of wind around super-tall building at high Reynolds number conditions. Struct. Eng. Mech. 2013, 46, 197–212. [Google Scholar] [CrossRef]
- Tanaka, H.; Tamura, Y.; Ohtake, K.; Nakai, M.; Kim, Y.C. Experimental investigation of aerodynamic forces and wind pressures acting on tall buildings with various unconventional configurations. J. Wind Eng. Ind. Aerodyn. 2012, 107–108, 179–191. [Google Scholar] [CrossRef]
- Kwon, D.K.; Kareem, A. Comparative study of major international wind codes and standards for wind effects on tall buildings. Eng. Struct. 2013, 51, 23–35. [Google Scholar] [CrossRef]
- Kim, Y.C.; Kanda, J. Wind pressures on tapered and set-back tall buildings. J. Fluids Struct. 2013, 39, 306–321. [Google Scholar] [CrossRef]
- Xu, Z.; Xie, J. Assessment of across-wind responses for aerodynamic optimization of tall buildings. Wind Struct. 2015, 21, 505–521. [Google Scholar] [CrossRef]
- Giappino, S.; Rosa, L.; Tomasini, G.; Zasso, A. An aerodynamic and aeroelastic experimental study on a sectional and three-dimensional rectangular tall building. Struct. Des. Tall Spec. Build. 2016, 25, 139–157. [Google Scholar] [CrossRef]
- Kumar, S.H.; Rajan, S.S.; Andrew, J.A.; Babu, R.G.; Rao, S.N.K.; Jawahar, G.J. Aerodynamic coefficients for a rectangular tall building under sub-urban terrain using wind tunnel. Asian J. Civ. Eng. 2016, 17, 325–333. [Google Scholar]
- Mou, B.; He, B.; Zhao, D.; Chau, K. Numerical simulation of the effects of building dimensional variation on wind pressure distribution. Eng. Appl. Comput. Fluid Mech. 2017, 11, 293–309. [Google Scholar] [CrossRef]
- Elshaer, A.; Bitsuamlak, G.; Damatty, A. Enhancing wind performance of tall buildings using corner aerodynamic optimization. Eng. Struct. 2017, 136, 133–148. [Google Scholar] [CrossRef]
- Mittal, H.; Sharma, A.; Gairola, A. A review on the study of urban wind at the pedestrian level around buildings. J. Build. Eng. 2018, 18, 154–163. [Google Scholar] [CrossRef]
- Bairagi, A.K.; Dalui, S.K. Comparison of aerodynamic coefficients of setback tall buildings due to wind load. Asian J. Civ. Eng. 2018, 19, 205–221. [Google Scholar] [CrossRef]
- Khosravani, M.R.; Silani, M.; Weinberg, K. Fracture studies of Ultra-High Performance Concrete using dynamic Brazilian tests. Theor. Appl. Fract. Mech. 2018, 93, 302–310. [Google Scholar] [CrossRef]
- Long, W.; Wang, Y. Effect of pine needle fibre reinforcement on the mechanical properties of concrete. Constr. Build. Mater. 2021, 278, 122333. [Google Scholar] [CrossRef]
- Li, Y.; Li, C.; Li, Q.S.; Song, Q.; Huang, X.; Li, Y.G. Aerodynamic performance of CAARC standard tall building model by various corner chamfers. J. Wind Eng. Ind. Aerod. 2020, 202, 104197. [Google Scholar] [CrossRef]
- Melbourne, W.H. Comparison of measurements on the CAARC standard tall building model in simulated model wind flows. J. Wind Eng. Ind. Aerod. 1980, 6, 73–88. [Google Scholar] [CrossRef]
- Braun, A.L.; Awruch, A.M. Aerodynamic and aeroelastic analyses on the CAARC standard tall building model using numerical simulation. Comput. Struct. 2009, 87, 564–581. [Google Scholar] [CrossRef]
- Huang, P.; Gu, M.; Quan, Y. Wind tunnel test research on CAARC standard tall building model. Chin. Q. Mech. 2008, 29, 627–633. [Google Scholar]
- You, J.Y.; Nam, B.H.; You, K.P. A study on the distribution of the peak wind pressure coefficient for the wind resistant design of rooftop hoardings in high-rise buildings. Int. J. Eng. Res. Technol. 2018, 11, 1583–1594. [Google Scholar]
- AIK (Architectural Institute of Korea). Korean Building Code-Structural; Kimoondang: Seoul, Korea, 2009; pp. 99–101. [Google Scholar]


Publisher’s Note: MDPI stays neutral with regard to jurisdictional claims in published maps and institutional affiliations. |
© 2021 by the authors. Licensee MDPI, Basel, Switzerland. This article is an open access article distributed under the terms and conditions of the Creative Commons Attribution (CC BY) license (https://creativecommons.org/licenses/by/4.0/).