Abstract
Expanding transport systems for life convenience and preserving the natural environment are essential but conflicting human activities. The operational expansion after the opening of a new terminal building at Hanoi Noi Bai International Airport was followed by changes in aircraft noise exposure. A series of socio-acoustic surveys were conducted around the airport, revealing different levels of noise annoyance responses in the surveyed sites. To clarify this discrepancy and to explore people’s true feelings, the Picture-Frustration test was conducted to assess attitudes toward the airport, aircraft noise, living environment, and awareness of environmental protection in the communities around the airport. A total of 321 responses were obtained. The results showed a significant variation in attitudes toward the airport and natural environment among residents in different areas. Urban residents preferred natural environment more than those living in rural and mixed sites, who desired harmony between nature and life convenience. Residents in rural sites raised more complaints about aircraft noise effects on sleep than those in the other sites. Factors of occupations and gardening activities did not affect residents’ attitudes toward the airport. The attitudes of the participants varied depending on the exposure noise levels. It was suggested that using multiple questioning methods is necessary to certify the true opinions and aspirations of people living in the project area and ensure sustainable development.
1. Introduction
People in modern societies now face various frustrating situations due to urbanization. The natural environment is being replaced by artificial facilities such as airports for satisfying human needs. Development projects have brought convenience to human life, but have had negative impacts on the natural environment and decreased opportunities for people to enjoy nature. There is a limited amount of research on how people react or adapt to the intervention events, particularly the modification of the natural environment to promote life convenience [1,2]. It is necessary to understand the residents’ potential attitude and acceptability toward the environment to establish a sustainable development policy. It is also essential to understand what factors influence the attitude to the environment and the contexts in which people develop their values and react to their living environment. However, relatively few studies have focused on this topic [3].
Questionnaire surveys are capable of obtaining information from large samples of the population for the purpose of assessing community responses. However, it is difficult for participants to assess their own opinions when they have poor recall of a circumstance that they are asked to evaluate. Therefore, in questionnaire surveys, open-ended questions are added to explore qualitative, in-depth aspects of a specific topic and provide participants with a chance to respond in detail [4]. The Rosenzweig Picture-Frustration test, which we call the P-F test in the following, is known as a tool to explore an individual’s real feelings toward frustrating situations using cartoons [5,6,7] and takes an advantage of open-ended questions and allows participants to imagine their circumstances.
The P-F test is usually considered a semi-projective technique and involves an examinee responding verbally to a semi-ambiguous picture scenario [8]. The test form consists of 24 comic strip pictures that portray a situation that might induce frustration to assess how the examinee responds to frustration and frustrating situations. The test assumes that the way that the examinee responds to each frustrating situation depicts how they behave in the face of frustration. Since the first publication on the technique, it has been consistently stated that the P-F test intends to measure not the types of personality but the types of reaction, assuming that each individual has access to a variety of such types or patterns of reaction [7]. Rosenzweig’s test has been continued to be widely used in behavioral and psychological studies until recently. The test was applied to explore the mediational role of frustration tolerance in the relationship between personality traits and two different substance addiction treatments [9]. An adapted version of Rosenzweig’s test was developed to assess the hostile thoughts elicited by frustrating interpersonal situations in forensic psychiatric patients with a conduct disorder or an antisocial personality disorder [10]. P-F test has been used effectively to study effects of noise from neighbors in Japan [11,12].
In the P-F test, the reactions to the pictures have to be written down. Therefore, it is expected to reveal respondents’ real thought content more directly than if respondents have to rate their response on a verbal or numeric scale used in the questionnaire surveys. The result of a study on the P-F test conducted in Japan suggests that people are strongly aware of the importance of the natural environment and expect life convenience to be compatible with environmental protection [13,14]. In this study, a set of cartoons for the P-F test were developed as a new means to examine the environmental attitudes of residents living near an airport concerning their desires and preferences of life convenience and environmental protection. These will help us attain effective noise-abatement programs that not only focus on decreasing noise emission, but also seek solutions to enhance the coexistence of an airport and local communities.
A new terminal building at the Hanoi Noi Bai International Airport (NBIA) in Vietnam was completed and opened in December 2014 with plans to increase the airport capacity to cope with the growing demand for aircraft movements. The P-F test and a questionnaire survey, which we will refer to as the questionnaire, were conducted after the opening of the new terminal building in September 2015, in order to investigate people’s attitudes toward the airport, aircraft noise, their living environment, and their awareness of environmental protection of their communities, as well as to clarify a variety of public opinions related to the NBIA. Note that a preliminary P-F test was conducted with Hanoi residents in March 2014 [15]. This preparatory study, which was conducted to examine whether the P-F test method is feasible for noise research in Vietnam, used the same cartoons as those in the survey conducted in Japan in 2010 [13], to make a cross-cultural comparison.
The P-F test was originally developed to disclose patterns of responses to daily stress and assess how the test participants respond to annoying and frustrating situations: The test participants are requested to observe cartoons that show scenes depicting moderately frustrating situations and are asked to write what the frustrated person in the cartoons would probably say or how they would react in such situations. In this study, the test is based on the assumptions that the individual participants can relate to the frustrated characters depicted in the picture and then project their own reactions through their response. By conducting the questionnaire right after finishing the P-F test on the same test subject, this study was expected to explore whether the participants responded differently to the same issue.
The situation depicted in the original P-F test includes two categories of frustration: “ego blocking,” in which an obstacle is evident, and “superego blocking,” in which one person makes an accusation against another. However, all situations depicted in the cartoons of this P-F test are considered to fall into the first category of “ego blocking” because this study aims to assess participants’ responses to aircraft noise and the impact of airport operations. The specific study objectives are:
- (1)
- to understand the opinion of people living around the NBIA concerning their awareness of the environment and noise, impacts of aircraft noise and airport operations, life convenience, and attitudes concerning environmental protection,
- (2)
- to assess the participant evaluation response differences between the P-F test and questionnaire.
This study also aims to accumulate data on the consciousness of life convenience and the natural environment in Vietnam and assess a method for evaluating differences in consciousness of environmental protection among countries.
2. Materials and Methods
2.1. Survey Sites and Test Participants
Test participants were residents living in 13 survey sites around NBIA, as shown in Figure 1. Sites A1–A6 were below the typical aircraft arrival route, Sites A7–A11 were below the typical aircraft departure route, and Sites A12 and A13 had minimal aircraft noise exposure since they were located northeast of the airport. These two sites were selected as control sites for comparison purposes. Note that about 90% of aircraft fly in the west-to-east direction at the NBIA. The selected survey sites can be classified into three categories based on their regional characteristics: urban use (A1), mixture of urban and rural uses (A2, A3, A7, A9, A12, and A13), and rural use (A4, A5, A6, A8, A10, and A11). Site A1 is located in the town center and far away from rice paddies, so it was considered to be an urban site. The rural sites were adjacent to the rice fields. The sites adjacent to both the town and the rice fields were called the mixed sites. A total of thirty people were invited to participate in the test at each site.
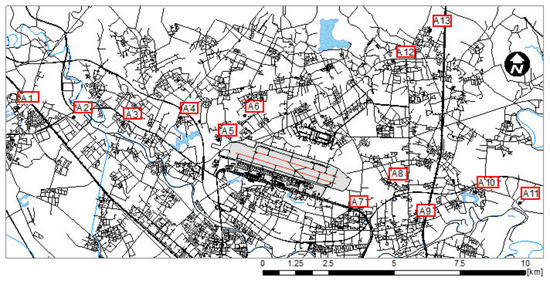
Figure 1.
Survey sites around Noi Bai International Airport. A1–A13 are the survey site IDs.
2.2. Contents of the Cartoons and Questionnaire
Figure 2 shows a set of five cartoons composed for the P-F test. In each cartoon, a frustrated person standing on the left says something to another person standing on the right about his frustration. Facial features, other personality expressions, and detailed backgrounds are omitted from all the cartoons. The test participants were asked to write what the person on the right will say to the frustrated person in the cartoon. It is assumed that the test participant will project their attitudes and opinions to the person in the cartoon.
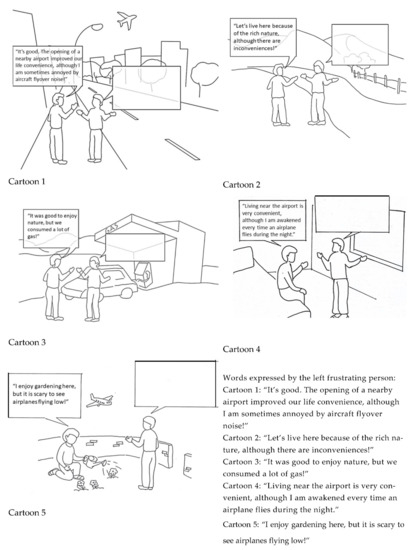
Figure 2.
Five cartoons used in the P-F test.
Cartoons 1–3 have the same dialogue scenes as the cartoons used in the preliminary test conducted in 2014 with participants living in downtown Hanoi [15] and the study conducted in 2010 with participation of university students in Osaka by Yoshioka et al. [13]. The words spoken by the characters were the same, but the pictures were replaced with similar, but more simplified and common ones to fit Vietnam and other nations. We aim to conduct tests repeatedly in many countries and to conduct a cross-cultural study.
In addition to the three cartoons illustrating irritation attributed to environmental protection and life convenience, cartoons 4 and 5 were newly created to depict dialogue scenes representing frustration from life convenience and sleep impacts in cartoon 4 and enjoyment of gardening and visual impact in cartoon 5. The results of previous socio-acoustic surveys conducted around NBIA revealed a wide variety of noise annoyance responses [16]. We hypothesized that these were caused by sleep impacts and the participants’ occupations, and that the participants living in rural sites were more annoyed by aircraft noise than those living in urban and mixed environments where aircraft noise exposure levels were similar. Cartoon 4 shows a person sitting on a bed complaining about his sleep disturbance due to aircraft noise. Cartoon 5 shows a person who enjoys gardening, but fears low-flying aircraft. Note that the consistency of the content of expressions was checked among various languages (e.g., Vietnamese, Japanese and English) when the words of the frustrating person in the cartoons were translated. In summary, the five cartoons describe the following frustrating situations:
- (a)
- Cartoon 1: Aircraft noise vs. life convenience.
- (b)
- Cartoon 2: Natural environment vs. life convenience.
- (c)
- Cartoon 3: Environmental preservation vs. life convenience.
- (d)
- Cartoon 4: Sleep disturbance vs. life convenience.
- (e)
- Cartoon 5: Fear of aircraft crash vs. joy of gardening.
In this research, the test was followed by a questionnaire survey to assess the participants’ responses to aircraft noise, referring to the method used in a study of neighborhood noise in Japan by Namba et al. [4], although in their study, the P-F test was conducted after the questionnaire survey. The questionnaire, which was presented after the test was completed, consisted of seven questions. The first question was a query on the general environment to avoid bias due to the impact of aircraft noise. This question was the same as that used in a survey of environmental noise in Japan [17]. The next five questions were modified versions of queries from the neighborhood noise study [4], so as to fit our purpose of investigating the effects of aircraft noise. The last question was composed of 21 queries requiring answers on an “agree-neutral-disagree” scale, referring to Yoshioka et al. [13]. Some of these queries were modified to fit the situation around NBIA and to enable a comparison of the results between the methods of the P-F test and the questionnaire survey. A face sheet was added to obtain the participant’s demographic data. Table 1 shows survey items of the P-F test and questionnaire used in this study.

Table 1.
Survey items of the P-F test and questionnaire.
2.3. Interview Methods of the P-F Test and Questionnaire
The field investigation of the P-F test and questionnaire were conducted in the daytime on weekends. Interviewers visited targeted homes in the survey sites, brought the set of cartoons and questionnaire, and asked residents nominated as test participants to fill in their answers without any assistance. With each cartoon, individual test participants were asked to fill in the blank caption box with what they thought the right person in the cartoon would tell the other person. To guarantee the balance of answering rates between males and females and among generations, the adult males, adult females, and other household members over age 18 were sequentially selected as test participants at each targeted home (one person from each home).
3. Results
3.1. Basic Results of the P-F Test
Table 2 shows the number of responses, demographic data of test participants, and noise exposure levels (Lden) at the individual survey sites. The numbers of responses in Sites A5 and A11 were less due to their smaller population sizes compared to the others. The age of the test participants was classified as “under 30-years-old,” “from 30 to 50-years-old,” and “over 50-years-old”. Since the retirement age of Vietnamese people is typically above 50-years-old, the “over 50-years-old” categories included participants who stay at home a longer duration than the other categories. All of the participant responses to the P-F test were translated into English and Japanese to check the consistency of the content of expressions across languages. The test participants of the P-F test are assumed to identify, subconsciously or consciously, with the frustrated person in the situation depicted in each cartoon and project their own opinion into the response given. Thus, subjective responses are assumed to reflect their frustration in response to the degree that the test participants exhibited their aggression toward the frustrating situations. Based on this assumption, answers provided by the test participants were classified into five categories based on the degree of disagreement, as shown in Table 3. The bar graphs of the results in Figure 3 show the percentages of answers classified into individual categories for each cartoon. The percentage of respondents in agreement and disagreement are shown on each side of each graph. Taking the statistical stability into account, the average percentages of the two categories are calculated and placed at the top of each graph.
Table 2.
The participant demographic data of the P-F test and questionnaire.
Table 3.
Categories of answers in the P-F test classified based on the degree of agreement.
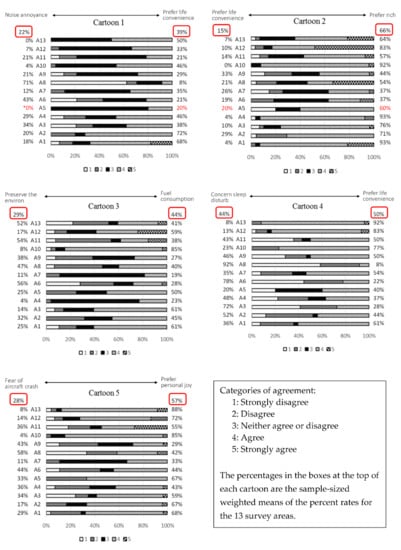
Figure 3.
Distribution of responses for the five agreement categories in each of the five cartoons.
3.1.1. Cartoon 1: Noise Annoyance vs. Improved Life Convenience
Cartoon 1 was designed to explore attitudes toward a frustrating situation between “improvement in life convenience” and “noise annoyance due to the opening of a nearby airport.” The test participants who answered “strongly disagree” or “disagree” were identified as negative toward the airport due to noise annoyance, while those answering “agree” and “strongly agree” were identified as positive to prioritize life convenience, despite the noise annoyance. A high rate of participants renouncing the airport was found in sites closer to the airport, such as A8 and A6, where airplanes were clearly visible and aircraft noise is louder compared to the other sites. Site A8 was located below the take-off route and has a high percentage of elderly population, while Site A6 was near the runway end below the landing route and obliquely behind the start of the take-off roll of military aircraft. A lower rate of test participants renouncing the airport was found in Sites A3, A4, A7, and A9. Sites A7 and A9 are located close to the runway end but not directly below the take-off route.
It is worth noting that, as shown in Figure 3, the ratio of test participants having negative attitudes toward the airport is low, occupying 22% of the total number of participants and 20% of the young group (<30 years old). In other words, the residents around NBIA had an attitude of accepting a new airport for the benefits that it brings despite its environmental impact.
3.1.2. Cartoon 2: Life Convenience vs. Rich Nature
Cartoon 2 was designed to explore attitudes toward a frustrating situation between “inconvenient life but in harmony with the rich nature” and “urban life convenience.” All responses classified into the first two categories imply the prioritization of life convenience, whereas the last two categories imply a preference for the rich natural environment. It is worth noting that most of the test participants in Site A1 showed agreement, which implies the preference for the rich nature of residents in the site, which is the most urbanized among the 13 survey sites. As shown in Figure 3, the average percentage of test participants preferring natural environment is very high, occupying 66% of the total number of participants. Although the preference of natural environment seems to be lower in the sites close to the airport, test participants generally seem to show a preference to the richness of nature rather than the convenience of life.
3.1.3. Cartoon 3: Environmental Preservation vs. Fuel Consumption
Cartoon 3 was designed to explore attitudes toward the frustrating situation between the protection of the environment and residents’ demands, such as energy consumption for life convenience. The first two categories imply the priority to protect the natural environment, whereas the last two categories imply an acceptance of the fuel consumption. As a result, as shown in Figure 3, the ratio of responses to each category is scattered with no clear trend. The average percentage of participants who selected the first two categories is 29%, while those that selected the last two categories was 44% of all the responses. These rates for young participants (<30 years old) are 30% and 49%, respectively. This result is different from what was expected, which was that there would be more negative responses to fuel consumption or positive responses to environmental protection.
3.1.4. Cartoon 4: Sleep Disturbance vs. Life Convenience
Cartoon 4 focused on attitudes toward the frustrating situation between life convenience provided by living near the airport and sleep quality affected by aircraft noise. The first two categories (strongly disagree and disagree) indicate negative attitudes toward the airport due to sleep effects. Although the issues examined in cartoons 4 and 1 are somewhat similar, the latter draws the participants’ attention to general noise annoyance, whereas the former focuses on sleep disturbance, i.e., a particular effect of noise. As shown in Figure 3, we can observe a considerable difference in the attitudes between the participants living in the control sites A12 and A13 and those living in the survey sites below the take-off and landing routes. The rather high percentage of negative attitudes toward the airport, except in Sites A12, A13, A10, and A5 (average percentage: 44%) indicates test participants’ concern with sleep disturbance, but the percentage of participants’ preferences to life convenience was also high in most sites (average percentage: 50%). In other words, no clear trend was found between the concern with sleep disturbance and preference to life convenience within the test participants.
3.1.5. Cartoon 5: Fear of Aircraft Crash vs. Joy of Gardening
Cartoon 5 was designed to explore attitudes toward the frustrating situation between the fear of aircraft crashes and the desire to enjoy outdoor activities. More negative responses, or fear of an aircraft crash, were observed in sites closer to the airport, except for Site A7. This is understandable, considering that Site A7 is located south of the take-off path. This may decrease the visual effect of flyover aircraft and make test participants less fearful of aircraft crashes in this site compared to other sites. Similar to the result of cartoon 4, the test participants living in the control sites A12 and A13 showed more tolerance toward aircraft than those living below the take-off and landing routes. In other words, at the sites far from the airport and the control sites, a higher percentage of participants who have a preference for outdoor activities were found rather than the safety. An airplane is usually high when crossing these sites and does not have the visual effect that might result in a fear of an aircraft crash.
In addition, the difference in responses to the situation raised in cartoon 5 between farmers and other occupations was examined, considering that farmers are apt to be easily affected by the fear of an aircraft crash because they have to work outdoors longer than other occupations. Based on the result, test participants were classified into three groups in Table 4: tolerant group who give priority to the joy of gardening, non-tolerant group who have a concern with aircraft crash, and neutral. A chi-square test of independence was performed to examine the relation between occupations and the fear of an aircraft crash. The test result showed that the proportion of subjects who reported being fear of an aircraft crash did not differ by occupations, X2 (1, N = 288) = 0.5, p > 0.05.
Table 4.
Result of P-F test—Cartoon 5 (Fear of aircraft crash vs. joy of gardening): Comparison by cross tabulation on farmers and other occupations.
3.2. Comparison of Disagreement-Agreement Responses Obtained in P-F Test by Different Noise Levels
Since attitudes of the participants obtained in P-F test is assumed to vary depending on exposure noise levels, distribution of responses for the five agreement categories in each of the five cartoons were divided into difference noise level ranges, day-evening-night-weighted sound pressure level, Lden, of under 55 dB, 55–60 dB, and over 60 dB (Table 5), and nighttime equivalent continuous sound pressure level, Lnight, of under 50 dB and 50 dB or more (Table 6). Percentage of disagreement responses in Cartoon 1 increases from 11% to 34% when Lden increases from under 55 dB to over 60 dB. Higher percentage of disagreement was also found with responses in Cartoons 4 and 5 at the higher range of noise level. It indicated that more participants reject the airport because of its noise and visual impacts rather than accept the airport for the life convenience. This trend was not shown clearly for the responses of Cartoons 2 and 3 which indicate other environmental attitudes not directly relating to effect of the aircraft. Regarding distribution of responses by different ranges of nighttime noise level, percentage of disagreement responses in Cartoon 1 increases from 14% to 29% when Lnight increases from under 50 dB to over 50 dB. This result indicates that the number of participants accept an existence of an airport in their living area and give priority to their life convenience decrease when they are exposed to noisier aircraft noise.
Table 5.
Distribution of disagreement-agreement obtained in P-F Test by different ranges of day-evening-night-weighted sound pressure level and by categories of agreement (1: Strongly disagree; 2: Disagree; 3: Neither agree nor disagree; 4: Agree; 5: Strongly agree).
Table 6.
Distribution of disagreement–agreement obtained in P-F Test by different ranges of nighttime equivalent continuous sound pressure level and by categories of agreement (1: Strongly disagree; 2: Disagree; 3: Neither agree nor disagree; 4: Agree; 5: Strongly agree).
3.3. Effects of Demographic Factors on the Residents’ Attitudes toward the Airport and the Natural Environment
The responses obtained using the P-F test were analyzed to examine if residents’ attitudes toward the airport and the natural environment were different depending on demographic factors. Table 7 shows the answers for the five cartoons cross-tabulated by site characteristics, occupation, living with vulnerable family members, and age. The chi-square test was applied to determine whether the difference among residents’ attitudes was significantly affected by these demographic factors.
Table 7.
Chi-square test of attitudes toward the airport, life convenience, and energy saving among sites, occupations, ages, and family components based on P-F test data.
3.3.1. Site Characteristics
The survey sites were classified into three categories: urban (A1), rural (A4, A5, A6, A8, A10, and A11), and urban-rural mix (A2, A3, A7, A9, A12, and A13). The result of the statistical test shows that site characteristics significantly affect resident attitudes toward the frustrating situations, except that of cartoon 3. Cartoon 1 was significant at a significance level of 1%, whereas cartoons 2, 4, and 5 were significant at 5%. This result can be interpreted as follows. For cartoons 1 and 2, urban residents attach greater importance to the natural environment, while those living in rural and urban-rural mixed sites desire a harmony between the natural environment and life convenience. For cartoon 3, the attitudes toward energy saving and personal needs are not affected by site characteristics. For cartoons 4 and 5, residents living in quiet rural sites have a greater tendency to focus on the effects of sleep disturbance due to aircraft noise and the fear of an airplane crash than those in other sites. This is reasonable because people living in quiet rural sites tend to be more strongly annoyed by aircraft noise than residents in other sites. Shepherd et al. found that the rural location was home to more people who were “very annoyed” by noise compared to the city location because unnatural sounds are more annoying in the context of green areas and perhaps mask other natural sounds [18].
3.3.2. Occupations
The test participants were classified as farmers and other occupations. It was expected that farmers might have different attitudes toward the airport and the natural environment due to different features in their working conditions. Farmers are assumed to spend time outdoors longer than others and to be exposed to a higher level of aircraft noise. Visual experiences of many aircraft flying overhead everyday may also affect their attitudes toward the airport. Farmers were expected to live close to the natural environment and feel more in favor of it than others. As a result, they were expected to prefer the natural environment to life convenience. However, no significant difference in the attitudes was found between farmers and other occupations. This result suggests that participant attitudes toward the living environment around the airport are not influenced by their occupations.
3.3.3. Vulnerable Family Members
Test participants in this study were asked whether they lived with vulnerable family members, such as night-shift workers, students preparing for examinations, and/or sick or elderly people. As a result, this factor was found to considerably decrease the rate of positive attitudes toward the frustrating situations, except cartoon 2.
3.3.4. Age
The ages of the test participants were classified as “under 30-years-old,” “from 30 to 50-years-old,” and “over 50-years-old.” The result shows that age had no effect on the attitudes toward the frustrating situations. However, it can be seen that the younger participants gave a higher priority to personal needs, and this rate was slightly higher than that of the older participants.
3.4. Comparison of the Data Obtained from the Picture-Frustration Test and the Questionnaire Survey
3.4.1. Correlation between the P-F Test and the Questionnaire
To investigate the consistency between the P-F test and the questionnaire, we calculated correlations (Spearman’s rank correlation coefficient) between the responses to cartoons 1–5 and replies of nine selected questions used in the questionnaire survey (Table 8). The replies of the questions in the questionnaire survey include three categories: 1. agree, 2. neutral, and 3. disagree. As a result, 11 out of 45 corresponding pairs of data were shown to be significantly correlated, indicating a slight correlation between the two methods. Particularly, responses to Questions 7–8 (“I would prefer to maintain a quiet environment rather than livening up my town by inviting an airport”), Questions 7–12 (“People around the airport have to tolerate aircraft noise as aircraft are necessary for rapid transportation”), and cartoon 1 were compared by cross-tabulation (Table 9). Responses to cartoon 1 (“It’s good. The opening of a nearby airport improved our life convenience, although I am sometimes annoyed by aircraft flyover noise!”) were classified into three categories of different tolerance levels for aircraft noise: tolerant, neutral, and intolerant. Since a participant in the P-F test expressed her/his opinions and attitudes as if she/he was one of the persons in the cartoon, her/his real intention was more easily revealed than with the questionnaire method, in which she/he had to answer with her/his thoughts directly. However, as shown in a comparison between the P-F test and questionnaire methods in Table 9, the majority of responses to Q7–8 is disagreement, while that for Q7–12 is agreement, then both indicate a preference to life convenience rather than tranquility. In cartoon 1, there were more tolerant/neutral responses than intolerant ones, or very few participants in the P-F test had negative attitudes toward the airport. Therefore, both the P-F test and questionnaire methods indicate the same trend of participants’ attitudes. Since the questionnaire was conducted after completing the P-F test, the answers to the questionnaire were possibly influenced by the P-F test. However, both the answers in the P-F test and the questionnaire reflected the participants’ real intentions. In summary, it can be concluded that the results of the questionnaire and the P-F test are somewhat correlated to each other.
Table 8.
Correlation between the P-F test and the questionnaire methods.
Table 9.
Cross-tabulation between responses to cartoon 1 in the P-F test and Question Q7-8 and Q7-12 in the questionnaire survey.
3.4.2. Comparison of the Responses between the P-F Test and Questionnaire
Comparisons was performed to examine whether there was a difference in participants’ reports between the P-F test and the questionnaire from the following three viewpoints: solicitude and transport convenience, attitude toward the airport, and annoyance and sleep disturbance in their living area.
- (1)
- Solicitude and transport convenience
In the two surveys, the participants’ attitudes on solicitude and transport convenience were evaluated by using the question Q1 in the questionnaire “Please evaluate your living area according to the following items: Quietness around the house (Q1-4); Convenience to access to public transportation (Q1-9) with a 5-point scale: (i) Extremely good; (ii) Good; (iii) Neither good nor bad; (iv) Bad; (v) Extremely bad.” The percentage of “not quiet” was defined as the percentage of people who selected “bad” or “extremely bad.” The same calculation was also applied to the evaluation of the percentage of “not convenient”.
- (2)
- Attitude toward the airport: The “attitude toward the airport” in the P-F test was assessed from the results of cartoon 1. The percentage of participants who showed negative attitudes toward the airport was counted as the % rejected.
- (3)
- Annoyance and sleep disturbance: Regarding “aircraft noise annoyance,” test participants in the questionnaire were asked to express their degree of annoyance using the following 4-point scale in the questionnaire (Q4): “Please select the degree of your annoyance due to aircraft noise: (i) Very annoyed; (ii) Annoyed and sometimes cannot stand it; (iii) Annoyed but can stand it; (iv) Disturbed sometimes, but not serious.” The percentage of participants who selected either of the first two options was counted as the % Annoyed. Regarding “sleep disturbance,” answers for cartoon 4 were used for the P-F test to calculate % Sleep disturbed.
Figure 4a,b show comparisons of the exposure-response relationships for the participants’ attitudes and responses, which were obtained by P-F test and questionnaire methods. Logistic regression was used to plot the exposure-response curves. The day-evening-night-weighted sound pressure level ) is used as the noise metric for comparing % Not Quiet, % Not Convenient, % Reject, and % Annoyed, while the nighttime equivalent continuous sound pressure level () was used for comparing % Sleep Disturbed.
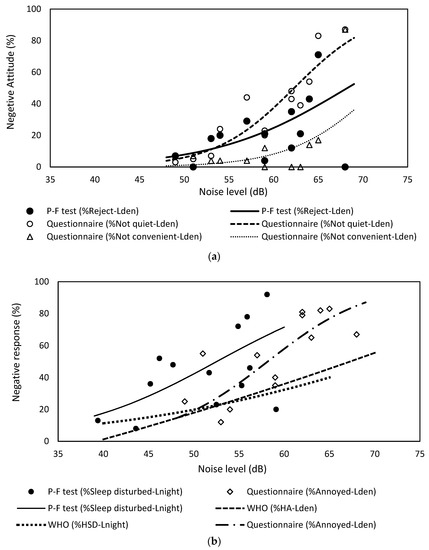
Figure 4.
(a) Comparison of exposure–response relationships obtained by P-F test and questionnaire: % Reject- relationship obtained from the P-F test and % Not quiet- and % Not convenient- relationships obtained from the questionnaire. (b) Comparison of exposure-response relationships obtained by P-F test and questionnaire: % Sleep disturbed- relationship obtained from the P-F test and the % Annoyed- relationship obtained from the questionnaire.
Figure 4a shows the relationships between the participants’ negative attitude defined by the percentage of participants denouncing the airport (% Reject) in the P-F test, the percentage of participants evaluate their living area not quiet (% Not quiet) and not convenient (% Not convenient) in the questionnaire and noise level ). For values at about 65 dB, 50–60% of the participants feel it’s not quiet (questionnaire), 10–20% of the participants feel it’s not convenient (P-F test), generally 30–40% of the participants reject an airport (P-F test). As a result, all the relationships tend to increase, meaning that when the noise exposure increases, the number of negative attitudes increase. The curves of the % Not quiet- is steeper than those of the % Reject and % Not Convenient. Except a very high % Not convenient obtained at Site 5, the site with the highest aircraft noise level, the number of people feeling inconvenient does not increase proportionally to an increase in the noise levels. The curve of % Reject lies between that of % Not quiet and % Not convenient. This result is quite plausible as the subjective evaluation about the quietness is more related to exposure levels than the evaluation of convenience. The level of the reject attitude towards the airport obtained by the P-F test is affected by noise levels but to some extent in between that of the quietness and convenience evaluation.
Figure 4b shows a comparison of the % Sleep disturbed- relationship obtained from the P-F test method and the % Annoyed- relationship obtained by the questionnaire method. Regarding “sleep disturbance,” value between 55 and 60 dBA results in up to about 90% disturbance with the P-F test. For values at about 65 dB, about 80% of the participants are annoyed according to the results of the questionnaire.
The relationships obtained in this study were compared to those established in the Environmental Noise Guidelines for the European Region by the World Health Organization [19] for annoyance and sleep disturbance, presented as WHO (%HA-) and WHO (% HSD-), respectively. In this study, the percent highly annoyed was obtained from the percentage of participants who selected either of the first two categories of the four-point scale, or top 50% on the evaluation scale. Regarding “sleep disturbance,” answers for Cartoon 4 in the P-F test were classified to calculate % Sleep disturbed. The relationships in the WHO’s guidelines are based on data of studies that measured the effect of aircraft noise on self-reported annoyance and sleep outcome. The percentage of highly annoyed persons (%HA) and highly sleep disturbed (% HSD) was obtained from top 27–28% on the evaluation scale. Since the higher value of the cut-off point induces a higher prevalence of annoyance and disturbance, our study’s relationships are higher than those established in WHO’s Guidelines.
Regarding the survey methods, it is unclear to confirm whether the difference in survey method used may have influenced the level of negative attitudes and responses. As shown in Figure 4a, more negative evaluation obtained from the questionnaire than from the P-F test at about 55 dB or more exposure level, but this difference becomes insignificant in quieter sites. An opposite trend was found in Figure 4b, more negative response was obtained from the P-F test than from the questionnaire. With the same cut-off point, the level of sleep disturbance obtained by the P-F test is higher than that obtained in the questionnaire.
In summary, the comparison result suggests that participants’ negative attitudes toward the airport between the P-F test and the questionnaire are not significantly different. In other word, there is a tendency that the data of % Annoyed by aircraft noise obtained from the questionnaire and %Sleep Disturbed of the P-F test are the same. This similarity is reasonable since evaluation of annoyance and sleep disturbance are consistent. Moreover, it is worth noting that the people living in the site with higher aircraft noise levels will have more negative evaluations regarding their surrounding environment and are more likely to express their rejection of the airport. One might hypothesize that those living closer to NBIA are more likely to have a negative attitude to the airport because they can hear the airport and airplanes’ noise. In a study on residents’ attitude toward wind turbine project [20], there is a significant, negative correlation between those who can hear the turbine from home and distance from the turbine This result somewhat support the finding of our study.
3.5. Comparison of Participants’ Attitudes Obtained by the P-F Test Method in This Study and Other Studies in Osaka and Hanoi
The results of obtained from the residents around NBIA were compared to results of the preliminary P-F test conducted with residents living in downtown Hanoi [15] and the study conducted in Osaka, Japan [13] for a cross-cultural comparison (Table 10). Since test participants of the present study were residents from a wide range of ages, the responses from the “under 30 years old” category can be compared to those obtained from the studies in Osaka and Hanoi where a majority of participants were university students.
Table 10.
Comparison of participants’ attitudes among surveys in Osaka [13], Hanoi [15], and this study.
While the residents around NBIA had an attitude of accepting a new airport for the benefits that it brings despite its environmental impact, different results were found from the studies in Osaka and Hanoi. As shown in Table 10, the percentages of negative responses in Cartoon 1 were 53% and 58% in Osaka (all test participants were university students) and in Hanoi (the majority of test participants were young people), respectively. In Osaka and Hanoi studies, respondents considered quietness more important than life convenience brought by an airport. In other words, young participants in Osaka and Hanoi show their preference to tranquility, indicating the different trend from the responses obtained from the P-F test and questionnaire survey in NBIA. The difference in environmental awareness between urban young residents in Hanoi/Osaka and those living around NBIA can be explained by their different living situations. NBIA is located in the suburbs of Hanoi and lacks essential facilities. Therefore, residents living around NBIA might have a stronger desire for the life convenience than those from Osaka and Hanoi.
From the responses to Cartoon 2, the test participants living around NBIA show a preference to the richness of nature rather than the convenience of life. These attitudes were different from attitudes of those living in Hanoi and Osaka, who attach a higher importance to the living comfort than the rich natural environment.
Some studies on effects of built environment on the mental health and well-being indicates that the health status of the residents was affected by the density of their living area [21,22,23]. When too-high density leads to overcrowding and congestion, lack of green spaces, and higher noise pollution, low density is associated with high land consumption for road infrastructure, reduced opportunities for daily social and physical activities. The reasonable density with efficient use of soil and accessible services is desired by residents in urban as well as rural areas.
Through responses obtained with Cartoon 3, more participants around NBIA showed their acceptance of the fuel consumption for life convenience rather than protection of the environment. This trend is similar with that found in the preliminary study in Hanoi, whereas the study in Osaka shows a tendency that neutral responses were dominant. This result was unexpected because motorcycles are still the most popular means of ground transport in Vietnam, while Japan is a society with automobile congestion and rail transport. In addition, the purpose of Cartoon 3 was to investigate whether environmental protection is preferred and it was expected that negative attitudes to fuel consumption would be preferred to indicate the preference to environmental protection. However, the major reason for most negative responses to fuel consumption reflected in test participant answers was that they could not afford a sufficient amount of fuel for private long-distance travel because of high gasoline prices in Vietnam, whereas in Japan, the awareness of environmental protection was reflected in the opinions of test participants’ negative attitudes.
Considering effect of age on residents’ attitudes in the present study, it could be found that the younger participants gave a higher priority to personal needs, and this rate was slightly higher than that of the older participants. This trend of the young participant living near NBIA is similar to those living in Hanoi and Osaka, as reported in references 5 and 8.
4. Discussion and Implications
The Picture-Frustration test was conducted to assess attitudes toward the airport, aircraft noise, their living environment, and their awareness of environmental protection of communities around the Hanoi Noi Bai International Airport. The result shows that there is a significant difference in attitudes toward the airport and natural environment among residents in different sites around the airport. Urban residents showed more preference to natural environment than those living in rural and mixed sites, while the latter desired a harmony between rich nature and life convenience, and had more complaints about the effects of aircraft noise on sleep than the former. Factors of occupations and gardening activities did not affect residents’ attitudes toward the airport.
Studies related to this issue have quite different conclusions on how the land use, density, and topography relate to the residents’ health, behavior, and tolerance to noise. Chan and Liu [24] studied the impacts of neighborhood building density and height on occupant health. They found that buildings with lower neighborhood building density and height had better acoustic performances and lower noise levels, because neighborhood buildings obstructed the free propagation of noise from street and road traffic, attenuating its sound level [25]. Camusso and Pronello showed that the site characteristics induced annoyance variability in the urban context [26]. More people were annoyed in broad streets than in narrow streets. Park et al. found that the rural setting led to a better psycho-physiological recovery than the urban setting when the stimuli were presented both in the virtual reality and screen conditions [27]. Hawkins and Large compared the subjective response to noise from road traffic from 10 villages in rural areas with the response from urban and suburban areas and found no evidence of a difference in dose-response relationships between the two studies [28]. These studies neither strongly support nor contradict our findings.
In addition to data related to noise, it is necessary to combine subjective data with objective data on the study area’s topographic morphology for more in-depth insight in the future study. The use of light detection and ranging (LiDAR) technology or airborne laser scanning to collect high-resolution data for generating a digital surface or digital terrain model has been in interest in recent years [29]. LiDAR has been utilized in transportation features mapping, especially concerning density analysis [30,31]. Luo et al. explored airborne LiDAR point density’s effects on estimates of crop parameters such as vegetation leaf area index, height, and aboveground biomass [32]. The system captures overlapping digital photographs covering the area of interest, allowing for colorizing point clouds, texturing of meshes, or creating orthorectified photographs of the study site. We will consider this technology to generate three-dimension models for acoustic and noise modeling with metrics to characterize survey sites’ typologies.
Statistical analysis of the responses obtained using the P-F test method and questionnaire showed both the correlation and variance of the data, which suggests that the results of the investigation may be different depending on the method and form of questioning. Residents may answer differently in response to the method of questioning. Using multiple questioning methods is recommended to check the validity of answers and explore the true opinions of residents. The attitudes of the participants obtained using these assessment tools also varied depending on the exposure noise levels. Although the results obtained from the P-F test are expected to be more objective, less biased and less subjective than the questionnaire, they are still based on the data provided by test participants. The current research method of driving behavior mapping based on naturalistic driving data provides excellent potential for future research on environmental attitude [33]. Mapping naturalistic driving data with Geographic Information Systems (GIS) allows for a deeper understanding of driving behavior, achieving a smarter and broader perspective of the whole datasets. This powerful tool can be applied to measuring people’s behavior under different circumstances like those analyzed in this study.
In this study, the P-F test was conducted with the participants who were living near the airport in suburban sites far from the city center and the obtained responses were compared to those who were living far from the airport, but in the city center in Hanoi and Japanese who were living near the airport in the city center in Osaka. Differences were found between the participants in this study and those in the compared studies, indicating that preference towards life comfort and environmental protection differ significantly depending on the living conditions of the test participants. Some recent studies revealed that the natural environment’s experience in childhood relates to adult perceptions and value the space for their health and well-being [34,35]. Unfortunately, our study does not address participants’ past experiences. This issue should be added in the next study. Moreover, responses obtained using only the P-F test did not clearly indicate negative attitudes toward aircraft noise, different from those obtained using the questionnaire in the study in Japan [13]. It suggests that different attitudes may be obtained if the P-F test is applied to test participants with different cultural backgrounds. Some recent studies work in sentiment analysis using Twitter or social networks [36,37,38]. Plunz et al. used the Geolocated Twitter Database and classified tweets into three categories of sentiment: positive (p = 1), neutral (p = 0), or negative (p = −1) to compare the content of Twitter sentiment between inside and outside the parks in Manhattan, New York City, and three other districts [36]. Similar studies have been conducted in Melbourne [37] and London [38]. Though these kinds of works have a scope similar to our study, the method of using Twitter sentiment differs greatly to the P-F test. The P-F test attempts to identify the respondents in the targeted area and allow to observe the projection reaction under the conditions set by the researcher. However, the Geolocated Twitter Database is applicable to research of wide area and, therefore, promises to be an effective method for environmental studies in the future.
5. Conclusions
The P-F test was found to be helpful for the assessment of residents’ attitudes toward the airport when its operational expansion is considered or when a new airport construction is planned. These situations are common as air traffic rapidly develops. Responsible authorities need to understand the feelings and aspirations of people living in the project area in order to develop suitable policies, avoiding conflicts between the government and residents when implementing the project. This approach can also be applied in other circumstances where there are conflicts of interest, such as transport infrastructure development projects, that generally bring both economic and utility benefits, but also have a negative impact on the living environment, because the cartoons used in this study were universally designed.
Author Contributions
Conceptualization, T.N., I.Y., S.K. and T.Y.; formal analysis, T.N., I.Y. and M.M.; investigation, T.N., I.Y. and T.Y.; writing—Original draft preparation, T.N.; writing—Review and editing, T.N., I.Y., S.K., T.Y. and M.M.; supervision, T.N.; project administration, T.N.; funding acquisition, T.N., T.Y. and I.Y. All authors have read and agreed to the published version of the manuscript.
Funding
This research was funded by Grant-in-Aid for Young Scientists (No. 19K15150), Grant-in-Aid for Research Activity Start–up (No. 17H06875), Grant-in-Aid for Scientific Research (C) (No. 26420585) from the Japan Society for the Promotion of Science, and by a joint project between the Aviation Environment Research Center and Kumamoto University for Information Exchange on the Aviation Environment among Asian Countries.
Institutional Review Board Statement
Not applicable.
Informed Consent Statement
Informed consent was obtained from all subjects involved in the study.
Data Availability Statement
Data sharing not applicable.
Acknowledgments
The authors sincerely thank the individuals who kindly participated in the study and appreciate the contributions of the staff of the Civil Aviation Authority of Vietnam and the students of Hanoi University of Mining and Geology for the questionnaire survey and noise measurements.
Conflicts of Interest
The authors declare no conflict of interest.
References
- Guski, R. How to forecast community annoyance in planning noisy facilities. Noise Health 2004, 6, 59–64. [Google Scholar]
- Hatfield, J.; Job, R.F.S.; Carter, N.L.; Peploe, P.; Taylor, R.; Morell, S. The role of adaptation in responses to noise exposure: Comparison of steady state with newly high noise areas. In Proceedings of the Fourth European Conference on Noise Control, Euronoise PATRA, Patras, Greece, 14–17 January 2001. [Google Scholar]
- European Centre for Environment and Human Health, University of Exeter Medical School, Health and the Natural Environment. A Review of Evidence, Policy, Practice and Opportunities for the Future, Report published by Department for Environment, Food and Rural Affairs Nobel House, Smith Square, London (Defra Project Code BE0109) and are from the Department’s Science and Research Projects Database. Available online: http://randd.defra.gov.uk (accessed on 27 January 2021).
- Namba, S.; Kuwano, S.; Nakamura, T.; Kato, T. A questionnaire survey on community noise. J. Acoust. Soc. Jpn. 1978, 34, 592–599. [Google Scholar]
- Rosenzweig, S. Guide to Research on the Rosenzweig Picture-Frustration (P-F) Study, 1934–1974. J. Pers. Assess. 1976, 40, 599–606. [Google Scholar] [CrossRef] [PubMed]
- Rosenzweig, S.; Clarke, H.J.; Garfield, M.S.; Lehndorff, A. Scoring sample for the Rosenzweig Picture Frustration Study. J. Psychol. 1946, 21, 45–72. [Google Scholar] [CrossRef] [PubMed]
- Rosenzweig, S. The picture-association method and its application in a study of reactions to frustration. J. Pers. 1945, 14, 3–23. [Google Scholar] [CrossRef]
- Colman, A.M. Rosenzweig Picture-Frustration Study, A Dictionary of Psychology, 3rd ed.; Oxford University Press Print: Oxford, UK, 2008. [Google Scholar]
- Castillo, D.R.; Roda, C.G.; Guell, F.; Montalvo, J.F.; Bernacer, J.; Morón, I. Frustration Tolerance and Personality Traits in Patients with Substance Use Disorders. Front. Psychiatry 2019. [Google Scholar] [CrossRef]
- Hornsveld, R.; Nijman, H.; Hollin, C.R.; Kraaimaat, F.W. An adapted version of the Rosenzweig Picture-Frustration Study (PFS-AV) for the measurement of hostility in violent forensic psychiatric patients. Crim. Behav. Ment. Health 2007, 17, 45–56. [Google Scholar] [CrossRef]
- Hashimoto, N. Neighbors Are Annoying—Fear of Noise Trouble; KK Bestsellers: Tokyo, Japan, 2006. [Google Scholar]
- Hashimoto, N. Preliminary Survey on Noise Complaint Response by using PF Study. Archit. Inst. Jpn. Tech. Rep. 2005, 22, 335–340. [Google Scholar]
- Yoshioka, H.; Goto, K.; Morinaga, M.; Yamada, I.; Kuwano, S.; Namba, S. Factors affecting the harmonious coexistence of the airport and local communities. In Proceedings of the 20th International Congresses on Acoustics, Sydney, Australia, 23–27 August 2010. [Google Scholar]
- Kuwano, S.; Namba, S.; Yamada, I.; Yoshioka, H.; Morinaga, M. Subjective responses to aircraft noise using picture frustration study. In Proceedings of the 41st International Congress and Exposition on Noise Control Engineering, New York, NY, USA, 9–12 August 2012. [Google Scholar]
- Nguyen, T.L.; Yano, T.; Yamada, I.; Kuwano, S.; Nguyen, H.Q. Picture Frustration Study on attitudes towards life convenience and natural environment in Hanoi. In Proceedings of the 44th International Congress and Exposition on Noise Control Engineering, San Francisco, CA, USA, 9–12 August 2015. [Google Scholar]
- Nguyen, T.L.; Nguyen, T.L.; Morinaga, M.; Yokoshima, S.; Yano, T.; Sato, T.; Yamada, I. Community response to a step change in the aircraft noise exposure around Hanoi Noi Bai International Airport. J. Acoust. Soc. Am. 2018, 143, 2901–2912. [Google Scholar] [CrossRef] [PubMed]
- Namba, S.; Kuwano, S.; Kaku, J.; Kuno, K.; Sasaki, M.; Tachibana, H.; Yamada, I. Proposal of fundamental items for social survey on noise problem. Acoust. Sci. Tech. 2020, 31, 124–128. [Google Scholar] [CrossRef][Green Version]
- Shepherd, D.; Welch, D.; Dirks, K.N.; McBride, D. Do quiet areas afford greater health related quality of life than noisy areas? Int. J. Environ. Res. Public Health 2013, 10, 1284–1303. [Google Scholar] [CrossRef]
- World Health Organization. Environmental Noise Guidelines for the European Region; World Health Organization Regional Office for Europe: Copenhagen, Denmark, 2018. [Google Scholar]
- Firestone, J.; Batesb, A.; Knappb, L.A. See me, Feel me, Touch me, Heal me: Wind turbines, culture, landscapes, and sound impressions. Land Use Policy 2015, 46, 241–249. [Google Scholar] [CrossRef]
- Gelormino, E.; Melisb, G.; Marietta, C.; Costa, G. From built environment to health inequalities: An explanatory framework based on evidence. Prev. Med. Rep. 2015, 2, 737–745. [Google Scholar] [CrossRef] [PubMed]
- Dzhambov, A.M.; Iana-Markevych, I.; Lercher, P. Greenspace seems protective of both high and low blood pressure among residents of an Alpine valley. Environ. Int. 2018, 121, 443–452. [Google Scholar] [CrossRef]
- Moore, T.H.M.; Kesten, J.M.; López-Lópezb, J.A.; Ijaz, S.; McAleenanb, A.; Richardsa, A.; Grayd, S.; Savović, J.; Audrey, S. The effects of changes to the built environment on the mental health and well-being of adults: Systematic review. Health Place 2018, 53, 237–257. [Google Scholar] [CrossRef] [PubMed]
- Chan, I.Y.S.; Liu, A.M.M. Effects of neighborhood building density, height, greenspace, and cleanliness on indoor environment and health of building occupants. Build. Environ. 2018, 145, 213–222. [Google Scholar] [CrossRef]
- Guedes, I.C.M.; Bertoli, S.R.; Zannin, P.H. Influence of urban shapes on environ-mental noise: A case study in Aracaju—Brazil. Sci. Total Environ. 2011, 412, 66–76. [Google Scholar] [CrossRef] [PubMed]
- Camusso, C.; Pronello, C. A study of relationships between traffic noise and annoyance for different urban site typologies. Transp. Res. Part D Transp. Environ. 2016, 44, 122–133. [Google Scholar] [CrossRef]
- Park, S.H.; Lee, P.J.; Swenson, A. Effects of the aural and visual experience on psycho-physiological recovery in urban and rural environments. Appl. Acoust. 2020, 169, 107486. [Google Scholar] [CrossRef]
- Hawkins, M.M.; Large, J.B. Subjective response to noise in rural villages, particularly from road traffic. J. Sound Vib. 1983, 88, 321–331. [Google Scholar] [CrossRef]
- Schrott, L.; Otto, J.-C.; Götz, J.; Geilhausen, M. Fundamental Classic and Modern Field Techniques in Geomorphology: An Overview. In Treatise on Geomorphology; Methods in Geomorphology, 6–21; Shroder, J., Switzer, A.D., Kennedy, D.M., Eds.; Academic Press: San Diego, CA, USA, 2013; Volume 14. [Google Scholar]
- Li, Q.; Ma, Y.; Anderson, J.; Curry, J.; Jie-Shan, J. Towards Uniform Point Density: Evaluation of an Adaptive Terrestrial Laser Scanner. Remote Sens. 2019, 11, 880. [Google Scholar] [CrossRef]
- Suliman-Gargoum, S.; El-Basyouny, K. Effects of LiDAR Point Density on Extraction of Traffic Signs: A Sensitivity Study. Transp. Res. Rec. 2019, 2673, 41–51. [Google Scholar] [CrossRef]
- Luo, S.; Chen, J.M.; Wang, C.; Xi, X.; Zeng, H.; Peng, D.; Li, D. Effects of LiDAR point density, sampling size and height threshold on estimation accuracy of crop biophysical parameters. Opt. Express 2016, 24, 11578–11593. [Google Scholar] [CrossRef]
- Barreiro, J.B.; Valero-Mora, P.M.; Berné-Valero, J.L.; Varela-García, F.A. GIS Mapping of Driving Behavior Based on Naturalistic Driving Data. ISPRS Int. J. Geo Inf. 2019, 8, 226. [Google Scholar] [CrossRef]
- Ward-Thompson, C.; Aspinall, P.; Montarzino, A. The Childhood Factor: Adult Visits to Green Places and the Significance of Childhood Experience. Environ. Behav. 2008, 40, 111–143. [Google Scholar] [CrossRef]
- Milligan, C.; Bingley, A. Restorative places or scary spaces? The impact of woodland on the mental well-being of young adults. Health Place. 2007, 13, 799–811. [Google Scholar] [CrossRef]
- Plunz, R.A.; Zhou, Y.; Vintimilla, M.I.C.; Mckeown, K.; Yu, T.; Uguccioni, L.; Sutto, M.P. Twitter sentiment in New York City parks as measure of well-being. Landsc. Urban Plan. 2019, 189, 235–246. [Google Scholar] [CrossRef]
- Lim, K.H.; Lee, K.E.; Kendal, D.; Rashidi, L.; Naghizade, E.; Winter, S.; Vasardani, M. The Grass is Greener on the Other Side: Understanding the Effects of Green Spaces on Twitter User Sentiments. In Proceedings of the Companion of the Web Conference 2018 (275–282) International World Wide Web Conferences Steering Committee, Lyon, France, 23–27 April 2018. [Google Scholar]
- Kovacks-Györi, A.; Ristea, A.; Kolcsar, R.; Resch, B.; Crivellari, A.; Blaschke, T. Beyond spatial proximity-classifying Parks and their visitors in London based on spatiotemporal and sentiment analysis of Twitter data. Int. J. Geo Inf. 2018, 7, 378. [Google Scholar] [CrossRef]


Publisher’s Note: MDPI stays neutral with regard to jurisdictional claims in published maps and institutional affiliations. |
© 2021 by the authors. Licensee MDPI, Basel, Switzerland. This article is an open access article distributed under the terms and conditions of the Creative Commons Attribution (CC BY) license (http://creativecommons.org/licenses/by/4.0/).