Article

Impact of NaOH Concentration on Deweaving of Cotton Fabric in Aqueous Solutions

1
Department of Materials Science and Chemical Engineering, Stony Brook University, Stony Brook, NY 11794, USA
2
Da Vinci College of General Education, Chung-Ang University, Seoul 06974, Korea
*
Authors to whom correspondence should be addressed.
Sustainability 2021, 13(4), 2015; https://doi.org/10.3390/su13042015
Submission received: 31 December 2020 / Revised: 8 February 2021 / Accepted: 10 February 2021 / Published: 13 February 2021

Abstract

:
In the past decade, there has been increasing attention paid to the recycling of cotton fabric waste. In the present study, different concentrations of sodium hydroxide (NaOH) ranging from 1 M to 4 M were used to thermomechanically deweave cotton fabric. The fabrics treated with 1 M NaOH and 2 M NaOH were partially deweaved, whereas those treated with 3 M NaOH and 4 M NaOH were completely deweaved. Fourier-transform infrared (FTIR) spectroscopy was applied to analyze the chemistry and structure of the cotton fabric. The FTIR spectra indicated that the structure of cotton fabrics treated with 1–2 M NaOH were similar to that of pristine fabric, while the presence of NaOH was observed. In the case of samples treated with 3–4 M NaOH, both the peak positions and the band intensities were changed, in addition to the formation of cellulose II. FTIR spectra for the recycled NaOH-treated cotton fabrics were compared, and no major structural changes were identified. A post-treatment with deionized (DI) water removed excess Na+ ions, with the sample showing a similar molecular structure to that of the pristine material. These results suggest the feasibility of recycling aqueous NaOH for post-washing treatment as a new method for recycling cellulosic fabric waste.

1. Introduction

The amount of textile waste generated globally is increasing every year and is becoming a serious issue. Approximately 17.03 million tons of textile waste was generated in 2018 [1]. Currently, there are three major recovery methods for textile waste: reuse, recycling, and combustion for energy recovery. About 14.7% (2.51 million tons) of textile waste is recycled, and approximately 18.9% (3.22 million tons) is used for energy recovery [1]. The remaining 66.4% (11.3 million tons) of textile waste is landfilled [1]. The two major methods of textile recycling are mechanical recycling and chemical recycling. Mechanical recycling methods have been used extensively, which include shredding, open-end yarn spinning, and thermoplastic polymer reprocessing [2]. However, this process can lead to a reduction in the length and strength of the fibers [2]. Chemical recycling methods dissolve or depolymerize textile completely into monomers that can be polymerized into new products [2,3]. A considerable advantage of this method is that the source of the textiles to be recycled and added contamination can be ignored once the polymers resulting from the process are identical. However, it is restricted by the cost and efficiency, as the productivity is rather low [4].
Cotton fabric is a popular type of textile that accounts for 24% of the global textile market due to its comfort and durability [3]. Cotton fabric is primarily composed of cellulose, an organic compound that cannot be dissolved directly with common solvents [5,6]. Several solvents (i.e., acid-based, ionic liquid, and alkaline) have long been used to treat cellulose [7,8,9,10]. Among these solvents, sodium hydroxide (NaOH) has been used extensively to dissolve cellulose [11,12,13,14,15,16]. Wang et al. and Sobue et al. reported that the dissolution of cellulose could be limited, and cellulose is soluble within a very narrow range of temperature and NaOH concentration: 7 wt.% (~2 M) to 10 wt.% (~3 M) NaOH at <0 °C [17,18]. During the dissolution process, the Na+ from NaOH penetrates the amorphous and crystalline regions and shifts the crystalline arrangement from parallel (cellulose I) to antiparallel (cellulose II) [19]. This antiparallel arrangement of the cellulose crystalline structure breaks the hydrogen bonds and liberates each molecule to choose its “neighbors” under polar environments [20]. It has also been reported that cellulose swells when it interacts with NaOH (or Na+) through the removal of the cellulose carboxyl group and intra-hydrogen bonds [21,22]. This interfibrillar swelling is represented by a series of ballooning phenomena along the cellulose fiber, resulting in cellulose dissolution [23,24]. The swelling and dissolution efficiency can be increased by increasing NaOH concentrations [23,25,26]. In addition to the swelling and dissolution of cellulose material, alkaline solution treatment improves the quality (i.e., dyeability and strength) of fabric materials, while the weight loss and split number of the fibers are also increased [23,27].
Spectroscopic techniques have been utilized to analyze the molecular structure of two- and three-dimensional (2D/3D) materials, polymers, catalysts, and composite materials [28,29,30,31,32,33,34,35]. Fourier-transform infrared spectroscopy (FTIR) has been applied to study the surface species and functional groups of cellulose-based materials due to its simplicity and fast measurement [36,37,38,39,40]. Abidi et al. studied the structural changes of cellulose using FTIR during cotton fiber development and estimated the content of cotton fiber cellulose on the basis of the 667 cm−1 (OH out-of-plane bending mode) and 897 cm−1 (β-linkage of cellulose) bands [36]. Duchemin studied the conversion of cellulose I to cellulose II during the mercerization process at −17 °C [27]. The author analyzed the FTIR bands of inter/intramolecular hydrogen bonds and confirmed the cellulose I transition (3290 cm−1 and 3333 cm−1) to cellulose II (3440 cm−1 and 3490 cm−1) with increasing NaOH concentration. In addition to the OH peak positions, the peak area in the OH region (3000–3700 cm−1) with the CH2 stretching band (2900 cm−1) as a reference was also used to understand the cellulose I/cellulose II composition in the mercerization process [41,42].
From the economic or process simplification point of view, during the chemical recycling processes, cotton fabric depolymerization followed by re-polymerization processes should be reconsidered. It is hypothesized that the waste cotton fabric materials could be deweaved under controlled chemical concentrations and temperatures. The deweaved cotton fabric waste could be used directly to produce a yarn, followed by fabric production, as shown in Scheme 1.
Therefore, the aim was to investigate the cotton fabric deweaving process using a chemical known to have an impact on fiber interactions, such as NaOH, in mild experimental conditions [12]. In this work, various concentrations of NaOH were used in combination with mechanical stirring to treat samples of equivalent cotton fabrics, and the following questions were addressed: (1) How is the deweaving process affected by NaOH concentration? (2) Will the molecular structure of cotton fabric be affected by NaOH concentration? (3) Can we continuously reuse the same NaOH aqueous solution for the cotton fabric deweaving process? (4) Can any resulting NaOH residue be removed via a simple washing procedure? This paper describes the feasibility of using NaOH for the deweaving of cotton fabric. The morphology and functional group chemistry of cotton fabrics were studied using combined Fourier-transform infrared spectroscopy (FTIR) and digital camera images.

2. Materials and Methods

Cotton muslin samples, which were originally procured from Arthur R. Johnson Co., Inc., Brooklyn, NY, USA, were purchased from the Fashion Institute of Technology (New York, NY, USA). Sodium hydroxide (NaOH, reagent grade) was obtained from Sigma-Aldrich and was used without further purification. The deweaving process was performed on a Benchmark scientific hotplate stirrer (H3760-HS) connected with a temperature probe (H3760-TP). A cotton fabric sample (3 cm × 3 cm, ~0.18 g) was added to a 50 mL NaOH solution (1 M (3.8 wt.%), 2 M (7.4 wt.%), 3 M (10.7 wt.%), or 4 M (13.8 wt.%) of NaOH with deionized water (resistivity: ~20 mΩ/cm)) which was preheated at 50 °C. The mixing speed was 200 rpm and the reaction time was 30 min. After finishing the reaction, the sample was separated from the NaOH solution and dried at room temperature. To test the recyclability of aqueous NaOH, the same NaOH solution was used five times in a row. The consumed NaOH solution (1–2 mL) during the reaction was replenished. Fourier-transform infrared (FTIR) spectroscopy was conducted using a Nicolet™ iS50 FTIR Spectrometer equipped with an attenuated total reflectance (ATR) accessory. The spectra (32 scans/sample, 4 cm−1 resolution) were collected in the range of 400–4000 cm−1 at room temperature. Each spectrum was corrected by a background spectrum using the OmnicTM software (Thermo Scientific, Waltham, MA, USA).

3. Results and Discussion

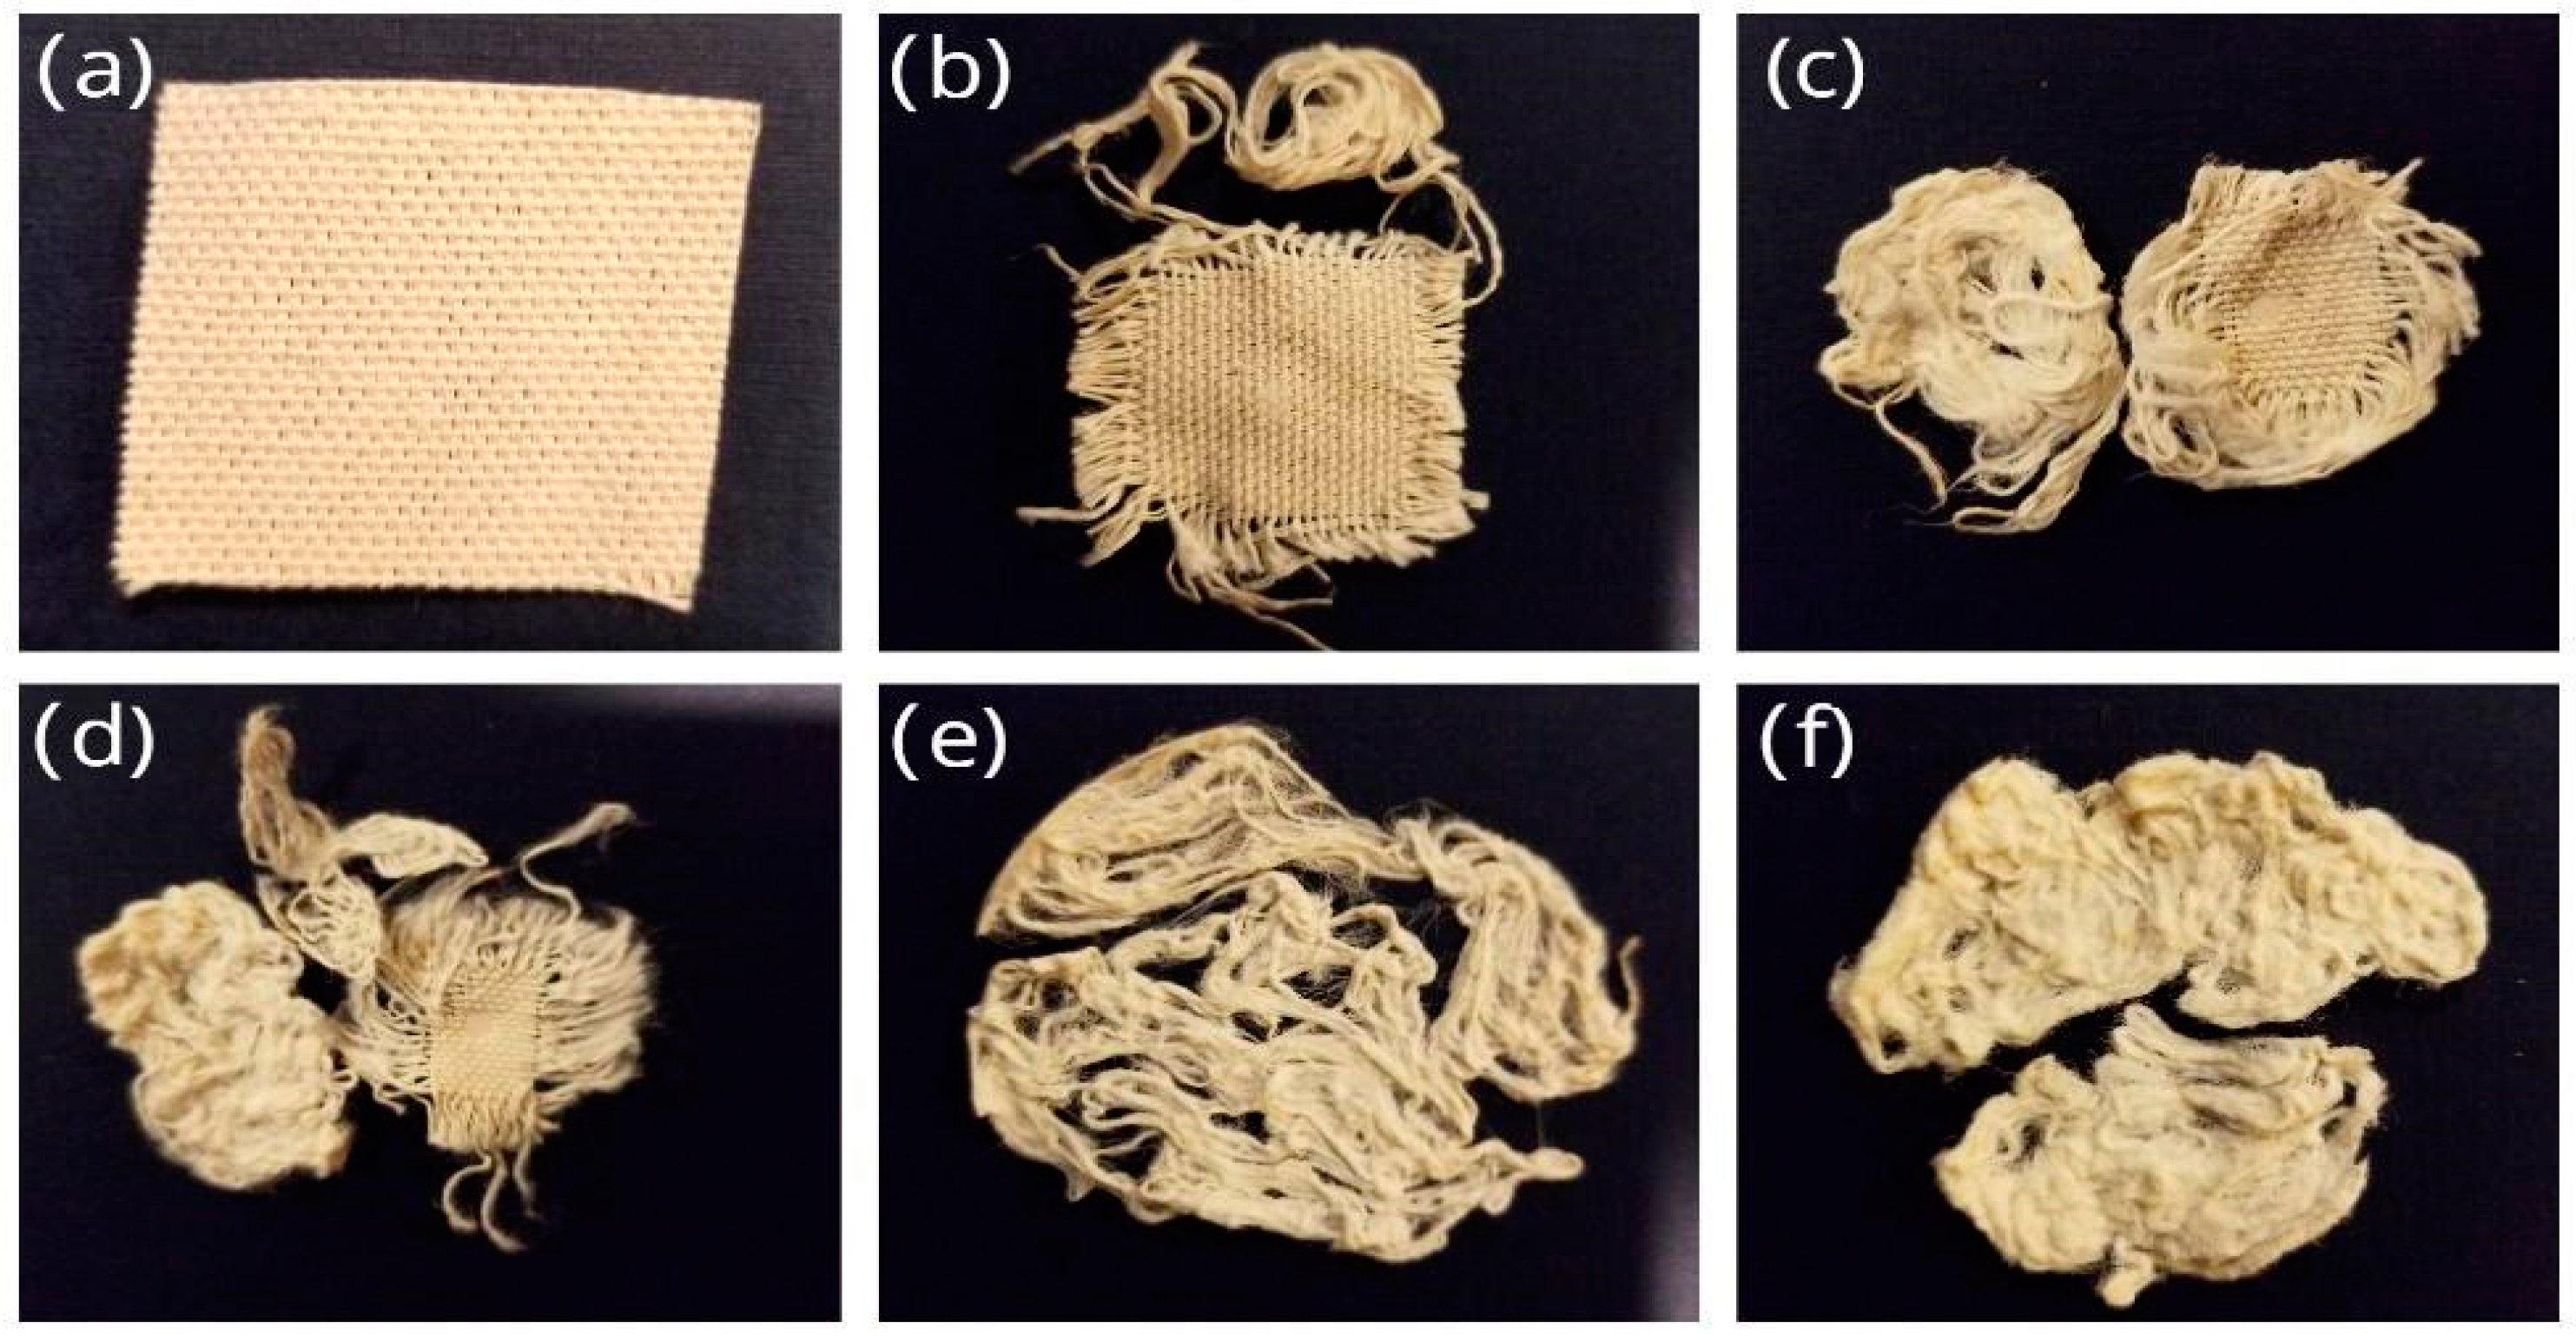
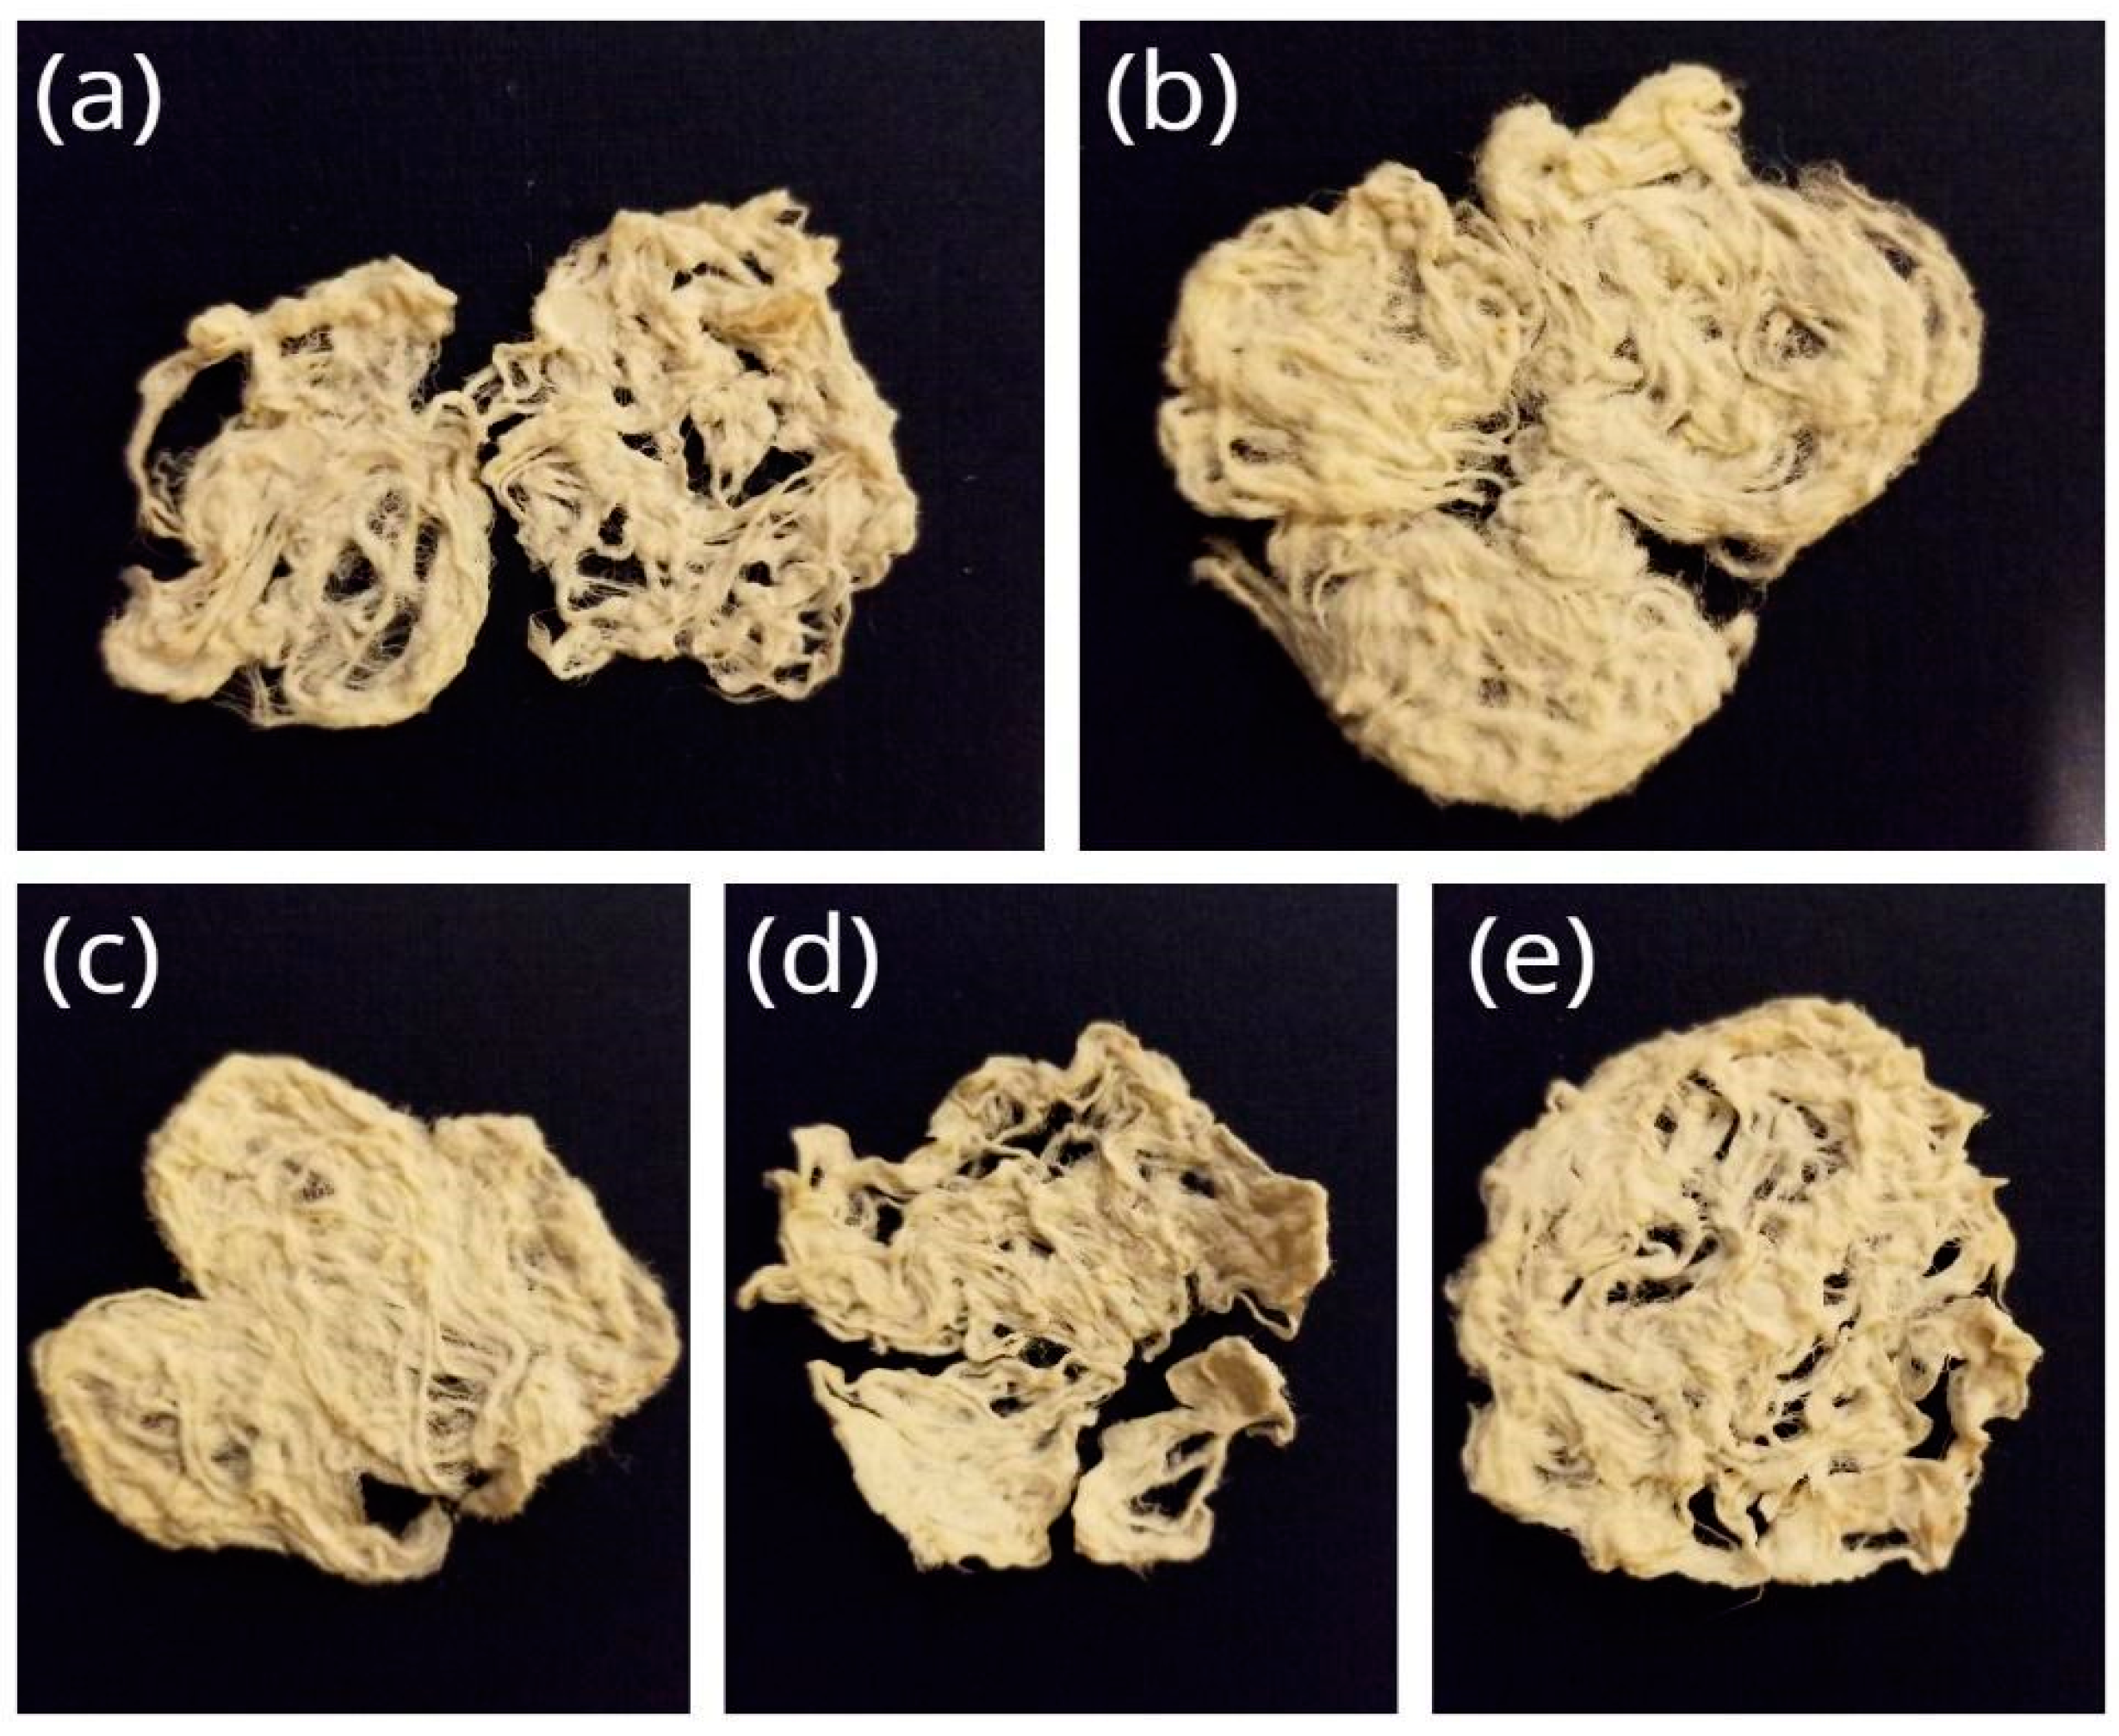
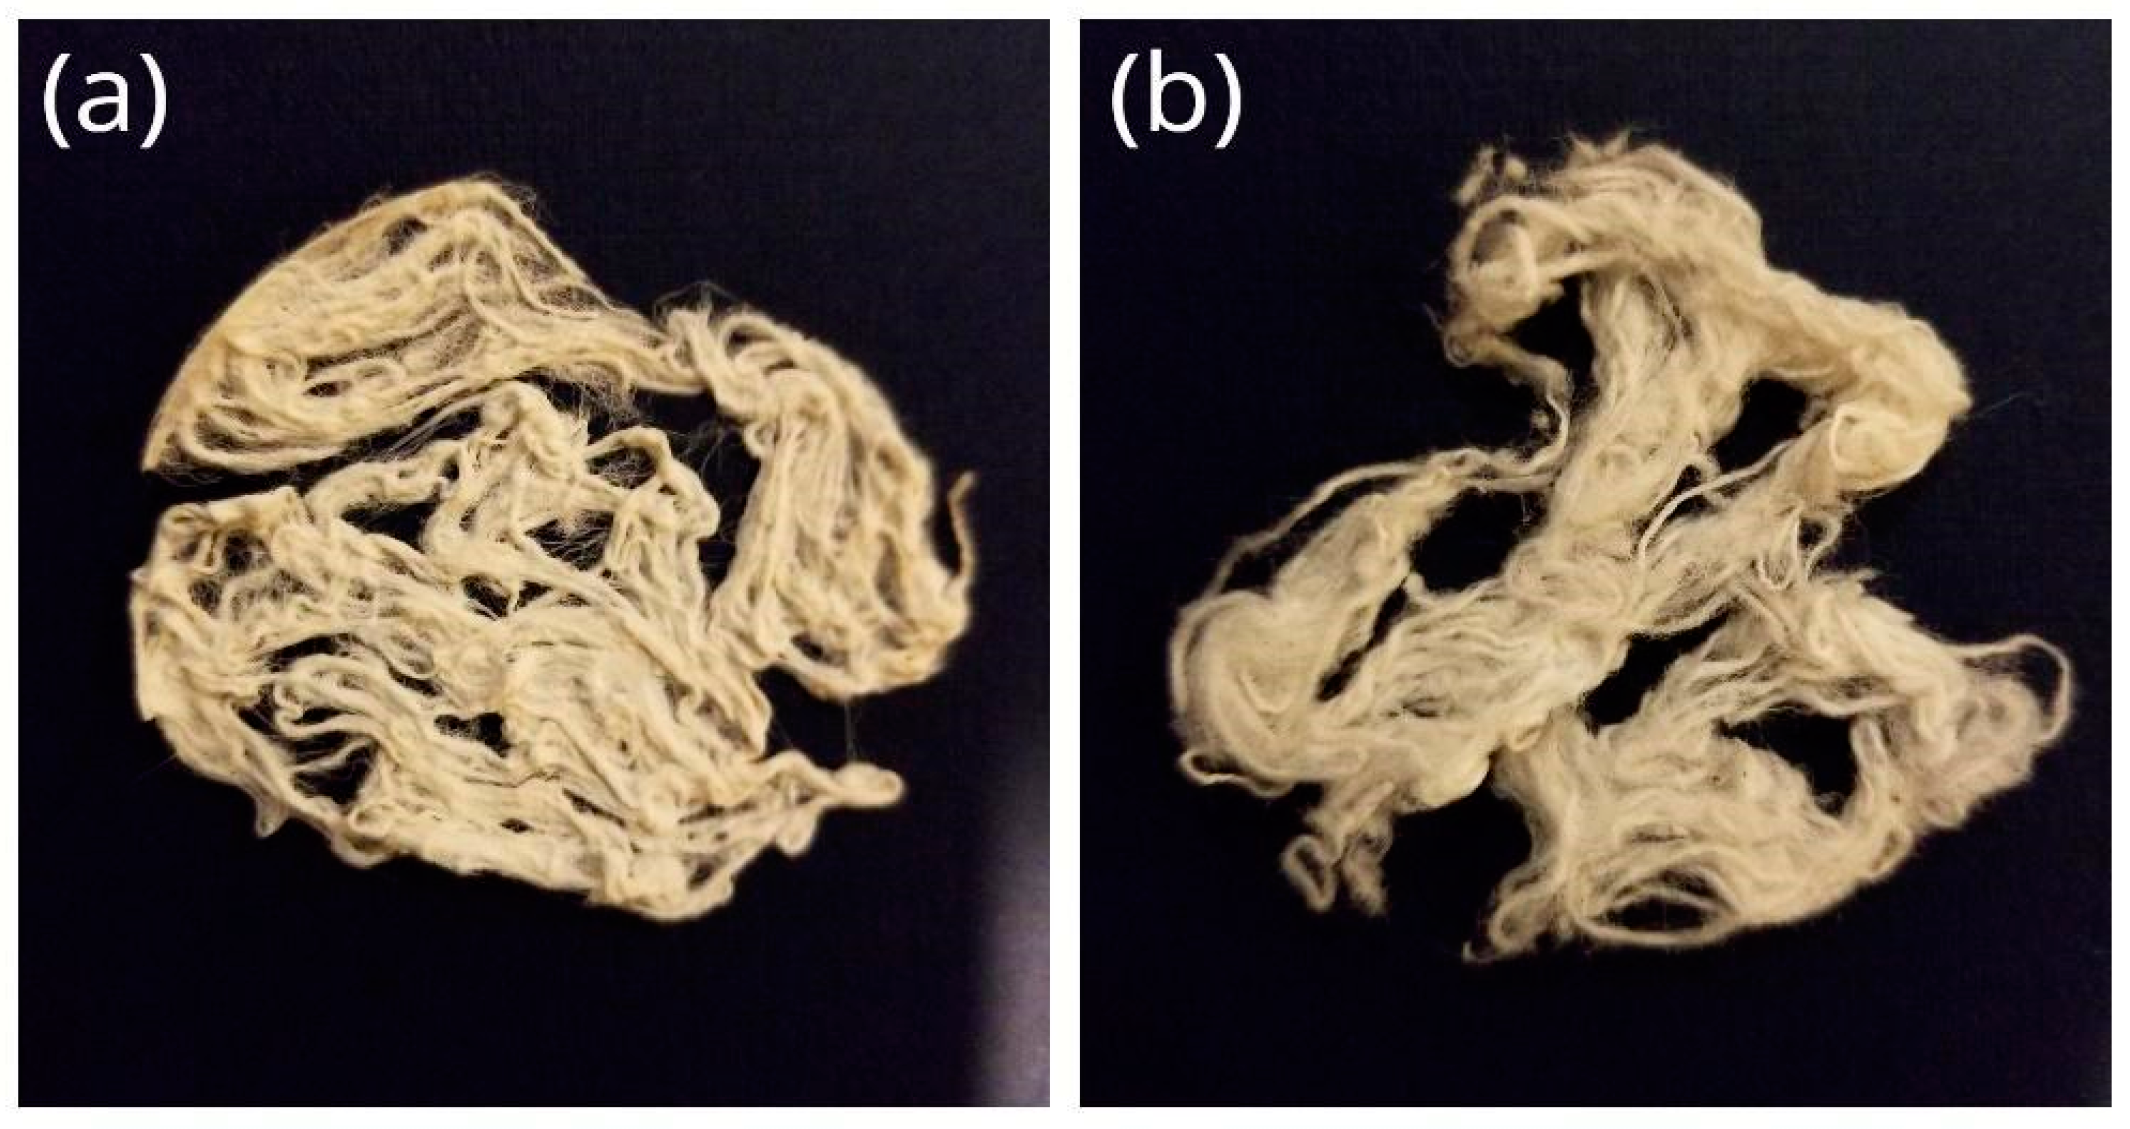
3.1. Cotton Fabric Treated under Various NaOH Concentrations

The variation in the degree of deweaving of the cotton fabric with NaOH concentration is shown in Figure 1. To approximate the degree of deweaving, the area of the weaved portion of the cotton fabric was measured and then divided by the area of the original sample (9 cm2). It was observed that the cotton fabric sample treated with deionized (DI) water showed the lowest degree of deweaving, while the sample treated with 1 M NaOH and 2 M NaOH aqueous solutions displayed approximately ~40% and ~80%, deweaving, respectively. Figure 1b–e show the cotton fabric treated with 3 M NaOH, indicating that the cotton fabric was completely deweaved. Individual strands were separated and could be clearly identified, which is the optimal condition for further processing, including spinning and production of yarn. To investigate the effect on the texture of the cotton fabric using a higher concentration of NaOH, cotton fabric was treated with 4 M NaOH, as shown in Figure 1f. Notable differences were observed for the texture of the deweaved fabric between the 3 M NaOH and 4 M NaOH treatment conditions. The cotton fabric treated with 4 M NaOH deweaved into a mesh-like state compared to the individual strands shown in that treated with 3 M NaOH. The fabric treated with 4 M NaOH showed a similar texture to a cotton ball including some strands, indicating that the cotton fabric was partially dissolved in addition to being deweaved. As shown in the results from Figure 1, it was concluded that the degree of deweaving increases with increasing NaOH concentration, and the optimum condition for the treatment of cotton fabric is expected using a 3 M NaOH aqueous solution under the given experimental conditions. To check the recyclability of the treatment solution and the effect of washing on the molecular structure and chemistry of cotton fabric samples, the treatment with 3 M NaOH was further examined, and the results are shown in the next section.
Economics and chemical waste reduction are major factors for consideration in any recycling process. To investigate whether aqueous sodium hydroxide can be reused and the effect of reused NaOH on product quality, cotton fabric samples were treated with the same solution for five cycles. As shown in Figure 2, all cycles have achieved a completely deweaved cotton fabric, and there were no significant texture and color changes. The pH of the solution was measured in each cycle and remained constant (11.5–12.0). The infinitesimal changes in solution pH suggest that the concentration of NaOH remained constant in each cycle. The results showed that the ability of the sodium hydroxide to promote the cotton fabric deweaving does not seem to be affected as the number of cycles increases.
Post-reaction treatment is also an important step for modifying the properties of cotton fabric, as well as for impurity removal. The rinsing process using DI water was conducted immediately after the treated fabric was removed from the NaOH solution. Figure 3a,b show the images of the samples reacted under the same conditions without and with rinsing using DI water, respectively. In the case of the unrinsed sample, the separated strands were found to adhere to each other and the resulting texture was hard and brittle. In contrast, the texture of the rinsed sample was very soft. The effect of post-treatment on the structure of the treated fabrics was further analyzed by FTIR, as discussed later in this section.

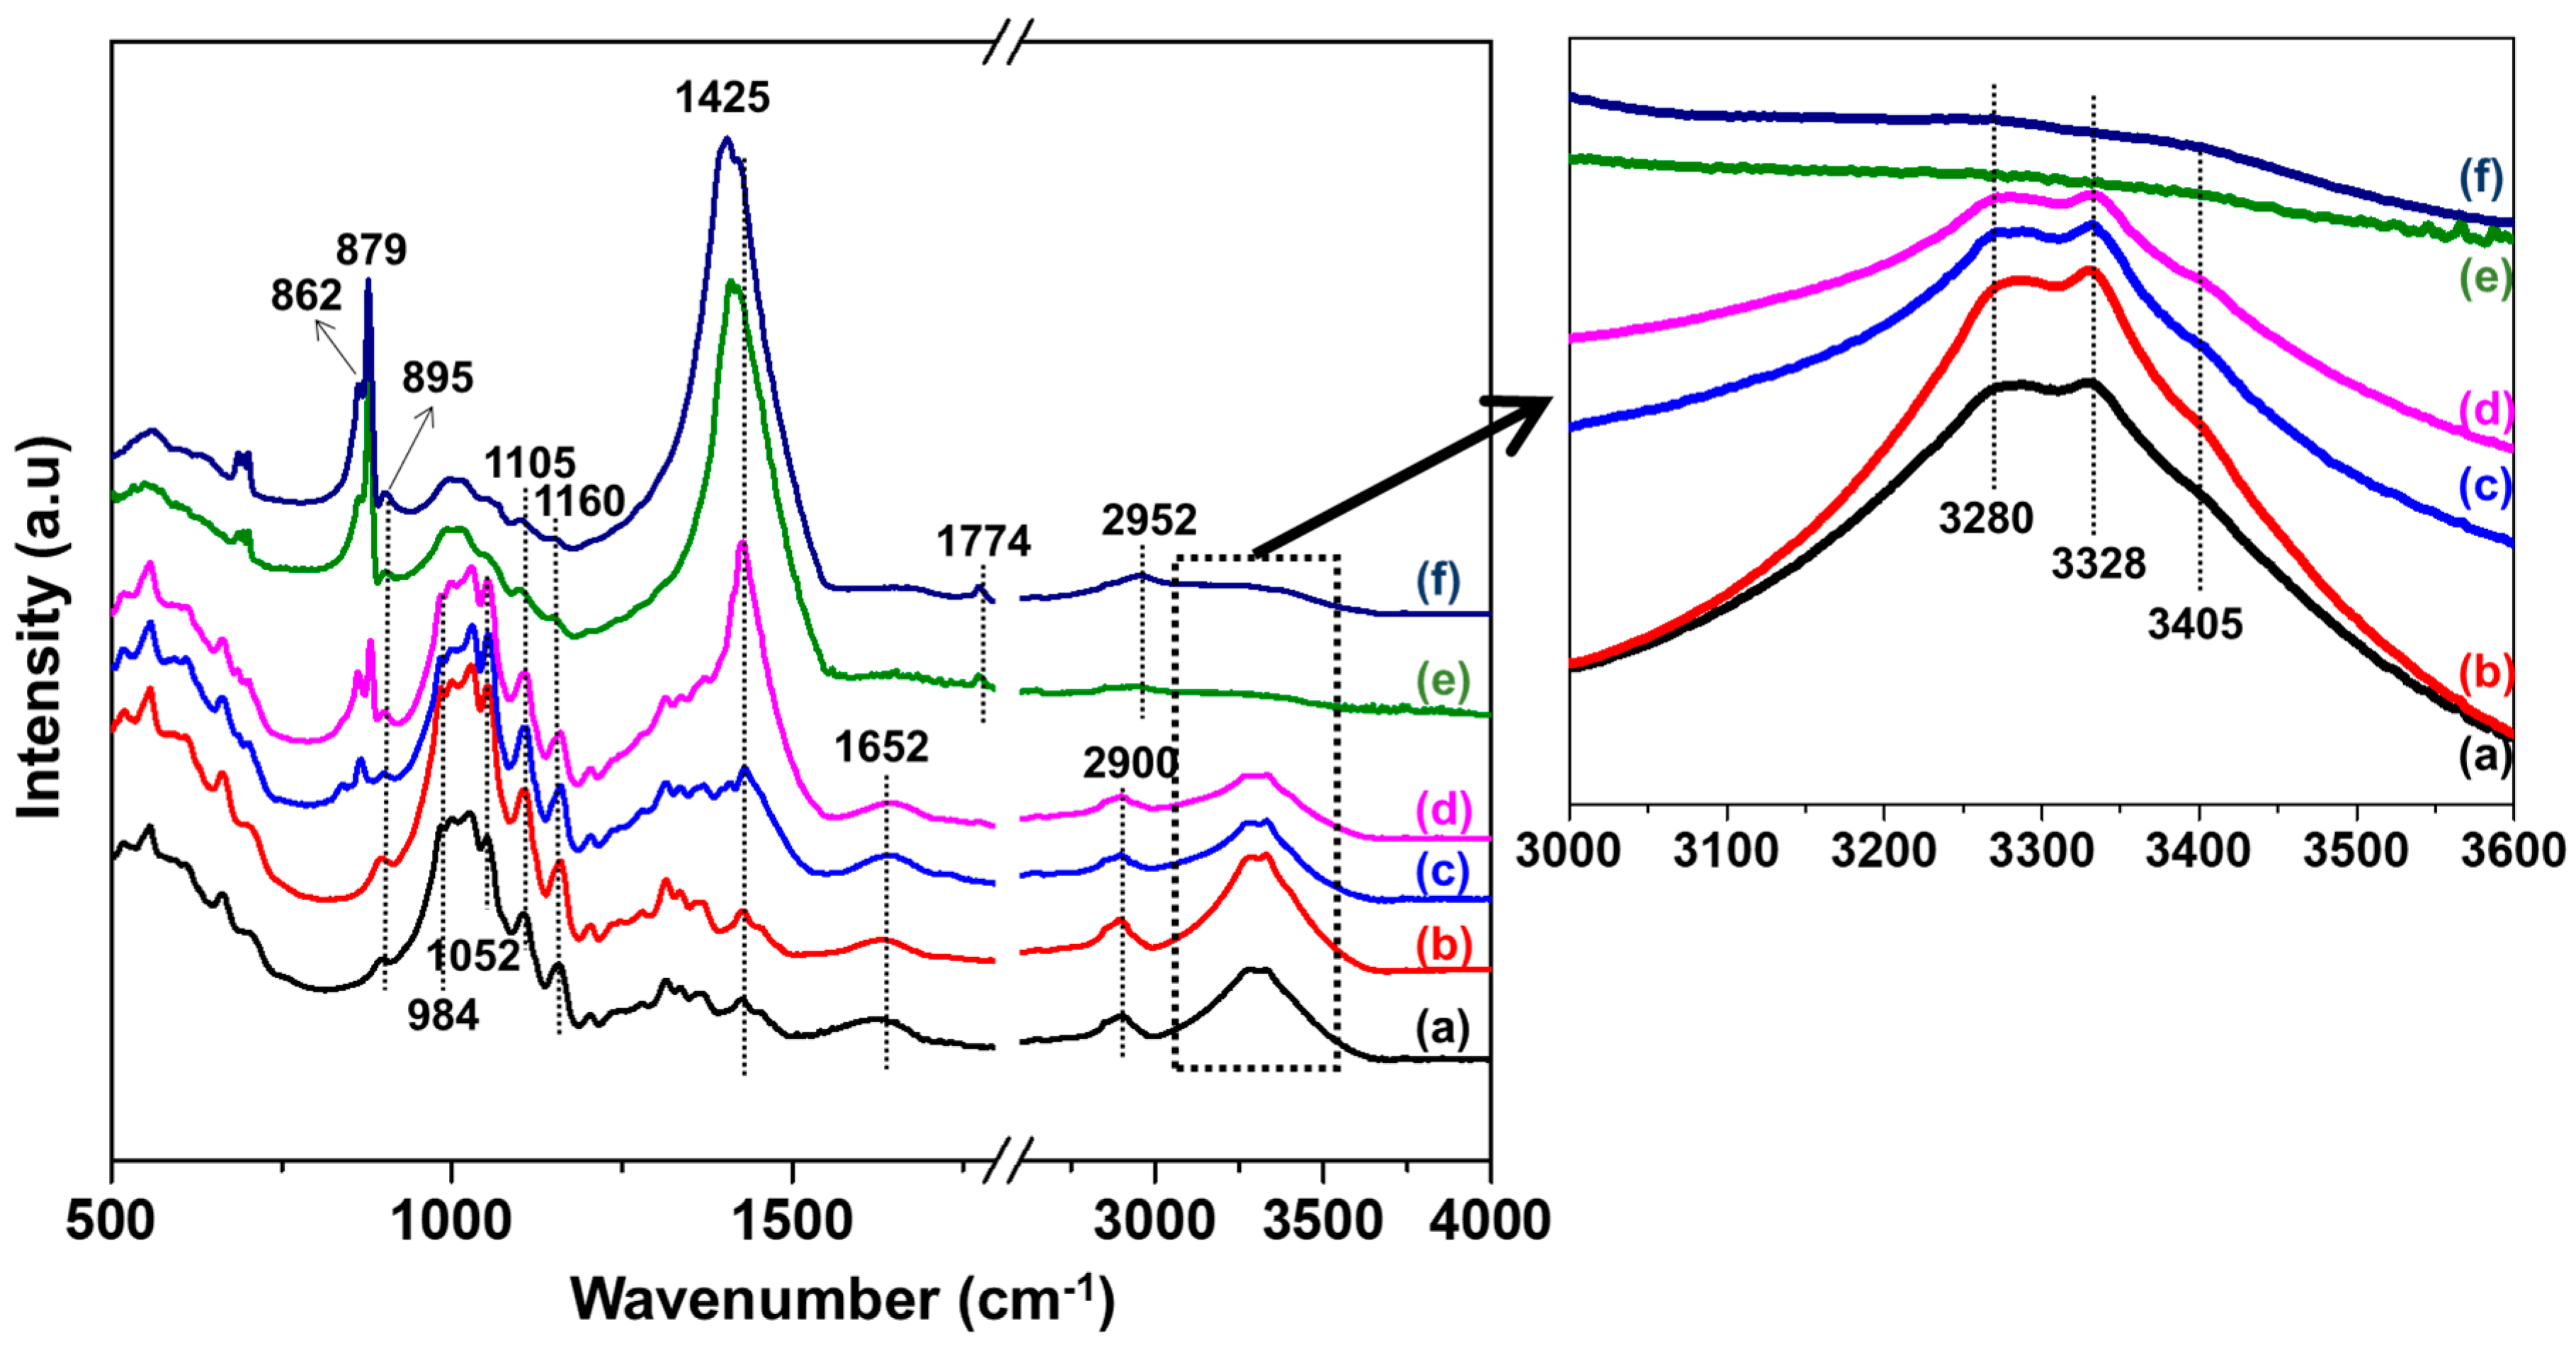
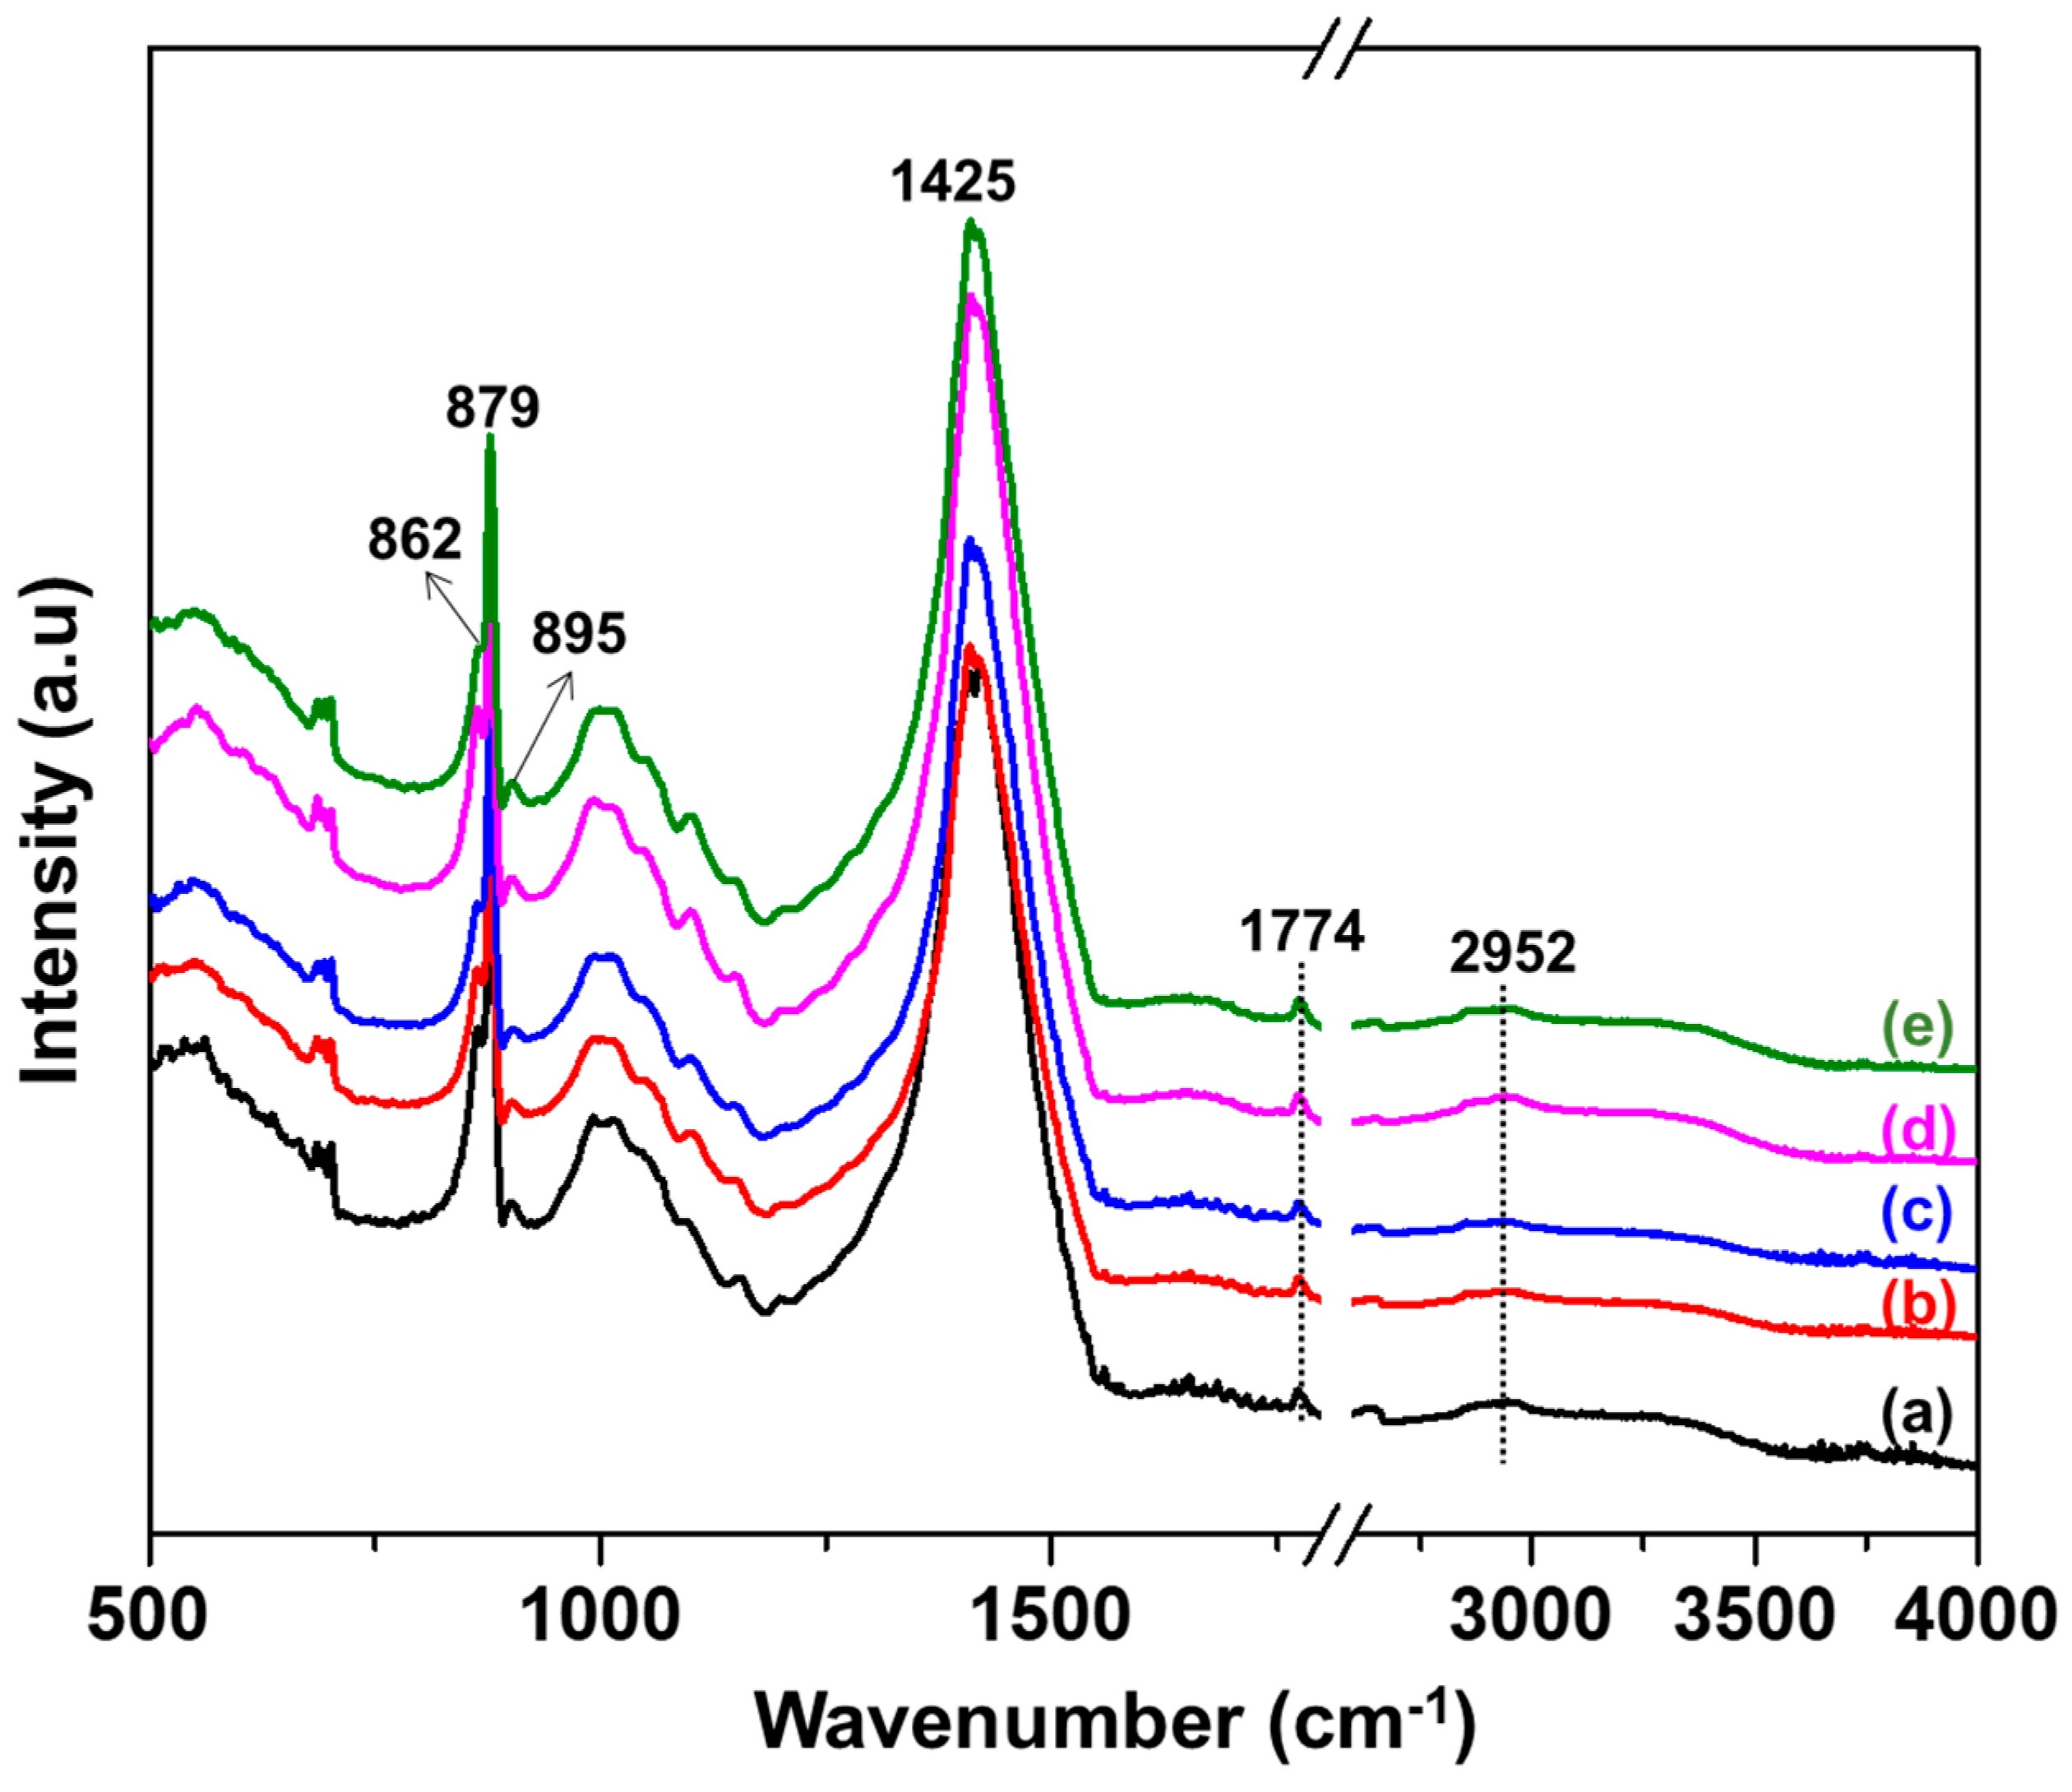
3.2. FTIR Analysis of Cotton Fabrics

In the previous section, digital camera images provided the effect of NaOH concentration, NaOH recyclability, and washing on the deweaved cotton fabric. To understand the chemical and structural changes of cotton fabric samples, Fourier-transform infrared (FTIR) spectroscopy was applied. As shown in Figure 4, cotton fabric samples treated with DI water and 1 M NaOH showed very similar trends and peaks consistent with that of the pristine cotton fabric. The broad peak in the range of 3000–3300 cm−1 corresponds to the O–H stretching band, and the peak at ~2900 cm−1 corresponds to the C–H stretching band. In the O–H stretching band regions, three peaks could be identified: ~3280 cm−1, ~3328 cm−1, and ~3405 cm−1. It was reported that the ~3280 cm−1 peak is related to the intermolecular hydrogen bonds, while ~3328 cm−1 and ~3405 cm−1 can be assigned to the intramolecular hydrogen bonding of cellulose [43,44,45]. The observed O–H stretching band indicates that no significant hydrogen bond breaking occurred in the cellulose structure. In addition to the C–H and O–H stretching bands, several weak/strong peaks can be found in the 900–1800 cm−1 wavenumber region. In brief, the band at 1652 cm−1 is the O–H bending of absorbed water, and the band in the range of 984–1052 cm−1 can be attributed to C–O stretching [36]. These peaks are characteristic of native cellulose fibers and are sensitive to the crystalline state in the amorphous region [43]. The peak at 895 cm−1 can be assigned to the β-1,4-glycosidic linkages, which are responsible for linking glucose monomers in the cellulose structure [46]. Compared to data from the sample treated in DI water only, two new bands appeared in the spectrum of the sample treated with 1 M NaOH at 862 cm−1 and 879 cm−1. Both bands could be assigned to C=O vibration in carbonate ions, characteristic of NaOH [37,47]. Because the sample was only treated with NaOH, we can reasonably assume that the new peaks are related to the NaOH. Analysis of the 1425 cm−1 peak may be controversial because it can be assigned to either a CH2 bending mode or an NaOH peak [36,43,47]. Because the increased 1425 cm−1 peak intensity could be related to the new peaks at 862 cm−1 and 879 cm−1, it was reasonable to assign this peak to NaOH. This interpretation can also be applied to the 2–4 M NaOH spectra in Figure 4d–f. The analogous FTIR spectra in Figure 4a–c suggest that the treatment of cotton fabric with DI water and 1 M NaOH concentration did not affect the chemical structure of the cotton fabric. The spectrum of the sample treated with 2 M NaOH contained a strong and sharp peak at 1425 cm−1, and the peak intensity at 862 cm−1 and 879 cm−1 was also increased compared to the spectrum from the sample treated with 1 M NaOH. Since the peak wavenumbers of O–H stretching bands were the same as in the pristine sample’s spectrum, phase transformation was not fully developed. However, cellulose swelling could be expected according to the decrease in O–H band intensities.
It was reported that the cellulose structure changes from cellulose I to cellulose II at higher NaOH concentrations (i.e., >10 wt.% or >3 M NaOH) [47,48]. As shown in Figure 4e,f, cotton fabric treated with 3 M NaOH and 4 M NaOH exhibited quite different spectra compared to that treated with the more dilute NaOH concentration. The intensity of bands in the range 3000–3600 cm−1 corresponding to the intra- and intermolecular hydrogen bonding decreased, while the intensity of the bands at 862, 879, and 1425 cm−1 corresponding to the bond vibration increased. This result indicates that most of the Na+ ions interacted with O–H functional groups. Note that a new peak appeared at 1774 cm−1, which is also related to NaOH [47]. Oh et al. and Yue et al. reported that the transformation of cellulose I to cellulose II is proven by an O–H peak shift from 3293–3334 cm−1 to 3438 cm−1 [43,44,48]. Although new peaks at >3400 cm−1 were not discernible due to the weak intensity in Figure 4e,f, transformation from cellulose I to II can be expected on the basis of the peak shape. The C–H stretching band shifted to a higher wavenumber at 2952 cm−1, indicating changes in the β-1,4-glycosidic linkage torsion angle [48]. Notably, the decrease in intensity in the C–O stretching regions denotes the presence of a cellulose II crystal structure. It was reported that the size of hydrated hydroxide ions could be controlled by NaOH concentration, where the size of the hydrated hydroxide ions is inversely proportional to the NaOH concentration [49]. According to the FTIR spectroscopy results, it can be concluded that, for NaOH concentrations at and above 3 M, the reduced number of water molecules (or fully hydrated molecules) led to smaller hydroxide ions, which could efficiently penetrate and react with the cellulose crystal structure.

3.3. FTIR Analysis of Cotton Treated with Recycled NaOH

To investigate whether using recycled aqueous NaOH can cause any structural or chemical changes in the cotton fabric, pristine samples were treated using the same NaOH solution without replacement (Figure 5). It should be noted that the FTIR spectrum of the sample from the first cycle (Figure 5a) was reproduced under the same reaction conditions used for the sample treated with 3 M NaOH (Figure 4e). In comparison to the FTIR spectrum of the pristine cotton fabric (Figure 4a), there was a significant increase in the intensity of the peak at 1425 cm−1, and most O–H peaks disappeared. The sample spectra from reactions 1–5 were well matched with each other and identical to that of the 3 M NaOH single reaction. Although a change in NaOH concentration could be expected using recycled NaOH, the measured pH values (11.5–12.0) were not changed. According to the digital camera image (Figure 2) and FTIR spectroscopy results, the recyclability of aqueous NaOH was concluded to be feasible to obtain the desired result without inducing major chemical structural changes in the cotton fabric samples.

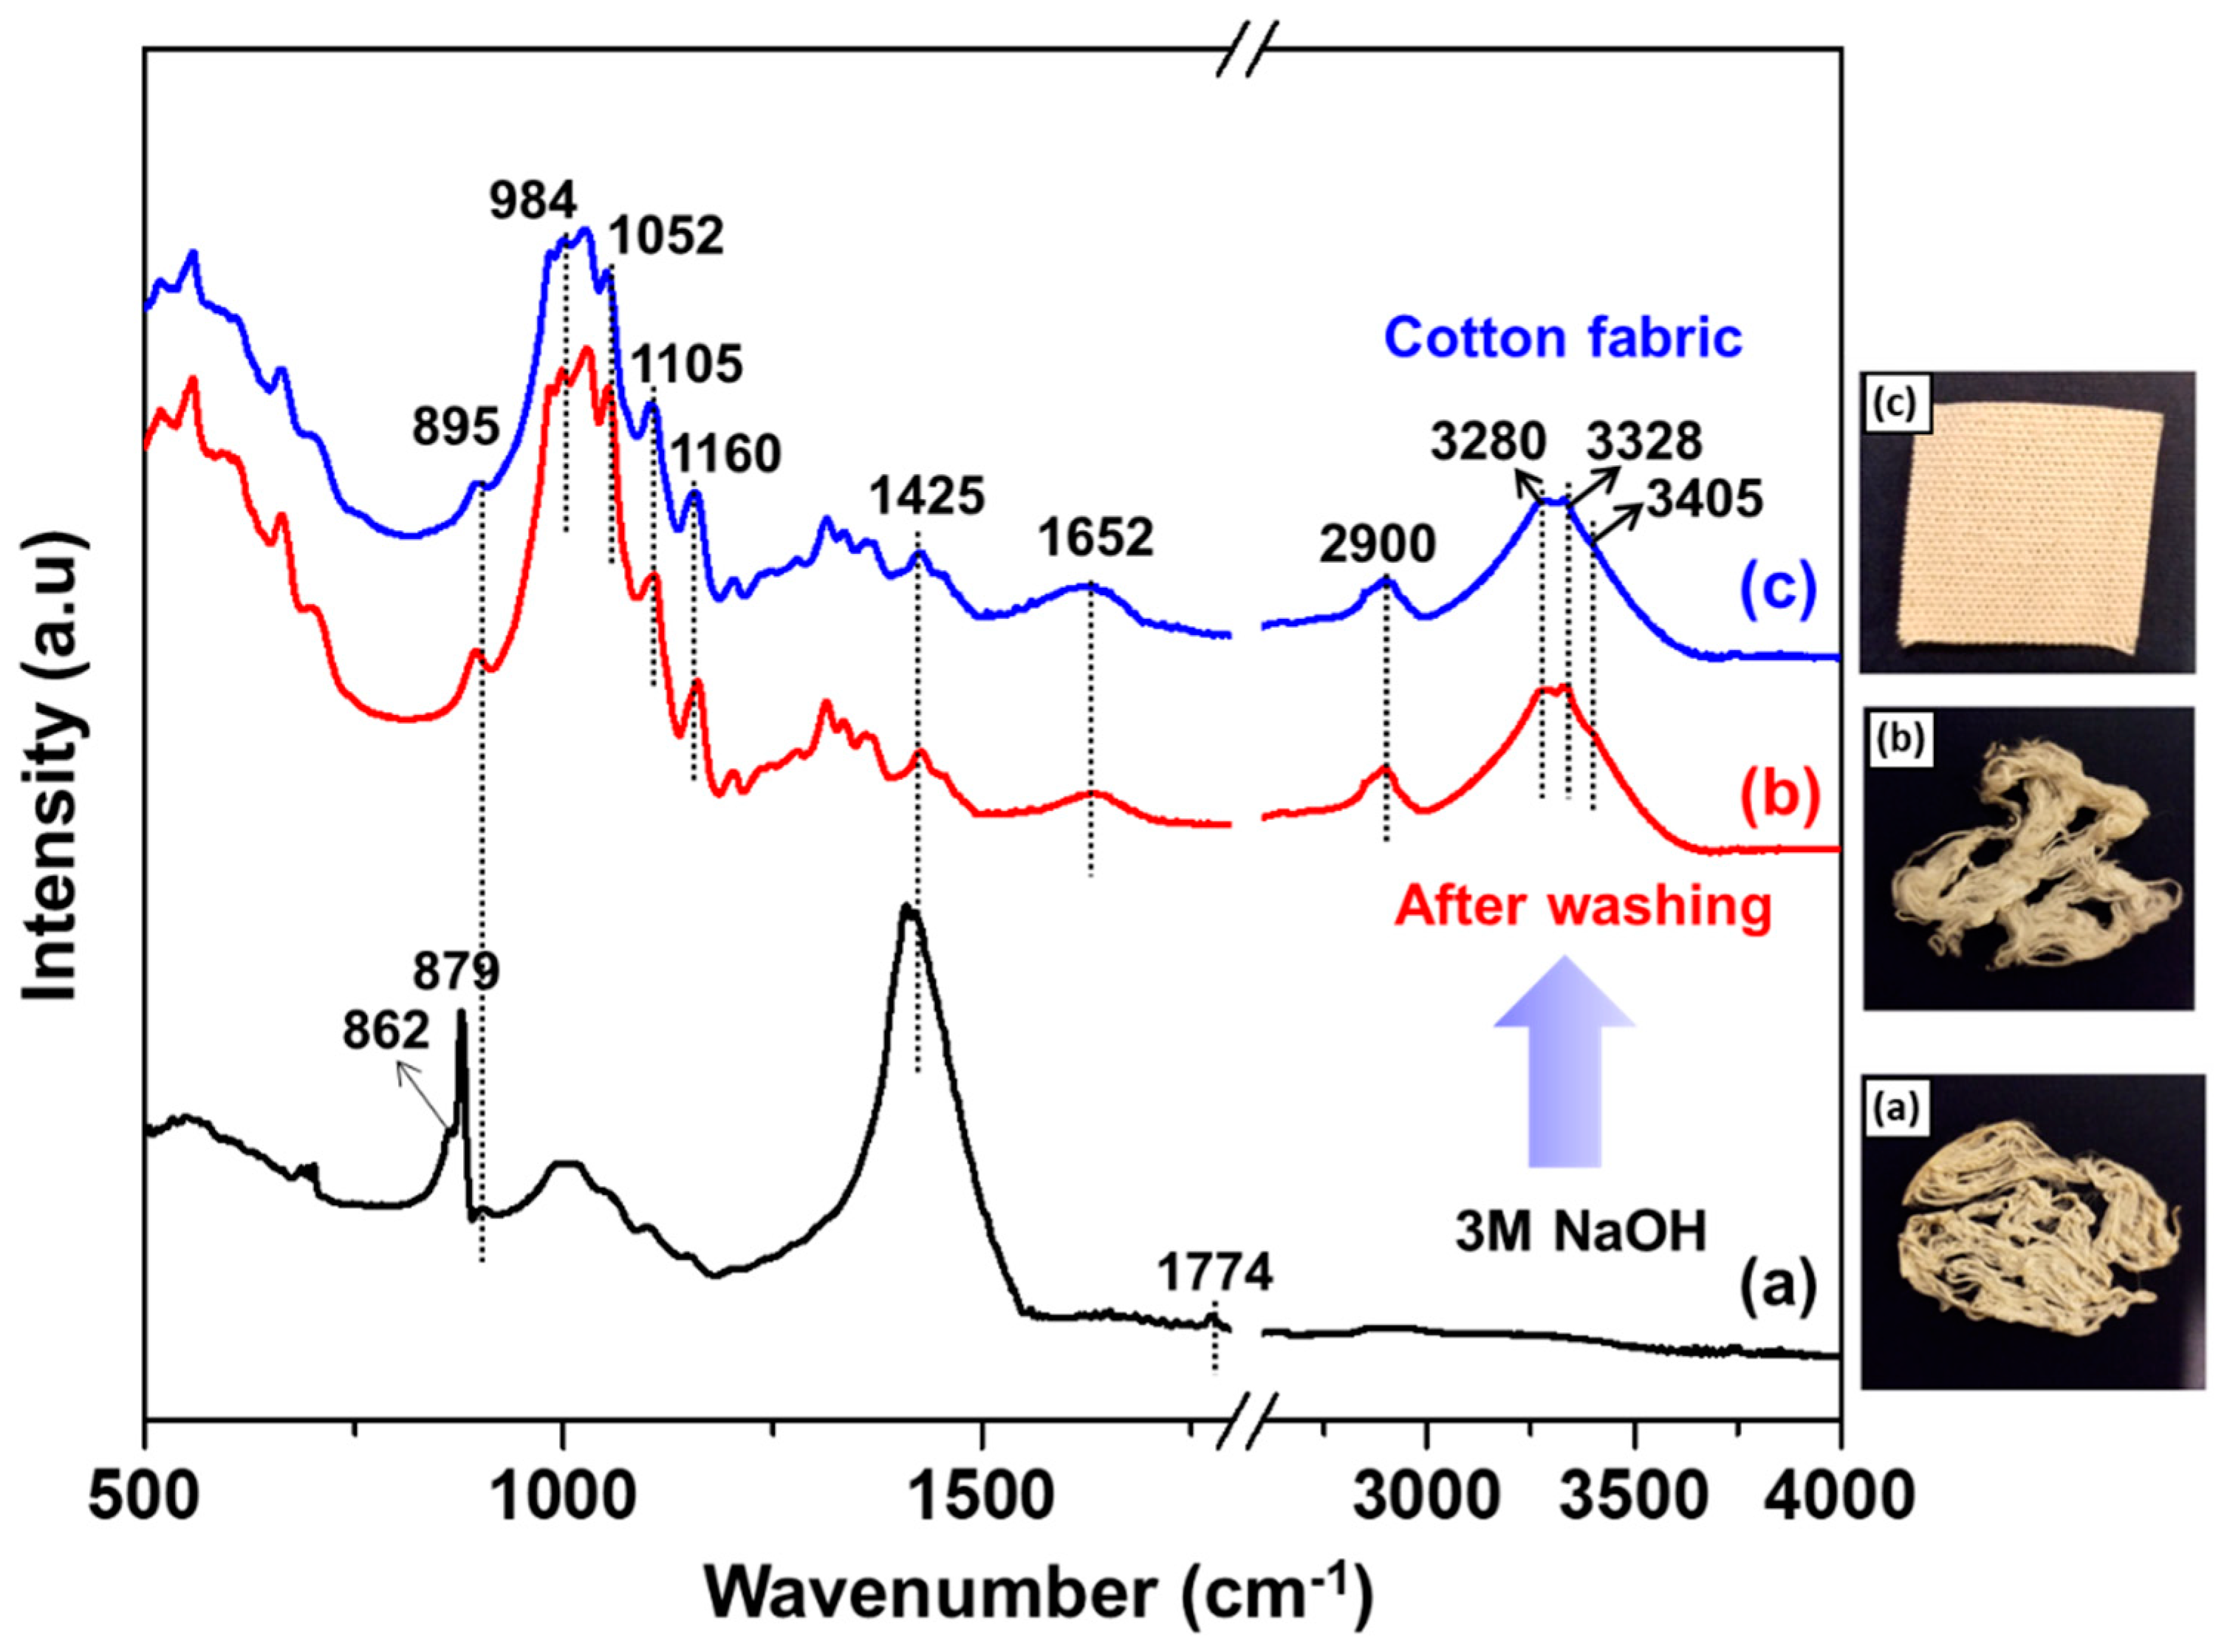
3.4. FTIR Analysis of Samples with and without Washing Using DI Water

As shown in Figure 4e and Figure 5, data from the cotton fabric treated with the 3 M NaOH solution showed a very different infrared spectrum compared to the pristine sample. It was reported that cellulose II formation is completed through the rinsing of excess Na+ ions with water [47]. To analyze the functional groups in the sample treated with 3 M NaOH after washing, FTIR spectroscopy was used. As shown in Figure 6, NaOH-related peaks at 862 cm−1, 879 cm−1, 1425 cm−1, and 1774 cm−1 vanished. Furthermore, the FTIR spectrum of the washed sample displayed near-identical trends and peaks to that of the pristine cotton fabric sample containing a cellulose I structure. This result shows that the molecular structure of cotton fabric could be regenerated after washing, although the morphology of the fabric changed to fibers. Although these experimental conditions should be applied to waste fabric material, the combined processes of 3 M NaOH treatment and washing confirmed that the current experimental conditions are quite promising for application to the regeneration of usable fibers from cotton fabric wastes.
The regeneration process of cotton fabric waste should be revisited using other simple chemical reactions, especially using nontoxic chemicals under mild reaction conditions. The proposed deweaving method with NaOH aqueous solution is a good option to satisfy the objectives. However, to increase the deweaving rate with decreased NaOH concentration, extensive research on process conditions (including the introduction of other environmentally benign chemicals) should be performed. In addition to the chemical effect on the deweaving procedures, other parameters, such as secondary chemicals, reactor size, mixing condition, and temperature, should be considered in future works. Although only ex situ characterizations were applied in this research, for fundamental studies, in situ characterizations (such as synchrotron X-ray studies) should be considered. The streaming potential can be used to identify the electrostatic impact of chemical treatments. Streaming potential measurements identify the surface charge of textile fibers by comparing the voltage difference in a dilute conductive solution from one side to the other of a fiber mat through which the solution is passed under a known pressure versus a zero applied pressure. The voltage difference can be used, along with the pressure differential, to obtain the zeta potential of the fibers. Repeating the measurements while varying solution pH can provide additional data indicative of fiber swelling and sorbed water retention. Further surface-sensitive spectroscopies (such as X-ray photoelectron spectroscopy) can be used to elucidate more subtle differences in surface chemistry, and scanning electron microscopy can be used to more closely study the fiber structure following treatment.

4. Conclusions

In this study of the deweaving process for recycling, cotton fabric was treated with various NaOH concentrations (1–4 M) at 50 °C, and the chemical and structural changes in the cotton fabric were analyzed using Fourier-transform infrared spectroscopy (FTIR). The degree of deweaving of the cotton fabric increased with increasing NaOH concentration up to 3 M (10.7 wt.%). FTIR results indicated that the molecular structure of cotton fabric was not changed up to 2 M NaOH treatment, while the presence of NaOH was observed following treatment with 1 M NaOH (and above). Transformation of the cotton fabric crystalline structure from cellulose I to cellulose II could be observed in samples treated at and above 3 M NaOH. Results related to the recyclability of aqueous NaOH indicated that 3 M NaOH solution could be used for deweaving processes without replacement, and the molecular structures of the treated samples were consistent. The washing process rinsed away excess Na+ ions. The obtained results could be potentially applied to the development of new methods for cotton fabric recycling processes.

Author Contributions

Conceptualization, T.K.; methodology, H.Z.C., Y.Y., and T.K.; funding acquisition, G.H., H.J.J., and T.K.; writing—original draft preparation, H.Z.C. and Y.Y.; writing—review and editing, G.H., H.J.J., and T.K. All authors have read and agreed to the published version of the manuscript.

Funding

This research was supported by the National Science Foundation (NSF-CBET-1948422) and the Ministry of Education of the Republic of Korea via the National Research Foundation of Korea (NRF 2019S1A5A2A03054508).

Acknowledgments

The authors acknowledge funding support from the National Science Foundation (NSF-CBET-1948422). This work was supported by the Ministry of Education of the Republic of Korea via the National Research Foundation of Korea (NRF 2019S1A5A2A03054508). The authors would like to thank Rina Tannenbaum for providing them with the Raman and FTIR spectrometers.

Conflicts of Interest

The authors declare no conflict of interest.

References

  1. Advancing Sustainable Materials Management: 2018 Fact Sheet; United States Environmental Protection Agency, U.S. Government Printing Office: Washington, DC, USA, 2020; p. 3.
  2. Björquist, S. Separation for regeneration—Chemical recycling of cotton and polyester textiles. Master’ Thesis, The Swedish School of Textiles, Borås, Sweden, June 2017. [Google Scholar]
  3. Gustav Sandina, B.; Petersbc, G.M. Environmental impact of textile reuse and recycling—A review. J. Clean. Prod. 2018, 184, 353–365. [Google Scholar] [CrossRef]
  4. Wang, Y. Fiber and Textile Waste Utilization. Waste Biomass Valoriz. 2010, 1, 135–143. [Google Scholar] [CrossRef]
  5. Gordon, S.; Hsieh, Y.-L. 1—Chemical structure and properties of cotton. In Cotton: Science and Technology; Woodhead Publishing: Cambridge, UK, 2007; pp. 3–34. ISBN 978-1-84569-026-7. [Google Scholar]
  6. Zhou, J.; Zhang, L.; Cai, J. Behavior of Cellulose in NaOH/Urea Aqueous Solution Characterized by Light Scattering and Viscometry. J. Polym. Sci. Part B Polym. Phys. 2004, 42, 347–353. [Google Scholar] [CrossRef]
  7. Northolt, M.G.; Boerstel, H.; Maatman, H.; Huisman, R.; Veurink, J.; Elzerman, H. The structure and properties of cellulose fibers spun from an anisotropic phosphoric acid solution. Polymer 2001, 42, 8249–8264. [Google Scholar] [CrossRef]
  8. Kosan, B.; Michels, C.; Meister, F. Dissolution and forming of cellulose with ionic liquids. Cellulose 2008, 15, 59–66. [Google Scholar] [CrossRef]
  9. Zhang, H.; Wu, J.; Zhang, J.; He, J. 1-Allyl-3-methylimidazolium chloride room temperature ionic liquid: A new and powerful nonderivatizing solvent for cellulose. Macromolecules 2005, 38, 8272–8277. [Google Scholar] [CrossRef]
  10. Kamide, K.; Okajima, K.; Kowsaka, K. Dissolution of natural cellulose into aqueous alkali solution: Role of supermolecular structure of cellulose. Polym. J. 1992, 24, 71–86. [Google Scholar] [CrossRef]
  11. Davidson, G.F. The dissolution of chemically modified cotton cellulose in alkaline solutions. Part 1: In solutions of NaOH, particularly at T C below the normal. J. Text. Inst. 1934, 25, 174–196. [Google Scholar] [CrossRef]
  12. Davidson, G.F. The dissolution of chemically modified cotton cellulose in alkaline solutions. Part 2: A comparison of the solvent action of solutions of Lithium, Sodium, Potassium and tetramethylammonium hydroxides. J. Text. Inst. 1936, 27, 112–130. [Google Scholar] [CrossRef]
  13. Zhou, J.; Zhang, L. Solubility of cellulose in NaOH/Urea aqueous solution. Polym. J. 2000, 32–10, 866–870. [Google Scholar] [CrossRef] [Green Version]
  14. Ershova, O.; Costa, E.V.; Fernandes, A.J.S.; Domingues, M.R.; Evtuguin, D.V.; Sixta, H. Effect of urea on cellulose degradation under conditions of alkaline pulping. Cellulose 2012, 19, 2195–2204. [Google Scholar] [CrossRef]
  15. Zhang, S.; Wang, W.; Li, F.; Yu, J. Swelling and dissolution of cellulose in NaOH aqueous solvent systems. Cellul. Chem. Technol. 2013, 47, 671–679. [Google Scholar]
  16. Santos, N.M.; Puls, J.; Saake, B.; Navard, P. Effects of nitren extraction on a dissolving pulp and influence on cellulose dissolution in NaOH–water. Cellulose 2013, 20, 2013–2026. [Google Scholar] [CrossRef]
  17. Ying, W. Cellulose Fiber Dissolution in Sodium Hydroxide Solution at Low Temperature: Dissolution Kinetics and Solubility Improvement. Ph.D. Thesis, Georgia Institute of Technology, Atlanta, GA, USA, December 2008. [Google Scholar]
  18. Sobue, H.K.H.; Hess, K. The cellulose-sodium hydroxide-water system as a function of the temperature. Z. Phys. Chem. B 1939, 43, 309–328. [Google Scholar]
  19. Budtova, T.; Navard, P. Cellulose in NaOH–water based solvents: A review. Cellulose 2016, 23, 5–55. [Google Scholar] [CrossRef] [Green Version]
  20. Nishiyama, Y.; Kuga, S.; Okano, T. Mechanism of mercerization revealed by X-ray diffraction. J. Wood Sci. 2000, 46, 452–457. [Google Scholar] [CrossRef]
  21. Lewin, M. Oxidation and aging of cellulose. Macromol. Symp. 1997, 118, 715–724. [Google Scholar] [CrossRef]
  22. Saloheimo, M.; Paloheimo, M.; Hakola, S.; Pere, J.; Swanson, B.; Nyyssonen, E.; Bhatia, A.; Ward, M.; Penttila, M. Swollenin, a Trichoderma ressi protein with sequence similarity to the plant expansions, exhib-its disruption activity on cellulosic materials. Eur. J. Biochem. 2002, 269, 4202–4211. [Google Scholar] [CrossRef]
  23. Öztürk, H.; Bechtold, T. Effect of NaOH Treatment on the Interfibrillar Swelling and Dyeing Properties of Lyocell (TENCEL®) Fibres. Fibres Text. East. Eur. 2007, 15, 114–117. [Google Scholar]
  24. Cuissinat, C.; Navard, P. Swelling and Dissolution of Cellulose Part II: Free Floating Cotton and Wood Fibres in NaOH–Water–Additives Systems. Macromol. Symp. 2006, 244, 19–30. [Google Scholar] [CrossRef]
  25. Wang, Y.; Deng, Y. The kinetics of cellulose dissolution in sodium hydroxide solution at low temperatures. Biotechnol. Bioeng. 2008, 102, 1398–1405. [Google Scholar] [CrossRef] [PubMed]
  26. Haque, A.; Akhtar, M.; Halilu, A.; Yun, H. Validation and extended application of cellulose microfibril swelling enzyme assay method to alkali induced swelling of cellulose. J. Chem. Eng. Bioanal. Chem. 2017, 2, 62–69. [Google Scholar]
  27. Duchemin, B.J.C. Mercerisation of cellulose in aqueous NaOH at low concentrations. Green Chem. 2015, 17, 3941–3947. [Google Scholar] [CrossRef]
  28. Wang, J.; Wang, Z.; Cho, H.; Kim, M.; Sham, T.; Sun, X. Layer speciation and electronic structure investigation of freestanding hexagonal boron nitride nanosheets. Nanoscale 2015, 7, 1718–1724. [Google Scholar] [CrossRef] [PubMed]
  29. Ghosal, S.; Chen, M.; Wagner, J.; Wang, Z.; Wall, S. Molecular identification of polymers and anthropogenic particles extracted from oceanic water and fish stomach—A Raman microspectroscopy study. Environ. Pollut. 2018, 233, 1113–1124. [Google Scholar] [CrossRef]
  30. Zhang, S.; Lee, J.; Kim, D.H.; Kim, T. Effects of Ni Loading on the Physicochemical Properties of NiOx/CeO2 Catalysts and Catalytic Activity for NO Reduction by CO. Catal. Sci. Technol. 2020, 10, 2359–2368. [Google Scholar] [CrossRef]
  31. Poletto, M.; Junior, H.; Zattera, A. Native cellulose: Structure, characterization and thermal properties. Materials 2014, 7, 6105–6119. [Google Scholar] [CrossRef] [Green Version]
  32. Sedighi, A.; Montazer, M.; Hemmatinejad, N. Copper nanoparticles on bleached cotton fabric: In situ synthesis and characterization. Cellulose 2014, 21, 2119–2132. [Google Scholar] [CrossRef]
  33. Topalovic, T.; Nierstrasz, V.A.; Bautista, L.; Jocic, D.; Navarro, A.; Warmoeskerken, M. XPS and contact angle study of cotton surface oxidation by catalytic bleaching. Colloids Surf. A Physicochem. Eng. Asp. 2007, 296, 76–85. [Google Scholar] [CrossRef]
  34. Edwards, H.G.M.; Farwell, D.W. FT-Raman spectrum of cotton: A polymeric biomolecular analysis. Spectrochim. Acta 1994, 50A, 807–811. [Google Scholar] [CrossRef]
  35. Was-Gubala, J.; Machnowski, W. Application of Raman Spectroscopy for Differentiation Among Cotton and Viscose Fibers Dyed with Several Dye Classes. Spectrosc. Lett. 2014, 47, 527–535. [Google Scholar] [CrossRef] [Green Version]
  36. Abidi, N.; Cabrales, L.; Haigler, C.H. Changes in the cell wall and cellulose content of developing cotton fibers investigated by FTIR spectroscopy. Carbohydr. Polym. 2014, 100, 9–16. [Google Scholar] [CrossRef]
  37. Hospodarova, V.; Singovszka, E.; Stevulova, N. Characterization of Cellulosic Fibers by FTIR Spectroscopy for Their Further Implementation to Building Materials. Am. J. Anal. Chem. 2018, 9, 303–310. [Google Scholar] [CrossRef] [Green Version]
  38. Moses, J.J.; Venkataraman, V. Study of Mechanical and Surface Properties on Some Chemical Treated Cotton Fabric By KES-F, SEM and FTIR Analysis. Int. J. Eng. Res. Technol. 2014, 3, 2396–2411. [Google Scholar]
  39. Allen, A.; Foulk, J.; Gamble, G. Preliminary Fourier-Transform Infrared Spectroscopy Analysis of Cotton Trash. J. Cotton Sci. 2007, 11, 68–74. [Google Scholar]
  40. Colom, X.; Carrillo, F.; Nogues, F.; Garriga, P. Stuructural analysis of photodegraded wood by means of FTIR spectroscopy. Polym. Degrad. Stab. 2003, 80, 543–549. [Google Scholar] [CrossRef]
  41. Moigne, N.; Navard, P. Dissolution mechanisms of wood cellulose fibres in NaOH-water. Cellulose 2010, 17, 31–45. [Google Scholar] [CrossRef] [Green Version]
  42. Baldinger, T.; Moosbauer, J.; Sixta, H. Supermolecular structure of cellulosic materials by Fourier transform infrared spectroscopy (FT-IR) calibrated by WAXS and 13C NMR. Lenzing. Ber. 2000, 79, 15–17. [Google Scholar]
  43. Oh, S.Y.; Yoo, D.I.; Shin, Y.; Seo, G. FTIR analysis of cellulose treated with sodium hydroxide and carbon dioxide. Carbohydr. Res. 2005, 340, 417–428. [Google Scholar] [CrossRef] [PubMed]
  44. Oh, S.Y.; You, D.I.; Shin, Y.; Kim, H.C.; Kim, H.Y.; Chung, Y.S.; Park, W.H.; You, J.H. Crystalline structure analysis of cellulose treated with sodium hydroxide and carbon dioxide by means of X-Ray diffraction and FTIR spectroscopy. Carbohydr. Res. 2005, 340, 2376–2391. [Google Scholar] [CrossRef] [PubMed]
  45. Schwanninger, M.; Rodrigues, J.C.; Pereira, H.; Hinterstoisser, B. Effects of short-time vibratory ball milling on the shape of FT-IR spectra of wood and cellulose. Vib. Spectrosc. 2004, 36, 23–40. [Google Scholar] [CrossRef]
  46. Chunga, C.; Leeb, M.; Choeb, E.K. Characterization of cotton fabric scouring by FT-IR ATR spectroscopy. Carbohydr. Polym. 2004, 58, 417–420. [Google Scholar] [CrossRef]
  47. Fengel, D.; Strobel, C. FTIR spectroscopic studies on the heterogeneous transformation of cellulose I into cellulose II. Acta Polym. 1994, 45, 319–324. [Google Scholar] [CrossRef]
  48. Yue, Y.; Han, G.; Wu, Q. Transitional properties of cotton fibers from cellulose I to cellulose II structure. BioResources 2013, 8, 6460–6471. [Google Scholar] [CrossRef] [Green Version]
  49. Liu, Y.; Hu, H. X-ray diffraction study of bamboo fibers treated with NaOH. Fibers Polym. 2008, 9, 735–739. [Google Scholar] [CrossRef]
Scheme 1. The fabric deweaving recycling process.
Sustainability 13 02015 sch001
Figure 1. Cotton fabric treated with deionized (DI) water and NaOH: (a) pristine cotton fabric; (b) cotton fabric + DI water; (c) cotton fabric + 1 M NaOH; (d) cotton fabric + 2 M NaOH; (e) cotton fabric + 3 M NaOH; (f) cotton fabric + 4 M NaOH. Reaction conditions: NaOH concentration (1–4 M, 50 mL), reaction time (30 min), temperature (50 °C), and mixing speed (200 rpm).
Sustainability 13 02015 g001
Figure 2. NaOH recyclability test: (a) first cycle; (b) second cycle; (c) third cycle; (d) fourth cycle; (e) fifth cycle. Reaction conditions: NaOH concentration (3 M, 50 mL), reaction time (30 min), temperature (50 °C), and mixing speed (200 rpm). Note that the same 3 M NaOH solution was used for the subsequent experiment without replacement.
Sustainability 13 02015 g002
Figure 3. Post-treatment of cotton fabric treated with 3 M NaOH: (a) without washing; (b) with washing using DI water. Reaction conditions: NaOH concentration (3 M, 50 mL), reaction time (30 min), temperature (50 °C), mixing speed (200 rpm), and washing (DI water 100 mL).
Sustainability 13 02015 g003
Figure 4. Fourier-transform infrared (FTIR) spectra of cotton fabric treated with DI water and NaOH: (a) pristine cotton fabric; (b) cotton fabric + DI water; (c) cotton fabric + 1 M NaOH; (d) cotton fabric + 2 M NaOH; (e) cotton fabric + 3 M NaOH; (f) cotton fabric + 4 M NaOH. Reaction conditions: NaOH concentration (1–4 M, 50 mL), reaction time (30 min), temperature (50 °C), and mixing speed (200 rpm).
Sustainability 13 02015 g004
Figure 5. FTIR spectra of cotton fabric treated with 3 M NaOH: (a) first cycle; (b) second cycle; (c) third cycle; (d) fourth cycle; (e) fifth cycle. Reaction conditions: NaOH concentration (3 M, 50 mL), reaction time (30 min), temperature (50 °C), and mixing speed (200 rpm).
Sustainability 13 02015 g005
Figure 6. FTIR spectra of (a) cotton fabric treated with 3 M NaOH, (b) cotton fabric after washing with DI water, and (c) pristine cotton fabric. Reaction conditions: NaOH concentration (3 M, 50 mL), reaction time (30 min), temperature (50 °C), mixing speed (200 rpm), and washing (DI water 100 mL).
Sustainability 13 02015 g006
Publisher’s Note: MDPI stays neutral with regard to jurisdictional claims in published maps and institutional affiliations.

