Abstract
The concept of smart windows that can change the properties of windows and doors in response to external stimuli has recently been introduced. Smart windows provide superior energy savings and control of indoor environments. This concept can advance sustainable architecture, and it will make it possible to connect with the fourth industry, which has developed recently. However, unlike the relevant hardware, is advancing rapidly, research on methods of adjusting smart windows is slow. Therefore, in this study, an analysis of energy use over time was conducted on electrochromic windows, one of the main types of smart windows. Through this analysis, the optimal properties of electrochromic smart windows were identified, and an operation schedule was created. In addition, energy saving rates were derived through a comparison with existing architectural windows.
1. Introduction
1.1. Background and Purpose of the Study
The cooling, heating and lighting loads in buildings are closely related to solar energy. Cooling energy can be saved by blocking solar energy in the summer, and heating energy can be saved by receiving solar energy in the winter. In addition, a pleasant indoor environment is created only when indoor illumination is properly maintained while controlling solar energy. Smart windows with integrated solar control systems are currently under development. Smart windows can adjust the amount of solar energy flowing into the room by changing their material properties in real time. Common categories of smart windows include suspended particle device (SPD), electrochromic, photochromic, and thermochroic windows. Since solar energy is controlled by the glass in such windows, there is no need to go through complex construction processes, and maintenance is also easy. Smart windows can adjust visible light transmittance (VLT) and solar heat gain coefficient (SHGC). The market for these products is growing rapidly. According to the Smart Glass Report by Grand View Research, the total size of the global smart glass market was estimated at $3,710,000,000 in 2018, and is expected to record an annual average growth rate of about 15.2% from 2019 to 2025 [1].
Representative materials used for smart windows are SPD and electrochromic glass. Electrochromic glass operates at low voltages and is highly durable, so it is entering the commercialization stage as architectural windows. However, it is difficult to establish an energy savings plan using smart windows because the amount of architectural research that has been done is insufficient compared to that of material development research. In addition, research on the energy performance data of windows and doors is needed to operate smart windows.
Therefore, this study aims to analyze the energy performance of an indoor space according to changes in the physical properties of electrochromic smart windows, and to analyze the rate at which energy can be saved by the use of smart windows rather than existing windows. Since electrochromic glass has a wide VLT range and good g-value control, its use leads to significant energy savings if appropriate values are set according to the season and time. However, there is insufficient research into such optimal values. In this study, the most efficient electrochromic window operation schedule was determined by calculating the heating and cooling energy load on the spring equinox, summer solstice, autumn equinox and winter solstice, which are representative days of the four seasons. In addition, the energy savings rate was analyzed in comparison to existing windows.
1.2. Background
Research on the applications of electrochromic smart windows in the architecture realm mainly includes indoor environment analysis and energy analysis. Nuria and colleagues conducted a comparative analysis on the optical and thermal characteristics of semi-transparent PV modules and electrochromic windows that can be used in buildings [2]. Abdelsalam calculated solar heat gains in hot and dry climates for three control groups (overhangs, overhangs and side fins, and electrochromic glazing), and demonstrated the benefits of electrochromic compared to shading devices [3]. Dussault et al. analyzed the sensitivity of energy performance and thermal and visual comfort for office buildings with electrochromic windows [4]. Kim et al. conducted a partial color environment analysis of blue-type electrochromic windows [5]. Nicholas et al. analyzed the energy efficiency of commercial and residential buildings across the United States for three electrochromic states, “dark”, “cool” and “bright” [6]. Oh et al. calculated and compared the monthly energy load using models of electrochromic glass, general glass, blinds, and roll shades. Those authors showed that the use of electrochromic glass resulted in inferior heating load compared to other shade devices, but electrochromic glass had a remarkably strong positive effect on the cooling load [7]. In another study by the same authors, the temperature and solar energy of electrochromic glass were analyzed in three randomly selected cities, Moscow, Incheon, and Riyadh. In addition, the natural lighting performance of electrochromic glass was derived, which was then analyzed using the energy and daylight performance index (EDPI) [8]. In Michaela et al., the annual energy load of a building with a high window-to-wall ratio (WWR) was analyzed for six different thermochromic and electrochromic combinations [9]. In a study by Cannavale, the cooling and lighting loads of electrochromic, photochromic, thermochromic, clear, tinted, and reflective glass were compared and analyzed. The findings demonstrated the suitability of electrochromic glass as a smart architectural window [10]. In that research, attention was paid to the lighting and energy performance of electrochromic glass. However, there was insufficient analysis of the factors that changed the properties of electrochromic glass. Also, since these studies were conducted based on yearly analyses, a basic understanding of the operating principles of electrochromic glass over time is needed.
Another research direction in the smart window realm is the analysis of SPD, which shows similar performance to electrochromic glass. In Ghosh et al., a mock-up was created, and its overall physical properties were analyzed to assess changes in the wavelength and temperature of incident sunlight for two SPD states (VLT 5% and VLT 55%) [11]. Nundy and colleagues compared the physical properties, such as wavelength and temperature, of double-glazed windows, SPD, and Vacuum-SPD [12]. In Min et al., simulation analysis was conducted on the cooling load in summer for the U-value of SPD and the maximum and minimum values of SHGC [13]. Ko et al. evaluated the energy performance of smart windows according to the WWR and the g-value range of SPD [14]. The evaluation was done with the TRNSYS18 simulation program, and a range of g-values according to the WWR was proposed. In another study by Ko et al., a SPD-based mock-up was constructed, and the measured data from the mock-up were compared to the simulation results [15].
The evaluation of the energy performance of a building is mostly based on an energy simulation or test bed operation. In a study by Baek and colleagues, the cooling and heating loads were analyzed to determine the optimal design of a folding awning device, and the integrated analysis program IES_VE (Integrated Environmental Solutions_Virtual Environment) was used [16]. The cooling and heating loads were calculated through modeling according to the shape of the awning and the length of the protrusion, and the superiority of the folding awning was verified by comparison with an existing awning. In a study by Park et al., the heat acquisition and heat loss of windows were analyzed using the EnergyPlus program [17]. Simulated data on heat acquisition and heat loss of the lower extremities on the winter solstice were derived according to the composition of the windows and the type of shade, and the maximum cooling and heating loads were calculated and compared. Kim et al. proposed a hybrid heating, ventilation, and air conditioning (HVAC) system for a skyscraper office building, and tried to demonstrate its superiority through simulation with TRNSYS [18]. Those authors developed an air cap wall module for energy reduction, constructed a test bed, and compared and analyzed lighting energy and cooling/heating energy according to the thickness of the air cap wall [19].
2. Research Analysis Framework
2.1. Method and Flow
This study aims to analyze the operation schedule considering the cooling and heating energy performance of electrochromic smart windows and the energy savings rate compared to existing architectural windows. Therefore, to compare the cooling and heating energy performance, groups of electrochromic smart windows and existing architectural windows with various g-values and U-values were established. Analysis was done through simulations. Based on previous research, an EnergyPlus engine was used to derive the energy consumption over time. In addition, Rhino Grasshopper’s Ladybug Plug-in was applied to efficiently organize data on the cooling and heating loads of each control group. The Ladybug plug-in, which can apply the EnergyPlus engine to the Rhino Grasshopper model, is capable of extracting and organizing the values of the required data. After setting up the simulation program, the simulation area and analysis point were set, and a virtual target building was created. For the southern, eastern and western sides, the cooling energy and heating energy consumption of the control groups were derived over time. Based on this data, a g-value schedule was created for optimal operation of electrochromic smart windows, and the total amount of energy consumed was calculated. The energy savings rate of the smart windows compared to the existing windows was compared through the calculated values. The flow of research is shown in Figure 1.
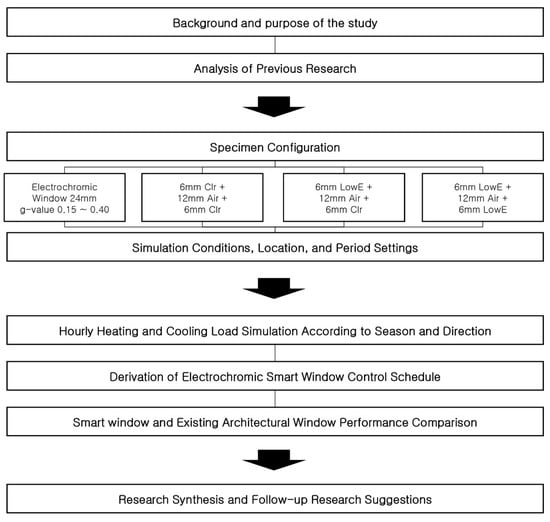
Figure 1.
Research flow.
2.2. Test Configuration
2.2.1. Specimen Configuration
Cooling and heating loads are determined by a comprehensive array of factors, such as the construction of the building and facilities. For windows, U-value, g-value, and airtightness are recognized as factors that affect the cooling and heating loads. Since airtightness depends on the composition of the window frame, it was assumed to be the same across groups in this study. Therefore, variables representing the U-value and g-value were used to compare electrochromic smart windows and existing windows. The U-value and g-value of the electrochromic smart windows were determined based on the products currently on the market. Electrochromic smart windows are composed of multiple layers of functional glass, and the U-value and g-value were 1.1 W/m2k and 0.12–0.44, respectively [15]. If the g-value of an electrochromic window is set to either the maximum or minimum, durability may be impaired. Therefore, the g-values of the control group were set at 0.05-unit intervals in the range of 0.15 to 0.40, which are realistic values. The three control groups of existing windows were Clear glass + Clear glass, LowE glass + Clear glass, and LowE glass + LowE glass, and a glass thickness of 24 mm was used for all control groups. The properties of each glass were combined and calculated from an EnergyPlus-based library. Details of the control groups are shown in Table 1.

Table 1.
Details of control windows.
2.2.2. Analysis Site and Time Configuration
The location of the simulation was set to Gwangju, Korea, and the 2015 Gwangju Weather Data EnergyPlus Weather (EPW) file provided by the Korea Passive Architecture Association was used to obtain data [20]. The purpose of this study is to analyze the cooling and heating energy load by season, so simulations were performed on the spring equinox, summer solstice, autumnal equinox, and winter solstice, which represent the four seasons. However, individual EPW files may reflect special weather events such as snow or rain. Therefore, if the data from the equinox or solstice did not represent the season as a whole, the data for the closest possible date that was representative was used. Based on the 2015 EPW, the data from 16 March, 19 June, 26 September, and 21 December were used.
2.2.3. Office Unit Configuration
The configuration of an office building can differ depending on the type of core, and is the most basic element to consider when composing a useful space. The core space is planned according to the location and number of cores, and the core type affects the size of the base floor and the ways in which the office space can be used. According to the core plan, office buildings are divided into central, eccentric, both ends, independent, and distributed core type; the features of each are shown in Table 2 [21].
Table 2.
Core types and features.
In this study, the area of the core was calculated as 81 m2; it was a 9 × 9 m2 square. The span of the office pillar can be calculated by the parking space, and it was calculated as 8.1 m considering the three sides of the parking space and the size of the pillar (2.5 × 3 + 0.6 m). The width of the office space was 6 m, which was determined by subtracting the 2.1 m of corridor space from the 8.1 m column spacing span. The height was set to 3.4 m, and the ceiling height was set to 2.6 m. The window area ratio was 60%. A schematic illustration of the created office is shown in Figure 2.
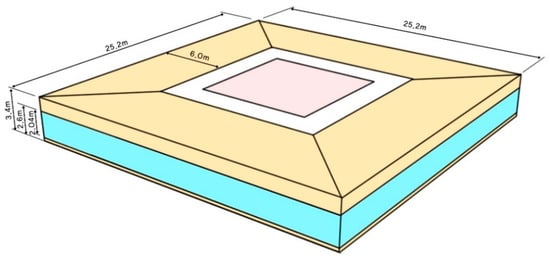
Figure 2.
Simulation unit.
The composition of the wall, floor, and roof is based on the energy conservation design standard. The physical properties of the material and the heat transmission rate standards for non-residential southern regions are shown in Table 3 [22].
Table 3.
Physical properties of the office unit structure.
A facility that can be used in general office buildings was planned, and an air-cooled refrigerator and hot water boiler were set up as heat sources. In addition, a variable air volume (VAV) reheating system with excellent energy savings was adopted, which was composed of a single duct. The immersion rate was set to 0.22 times/h. The heat densities generated by human body heat, lighting, and equipment were set to 65, 11, and 21 W/m2, respectively. The operation schedule was set based on ASHRAE 90.1. A summary of the simulation settings is shown in Table 4.
Table 4.
Simulation settings.
3. Simulation Results and Analysis
3.1. South Side Analysis
3.1.1. Spring Equinox Analysis
On the south side of the building on the spring equinox, both cooling energy and heating energy were required. The total daily cooling and heating loads are shown in Table 5.
Table 5.
Energy load of the south side on the spring equinox (cooling/heating) (W/m2).
The g-value of smart windows that minimizes the load was derived for each hour, taking into account both cooling and heating energy. From 0 to 5 o’clock, the load was calculated as 0 regardless of the g-value, and from 5 to 6 o’clock, the load was also 0 except for at a g-value of 0.15. The best g-value at 6 to 7 o’clock was 0.30, and the best g-value at 7 to 8 o’clock was 0.25. At 8 to 9 o’clock, the load was 0 except for at a g-value of 0.15, and from 9 to 11 o’clock the load was 0 regardless of the g-value. From 11 to 18 o’clock, the g-value 0.15 corresponded to the lowest load, and from 18 to 19 o’clock, the g-value of 0.25 corresponded to the lowest load. From 19 to 20 o’clock, for all g-values over 0.30, the load was calculated as 0, and between 20 and 22 o’clock, the g-value of 0.35 corresponded to the lowest load. Finally, after 22 o’clock, the load was 0 regardless of the g-value. The final schedule is shown in Table 6. For times with the same load, a lower g-value was adopted for privacy purposes at night, and a higher g-value was adopted for mining during the day.
Table 6.
Smart window g-value schedule for the south side on the spring equinox.
When the schedule was applied, the minimum value of the cooling and heating load was calculated as 61.351 W/m2, while that of the existing building windows CC, CL, and LL were calculated as 111.557, 94.813, and 77.699 W/m2, respectively. Thus, the use of smart windows rather than control windows could reduce the cooling and heating loads by 21.0% to 45.0% on the spring equinox. A graph comparing the energy load of the electrochromic window applied using the derived schedule to that of control windows is shown in Figure 3.

Figure 3.
Energy load comparison on the south side on the spring equinox.
3.1.2. Summer Solstice Analysis
On the summer solstice, only cooling energy was required. In most cases, we found that the lower the g-value, the lower the cooling load. The total daily cooling load is shown in Table 7.
Table 7.
Energy load of the south side on the summer solstice (cooling) (W/m2).
From 21 to 22 o’clock, when the g-value is 0.25, the cooling load is lowest, and from 22 to 24 o’clock, when the g-value is 0.30, the cooling load is the lowest. The total daily cooling load of smart windows with a g-value of 0.15 was the lowest, at 119.946 W/m2. In addition, when the schedule in Table 8 was applied, the daily cooling load was calculated as 119.715 W/m2. The cooling load of the control windows CC, CL, and LL was calculated as 222.162, 190.032, and 172.996 W/m2, respectively. Thus, application of smart windows on the south side of the building on the summer solstice can reduce the cooling load by 30.8% to 46.1%. A graph comparing the energy load of the electrochromic window applied using the derived schedule vs. that of the control windows is shown in Figure 4.
Table 8.
Smart window g-value schedule for the south side on the summer solstice.
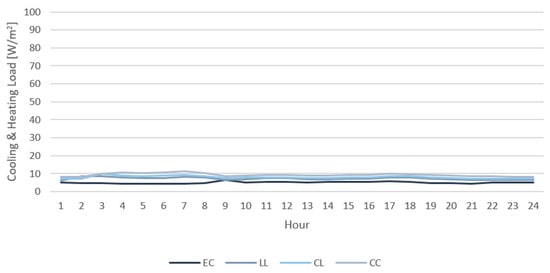
Figure 4.
Energy load comparison for the south side on the summer solstice.
3.1.3. Autumnal Equinox Analysis
On the autumnal equinox, both cooling energy and heating energy were required, and the cooling load was greater than that on the spring equinox. The total daily cooling and heating load is shown in Table 9.
Table 9.
Energy load on the south side on the autumnal equinox (cooling/heating) (W/m2).
The g-value of smart windows that can minimize the load was derived for each hour, taking into account both cooling and heating energy. Excluding 6 to 8 o’clock, smart windows with a g-value of 0.15 showed the lowest cooling and heating load, and between 6 and 7 o’clock, a g-value of 0.35 was the most advantageous. In addition, a g-value of 0.20 is the most advantageous in terms of energy use at 7–8 o’clock. The final schedule is shown in Table 10.
Table 10.
Smart window g-value schedule for the south side on the autumnal equinox.
When the schedule was applied, the minimum value of the cooling and heating load was 68.788 W/m2, while those of the existing building windows CC, CL, and LL were 166.684, 132.558, and 112.468 W/m2. Thus, we found that the cooling and heating loads could be reduced by 38.8–58.7% when smart windows were used instead of control windows on the autumnal equinox on the south side. A graph comparing the energy load of the electrochromic window applied with the schedule to those of the control windows is shown in Figure 5.
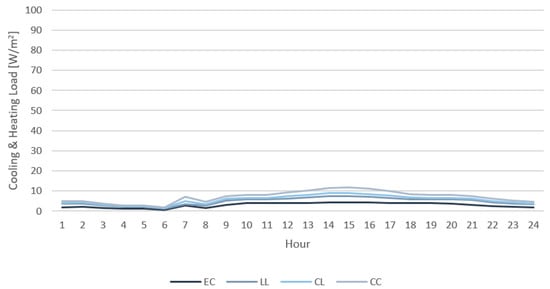
Figure 5.
Energy load comparison on the south side on the autumnal equinox.
3.1.4. Winter Solstice Analysis
On the winter solstice, only heating energy was required. The total daily heating load is shown in Table 11.
Table 11.
Energy load on the south side on the winter solstice (heating) (W/m2).
Among the control groups, the LL architectural windows were the most efficient, and the CC and CL windows with relatively high U-values were found to have increased heating load despite their high g-values. For the smart windows, the higher the g-value, the lower the heating load; even if the g-value was low in a certain section, the heating load was calculated as 0. When the schedule in Table 12 was applied, the daily heating load was 137.862 W/m2, which was higher than that of LL architectural windows but more efficient than CC and CL windows. Smart windows to which the schedule was applied have a 11.8% higher heating load than LL architectural windows. Therefore, the heating load can be reduced by 12.0–28.7% when smart windows are used rather than CC and CL windows. A graph comparing the energy load of the electrochromic window applied with the schedule to those of the control windows is shown in Figure 6.
Table 12.
Smart window g-value schedule for the south side on the winter solstice.
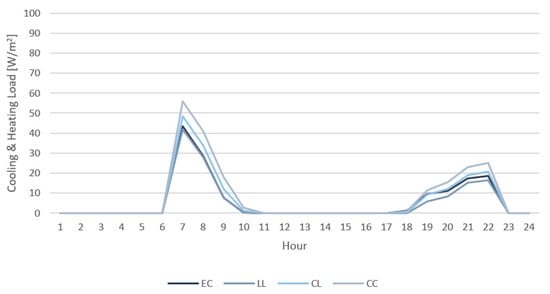
Figure 6.
Energy load comparison on the south side on the winter solstice.
3.2. East Side Analysis
3.2.1. Spring Equinox Analysis
On the east side of the building on the spring equinox, both cooling energy and heating energy were required. The total daily cooling and heating load is shown in Table 13.
Table 13.
Energy load of the east side on the spring equinox (cooling/heating) (W/m2).
The g-value of smart windows that can minimize the load was derived for each hour, taking into account both cooling and heating energy. From 0 to 6 o’clock, the load was calculated as 0 regardless of the g-value, and at 6 to 7 o’clock, the best g-value was 0.40. The g-value of 0.30 was the best at 7 to 8 o’clock. At 8 to 12 o’clock, the load was 0 regardless of the g-value, and at 11 to 12 o’clock, a g-value 0.15 was found to be the most efficient. From 12 to 13 o’clock, a g-value of 0.20 was associated with the lowest load, and at 13 to 17 o’clock, the g-value of 0.15 corresponded to the lowest load. From 17 to 18 o’clock, a g-value of 0.25 produced the lowest load; at 18 to 22 o’clock, a g-value of 0.40 produced the lowest load; and at 21 to 22 o’clock, a g-value of 0.20 corresponded to the lowest load. After 22:00, the load was calculated as 0 regardless of the g-value. The final schedule is shown in Table 14. For times with the same load, a lower g-value was adopted for privacy purposes at night, and a higher g-value was adopted for mining during the day.
Table 14.
Smart window g-value schedule for the east side on the spring equinox.
When the schedule was applied, the minimum value of the cooling and heating load was calculated as 121.853 W/m2, while those of the existing building windows CC, CL, and LL were 196.977, 159.613, and 129.602 W/m2. Thus, the cooling and heating loads could be reduced by 6.0% to 38.1% when smart windows were used rather than control windows based on data from the eastern equinox. A graph comparing the energy load of the electrochromic window applied with the schedule to those of the control windows is shown in Figure 7.
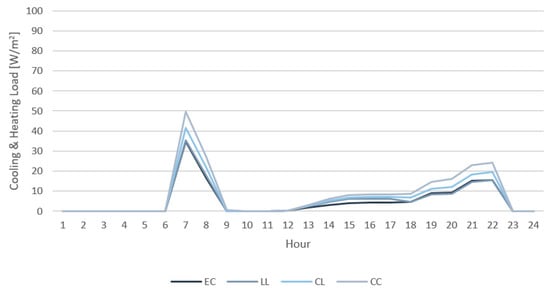
Figure 7.
Energy load comparison on the east side on the spring equinox.
3.2.2. Summer Solstice Analysis
On the summer solstice, only cooling energy was required. In all cases, it was confirmed that the lower the g-value, the lower the cooling load. The total daily cooling load is shown in Table 15.
Table 15.
Energy load on the east side on the summer solstice (cooling) (W/m2).
The daily cooling load of smart windows with a g-value of 0.15 was the lowest, at 146.865 W/m2. A schedule was also prepared, as shown in Table 16, because the g-value of 0.15 showed the best performance in all sections. The cooling loads for the control windows, CC, CL and LL, were 276.283, 236.786, and 214.859 W/m2. We found that application of the smart windows with the summer day schedule rather than control windows can reduce the cooling load by 31.6% to 46.8%. A graph comparing the energy load of the electrochromic window applied with the schedule to those of the control windows is shown in Figure 8.
Table 16.
Smart window g-value schedule on the east side on the summer solstice.
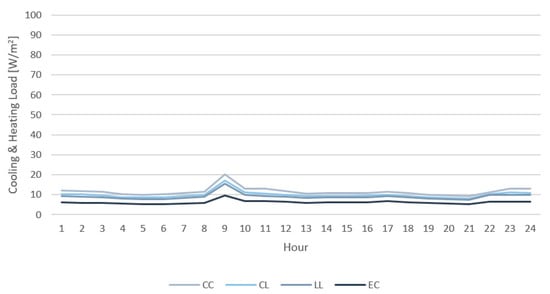
Figure 8.
Energy load comparison on the east side on the summer solstice.
3.2.3. Autumnal Equinox Analysis
On the autumnal equinox, both cooling energy and heating energy were required, and the cooling load was higher than that on the spring equinox. The total daily cooling and heating load is shown in Table 17.
Table 17.
Energy load on the east side on the autumnal equinox (cooling/heating) (W/m2).
The g-value of smart windows that minimizes the load was derived for each hour, taking into account both cooling and heating energy. Excluding 6 to 8 o’clock and 21 to 22 o’clock, smart windows with a g-value of 0.15 were associated with the lowest cooling and heating loads. At 6 to 7 o’clock, a g-value of 0.40 was found to be the most advantageous, and at 7 to 8 o’clock, a g-value of 0.20 was found to be the most advantageous in terms of energy use. Also, a g-value of 0.20 was beneficial at 21–22 h. The final schedule is shown in Table 18.
Table 18.
Smart window g-value schedule on the east side on the autumnal equinox.
When the schedule was applied, the minimum value of the cooling and heating load was calculated as 88.466 W/m2, while those of the existing building windows, CC, CL, and LL, were 163.565, 138.164, and 122.609 W/m2. Thus, the cooling and heating loads could be reduced by 27.8–45.9% when smart windows were used rather than control windows based on data from the autumnal equinox on the east side of the building. A graph comparing the energy load of the electrochromic window applied with the schedule to those of the control windows is shown in Figure 9.
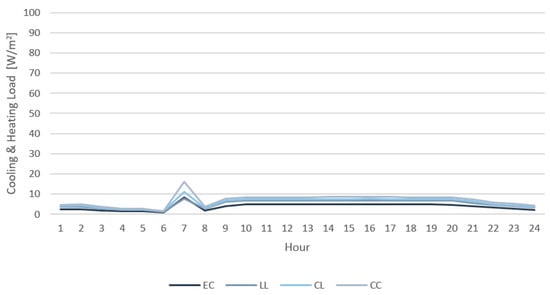
Figure 9.
Energy load comparison on the east side on the autumnal equinox.
3.2.4. Winter Solstice Analysis
On the winter solstice, only heating energy was required. The total daily heating load is shown in Table 19.
Table 19.
Energy load on the east side on the winter solstice (heating) (W/m2).
When considering heating energy, the g-value of smart windows that can minimize the load for each hour was derived as shown in Table 20. From 0 to 6 o’clock, g-value of 0.40 was the best, and from 6 to 9 o’clock, g-value of 0.15 was the best. From 9 to 12 o’clock, g-value 0.35 had the least heating load, g-value 0.20 at 12 to 15 had the least heating load, and g-value 0.15 at 15 to 22:00 had the least heating load. Became. It was found that the heating load was 0 when the g-value was 0.20 or higher at 22–23 h, and the heating load was the lowest when the g-value was 0.40 at 23–24 h.
Table 20.
Smart window g-value schedule on the east of the winter solstice.
When applying the schedule, the minimum value of the heating load was calculated as 477.012 W/m2. The existing architectural windows CC, CL, and LL were calculated as 781.19 W/m2, 609.538 W/m2, and 538.937 W/m2. It was found that the heating load can be reduced by 11.5% to 38.9% compared to general building windows based on the winter solstice period on the east side. The graph comparing the energy load of the electrochromic window applied with the schedule and the architectural window is as shown in the Figure 10.
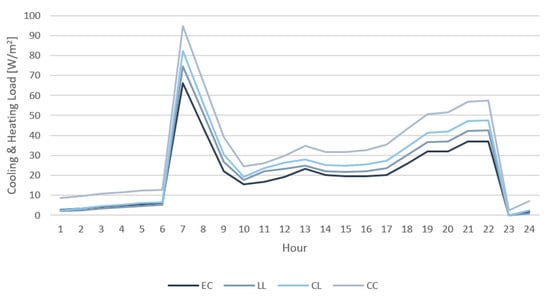
Figure 10.
Energy load comparison on the east side on the winter solstice.
3.3. West Side Analysis
3.3.1. Spring Equinox Analysis
On the east side of the building on the spring equinox, both cooling energy and heating energy were required. The total daily cooling and heating load is shown in Table 21.
Table 21.
Energy load on the west side on the spring equinox (cooling/heating) (W/m2).
The g-value of smart windows that can minimize the load was derived for each hour, taking into account both cooling and heating energy. From 0 to 6 o’clock, the load was calculated as 0 regardless of the g-value, and at 6 to 7 o’clock, a g-value of 0.40 was the best. From 7 to 12 o’clock, a g-value of 0.30 was the best. From 12 to 13 o’clock, a g-value of 0.20 was associated with the lowest load, and from 13 to 18 o’clock, a g-value of 0.15 was the most efficient. From 18 to 22 o’clock, a g-value of 0.40 corresponded to the lowest load, and after 22:00, the load was 0 regardless of the g-value. The final schedule is shown in Table 22.
Table 22.
Smart window g-value schedule on the west side on the spring equinox.
When the schedule was applied, the minimum value of the cooling and heating load was calculated as 124.648 W/m2. The values for the control windows, CC, CL, and LL, were 231.572, 179.573, and 139.235 W/m2, respectively. Thus, the cooling/heating load could be reduced by 10.5% to 46.2% by the use of smart windows rather than control windows based on data from the spring equinox on the western side of the building. A graph showing the energy load of the electrochromic window applied with the schedule compared with those of the control windows is shown in Figure 11.
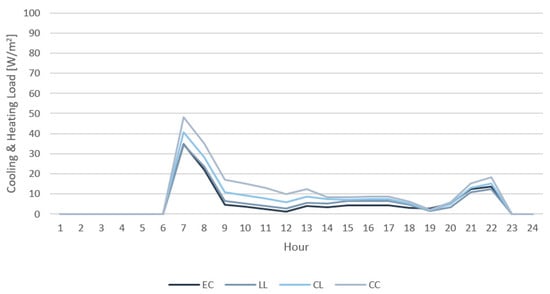
Figure 11.
Energy load comparison on the west side on the spring equinox.
3.3.2. Summer Solstice Analysis
On the summer solstice, only cooling energy was required. In all cases, it was confirmed that the lower the g-value, the lower the cooling load. The total daily cooling load is shown in Table 23.
Table 23.
Energy load on the west side on the summer solstice (cooling) (W/m2).
The daily cooling load of smart windows with a g-value of 0.15 was the lowest, at 147.376 W/m2. In addition, the schedule was also prepared, as shown in Table 24. The g-value of 0.15 showed the best performance in all sections. The cooling loads for the control windows, CC, CL and LL, were 279.458, 239.468, and 216.727 W/m2, respectively. Thus, use of the smart windows applied with the summer day schedule rather than control windows can reduce the cooling load by 32.0% to 47.3%. A graph comparing the energy load of the electrochromic window applied with the schedule to those of the control windows is shown in Figure 12.
Table 24.
Smart window g-value schedule on the west side on the summer solstice.
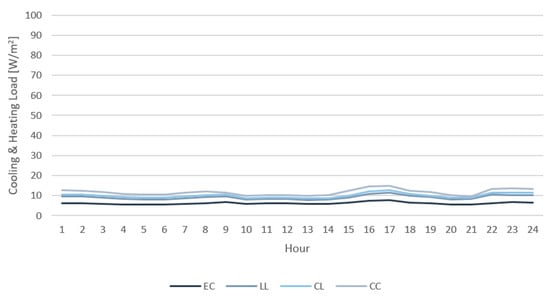
Figure 12.
Energy load comparison on the west side on the summer solstice.
3.3.3. Autumnal Equinox Analysis
On the autumnal equinox, both cooling energy and heating energy were required, and the cooling load was greater than that on the spring equinox. The total daily cooling and heating load is shown in Table 25.
Table 25.
Energy load on the west side on the autumnal equinox (cooling/heating) (W/m2).
The g-value of smart windows that can minimize the load was derived for each hour, taking into account both cooling and heating energy. Excluding 6 to 8 o’clock, smart windows with a g-value of 0.15 showed the lowest cooling and heating loads. From 6 to 8 o’clock, a g-value of 0.40 was the most advantageous. The final schedule is shown in Table 26.
Table 26.
Smart window g-value schedule on the west side on the autumnal equinox.
When the schedule was applied, the minimum value of the cooling and heating load was calculated as 95.806 W/m2, while those of the existing building windows, CC, CL, and LL, were 185.25, 153.101, and 134.457 W/m2. Thus, the cooling and heating loads could be reduced by 28.7–48.3% by use of the smart windows rather than control windows based on data from the autumnal equinox on the west side of the building. A graph comparing the energy load of the electrochromic window applied with the schedule to that of the control windows is shown in Figure 13.
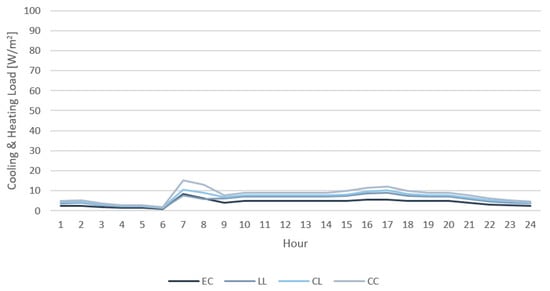
Figure 13.
Energy load comparison on the west side on the autumnal equinox.
3.3.4. Winter Solstice Analysis
On the winter solstice, only heating energy was required. The total daily heating load is shown in Table 27.
Table 27.
Energy load on the west side on the winter solstice (heating) (W/m2).
The g-value of smart windows that can minimize the load was derived for each hour by considering the energy used for heat, as shown in Table 28. From 0 to 6 o’clock, a g-value of 0.40 was the best, and from 6 to 14 o’clock, a g-value of 0.15 was the best. At 14 to 17:00, a g-value 0.35 corresponded to the lowest heating load. At 17 to 22:00, a g-value of 0.20 was associated with the lowest heating load, and at 22 to 23:00, the load was 0 regardless of the g-value. From 23 to 24:00 h, the heating load was the lowest when the g-value was 0.40.
Table 28.
Smart window g-value schedule on the west side on the winter solstice.
When applying the schedule, the minimum value of the heating load was calculated as 475.956 W/m2. The values for the control windows, CC, CL, and LL, were 763.512, 666.462, and 545.833 W/m2. Thus, the heating load can be reduced by 12.8% to 37.6% by use of smart windows rather than control windows based on data from the winter solstice on the west side of the building. The graph comparing the energy load of the electrochromic window applied with the schedule to that of the control windows is shown in Figure 14.
Figure 14.
Energy load comparison on the west side on the winter solstice.
4. Conclusions
The data on energy load per hour for electrochromic smart windows and existing windows under the as-developed schedules are shown in Table 29. Since the above schedules do not reflect special weather conditions, such as cloudy days, snow, and rain, the annual cooling and heating energy load was not calculated, and the load was summed for 4 sunny days representing each season.
Table 29.
Total energy consumption (W/m2).
When comparing the derived cooling and heating loads, the cooling and heating loads of buildings with electrochromic smart windows were low for all seasons except winter. On the winter solstice, electrochromic smart windows were found to be more efficient than all control windows except the LL architectural windows on the south side.
On the spring equinox, the efficiency of smart windows on the eastern side of the building was somewhat insufficient compared to those on the south and west sides. The smart windows showed the maximum efficiency in comparison with the CC architectural windows on the west side, with a 46.2% reduction in the energy load for heating and cooling. For LL architectural windows on the eastern side, use of smart windows produced a 6% reduction in energy load for cooling and heating, the minimum reduction that was recorded.
On the summer solstice, a similar energy load reduction was found regardless of direction. Compared to CC architectural windows on the west side, the smart windows produced the maximum reduction in energy load for cooling and heating, at 47.3%. For LL architectural windows on the south side, smart windows showed a 30.8% reduction in cooling and heating energy loads, the minimum that was recorded.
On the autumnal equinox, smart windows on the south side were superior to those on the east and west sides. Compared to CC architectural windows on the south side, smart windows produced an energy savings for cooling and heating of 58.7%, the greatest savings among all control groups. Compared to LL architectural windows on the east side, smart windows produced an energy load reduction of 27.8%, representing the lowest energy load reduction rate in the autumn.
On the winter solstice, the reduction in energy load associated with use of smart windows on the east and west sides was superior to that on the south side. The smart windows were most efficient in comparison to the CC windows on the east side, at 38.9%. Compared to LL architectural windows on the south side, smart windows produced a rather low performance of −11.8%.
The sum of the cooling and heating energy loads was derived for all four seasons. For the south side, energy savings of 20.3% to 45.0% are possible for each sunny day in all four seasons, making summer the season in which the greatest increase in energy efficiency is possible. Energy savings of 17.1–41.2% on the east side and 18.6–42.2% on the west side are possible. The energy load for each solar term is summarized in Figure 15, Figure 16 and Figure 17.
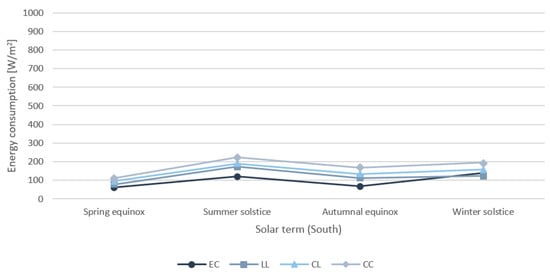
Figure 15.
Energy consumption by solar term (south).
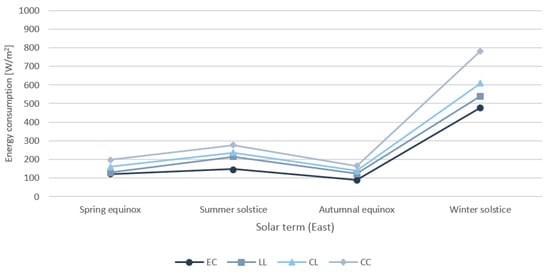
Figure 16.
Energy consumption by solar term (east).
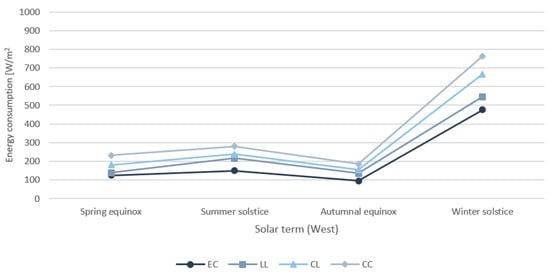
Figure 17.
Energy consumption by solar term (west).
The significance of this study is as follows. First, it identifies the most efficient direction of a building to which electrochromic smart windows are applied. Second, the g-values of electrochromic smart windows can be changed, but there is no standard for which algorithm should be used to determine the g-value; thus, the schedule presented by this study is significant in that it can serve as a standard. In previous studies, energy efficiency or environmental analysis of smart windows was conducted through an analysis of annual data. For this reason, there was insufficient data on how electrochromic windows should be adjusted based on the time of day. Therefore, this study differs from previous studies in that it suggests the proper state of electrochromic windows according to time of day through the four seasons, which reflects the weather in the various seasons. Therefore, the study is significant in that it takes into account the controlled state of electrochromic windows in automated buildings. Third, it is meaningful in that it presents a method of calculating the energy performance required for the creation of the algorithm. In addition, the results of this study can be used as a standard for investigating the properties of smart windows.
This study has the following limitations. In smart windows, the g-value changes in conjunction with the VLT. A VLT that is too low does not sufficiently transmit sunlight through to the inside of the building, so the window does not serve as a window. Therefore, a minimum VLT standard that can provide indoor lighting is required. In addition, this study is limited in that the analysis was not conducted on all days of the year; energy analysis was performed only on the sunny days of the spring equinox, summer solstice, autumn equinox, and winter solstice, representing the four seasons. Therefore, it is necessary to construct a database with more data measured on different days of the year. Alternatively, researchers could develop an algorithm to measure the energy consumption of buildings in real time and change the properties of smart windows. As a follow-up study, we will investigate methods of evaluating and controlling the lighting properties of smart windows.
Author Contributions
J.-H.K., J.H. and S.-H.H. designed the simulation settings; J.-H.K. and S.-H.H. performed the evaluations; J.-H.K. and S.-H.H. analyzed the data; J.H. and S.-H.H. verified the results; J.-H.K., J.H. and S.-H.H. wrote the paper. All authors have read and agreed to the published version of the manuscript.
Funding
This research was funded by National Research Foundation of Korea (Project No.: NRF-2018M3C1B9088457) and the Ministry of Trade, Industry and Energy of Korea (Project No.: 20193020010440).
Institutional Review Board Statement
Not applicable.
Informed Consent Statement
Not applicable.
Data Availability Statement
Data is contained within the article.
Acknowledgments
This paper has further been developed from Master’s thesis by Jae-Hyang Kim. This research was supported by a grant from Future Leading Technology R&D Program managed by NRF, Korea and a grant from the R&D Program for Core Technology of Renewable Energy (Transparent Photovoltaic Cells Based on Nanophotonic Structures for Near-Infrared Control) through the Korea Institute of Energy Technology Evaluation and Planning (KETEP).
Conflicts of Interest
The authors declare no conflict of interest.
References
- Gran View Research. Smart Glass Market Size, Share & Trends Analysis Report by Technology (SPD, PDLC, Liquid Crystal, Electrochromic), by Application (Consumer Electronics, Architectural, Transportation), and Segment Forecasts. Available online: https://www.grandviewresearch.com/industry-analysis/smart-glass-market (accessed on 28 December 2020).
- Martín-Chivelet, N.; Guillén, C.; Trigo, J.F.; Herrero, J.; Pérez, J.J.; Chenlo, F. Comparative Performance of Semi-Transparent PV Modules and Electrochromic Windows for Improving Energy Efficiency in Buildings. Energies 2018, 11, 1526. [Google Scholar] [CrossRef]
- Abdelsalam, A. Conventional Fixed Shading Devices in Comparison to an Electrochromic Glazing System in Hot, Dry Climate. Energy Build. 2013, 59, 104–110. [Google Scholar]
- Dussault, J.-M.; Gosselin, L. Office Buildings with Electrochromic windows: A Sensitivity Analysis of Design Parameters on Energy Performance, and Thermal and Visual Comfort. Energy Build. 2017, 153, 50–62. [Google Scholar] [CrossRef]
- Kim, J.; Han, S. A Quantification Procedure for Interior Performance of Architectural Openings Associated with Dye-Sensitized Solar Cells. Sustainability 2019, 11, 6461. [Google Scholar] [CrossRef]
- Nicholas, D.; Arman, S.; Stephen, S.; Delia, J. A Comparative Energy Analysis of Three Electrochromic Glazing Technologies in Residential Building. Appl. Energy 2017, 192, 95–109. [Google Scholar]
- Oh, M.; Tae, S.; Hwang, S. Analysis of Heating and Cooling Loads of Electrochromic Glazing in High-Rise Residential Buildings in South Korea. Sustainability 2018, 10, 1121. [Google Scholar] [CrossRef]
- Oh, M.; Jang, M.; Moon, J.; Roh, S. Evaluation of Building Energy and Daylight Performance of Electrochromic Glazing for Optimal Control in Three Different Climate Zones. Sustainability 2019, 11, 287. [Google Scholar] [CrossRef]
- Detsi, M.; Manolitsis, A.; Atsonios, I.; Mandilaras, I.; Founti, M. Energy Savings in an Office Building with High WWR Using Glazing Systems Combining Thermochromic and Electrochromic Layers. Energies 2020, 13, 3020. [Google Scholar] [CrossRef]
- Cannavale, A.; Ayr, U.; Fiorito, F.; Martellotta, F. Smart Electrochromic Windows to Enhance Building Energy Efficiency and Visual Comfort. Energies 2020, 13, 1449. [Google Scholar] [CrossRef]
- Ghosh, A.; Norton, B.; Duffy, A. Behavior of an SPD switchable glazing in an outdoor test cell with heat removal under varying weather conditions. Appl. Energy 2016, 180, 695–706. [Google Scholar] [CrossRef]
- Nundy, S.; Ghosh, A. Thermal and visual comfort analysis of adaptive vacuum integrated switchable suspended particle device window for temperate climate. Renew. Energy 2020, 156, 1361–1372. [Google Scholar] [CrossRef]
- Min, J.; Hong, H. A Study on the Energy Performance Evaluation of a Smart Skin for Reducing Cooling Load of Building Envelope in Office Building. Korean J. Air-Cond. Refrig. Eng. 2018, 30, 546–557. [Google Scholar]
- Ko, Y.; Hong, H.; Min, J. Energy Performance Evaluation of Responsive Smart Windows Applying SPD According to Window Area Ratio and SHGC Range. Korean J. Air-Cond. Refrig. Eng. 2020, 32, 441–447. [Google Scholar]
- Ko, Y.; Oh, H.; Hong, H.; Min, J. Energy Consumption Verification of SPD Smart Window, Controllable According to Solar Radiation in South Korea. Energies 2020, 13, 5643. [Google Scholar] [CrossRef]
- Baek, S.; Choi, W.; Suh, S. A Theoretical Study on a Folding Shading Device. J. Korean Sol. Energy Soc. 2009, 29, 28–36. [Google Scholar]
- Park, J.; Kim, K. A Study on the Optimization of Glazing and Shading Devices for Energy Savings in Perimeter Zones of a Small Office Space. J. Archit. Inst. Korea Plan. Des. 2009, 25, 321–328. [Google Scholar]
- Kim, T. LCC Evaluation of Multi-hybrid HVAC Systems in High-Rise Office Building Using Energy Analysis Method. Master’s Thesis, University of Hanyang, Seoul, Korea, 2013. [Google Scholar]
- Kim, G. A Basic Study on the Development of Air Cap Wall Module to Reduce Building Energy Consumption: Focusing on Amount Used Electric Power of Cooling, Heating, Lighting. Master’s Thesis, University of Kookmin TED, Seoul, Korea, 2018. [Google Scholar]
- ORION NES. Available online: http://www.orionnes.co.kr/Vmodel (accessed on 28 December 2020).
- Yang, H. A Study on the Urban Fabric and the Typology of High-Rise Building on Teheran-Ro Street in Seoul. Master’s Thesis, University of Seoul, Seoul, Korea, 2020. [Google Scholar]
- Ministry of Land, Infrastructure, and Transport Notification No. 2017-881, Republic of Korea. Available online: http://www.molit.go.kr/USR/I0204/m_45/dtl.jsp?idx=15270 (accessed on 28 December 2020).


Publisher’s Note: MDPI stays neutral with regard to jurisdictional claims in published maps and institutional affiliations. |
© 2021 by the authors. Licensee MDPI, Basel, Switzerland. This article is an open access article distributed under the terms and conditions of the Creative Commons Attribution (CC BY) license (http://creativecommons.org/licenses/by/4.0/).