Abstract
Green space may play an essential role in residents’ physical activity (PA), but evidence remains scattered in China. This study systematically reviewed scientific evidence regarding the influence of green space on PA among residents in China. Keyword and reference searches were conducted in PubMed, Web of Science, Scopus, EBSCO, and CNKI from the inception of an electronic bibliographic database to May 2021. Eligibility criteria included the following: study designs—observational (e.g., longitudinal or cross-sectional studies) and experimental studies; study subjects—people of all ages; exposures—green space (e.g., parks, vegetation areas, open green fields); outcomes—leisure-time and work/school-related PA (e.g., active commuting); and country—China. All but two studies identified at least one measure of green space to be associated with PA. Street greenness was associated with increased odds of active commuting (e.g., cycling) and walking, and a reduced risk of physical inactivity. Access to green space was associated with increased PA levels and green space usage. Distance to green space was inversely associated with the odds of PA. By contrast, evidence linking overall greenness exposure to PA remains limited. Future studies adopting experimental study design are warranted to establish more robust scientific evidence of causality between green space and PA in China. Future studies are also warranted to examine the underlining mechanisms and the differential impacts of green space on population subgroups in China.
1. Introduction
Physical inactivity is a leading risk factor for major non-communicable diseases such as type 2 diabetes, coronary heart disease, and cancer [1]. Based on the 2014 National Fitness Survey, only 15% of adults in China regularly engaged in 30 or more minutes per day of moderate-to-vigorous intensity physical activity (MVPA) on 3 days per week [2]. Based on the 2016 Physical Activity and Fitness: The Youth Study, less than 30% of children and adolescents met the recommendation of 60 or more minutes of daily MVPA made by the World Health Organization (WHO) [3,4].
Green space (e.g., parks, gardens, forests, and greenways) consists of land areas which are covered with grass, trees, shrubs, or other vegetation [5]. Green space exposure is linked to reduced risks of all-cause mortality, cardiovascular disease, respiratory disease, diabetes, stress, anxiety, and depression [6,7]. It may also contribute to long-term health benefits for residents through the creation of a free, low-cost environment for physical activity (PA) [8,9]. Green space has received increasing attention in public health research and has been recognized as an essential environmental factor for PA engagement [8,9]. People exercising in green space focus on environmental factors, such as natural surroundings, rather than individual factors such as body image or appearance-enhancement when compared with those participating in sports and gym-based exercises [10]. PA in an outdoor natural environment may provide greater health benefits than exercising indoors [11]. The unique benefits of nature-based exercise are centered on notions of the affordances and variability of nature [12]. Exposure to nature contributes to improving cognitive function, brain activity, blood pressure, mental health, and sleep [13].
A large body of literature has examined green space in relation to PA [14,15,16]. For example, people living in neighborhoods with higher levels of green space were found to engage in more PA [17]. The availability of green space was associated with an increased likelihood of achieving the PA level recommended by guidelines [18]. Improved access to urban parks and green spaces has been shown to increase PA [14,19,20]. However, conflicting evidence is also present. For example, Hillston et al. found that distance to green space was not associated with self-reported leisure-time PA in the U.K. [15]. Similarly, access to parks was not associated with PA in New Zealand [21]. Discrepancies across studies could be partially due to the heterogeneous populations and geographical locations under examination, as well as differences in research methods (e.g., cross-sectional vs. longitudinal study designs) and measurements (e.g., objective vs. self-perceived green space measures). The usage of green space for PA may be different among people from different socio-economic strata and cultural backgrounds [16,22]. Most previous studies on green space and PA focused exclusively on populations in developed countries (e.g., the USA, the U.K., New Zealand, or Australia), though research on people residing in China has increased gradually in recent years. China has experienced a rapid urbanization process, with the urbanization rate increasing from 49.7% in 2010 to nearly 64% in 2020 [23]. Although urbanization has inevitably affected green space, the government has taken measures to protect and improve green space. The forest coverage rate in China reached 23.04% in 2020 from only 8.6% in 1949 [24]. The green coverage rate increased to 41.15% in 2019 in urban areas [25]. Moreover, China possesses unique characteristics in terms of physical activity pattern and built environment, which may differ from those of other countries. However, evidence regarding the relationship between green space and physical activity is still scattered.
This study aimed to systematically review the existing literature regarding the impact of green space on PA among residents in China, and to contribute to the literature in the following three ways: First, it synthesized and contrasted studies conducted in different countries, which facilitated a multifaceted overview of the impact of green space on PA. Second, it assessed the potential mechanisms linking green space to PA, with pathways grounded in a conceptual framework that could inform behavioral interventions. Third, study findings could be valuable to policymakers and stakeholders such as urban planners in designing or modifying certain features of green space in order to promote a healthier lifestyle.
2. Methods
The systematic review was conducted in accordance with the PRISMA (Preferred Reporting Items for Systematic Reviews and Meta-Analyses) guidelines [26].
2.1. Study Selection Criteria
Studies that met all of the following criteria were included in the review: (1) Study designs: observational studies (e.g., longitudinal or cross-sectional studies), or experimental studies; (2) Study subjects: people of all ages; (3) Exposures: various green space types and measures (e.g., parks, vegetation areas, or open green fields); (4) Outcomes: leisure-time or work/school-related PA (e.g., active commuting); (5) Type of outcomes measure: Objective and/or subjective PA measure; (6) Article type: peer-reviewed publications; (7) Time window of search: from the inception of an electronic bibliographic database to May 2021; (8) Country: China; and (9) Language: articles written in English or Chinese.
Studies that met any of the following criteria were excluded from the review: (1) studies that examined either green spaces or PA but not both; (2) articles not written in English and Chinese; and (3) letters, editorials, study/review protocols, case reports, or review articles.
2.2. Search Strategy
A keyword search was performed in five electronic bibliographic databases: PubMed, Web of Science, Scopus, EBSCO (including SPORTDiscus and GreenFILE), and CNKI (a central Chinese scientific literature database). The search algorithm included all possible combinations of keywords from the following two groups: (1) “greenspace”, “greenspaces”, “green-space”, “green space”, or “green spaces”; (2) “motor activity”, “motor activities”, “sport”, “sports”, “physical fitness”, “physical exertion”, or “physical activity.” The complete list of keywords and search algorithms in PubMed is provided in Appendix A. Medical Subject Headings (MeSH) terms “exercise”, “China”, and “human” were used in the PubMed search. Potentially eligible articles were retrieved, and their full texts were evaluated. Two co-authors of this review independently performed title and abstract screening against the study selection criteria. Cohen’s kappa (κ = 0.70) was used to assess inter-rater agreement. A third co-author resolved the discrepancies between the above two co-authors through discussion. Besides the keyword search, a manual search in Google Scholar was also performed.
2.3. Data Extraction and Synthesis
A standardized data extraction form was used to collect the following methodological and outcome variables from each included study: author(s), year of publication, city, study design, sample size, age range, proportion of females, sample characteristics, statistical model, non-response rate, geographical coverage, setting, type of green space measure, detailed measure of green space, type of PA measure, detailed measure of PA, estimated effects of green space on PA, and key findings on the relationship between green space and PA. The data extraction was independently conducted by two co-authors of this review. Discrepancies were resolved through discussion with a third co-author.
We summarized the common themes and findings of the included studies narratively. A meta-analysis proved infeasible due to the substantial heterogeneities in green space and PA measures across the included studies.
2.4. Study Quality Assessment
The National Institutes of Health’s Quality Assessment Tool for Observational Cohort and Cross-Sectional Studies was used to assess the quality of each included study [27]. There were 14 quality assessment questions for each included study. A score of one was assigned for the answer of “yes” for each question, whereas a score of zero was assigned for the answer of “no”. An overall score of study quality is obtained by calculating scores for all criteria. We used study quality assessment to measure the strength of scientific evidence but not to determine the inclusion of studies.
3. Results
3.1. Study Selection
Figure 1 shows the study selection flowchart. We identified a total of 3017 articles through keyword and reference searches, including 441 articles from PubMed, 256 articles from Web of Science, 446 articles from Scopus, 870 articles from EBSCO, 1000 articles from CNKI, and four articles through a manual search in Google Scholar. After removing duplicates, 2870 unique articles underwent title and abstract screening, in which 2808 articles were excluded against the study selection criteria. The remaining 62 articles underwent full-text review. Of these, 21 articles were excluded—6 articles were not conducted in China, three reported no green space measure, four reported no PA-related outcome, and the remaining eight were reviews or commentaries instead of original studies. Therefore, 41 articles in total were included in the review [16,17,20,22,28,29,30,31,32,33,34,35,36,37,38,39,40,41,42,43,44,45,46,47,48,49,50,51,52,53,54,55,56,57,58,59,60,61,62,63,64].
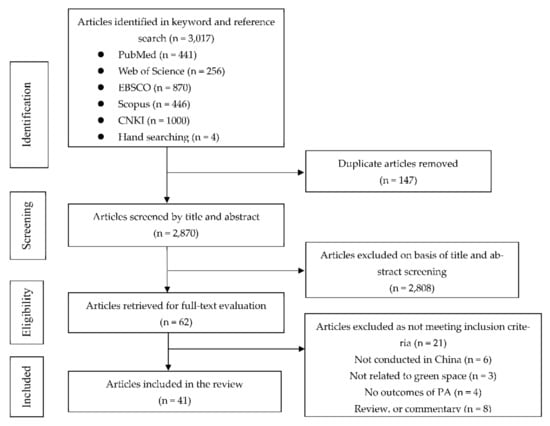
Figure 1.
Study selection flowchart.
3.2. Characteristics of the Included Studies
Table 1 summarizes the essential characteristics of the 41 studies included in the review. All studies were published within the past six years (two in 2015, one in 2016, three in 2017, five each in 2018 and 2021, ten in 2019, and fifteen in 2020). Six exclusively focused on residents in Beijing, twelve in Hong Kong, six in Shanghai, four in Guangzhou, four in Shenzhen, two each in Dalian and Harbin, and one each in Baoji, Nanning, Nanjing, and Wuhan. Thirty-nine studies adopted a cross-sectional design, and two adopted a longitudinal design. The sample sizes were generally large but varied substantially across studies. One study analyzed 20 million cycling trips, three analyzed 6126 to 581,354 headcounts or park visits, and the remaining 29 studies included 180 to 90,445 participants. Ten studies focused on seniors aged 60 years and older, nine on adults aged 18 years and older, two on residents aged 15 years and older, one on residents aged 11 years and older, five on children and adolescents aged 18 years and younger, and six on people of all ages, while the remaining eight did not report the age range. Twelve studies did not report the sex distribution in their sample, and the remaining 29 studies included both sexes. The percentage of females across studies ranged from 35.0% to 64.3%. Various statistical models were applied across studies, including ordered logistic or probit regression, multi-level regression, structural equation models, negative binomial regression, and correlation analysis. The majority of studies (n = 20) adjusted for some individual sociodemographics (e.g., age, gender, education, marital status, household income, employment status, body mass index, and health condition) in the statistical analyses. Ten studies adjusted for some contextual characteristics (e.g., land-use mix, population density, street intersection density, number of bus stops, social environment, and travel characteristics) in the statistical analyses.

Table 1.
Basic characteristics of the studies included in the review.
Table 2 summarizes the measures for green space and PA-related behaviors among the included studies. The majority (n = 22) of studies adopted objective green space measures, nine used subjective green space measures, and ten used both objective and subjective measures. Objective green space measures included satellite-based remote sensing images from Gaode Map, Google Street View, and Baidu Street View; geographical data collected by the Lands Department of Hong Kong and the Nanning Bureau of Land Management; and measures constructed using geographical information systems (GIS). Subjective green space measures included field visits, observations and questionnaires administered to study participants. Buffer sizes commonly used in the studies include 400 m [33,39,40,56], 500 m [28,35], 800 m [33,39,40,56], and 1000 m [32,35], centering a respondent’s home [28,32,33,39,40,56], school [56], nearby subway station [61], or other landmark (e.g., workplace, supermarket, restaurant, fitness center, or snack bar) [35]. Buffer sizes were chosen in consideration of physical activity mode (e.g., walking, running, or biking) or characteristics of the built environment.
Table 2.
Measures of green space and physical activity in the studies included in the review.
Eleven studies examined the accessibility of green space, four examined the availability of green space, 12 examined certain features of green space, and 26 examined greenness (e.g., Normalized Difference Vegetation Index [NVDI], street greenness). PA-related behaviors measured in the studies included PA participation or duration (n = 26), physical inactivity or sedentary behavior (n = 2), metabolic equivalent of task (MET) (n = 2), energy expenditure (n = 1), active commuting (n = 2), and park use or visits (n = 5). The majority of studies (n = 28) measured PA levels using questionnaires reported by participants, four measured PA behaviors through site observations, while seven studies adopted an objective measure (e.g., a pedometer, Weibo PA check-in data, or Mobike). One study used both on-site observations and questionnaires, while another adopted both an objective measure (i.e., a pedometer) and questionnaires. PA-related questionnaires included both standardized instruments (e.g., the International Physical Activity Questionnaire [IPAQ] and the Hong Kong Travel Characteristics Survey) and investigator-designed question items.
Table 3 summarizes the key findings reported in the studies included in the review regarding the estimated influence of green space on PA among Chinese residents. Among the 41 studies that provided quantitative estimates of the relationship between green space measures and PA, 39 reported at least one statistically significant relationship in the expected direction. The remaining two reported a null finding. The findings can be classified into five aspects.
Table 3.
Estimated effects of green space on physical activity in the studies included in the review.
First, the overall greenness in a local area was associated with PA, but findings were inconsistent across the studies. Eight studies found a positive association, while two studies found a negative association, and seven found a null association. For different age groups, four of five studies focusing on adults reported a positive association. Four of five studies examining all age groups reported a null result. For different domains of PA, three of five studies examining leisure-time PA reported a positive association, while the remaining two reported a null result. Two of six studies examining transport PA reported a positive association, and the remaining four reported a negative or null association. Three of seven studies examining the total PA reported a positive association, while four reported a negative or null association. The overall greenness was usually measured with a bird’s eye perspective using NDVI, the green coverage index, or the total acreage of green spaces. Specifically, greenness surrounding schools had a positive effect on the odds of active transport to and from school among children within an 800-m buffer [56]. By contrast, greenness around neighborhoods and schools was not found to be associated with MVPA among children and adolescents [30]. NDVI, which was widely used to assess overhead-view greenness, was positively associated with MVPA within a 1200-m buffer [40]. By contrast, NDVI was not associated with the odds of cycling [39] and the total number of park users within a 400-m and 800-m buffer [63], and was inversely associated with weekly walking frequency within a 400-m buffer, daily walking time within an 800-m buffer, and active commuting time within a 1200-m and 1600-m buffer [40]. Greenness cover rate was positively associated with leisure-time PA duration [37] and PA diversity [62]. A higher ratio of green space was associated with a lower risk of physical inactivity [50], longer duration of total PA time [64], higher MET-minutes per week, higher IPAQ-measured PA levels [42], and increased active commuting frequency [49]. By contrast, the vegetation cover rate was not associated with park visits [36], cycling [46], MVPA time [20], and PA satisfaction level [17]. Bird’s eye-view greenness was found to be inversely related to bike usage on weekends and holidays but not on weekdays [61].
Second, street greenness, namely streets with greater vegetation coverage, was usually assessed using the Green View Index (GVI). 14 studies found a consistent positive association between street greenness and PA. Among the 11 studies that reported age groups, four studies focused on people of all ages, four on elders, two on adults, and one on children or adolescents. For different PA domains, eight studies examined transport PA, four examined overall PA, and two examined leisure-time PA. Street greenness was found to be positively associated with the odds of walking [33,34,41], cycling [39,53], achieving 300 min of total PA per week [48], achieving 150 min of recreational PA per week [32], engaging in regular recreational PA [32], and engaging in active commuting to school [56]. Street greenness was also associated with increased walking duration [33,34,41], bike-sharing usage [61], and older adults’ average PA duration [59]. GVI was positively associated with the total number of park users [63], density of shared bicycle use [46], and walking duration among older adults [57]. Participants living in neighborhoods with a GVI of over 15% had a lower risk of physical inactivity [50].
Third, 14 studies found that accessibility to green space was positively associated with PA, while five studies reported a negative or null result. For different age groups, six of seven studies focusing on adults, two of three studies focusing on children or adolescents, two of four studies focusing on elders, and one of two studies focusing on people of all ages reported a positive association. For different PA domains, six of nine studies examining leisure-time PA reported a positive association, while three reported a negative or null finding. Seven of nine studies examining overall PA reported a positive association, while two reported a null association. Accessibility to green space (e.g., lawns in urban areas, parks, and public open spaces) were positively associated with the use of open space [29], PA level [16,20], intensity of total PA within a 10-min walking distance buffer among children [43], the odds of leisure walking among seniors within a 1000-m buffer [49], low-intensity walking [44], green space visiting frequency [47], and physical fitness among residents [42]. The distance or travel time to green space was inversely associated with residents’ PA satisfaction level [17], green space use [36,54], number of visits [51], leisure-time PA duration [37], and the odds of PA participation [28,47]. By contrast, distance to green space was positively associated with PA duration [47]. Proximity to a greenway was not associated with MVPA levels [44]. Walking time to the nearest park was not associated with PA [20]. No association was found between perceived distance to parks and PA or energy expenditure among older adults in Hong Kong [45,52].
Fourth, the availability of green space was associated with PA. Counts of various types of green spaces available for PA significantly affected respondents’ PA satisfaction levels [17]. The number of parks was positively associated with residents’ weekly MVPA time within a 500-m buffer [20] and the likelihood of walking within an 800-m buffer [34]. The number of parks surrounding schools was positively associated with the odds of active commuting [56]. Park density was positively associated with the odds of leisure-time walking and the odds of walking time exceeding 150 min per week among older adults [49]. Types of activity areas were positively associated with the number of older adults being active in parks [45]. The presence of outdoor fitness equipment was positively associated with total steps taken among residents [58]. The number of fitness facilities was positively associated with PA within a 400-m buffer [40] and leisure-time PA [37]. By contrast, the number of parks was not associated with PA [40] and walking time [34].
Fifth, design characteristics of green space were associated with residents’ PA. Pathway length was found to be positively associated with the number of older adults exercising in parks [31]. Different environmental settings such as water, plaza, lawn, and architecture supported different types and levels of PA [55]. Overall acreage of the natural area in a park was positively associated with total steps taken [58]. Park size was found to be associated with an increased number of visits [36] and recreational PA [32]. By contrast, perceived natural attraction was inversely associated with the odds of walking [49]. Landscape accessories in open spaces showed limited effects on residents’ outdoor activities [29]. Woodland was not associated with the number of visitors [29]. Size of the natural environment [16], landscape quality [16], attractiveness [45], park features [45,52], and park safety [16,45] were not associated with residents’ PA. Park size was not associated with PA frequency and weekly PA duration [48].
3.3. Study Quality Assessment
Table 4 reports criterion-specific and global ratings of the study quality assessment. The included studies scored six out of 14 on average (ranging from four to eight). All studies included in the review clearly stated the research question or objective, defined the study population, had a participation rate of over 50%, recruited subjects from the same or similar populations during the same period, and prespecified and uniformly applied inclusion and exclusion criteria to all potential participants. Most studies implemented valid and reliable exposure measures (n = 32). Twenty studies implemented valid and reliable outcome measures. Twenty-three studies measured and statistically adjusted key potential confounding variables for the associations between exposures and outcomes. Fourteen studies examined different levels of exposure concerning the outcome. By contrast, two studies had a reasonably long follow-up period that was sufficient for changes in outcomes to be observed. Only a single study assessed the exposures more than once during the study period. None of the studies had the outcome assessors blinded to the exposure status of the participants, provided a sample size justification using power analysis, or measured exposures of interest before the outcomes.
Table 4.
Study quality assessment.
4. Discussion
This study reviewed the scientific literature linking green space to PA among residents in China. A total of 41 studies met the eligibility criteria for inclusion. All but two studies identified at least one measure of green space to be associated with PA. Street greenness was associated with increased odds of active commuting (e.g., cycling), walking, and a reduced risk of physical inactivity. Accessibility to green spaces was associated with increased PA levels and green space usage. Distance to green space was inversely associated with the odds of PA. By contrast, evidence linking overall greenness exposure to PA remains limited.
Findings from this review confirmed the documented relationship between green space and PA in developed countries. For example, Krenn et al. reported that street greenness was positively associated with cyclists’ route choices in Austria [65]. Nawrath et al. examined the attractiveness of streets for cycling in European cities and found that most respondents preferred cycling in green streets [66]. Tsai et al. reported that street greenery was positively associated with PA in the US [67]. The studies pointing out the consistencies of the positive association between street greenness and PA in this review mainly focused on examining transport PA across all-ages population, and overall PA in elderly population. For the distance to green space, most studies found accessibility to green space was positively associated with PA in China across the adult population. Sugiyama et al. also reported that accessibility to green space was associated with walking in Australia [68]. Coombes et al. found that increasing distance was associated with the declined frequency of green space use in England [14]. Future research examining the effect of accessibility to green space on PA needs to be conducted on the sub-population of vulnerable groups, especially elderly people. This is also in line with current needs regarding the construction of a healthy aging environment. Findings from this review stressed the importance of designing new green spaces or modifying existing ones to promote PA for residents in China.
The effects of overhead-view greenness, the availability of green space, and the design characteristics of green space remain mixed. As a complex behavior, PA could be correlated with a broader perspective of greenness rather than a traditionally used measure of green space [18]. For example, Giles-Corti et al. reported that residents preferred attractive green spaces over simple proximity [69]. Frank et al. reported that the number of green spaces was more important than the total size of green space for PA within a certain distance [70]. In addition, older adults may prefer parks, corridors [42], and benches in green space that could provide a seating area; young people might prefer the availability of sports facilities in green space [42]; and children and teenagers might prefer green space with a playground and attractive scenery [71,72]. Teenagers are more willing to visit parks without benches when participating in sports activities [73]. Therefore, the accessibility, vegetation percentage, quantity, and attraction of green space should be considered in combination with population characteristics in future research. Policymakers and landscape architects may need to consider the distinct needs of different age groups.
Mechanisms connecting green space to PA were inadequately examined. Only two studies explored the specific mechanisms linking green space to PA [34,39]. The primary mediator identified pertained to the aesthetic, amenity, and attractive environment of green space [34,39]. In addition, Bauman et al. reported that social support could serve as a mediator for behavioral change when exposed to green space [74]. Hunter et al. argued that social interaction was inherent to the bond between PA and green space, as green space provided interaction opportunities for exercisers [8]. Another pathway through which green space promotes PA could be nature itself, as experiencing nature or the need for “fresh air” motivates people to engage in PA in green spaces [75]. Future studies should measure a wide range of potential mediators of PA initiation and maintenance to test the hypothesized pathways [8].
Affluence may play an important role in the association of green space and PA, resulting in health inequalities and disparities [76]. Those in low-income areas have less parkland and participate in less PA than those in high-income areas [77]. A review also reported that income has an effect on using green spaces for PA [78]. These findings are consistent with a study conducted in China [37]. Dai et al. reported that there were community differences in the effect of green space on leisure PA, and residents’ leisure PA in low-income communities was mainly constrained by the effects of time and money [37]. Therefore, future work should take income level as a significant covariate in the relationship of green space and PA.
Building new and improving existing green space has become a priority in the urban planning policies of some Chinese cities. For instance, Healthy Beijing 2030 puts forward a strategic plan for improving urban green space [79]. The plan includes expanding forest coverage, upgrading parks for leisure, and implementing the street greenway project [79]. The plan aims for a forest coverage rate of 45%, a per-capita green space of 16.8 square meters, and a 1000-km municipal green street by 2030 [79]. Findings from this review suggest that these policy interventions are likely to enhance PA engagement among residents. Meanwhile, green space designs that incorporate sports facilities, playgrounds, walking paths, seats, and sceneries could also contribute to PA promotion and green space use. Street greenness designed with aesthetics, safety, and connectivity would be a promising way to encourage both leisure PA and active travel.
Despite the merits of this study, several limitations of this review and the included studies should be noted. First, all studies adopted a cross-sectional study design, which was prone to confounding bias and did not infer causality between green space and PA. Second, most studies used self-reported PA measures, which were subject to recall error and social desirability bias [80]. Third, some studies did not consider the potential moderators of traffic, safety, weather, or green space maintenance and condition, as relevant data were not always available to researchers. Fourth, a limited number of mechanisms (e.g., aesthetics, attractiveness) have emerged in the literature, and the roles of those mediating mechanisms in the relationship between green space and PA were inadequately assessed. Future studies adopting experimental study design are warranted to establish more robust scientific causality evidence between green space and PA in China. Objective measures of PA (e.g., GPS, pedometer, accelerometer, and mobile applications) are recommended for future studies. Due to the important roles of temperature, noise, air pollution, safety, and aesthetics in promoting PA in green space, such data should be added to the modeling analysis in future studies. Furthermore, we suggest combining objective and subjective measures of green space to better understand the mechanism between greenspace and PA. Place of residence might also be an important moderator in the associations between nature exposure and PA [81]. Most of the studies focused on the urban area, while few studies explored the differences in the effect of green space and PA considering the urban or rural place of residence. Future work examining the association of green space and PA should incorporate rural areas when considering the place of residence.
Beyond the above, this review has two primary limitations. First, the literature search identified articles written in English and Chinese but excluded those reported in other languages. Second, this review only included published literature. Future reviews could conduct a grey literature search to include relevant and useful unpublished studies.
5. Conclusions
This study systematically reviewed the scientific literature regarding the relationship between green space and PA among Chinese residents. Street greenness was associated with increased odds of active commuting (e.g., cycling) and walking, and a reduced risk of physical inactivity. Accessibility to green space was associated with increased PA levels and green space usage. Distance to green space was inversely associated with the odds of PA. By contrast, evidence linking overall greenness exposure to PA remains limited. Future studies adopting experimental study design are warranted to establish more robust scientific causality evidence between green space and PA in China. Future studies are also warranted to examine the underlining mechanisms and the differential impacts of green space on population subgroups in China.
Author Contributions
J.S. conceived and designed the study and wrote the manuscript. J.C. and M.L. conducted the literature review and constructed the summary tables and figures. Y.G. contributed to manuscript drafting. C.V.C. and R.A. contributed to manuscript revision. All authors have read and agreed to the published version of the manuscript.
Funding
This research was funded by the Fundamental Research Funds for the Central Universities, CUGB, grant number 2-9-2020-036.
Institutional Review Board Statement
Not applicable.
Informed Consent Statement
Not applicable.
Data Availability Statement
Not applicable.
Conflicts of Interest
The authors declare no conflict of interest.
Appendix A
Appendix A is Search Algorithm in PubMed.
((“greenspace”[TIAB] OR “greenspaces”[TIAB] OR “green-space”[TIAB] OR “green space”[TIAB] OR “green spaces”[TIAB] OR “green infrastructure”[TIAB] OR “green infrastructures”[TIAB] OR “green area”[TIAB] OR “green areas”[TIAB] OR “green belt”[TIAB] OR “green belts”[TIAB] OR “green environment”[TIAB] OR “green environments”[TIAB] OR “greening project”[TIAB] OR “green element”[TIAB] OR “green elements”[TIAB] OR “urban green”[TIAB] OR “greenery”[TIAB] OR “greenness”[TIAB] OR “greenbelt”[TIAB] OR “greener”[TIAB] OR “normalized difference vegetation index”[TIAB] OR “NDVI”[TIAB] OR “natural element”[TIAB] OR “natural elements”[TIAB] OR “natural environment”[TIAB] OR “natural environments”[TIAB] OR “natural outdoor environment”[TIAB] OR “natural outdoor environments”[TIAB] OR “natural surroundings”[TIAB] OR “natural space”[TIAB] OR “natural spaces”[TIAB] OR “natural area”[TIAB] OR “natural areas”[TIAB] OR “natural land”[TIAB] OR “open space”[TIAB] OR “open spaces”[TIAB] OR “open land”[TIAB] OR “open area”[TIAB] OR “open areas”[TIAB] OR “walkable area”[TIAB] OR “walkable areas”[TIAB] OR “vegetated area”[TIAB] OR “vegetated areas”[TIAB] OR “public space”[TIAB] OR “public spaces”[TIAB] OR “public area”[TIAB] OR “public areas”[TIAB] OR “public land”[TIAB] OR “wild land”[TIAB] OR “wild area”[TIAB] OR “wild areas”[TIAB] OR “nature”[TIAB] OR “vegetation”[TIAB] OR “park”[TIAB] OR “parks”[TIAB] OR “parkland”[TIAB] OR “garden”[TIAB] OR “gardens”[TIAB] OR “forest”[TIAB] OR “forests”[TIAB] OR “tree”[TIAB] OR “trees”[TIAB] OR “landscape”[TIAB] OR “woodland”[TIAB] OR “woodlands”[TIAB] OR “wilderness”[TIAB] OR “walkability”[TIAB]) AND (“exercise”[MeSH] OR “motor activity”[TIAB] OR “motor activities”[TIAB] OR “sport”[TIAB] OR “sports”[TIAB] OR “physical fitness”[TIAB] OR “physical exertion”[TIAB] OR “physical activity”[TIAB] OR “physical activities”[TIAB] OR “physical inactivity”[TIAB] OR “sedentary behavior”[TIAB] OR “sedentary behaviour”[TIAB] OR “sedentary behaviors”[TIAB] OR “sedentary behaviours”[TIAB] OR “sedentary lifestyle”[TIAB] OR “sedentary lifestyles”[TIAB] OR “inactive lifestyle”[TIAB] OR “inactive lifestyles”[TIAB] OR “exercise”[TIAB] OR “exercises”[TIAB] OR “active living”[TIAB] OR “active lifestyle”[TIAB] OR “active lifestyles”[TIAB] OR “outdoor activity”[TIAB] OR “outdoor activities”[TIAB] OR “walk”[TIAB] OR “walking”[TIAB] OR “running”[TIAB] OR “bike”[TIAB] OR “biking”[TIAB] OR “bicycle”[TIAB] OR “bicycling”[TIAB] OR “cycling”[TIAB] OR “stroll”[TIAB] OR “strolling”[TIAB] OR “active transport”[TIAB] OR “active transportation”[TIAB] OR “active transit”[TIAB] OR “active commuting”[TIAB] OR “travel mode”[TIAB] OR “physically active”[TIAB] OR “physically inactive”[TIAB]) AND (“China”[MeSH] OR “China”[ALL] OR “Chinese”[ALL])AND English[lang] AND “humans”[MeSH]).
References
- Lee, I.M.; Shiroma, E.J.; Lobelo, F.; Puska, P.; Blair, S.N.; Katzmarzyk, P.T. Effect of physical inactivity on major non-communicable diseases worldwide: An analysis of burden of disease and life expectancy. Lancet 2012, 380, 219–229. [Google Scholar] [CrossRef] [Green Version]
- General Administration of Sport of China. 2014 National Fitness Survey. Available online: http://sports.china.com.cn/quanminjianshen/quanminjianshenbaogao/detail1_2015_11/16/472008.html (accessed on 28 July 2021).
- Fan, X.; Cao, Z.B. Physical activity among Chinese school-aged children: National prevalence estimates from the 2016 Physical Activity and Fitness in China-The Youth Study. J. Sport Health Sci. 2017, 6, 388–394. [Google Scholar] [CrossRef] [PubMed]
- World Health Organization. WHO Guidelines on Physical Activity and Sedentary Behaviour. 2020. Available online: https://www.who.int/publications/i/item/9789240015128 (accessed on 25 November 2020).
- Taylor, L.; Hochuli, D.F. Defining greenspace: Multiple uses across multiple disciplines. Landsc. Urban. Plan. 2017, 158, 25–38. [Google Scholar] [CrossRef] [Green Version]
- Mitchell, R.; Popham, F. Effect of exposure to natural environment on health inequalities: An observational population study. Lancet 2008, 372, 1655–1660. [Google Scholar] [CrossRef] [Green Version]
- Donovan, G.H.; Butry, D.T.; Michael, Y.L.; Prestemon, J.P.; Liebhold, A.M.; Gatziolis, D.; Mao, M.Y. The Relationship Between Trees and Human Health: Evidence from the Spread of the Emerald Ash Borer. Am. J. Prev. Med. 2013, 44, 139–145. [Google Scholar] [CrossRef]
- Hunter, R.F.; Christian, H.; Veitch, J.; Astell-Burt, T.; Hipp, J.A.; Schipperijn, J. The impact of interventions to promote physical activity in urban green space: A systematic review and recommendations for future research. Soc. Sci. Med. 2015, 124, 246–256. [Google Scholar] [CrossRef] [Green Version]
- Hunter, R.F.; Cleland, C.; Cleary, A.; Droomers, M.; Wheeler, B.W.; Sinnett, D.; Nieuwenhuijsen, M.J.; Braubach, M. Environmental, health, wellbeing, social and equity effects of urban green space interventions: A meta-narrative evidence synthesis. Environ. Int. 2019, 130, 104923. [Google Scholar] [CrossRef]
- Calogiuri, G.; Elliott, L.R. Why do people exercise in natural environments? Norwegian adults’ motives for nature-, gym-, and sports-based exercise. Int. J. Environ. Res. Public Health 2017, 14, 377. [Google Scholar] [CrossRef] [Green Version]
- Coon, J.T.; Boddy, K.; Stein, K.; Whear, R.; Barton, J.; Depledge, M.H. Does Participating in Physical Activity in Outdoor Natural Environments Have a Greater Effect on Physical and Mental Wellbeing than Physical Activity Indoors? A Systematic Review. Environ. Sci. Technol. 2011, 45, 1761–1772. [Google Scholar] [CrossRef] [PubMed]
- Araújo, D.; Brymer, E.; Brito, H.; Withagen, R.; Davids, K. The empowering variability of affordances of nature: Why do exercisers feel better after performing the same exercise in natural environments than in indoor environments? Psychol. Sport Exerc. 2019, 42, 138–145. [Google Scholar] [CrossRef]
- Jimenez, M.P.; DeVille, N.V.; Elliott, E.G.; Schiff, J.E.; Wilt, G.E.; Hart, J.E.; James, P. Associations between nature exposure and health: A review of the evidence. Int. J. Environ. Res. Public Health 2021, 18, 4790. [Google Scholar] [CrossRef]
- Coombes, E.; Jones, A.P.; Hillsdon, M. The relationship of physical activity and overweight to objectively measured green space accessibility and use. Soc. Sci. Med. 2010, 70, 816–822. [Google Scholar] [CrossRef] [PubMed] [Green Version]
- Hillsdon, M.; Panter, J.; Foster, C.; Jones, A. The relationship between access and quality of urban green space with population physical activity. Public Health 2006, 120, 1127–1132. [Google Scholar] [CrossRef] [PubMed]
- Wang, H.; Dai, X.; Wu, J.; Wu, X.; Nie, X. Influence of urban green open space on residents’ physical activity in China. BMC Public Health 2019, 19, 1093. [Google Scholar] [CrossRef] [PubMed] [Green Version]
- Zhang, W.; Yang, J.; Ma, L.; Huang, C. Factors affecting the use of urban green spaces for physical activities: Views of young urban residents in Beijing. Urban For. Urban Green. 2015, 14, 851–857. [Google Scholar] [CrossRef]
- Richardson, E.A.; Pearce, J.; Mitchell, R.; Kingham, S. Role of physical activity in the relationship between urban green space and health. Public Health 2013, 127, 318–324. [Google Scholar] [CrossRef] [Green Version]
- Kaczynski, A.T.; Stanis, S.A.W.; Hastmann, T.J.; Besenyi, G.M. Variations in Observed Park Physical Activity Intensity Level by Gender, Race, and Age: Individual and Joint Effects. J. Phys. Act. Health 2011, 8, S151–S160. [Google Scholar] [CrossRef] [PubMed]
- Liu, H.; Li, F.; Li, J.; Zhang, Y. The relationships between urban parks, residents’ physical activity, and mental health benefits: A case study from Beijing, China. J. Environ. Manag. 2017, 190, 223–230. [Google Scholar] [CrossRef]
- Witten, K.; Hiscock, R.; Pearce, J.; Blakely, T. Neighbourhood access to open spaces and the physical activity of residents: A national study. Prev. Med. 2008, 47, 299–303. [Google Scholar] [CrossRef]
- Wu, J.; Wang, B.; Ta, N.; Zhou, K.; Chai, Y. Does street greenery always promote active travel? Evidence from Beijing. Urban For. Urban Green. 2020, 56, 126886. [Google Scholar] [CrossRef]
- Wang, Y. Urbanization in China Shifts toward People. China Daily, 29 June 2021. Available online: http://www.chinadaily.com.cn/a/202106/29/WS60da7db1a310efa1bd65e95a.html (accessed on 15 October 2021).
- Kou, J. Forest coverage reached 23.04%. People’s Daily, 23 June 2021. Available online: http://paper.people.com.cn/rmrb/html/2021-06/23/nw.D110000renmrb_20210623_1-07.htm (accessed on 15 October 2021).
- Gu, S.; Xie, M.; Zhang, X. The Pressure of Green Transformation and Development. In Green Transformation and Development; Springer: Singapore, 2019; pp. 55–76. [Google Scholar]
- Moher, D.; Liberati, A.; Tetzlaff, J.; Altman, D.G. Preferred reporting items for systematic reviews and meta-analyses: The PRISMA statement. PLoS Med. 2009, 6, e1000097. [Google Scholar] [CrossRef] [Green Version]
- Quality Assessment Tool for Observational Cohort and Cross-Sectional Studies. Available online: https://www.nhlbi.nih.gov/health-topics/study-quality-assessment-tools (accessed on 28 July 2021).
- Zhang, Y.; Liu Dong, N.; Liu, X. Relationship Between Built Environment, Physical Activity, Adiposity, and Health in Adults Aged 46-80 in Shanghai, China. J. Phys. Act. Health 2015, 12, 569–578. [Google Scholar]
- Chen, Y.; Liu, T.; Xie, X.; Marušić, B. What Attracts People to Visit Community Open Spaces? A Case Study of the Overseas Chinese Town Community in Shenzhen, China. Int. J. Environ. Res. Public Health 2016, 13, 644. [Google Scholar] [CrossRef] [PubMed] [Green Version]
- He, X.; Zhuang, J.; Zhu, Z.; Wang, C.; Chen, P. Study on Children and Youth moderate-to-Vigorous Physical Activity affected by built environment factors. J. Sports Sci. 2017, 38, 101–110+51. [Google Scholar]
- Zhai, Y.; Baran, P.K. Urban park pathway design characteristics and senior walking behavior. Urban For. Urban Green. 2017, 21, 60–73. [Google Scholar] [CrossRef]
- Lu, Y. Using Google Street View to investigate the association between street greenery and physical activity. Landsc. Urban Plan. 2018, 191, 103435. [Google Scholar] [CrossRef]
- Lu, Y. The Association of Urban Greenness and Walking Behavior: Using Google Street View and Deep Learning Techniques to Estimate Residents’ Exposure to Urban Greenness. Int. J. Environ. Res. Public Health 2018, 15, 1576. [Google Scholar] [CrossRef] [PubMed] [Green Version]
- Lu, Y.; Sarkar, C.; Xiao, Y. The effect of street-level greenery on walking behavior: Evidence from Hong Kong. Soc. Sci. Med. 2018, 208, 41–49. [Google Scholar] [CrossRef]
- Zhang, L.; Zhou, S.; Kwan, M.-P.; Chen, F.; Lin, R. Impacts of Individual Daily Greenspace Exposure on Health Based on Individual Activity Space and Structural Equation Modeling. Int. J. Environ. Res. Public Health 2018, 15, 2323. [Google Scholar] [CrossRef] [PubMed] [Green Version]
- Zhang, S.; Zhou, W. Recreational visits to urban parks and factors affecting park visits: Evidence from geotagged social media data. Landsc. Urban Plan. 2018, 180, 27–35. [Google Scholar] [CrossRef]
- Dai, Y.; Zhu, Z.; Zhou, S. The Effects of Green Space on Leisure Time Physical Activities from the Perspective of Community Differentiation: A Case Study of Guangzhou, China. Trop. Geogr. 2019, 39, 237–246. [Google Scholar]
- Gao, T.; Song, R.; Zhu, L.; Qiu, L. What Characteristics of Urban Green Spaces and Recreational Activities Do Self-Reported Stressed Individuals Like? A Case Study of Baoji, China. Int. J. Environ. Res. Public Health 2019, 16, 1348. [Google Scholar] [CrossRef] [PubMed] [Green Version]
- Lu, Y.; Yang, Y.; Sun, G.; Gou, Z. Associations between overhead-view and eye-level urban greenness and cycling behaviors. Cities 2019, 88, 10–18. [Google Scholar] [CrossRef]
- Sun, P.; Lu, W. The Correlation between Urban Green Space and Residents’ Physical Activity and Health Outcome: A Case Study of Dalian. South. Archit. 2019, 191, 34–39. [Google Scholar]
- Yang, Y.; He, D.; Gou, Z.; Wang, R.; Liu, Y.; Lu, Y. Association between street greenery and walking behavior in older adults in Hong Kong. Sustain. Cities Soc. 2019, 51, 101747. [Google Scholar] [CrossRef]
- Yuen, J.W.M.; Chang, K.K.P.; Wong, F.K.Y.; Wong, F.Y.; Siu, J.Y.M.; Ho, H.C.; Wong, M.S.; Ho, J.Y.S.; Chan, K.L.; Yang, L. Influence of Urban Green Space and Facility Accessibility on Exercise and Healthy Diet in Hong Kong. Int. J. Environ. Res. Public Health 2019, 16, 1514. [Google Scholar] [CrossRef] [PubMed] [Green Version]
- Zhai, B.; Zhu, W. The Influence of Built Environment on Outdoor Activities and Health Self-assessment of Parents and Children, Shanghai. Planners 2019, 35, 23–29. [Google Scholar]
- Zhang, H.; Zhu, Z.; Zou, D. Influences of greenway on the physical activities of users with different proximity degrees: A study on waterfront greenway in Guangzhou City. City Plan. Rev. 2019, 43, 75–80. [Google Scholar]
- Zhang, R.; Duan, Y.; Brehm, W.; Wagner, P. Socioecological Correlates of Park-based Physical Activity in Older Adults: A Comparison of Hong Kong and Leipzig Parks. Int. J. Environ. Res. Public Health 2019, 16, 3048. [Google Scholar] [CrossRef] [PubMed] [Green Version]
- Chen, Y.; Chen, Y.; Tu, W.; Zeng, X. Is eye-level greening associated with the use of dockless shared bicycles? Urban For. Urban. Green 2020, 51, 126690. [Google Scholar] [CrossRef]
- Fu, X.; Liu, S.; Wen, Q. Influence of urban park green space quality on physical activity of teenagers: Taking Harbin as an example. Sci. Technol. Eng. 2020, 20, 13129–13136. [Google Scholar]
- He, H.; Lin, X.; Yang, Y.; Lu, Y. Association of street greenery and physical activity in older adults: A novel study using pedestrian-centered photographs. Urban For. Urban Green. 2020, 55, 126789. [Google Scholar] [CrossRef]
- Jiang, Y.; Zhen, F.; Sun, H.; Wang, W. Research on the influence of urban built environment on daily walking of older adults from a perspective of health. Geogr. Res. 2020, 39, 570–584. [Google Scholar]
- Leng, H.; Li, S.; Yan, S.; An, X. Exploring the Relationship between Green Space in a Neighbourhood and Cardiovascular Health in the Winter City of China: A Study Using a Health Survey for Harbin. Int. J. Environ. Res. Public Health 2020, 17, 513. [Google Scholar] [CrossRef] [Green Version]
- Tu, X.; Huang, G.; Wu, J.; Guo, X. How do travel distance and park size influence urban park visits? Urban For. Urban Green. 2020, 52, 126689. [Google Scholar] [CrossRef]
- Wagner, P.; Duan, Y.P.; Zhang, R.; Wulff, H.; Brehm, W. Association of psychosocial and perceived environmental factors with park-based physical activity among elderly in two cities in China and Germany. BMC Public Health 2020, 20, 55. [Google Scholar] [CrossRef] [Green Version]
- Wang, R.; Lu, Y.; Wu, X.; Liu, Y.; Yao, Y. Relationship between eye-level greenness and cycling frequency around metro stations in Shenzhen, China: A big data approach. Sustain. Cities Soc. 2020, 59, 102201. [Google Scholar] [CrossRef]
- Wang, X.; Yang, D. How the Built Environment Affect the Frequency of Green Space Used by the Elderly—Based on the Dual Perspective of Accessibility and Attractiveness. Chin. Landsc. Archit. 2020, 36, 62–66. [Google Scholar]
- Wang, X.; Wu, C. An Observational Study of Park Attributes and Physical Activity in Neighborhood Parks of Shanghai, China. Int. J. Environ. Res. Public Health 2020, 17, 2080. [Google Scholar] [CrossRef] [PubMed] [Green Version]
- Yang, Y.; Lu, Y.; Yang, L.; Gou, Z.; Zhang, X. Urban greenery, active school transport, and body weight among Hong Kong children. Travel Behav. Soc. 2020, 20, 104–113. [Google Scholar] [CrossRef]
- Zang, P.; Liu, X.; Zhao, Y.; Guo, H.; Lu, Y.; Xue, C.Q.L. Eye-Level Street Greenery and Walking Behaviors of Older Adults. Int. J. Environ. Res. Public Health 2020, 17, 6130. [Google Scholar] [CrossRef] [PubMed]
- Zhai, Y.; Li, D.; Wang, D.; Shi, C. Seniors’ Physical Activity in Neighborhood Parks and Park Design Characteristics. Front. Public Health 2020, 8, 322. [Google Scholar] [CrossRef]
- Zhou, Y.; Yuan, Y.; Chen, Y.; Lai, S. Association Pathways Between Neighborhood Greenspaces and the Physical and Mental Health of Older Adults—A Cross-Sectional Study in Guangzhou, China. Front. Public Health 2020, 8, 551453. [Google Scholar] [CrossRef] [PubMed]
- Dong, B.; Mao, L. The relationship between school natural environment, interpersonal environment and adolescents’ physical exercise. J. Phys. Educ. 2021, 28, 111–117. [Google Scholar]
- Gao, F.; Li, S.; Tan, Z.; Zhang, X.; Lai, Z.; Tan, Z. How Is Urban Greenness Spatially Associated with Dockless Bike Sharing Usage on Weekdays, Weekends, and Holidays? ISPRS Int. J. Geo-Inf. 2021, 10, 238. [Google Scholar] [CrossRef]
- Wang, M.; Qiu, M.; Chen, M.; Zhang, Y.; Zhang, S.; Wang, L. How does urban green space feature influence physical activity diversity in high-density built environment? An on-site observational study. Urban For. Urban Green. 2021, 62, 127129. [Google Scholar] [CrossRef]
- Yang, Y.; Lu, Y.; Yang, H.; Yang, L.; Gou, Z. Impact of the quality and quantity of eye-level greenery on park usage. Urban For. Urban Green. 2021, 60, 127061. [Google Scholar] [CrossRef]
- Yang, Y.; Lu, Y.; Yang, L.; Gou, Z.; Liu, Y. Urban greenery cushions the decrease in leisure-time physical activity during the COVID-19 pandemic: A natural experimental study. Urban For. Urban Green. 2021, 62, 127136. [Google Scholar] [CrossRef]
- Krenn, P.J.; Oja, P.; Titze, S. Route choices of transport bicyclists: A comparison of actually used and shortest routes. Int. J. Behav. Nutr. Phys. Act. 2014, 11, 31. [Google Scholar] [CrossRef] [PubMed] [Green Version]
- Nawrath, M.; Kowarik, I.; Fischer, L.K. The influence of green streets on cycling behavior in European cities. Landsc. Urban Plan. 2019, 190, 103598. [Google Scholar] [CrossRef]
- Tsai, W.-L.; Yngve, L.; Zhou, Y.; Beyer, K.M.M.; Bersch, A.; Malecki, K.M.; Jackson, L.E. Street-level neighborhood greenery linked to active transportation: A case study in Milwaukee and Green Bay, WI, USA. Landsc. Urban Plan. 2019, 191, 103619. [Google Scholar] [CrossRef]
- Sugiyama, T.; Giles-Corti, B.; Summers, J.; du Toit, L.; Leslie, E.; Owen, N. Initiating and maintaining recreational walking: A longitudinal study on the influence of neighborhood green space. Prev. Med. 2013, 57, 178–182. [Google Scholar] [CrossRef]
- Giles-Corti, B.; Broomhall, M.H.; Knuiman, M.; Collins, C.; Douglas, K.; Ng, K.; Lange, A.; Donovan, R.J. Increasing walking: How important is distance to, attractiveness, and size of public open space? Am. J. Prev. Med. 2005, 28, 169–176. [Google Scholar] [CrossRef] [PubMed]
- Frank, L.; Kerr, J.; Chapman, J.; Sallis, J. Urban Form Relationships with Walk Trip Frequency and Distance among Youth. Am. J. Health Promot. 2007, 21, 305–311. [Google Scholar] [CrossRef]
- Veitch, J.; Salmon, J.; Parker, K.; Bangay, S.; Deforche, B.; Timperio, A. Adolescents’ ratings of features of parks that encourage park visitation and physical activity. Int. J. Behav. Nutr. Phys. Act. 2016, 13, 73. [Google Scholar] [CrossRef] [PubMed] [Green Version]
- Veitch, J.; Salmon, J.; Ball, K. Children’s Perceptions of the Use of Public Open Spaces for Active Free-play. Child. Geogr. 2007, 5, 409–422. [Google Scholar] [CrossRef] [Green Version]
- Van Hecke, L.; Ghekiere, A.; Van Cauwenberg, J.; Veitch, J.; De Bourdeaudhuij, I.; Van Dyck, D.; Clarys, P.; Van De Weghe, N.; Deforche, B. Park characteristics preferred for adolescent park visitation and physical activity: A choice-based conjoint analysis using manipulated photographs. Landsc. Urban Plan. 2018, 178, 144–155. [Google Scholar] [CrossRef]
- Bauman, A.E.; Reis, R.S.; Sallis, J.F.; Wells, J.C.; Loos, R.J.; Martin, B.W. Correlates of physical activity: Why are some people physically active and others not? Lancet 2012, 380, 258–271. [Google Scholar] [CrossRef]
- Shanahan, D.F.; Franco, L.; Lin, B.B.; Gaston, K.J.; Fuller, R.A. The Benefits of Natural Environments for Physical Activity. Sports Med. 2016, 46, 989–995. [Google Scholar] [CrossRef] [PubMed] [Green Version]
- Lynch, M.; Ezeofor, V.; Spencer, L.H.; Tudor Edwards, R. Economic and modelling techniques used to value the health benefits of engaging in physical activity in green and blue spaces: A systematic review. Lancet 2018, 392, S55. [Google Scholar] [CrossRef]
- Wolch, J.R.; Byrne, J.; Newell, J.P. Urban green space, public health, and environmental justice: The challenge of making cities ‘just green enough’. Landsc. Urban Plan. 2014, 125, 234–244. [Google Scholar] [CrossRef] [Green Version]
- Spencer, L.H.; Lynch, M.; Lawrence, C.L.; Edwards, R.T. A Scoping Review of How Income Affects Accessing Local Green Space to Engage in Outdoor Physical Activity to Improve Well-Being: Implications for Post-COVID-19. Int. J. Environ. Res. Public Health 2020, 17, 9313. [Google Scholar] [CrossRef] [PubMed]
- The People’s Government of Beijing Municipal; Beijing Municipal Committee of the CPC. Outline of “Healthy Beijing 2030” Plan. 2017. Available online: http://www.beijing.gov.cn/zhengce/zhengcefagui/201905/t20190522_60543.html (accessed on 28 July 2021).
- Adams, S.A.; Matthews, C.E.; Ebbeling, C.B.; Moore, C.G.; Cunningham, J.E.; Fulton, J.; Hebert, J.R. The effect of social desirability and social approval on self-reports of physical activity. Am. J. Epidemiol. 2005, 161, 389–398. [Google Scholar] [CrossRef] [PubMed]
- Browning, M.H.E.M.; Rigolon, A.; McAnirlin, O.; Yoon, H. Where greenspace matters most: A systematic review of urbanicity, greenspace, and physical health. Landsc. Urban Plan. 2022, 217, 104233. [Google Scholar] [CrossRef]
Publisher’s Note: MDPI stays neutral with regard to jurisdictional claims in published maps and institutional affiliations. |
© 2021 by the authors. Licensee MDPI, Basel, Switzerland. This article is an open access article distributed under the terms and conditions of the Creative Commons Attribution (CC BY) license (https://creativecommons.org/licenses/by/4.0/).