Abstract
The objective of this paper is to understand the interactions and functioning of the transportation of people and goods in the urban environment, and to propose an evaluation model in terms of sustainability and integrated transportation. Firstly, an in-depth literature review allowed us to understand the interactions and functioning of transport of people and goods in the urban environment, verifying the main initiatives to promote sustainability. The model was developed through a multi-criteria decision analysis methodology consisting of the application of Analytic Hierarchy Process (AHP) in a system specially developed for remote evaluation of the hierarchical model. The index was then applied to São Paulo, where two distinct periods were considered, and the results provided an assessment of the evolution of the city regarding the sustainability and integration of the passenger and freight systems. The conclusions indicate improve in the sustainability of the urban transport and logistics in the city, highlighting the importance of incentives to the use of active modes of transport and the communication channel with population.
1. Introduction
The United Nations Conference on Sustainable Development, also known as Rio + 20, highlighted sustainable transport as the most important topic in sustainable development, which has led many countries to take concrete actions towards the matter [1]. One of the major barriers to achieving sustainable transport in cities is still the preference for cars [2,3,4]. The fostering of eco-friendly means of transport, such as walking, cycling, and public transport, can be an effective way of developing more sustainable mobility systems [5].
The intention to achieve sustainable development has been responsible for changes in the understanding and planning of the urban environment. Among the actions discussed by the government, the academic community, and the population, the following ones stand out: (i) a concern regarding the disorderly growth of cities, added to unfinished works which waste resources, and the failure in meeting the population’s needs [6,7]; (ii) environmental degradation caused by pollution, noise, and scarcity of green areas and open spaces [8,9,10]; (iii) social inequality evidenced by the disparity in access to opportunities, and also urban spatial segregation [3,11,12]; and (iv) urban mobility issues, which hinder both passenger and freight transport [5,13,14,15].
The current transport planning approach recognizes that collaboration between disciplines and political sectors, the engagement of actors, and public acceptance are key factors for progress, requiring the planning process to become an oriented activity towards communication, forcing the adoption of techniques for conflict mediation and the communication with non-specialists [16]. Due to the complexity of decisions in the development of transport systems, since there are several criteria to be considered and a viable final decision to be made, multi-criteria decision-making (MCDM) is often used [17].
Problems related to the conditions of urban mobility are magnified by the inefficiency of the integration between urban and transport planning [18]. It is necessary to consider freight and passenger urban transport systems in a more holistic way, that is, as a single urban mobility system [19]. The idea is to combine freight and passenger flows with urban network resources (infrastructures, vehicles, etc.) to optimize the global urban mobility system’s efficiency.
Integrated planning directly impacts the quality of life of the population, through the reduction of pollutant emissions, improving human health and the health of ecosystems and agriculture, and also mitigating climate change [20,21]. It is needed to promote transport infrastructure and the development of services to, support economic growth and social equity. However, there are no integrated management models representing this complex system in the literature yet, when considering the simultaneous sharing of infrastructure, to be used in urban mobility planning, including freight and passenger flows [22].
In this context, the objective of this paper is to understand the interactions and functioning of the transportation of people and goods in the urban environment, as well as to propose an evaluation model in terms of sustainability and integrated transportation that allows monitoring of initiatives that promote sustainable mobility. Thus, the follow up of these actions from both government and private initiative makes possible the suggestion in what initiatives, or public policies, and investments would be more effective.
The following sections approach the methods used, as well as the literature needed to understand the paper and the process of building the proposal model, finishing with the application of the model in the city of São Paulo, Brazil.
2. Materials and Methods
The research was carried out according to the flowchart, illustrated in Figure 1, and was divided into two stages: Model Structuring and Model Application. For the first stage, a Bibliographic Research was carried out, where the theoretical framework was selected for understanding the problem addressed with the survey of sustainability indicators for transport and urban logistics.
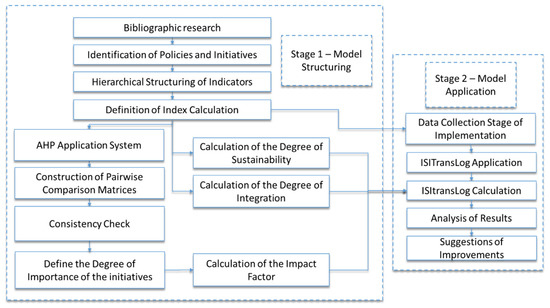
Figure 1.
Flowchart of the research steps. Source: own elaboration.
At this stage, it was found that the indicators used in the published works were the basis for developing initiatives as concrete actions for sustainable development. These initiatives convene indicators through a common objective, unifying the environmental, economic, and social dimensions. For this reason, the proposed hierarchical model is based on public and private policies and initiatives to assess the city’s sustainability in terms of integrated urban transport and logistics. Thus, the selection of indicators was made through the Identification of Policies and Initiatives, to fully assess measures that promote the sustainable development of urban transport and logistics.
A transport model is a tool that provides qualitative and quantitative outcomes about the impacts resulting from the possible solutions formulated at the planning level [23]. Multi-criteria decision analysis methodologies have been widely used in mobility projects [24,25,26] and are among the most popular approaches to decision support is the Analytic Hierarchy Process (AHP) [27]. The AHP is suitable for decision-making problems that need to consider several criteria and LSO stakeholder groups since it can approach typical problems of complex scenarios [28]. Among the possible multi-criteria methods, such as PROMETHEE [29] and ELECTRE [30], AHP has the advantage of providing evaluators with a clear hierarchical decision structure, enabling participants who are not experts in the method to clearly understand the problem. Furthermore, the internal consistency check is particularly useful when involving evaluators who are not familiar with the multi-criteria method [31,32,33,34].
The AHP method is based on three principles of logical analysis: (a) Hierarchical construction, based on the human reasoning process, which structures the problem in hierarchical levels, identifying the key elements for decision-making. These elements are then grouped into related sets and allocated to specific layers; (b) priority setting, based on the human ability to relate objects through observation, adjusts the priorities in the AHP, comparing pairs from the perspective of a particular focus or criterion (pairwise comparison); and (c) logical consistency, which is a method to evaluate the built prioritization model regarding its consistency [35]. AHP is not a statistical technique, but a dynamic analysis that reflects the stakeholders’ perception of the issues, based on a dynamic survey using a specially designed questionnaire [36].
In 2014, 54% of the world’s population lived in urban areas, i.e., approximately 3.9 billion people; this proportion is expected to increase to 6 billion by 2050 [37,38]. Such a scenario requires increasingly complex and challenging transport systems, still lacking viable solutions for sustainable development. Public authorities and business people need to understand the innovations and challenges to be faced and pay more attention to the human and social implications of their initiatives [39].
The “Five Transformations” concept [40] indicates a way to definitively achieve sustainable transport, through the enumeration of transformations needed to promote sustainability in transport: city, economy, vehicle technology, modal division (i.e., the percentage distribution of daily average displacements by type of transport), and lifestyle. The intention is to educate the new generation so that, in the future, everyone has a more sustainable lifestyle. This scenario shows how sustainable development in transport and urban logistics has gained prominence in city planning and how the integration of passenger and freight systems, together with the engagement of the whole society, is crucial to achieving this goal.
The world is facing a situation of overcrowded cities, and this is only getting more accentuated with time. One of the main activities that is currently aggravating this situation is the transportation sector, which does not contribute to the social and environmental sustainability of cities. In an attempt to reverse this problem, several countries around the world have started to implement new policies and technological innovations in urban mobility systems [2,39,41,42].
Rethinking urban mobility involves improving the use of all means of transport and the integration between different public and individual modes [43]. It also affects the achievement of common goals regarding economic prosperity and transport management as a guarantee of mobility, quality of life, and environmental protection. It must also conciliate the interests of freight and passenger transport, regardless of the used means of transport [44]. Thus, to be considered as effective, urban mobility policies need to adopt an approach as integrated as possible, adjusting the most suited responses to each individual problem: technological innovation, development of clean, safe, and intelligent transport systems, economic incentives, and changes on the regulatory systems [43].
Changing people’s behavior is fundamental for having a truly effective sustainable urban transport system implementation, comprising the transport of both people and goods. Some key strategies to be considered to achieve this goal are as follows: (1) encouraging sustainable modes of transport by maintaining the road conditions, such as sidewalks and speed restrictions; (2) pedestrian-only zones in high pedestrian activity areas; (3) exclusive lanes for buses and bicycles with proper protection from motorized traffic; (4) fair parking fees; (5) more attention to the maintenance of road infrastructure rather than building new infrastructure; and (6) educational and awareness campaigns [7].
3. Results and Discussion
3.1. Model Structuring
Sustainability is a very broad concept, and, when related to transport, it is usually expressed in three dimensions: environmental, economic, and social. Such dimensions cannot be evaluated separately, as they are interdependent. Sustainability ideas and concepts need to have operational forms in order to influence and take place on the regulation of transport systems, and indicators are often evoked as important elements in this regard [45]. Indicators are important resources for goal setting, performance assessment, monitoring, management, and decision-making [46].
Sdoukopoulos et al. [47] carried out a study where sustainable transport indicators have the environmental pillar as the most important in relation to society, especially when compared to the economy, followed by mobility, accessibility, and safety. Quantifying the sustainability of urban transport is important, as evidenced by a growing number of studies to measure sustainability in transport [42]. However, the assessment of sustainability is associated with three challenges: environmental, mobility, and efficiency, and it is practically impossible to dissociate them [48].
One of the problems when measuring sustainability with indicators is the fact that, in general, they only reflect elements from one of the sustainability dimensions, whether economic, social, or environmental [48]. Thus, the indicators found in the literature are not the best metrics to carry out an integrated analysis between transport and urban logistics, because they measure sustainability dimensions singly. Hence, this work proposes a hierarchical model that works with initiatives and public policies for the sustainable and integrated development of urban transport and logistics as indicators.
3.1.1. Definition of Actions and Initiatives of Urban Transport and Logistics
The initiatives used in the model, selected through the literature review, are described by policy category in Table 1, Table 2 and Table 3, as well as the measures to be taken to implement each of the initiatives. Table 1 presents the initiatives to encourage the use of public transport, involving actions to improve infrastructure, tax incentives, physical accessibility, and new incentives for urban public transport. The initiatives related to the encouragement of active modes of transport are presented with a focus, mainly, on the displacement of pedestrians and cyclists, with emphasis also on public safety as an incentive to these modes of transport.

Table 1.
Initiatives to incentives to the use of Urban Public Transport (UPT) and to incentives to the use of active modes of transport. Source: own elaboration.
Table 2.
Initiatives for land use restriction policies and sharing in logistics and transport. Source: own elaboration.
Table 3.
Clean transportation initiatives and environmental education. Source: own elaboration.
Table 2 portrays the actions of policies for land use restriction and Sharing in Logistics and Transport. The creation of environmental zones with restrictions on the flow of both freight and passenger vehicles, according to their size, fuel, and occupation, stands out. Restrictions also include actions to charge parking and create exclusive spaces for loading and unloading goods. The sharing initiatives in logistics and transport have new proposals for last-mile delivery services, such as Crowdshipping, collection and delivery stations, and clean vehicles, also including actions to reduce the circulation of freight vehicles in urban centers, through distribution centers, transport of goods in UPT, and underground logistics.
The initiatives for clean transport and environmental education are shown in Table 3. The analysis of the articles listed in the literature review suggests the need to raise awareness among the population about transport and sustainable development, in order to incorporate new technologies correctly and widely in daily urban transport.
Breaking habits is the most critical point in sustainable development; therefore, including environmental education for children is fundamental for long-term success. Table 3 also shows the initiatives for direct and open communication between the government, the population, and the private sector, as well as the promotion of clean fuels through tax incentives in addition to adequate infrastructure and preventive road maintenance.
Once the indicators were selected, the Hierarchical Structure of the policies and initiatives was elaborated following the AHP approach. So, the Hierarchical Structure of the policies and initiatives was elaborated. All interviews had to be carried out remotely, so an AHP Application System was developed for the online assessment of transport experts at the hierarchical structure built, in order to facilitate the comparison of initiatives. The system consists of the Construction of Pairwise Comparison Matrices for each group of public policies and their respective initiatives. After the judgment of each matrix, the system performs its Consistency Check, automatically calculating the consistency index. With the confirmation of judgment consistency, a new matrix is made available for evaluation, and so on, successively, until the last matrix of the hierarchical structure. The next step is to define the Degree of Importance of each initiative and policy, which generates the weighting of the indicators.
The result of the hierarchical structuring of the indicators is shown in Figure 2, through the Index of Sustainability and Integration of Transport and Urban Logistics (ISITransLog). Public policies were classified as: encouraging the use of the UPT; Encouraging the use of active modes of transport; restriction of land use; sharing of transport and logistics and; and clean transport and environmental awareness. These policies were then divided into initiatives, as detailed in Table 1, Table 2 and Table 3.
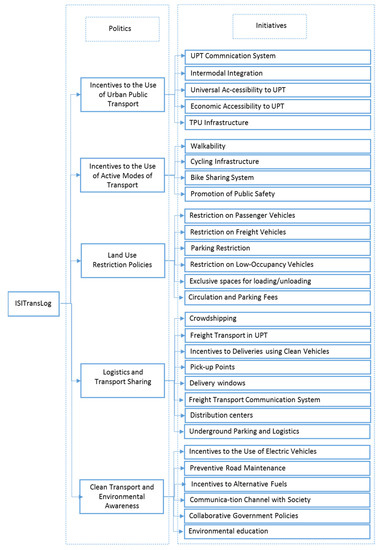
Figure 2.
Hierarchical structure of the model. Source: own elaboration.
3.1.2. Online System for Applying AHP Matrices
The system developed to apply the online AHP method was based on the PHP (Hypertext Preprocessor) programming language in association with the MySQL (Structured Query Language) database so that the evaluators could compare the initiatives in pairs regarding their importance. The system has a home screen where instructions are given the opportunity to register the email or login into the system. Once logged into the system, the evaluator is presented to the hierarchy of the model to be evaluated and also receives a link for the evaluation of each matrix of the model. As the evaluator’s e-mail is registered to each evaluated matrix, this process can be carried out as many times as he deems necessary, choosing the order in which the matrices will be evaluated. A total of 14 specialists, with training and experience in the areas of logistics and transport, participated in the evaluation of the AHP hierarchical model, filling up all matrices.
One of the model’s evaluation screens is shown in Figure 3. In the presented case, the evaluation of the group of public policies is carried out, in the second level of the hierarchy. In order to guide the assessment, there is a column on the right containing the definition of each item assessed on the current screen. The comparison of policies is made line by line, on a scale that follows the values proposed by Saaty and Vargas [49], but which is expressed by values between 1 (equally important) and 5 (extremely more important), to facilitate the evaluator’s visualization.
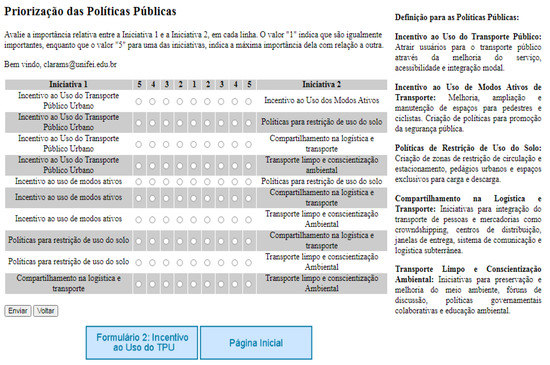
Figure 3.
Model’s evaluation screen. Source: own elaboration.
When completing all the lines of the assessment, the expert must click on the Submit button. At this moment, the system calculates the consistency of the evaluated matrix and, in a notification window, exhibits the outcome: “consistent judgments”, when the index is less than 0.1; or “review your judgments”, along with the inconsistent evaluation matrix, otherwise.
3.1.3. Results of the Experts’ Judgments
The evaluation of the initiatives regarding Incentives to the use of urban public transport and Sharing in logistics and transport obtained 92.85% of consistent results. The Incentive to Active Modes of Transport, Land Use Restrictions, and Clean Transport and Environmental Awareness matrices obtained a consistent response rate of 86.71%. The worst result was for the Public Policies evaluation matrix, with 78.57% of consistent answers.
There was a latent concern about the results of these assessments, especially of the Sharing in logistics and transport matrix, as it is a set of 8 initiatives, making it more complex to assess. However, its high consistency rate reveals that the mode of presentation developed in the previously mentioned system helped the evaluators to see the importance of these initiatives more clearly. The way the initiative comparisons were presented was based on the paid software Expert Choice. Overall, the quality of the responses obtained ensures a good weighting of the initiatives because reaching a satisfactory level of consistency is seen as a desirable property for the model. The more consistent the decision-maker’s preferences are, the more likely he is to be a reliable expert, to have deep insights into the problem, and to carefully and meticulously act on the problem he is facing [50].
Table 4 presents the final result of the weighting of public initiatives and policies evaluated by the specialists. Among the Public Policy groups, encouraging the use of the UPT reached 31% of the total relevance, following the trend highlighted in the literature review articles, for encouraging the use of public transport is a strategy that promotes sustainable consumption practices [51]. User behavior is the most significant parameter in encouraging the use of the UPT due to the lack of a reliable public transport network and its comfort level. Therefore, there is a clear need to develop transport policies that encourage people to use the public transport system [2].
Table 4.
Weighting of initiatives.
Among the initiatives corresponding to the highest importance factors are Economic Accessibility in the UPT (9.4%), Universal Accessibility to the UPT (9%), and Promotion of public safety (8.6%), which corroborates the study of Sdoukopoulos [47], where mobility, accessibility, and safety are identified as the most significant topics included in a wide range of initiatives. From an economic point of view, accessibility is considered an important competitiveness factor that can explain a higher economic growth [52]. Likewise, the introduction of accessibility metrics in public transport planning allows the development of new evidence and arguments for the redistribution of means of transport that can reduce the environmental and spatial pressure of urban road transport [53,54].
Of the better-ranked initiatives, the first two are part of the Incentive policies to the use of the UPT group, and the third one is part of the Incentives to the use of active modes of transport group, which is the second most important group according to the assessment of experts. Hiking and cycling are being promoted as sustainable alternatives to motor vehicles. The increase in the use of these sustainable means of transport reduces the number of vehicles flowing in the city, thus reducing traffic congestion, pollutant emissions, and health problems associated with such emissions [55]. Active modes of transport work more efficiently when there is a strong collaboration across all modes. Thus, providing convenient connections and access to the physical infrastructure of active modes plays a crucial role in encouraging the use of an efficient sustainable transport system [56].
According to the evaluators, the group of policies that least impacts sustainability in urban centers is restrictions on land use (10.8%). In addition, this group contains the initiative evaluated with the lowest score: circulation and parking rates, whose importance factor is 1.1%. This assessment is justified by the indirect relationship of land use restriction initiatives with sustainable transport, for they are actions implemented as a way to discourage the use of private vehicles and the flow of freight vehicles in urban centers. Hence, methods for discouraging the use of private vehicles can be implemented, such as: restricting parking spaces and increasing driving costs through increasing the prices of fuel, car registration fees, and driving licenses, for example [57].
In addition, in Figure 1, for the Definition of the Index Calculation, the results of the aforementioned Degree of Importance of the Initiatives are used, as well as the Calculation of the Degree of Sustainability and the Calculation of the Degree of Integration of each initiative, completing Step 1 of the study.
3.1.4. Calculation of the Sustainability and Integration in Transportation and Logistics Urban Index (ISITransLog)
To calculate the ISITransLog, firstly, each initiative must be categorized as to its Stage of Implementation. Implementation stages can be classified into non-existent, project, planning, implementation, or running, each with a predefined score. The second stage of the evaluation is given by the Impact Factor of the initiative, by the Degree of Importance of the initiatives, as explained above. The third partial assessment of the index refers to the Degree of Sustainability, which is calculated based on the percentage of the sustainability objectives directly achieved by the initiative. The objectives were collected during the literature review and were evaluated by experts in the same weighting system as the initiatives, at a later stage of the process, where twelve responses were obtained. The objectives and their description are detailed in Table 5.
Table 5.
Description of the purposes for the initiatives.
Finally, the integration degree of the initiatives evaluates the overlap between freight and passenger systems, both in their infrastructure and in their policies. In regard to its degree of integration, an initiative can be classified into exclusive, priority, mixed, or total. The categorization of initiatives as to their results is detailed in Table 6. Such partial results are then linearly combined, generating the score for each initiative.
Table 6.
Categorization of initiatives by importance factor, purpose and integration.
After obtaining all the partial weights of the initiatives, that is, the Impact Factor, Degree of Sustainability and Degree of Integration scores, in the model structuring phase, the final index for the city is given by the sum of the score of each model initiative. Unlike the rest of partial weights, the Stage of Implementation is not calculated. The Stage of Implementation of each initiative is given by data collection in the city where the index will be applied. Equation (1) presents the calculation of an initiative’s score Ini, where S is the value obtained from the Stage of Implementation of the initiative, If is the Impact Factor, Ds is the Degree of Sustainability, and Di is the Degree of Integration. Equation (2) shows the final calculation of ISITransLog, given by the sum of the individual values of the initiatives.
Ini = S ∗ (If + Ds + Di),
ISI TransLog = ∑n=129 Ini.
The second stage of the research consists of the Application of the Model, wherein the first task to be performed is Data Collection. Originally, data would be collected from both direct (City Hall, Administrative Offices, traffic and transport management bodies, etc.) and indirect sources (official websites of the City Hall and Administrative Offices, data and studies published by educational and research institutions, etc.). However, due to the COVID-19 pandemic, some adjustments were needed to obtain the data for the ISITransLog calculation. Thus, interviews and visits to institutions were canceled, and all information was obtained through the official city hall’s digital communication channels. Then, the collected data are used in the ISITransLog Application, that is, for the calculation of each initiative’s results. With the partial results in hand, the ISITransLog is calculated for the selected city, so that the Analysis of Results can be performed. According to the results obtained, some suggestions of Improvements are made for the city to execute.
3.2. Model Application in São Paulo-SP, Brazil
ISITransLog was structured so that it contains the most widespread world initiatives, according to the literature, emphasizing the sustainability of transport systems. Thus, when inserted into the Brazilian reality, it was found that only large cities (with populations larger than 500 thousand) would have access to information on mobility studies and actions carried out with emphasis on sustainability. Therefore, the efficiency of the index is greater for large cities, even though they correspond to only 8.5% of Brazilian municipalities [58].
São Paulo was selected for being the largest Brazilian city, with 12.2 million inhabitants and a demographic density of 8054.7 inhabitants/km2 [58], besides having a good range of online information available.
Trips by motorized modes amount to 28.280 million daily trips in the city, compared to 13.727 million daily trips by non-motorized modes. The latter is subdivided into 13,350 million trips on foot and 377 thousand trips by bicycle [59]. The time interval between changes in traffic lights in the city of São Paulo is not enough for 97.8% of the elderly to cross the street [60]. Of the admissions at the IOT-HCFMUSP (Institute of Orthopedics and Traumatology, Hospital das Clínicas, University of São Paulo), one out of five admissions due to falls took place on sidewalks. The social costs generated by falls on sidewalks in São Paulo reach R$2.9 billion a year, while the renovation of all sidewalks in the city would cost R$7 billion [60]. These data indicate the need for improvements in transport and logistics in the city as a whole. This scenario suggests that São Paulo is a suitable object of study for the application of ISITransLog.
Table 7 shows the application of ISITransLog to São Paulo, based on public initiatives and policies in force in 2010 and 2020. The final result of ISITransLog for the application in 2010 was 17.718, which corresponds to 56% of the higher score. Twenty-nine initiatives were evaluated, among which 10 were non-existent at the time of the reference year, 6 were in the design phase, 3 were being implemented, and 10 were under execution. None of them were at the planning stage. Among the initiatives that were already underway in 2010, it is worth highlighting the Multimodal Integration and Economic Accessibility in the UPT, part of the Incentives to the use of the UPT group, whose first projects were conceived in the 1970s and have had their population reach increased since then.
Table 7.
Application of ISITransLog to São Paulo.
In the group of public policies for the Incentive to active modes of transport, only the Walkability initiative was underway in 2010, which began with the refurbishment of the sidewalks on Avenida Paulista in 2007, with the implementation of a concrete pavement molded with brass expansion joints in situ [61].
The application of ISITransLog to São Paulo in 2020 reveals a notable improvement in the initiatives underway for the sustainability and integration of transport and urban logistics in the period. As shown in Table 7, only two initiatives still receive the value of non-existent in their implementation stage: Crowdshipping and freight in UPT. As a consequence, São Paulo reached a total of 89% of the maximum score for ISITransLog in 2020.
All initiatives from the Incentives to the Use of UPT group were running in 2020. To leverage communication systems in UPT initiatives, São Paulo presented, in 2019, 15 electric buses that will be available at the “6030/10 Unisa-Campus1/Terminal Santo Amaro” line. The vehicles will already be equipped with NFC (Near Field Communication) technology, allowing fare payment by debit or credit cards, through digital payment platforms on smartphones or smartwatches [62]. To increase multimodal integration, in 2018, the city hall regulated the sharing of bicycles in the city, opening the possibility for companies to act as shared bicycle operators upon registration at the Municipal Committee for Road Use (CMUV) [63]. In addition, they created 26,300 spaces in 40 parking lots adjacent to the rail system to encourage the integration of the individual and the collective transport [64].
As established in the National Urban Mobility Policy (PNMU), the prioritization of active modes (non-motorized) and public transport was considered the guiding principle of PlanMob/SP 2015 in São Paulo [65]. Encouraging the use of active and collective modes of transport to the detriment of individual motorized transport must involve the adoption of policies that make this transformation feasible. This finding is in line with the most relevant initiative in the sustainability of transport and urban logistics according to ISITransLog: Walkability. This initiative is related not only to the encouragement of active modes of transport but also to the safety of pedestrians and the incentive to daily use of intermodal passenger means of transport since better conditions for walking provide greater freedom in shifting modes of transport, either collective or individual. Sidewalks play a fundamental role in making cities places for social interaction, creative development, and economic growth.
Figure 4 is a bar chart that shows the comparison of São Paulo’s performance in terms of ISITransLog for each group of public policies from the model, in 2010 (blue) and 2020 (orange). All groups had their performance improved in 2020 when compared to 2010; however, the biggest difference in performance was for Clean Transport and Environmental Awareness policies. This difference is due to the fact that, in 2010, only the preventive road maintenance and environmental education initiatives were running, while the entire policy group was running in 2020.
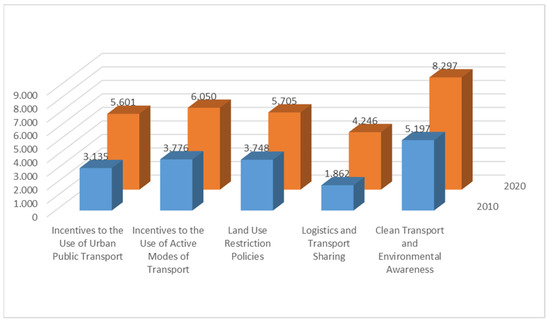
Figure 4.
Comparison between public policy groups’ performances in 2010 and 2020. Source: own elaboration.
Among the Incentives to the use of UBT policies, the Initiatives to Infrastructure for UBT group got the second-highest increase in the ISITransLog score from 2010 to 2020; it stands out because, although already in execution in 2010, it had only improved its effectiveness by 2020, with the completion of new bus lanes. The bus lane system (dedicated road with specific infrastructure and signaling) was expanded to 132 km. Besides the implementation of a system consisting of exclusive lanes which extend for 500 km, composed were a set of operational measures that reserve one or more lanes of the general traffic lane for the exclusive flow of buses or taxis, at specific times of the day [66]. On average, a moving vehicle occupies 40 m2; add it to the fact that São Paulo has a fleet of 4.5 million cars. Therefore, if all of them were flowing, they would occupy 180 km2 of urban space. The implementation of exclusive lanes for buses increases their average speed by 45.1% (21 km/h) compared to 20 km/h for bicycles and 14.1 km/h for cars [67].
Still, regarding the Incentives to use the UPT, the investment in Multimodal Integration reveals significant growth in the use of the subway (53%), metropolitan train (73%), school transport (58%), and motorcycle (48%), in the period from 2007 to 2017. The use of taxis is noteworthy, despite being responsible for only 1.1% of daily trips in the RMSP (large metropolitan area located in the São Paulo state in Brazil) in 2007, because it increased by 397% in the last decade due to the new form of requesting the service, through applications whose regularization took place in 2014. Buses had an increase in their use of 4% in 2017; however, their part in the total number of trips slightly decreased from 27% to 25% along the same period [68].
Logistics and Transport Sharing policies had the third-highest increase in the index’s performance. However, among the initiatives of this group, only the Delivery Window was running in 2010. This group of policies is the one that contains the most innovative initiatives, precisely because it mixes passenger and freight systems, which is not yet a reality in Brazil. Even in 2020, two of those initiatives, namely Crowdshipping and UPT freight transport, were not even listed for planning in São Paulo.
Despite ranking in the last, but for one, position among public policy groups, the incentives to active modes of transport had a great impact on the population of São Paulo, especially on the initiatives related to the use of bicycles. Between 2007 and 2017, bicycle trips increased by 24% [66].
4. Conclusions
Millions of people daily seek opportunities for a better quality of life in cities. What makes cities such attractive places, centering more than 50% of the world’s population today, is the capacity that large urban centers have to promote social interaction and, therefore, catalyze development of the city and the people [69]. One of the goals developed societies have in terms of mobility is to evolve towards models of lower-carbon consumption and lower-energy consumption, always with criteria of social equity and fair distribution of wealth. In short, the goal is sustainability [70].
In the context of cities, the initiatives adopted for one location may not always be suitable, or may not always bring the best results in other regions. Geographical and demographic characteristics and available resources are more important in adopting successful solutions than their location or government. The hierarchy of criteria around which ISITransLog is structured summarizes the framework of sustainable urban mobility in Brazilian cities. In addition, the ISITransLog construction method establishes procedures for surveying all the concepts that structure the index, applicable in different spatial or temporal contexts, thus allowing the development of tools that can be fully adapted to specific contexts.
Concerning the criteria aggregation method, the proposed method allows the compensation between good and bad criteria because it is based on a weighted linear combination. In view of this, it rewards cities that present good initiatives increasing their index’s overall results, while allowing the identification of deficient initiatives which contribute to lowering their index’s values.
It is important to highlight the relevant role of indicators in the evaluation and development of the implemented measures as the most effective means of measuring progress and as a compass for prioritizing initiatives for urban transport sustainability. The study revealed the main actions that contribute to the sustainability of urban mobility through public policies and initiatives. However, without periodic monitoring of the results obtained through policies and initiatives, it is impossible to continue improving transport and urban logistics in terms of sustainability and integration, or even to choose which aspect should be worked on next. Therefore, the application of ISITransLog in São Paulo in two distinct periods has allowed the verification of the applicability of the model, as well as has provided an assessment of the evolution of the municipality, concerning sustainability and integration of the passenger and freight systems.
There is a consensus regarding the main ways of improving urban transport sustainability, although the mode of implementation and the efficiency rate varies in each scenario. The following stand out: (1) policies to reduce the use of private vehicles (especially the low-occupancy ones) through the improvement of public transport, and investment in construction and maintenance of infrastructure for active modes of transport (focusing on the expansion of both use and safety); (2) promotion of education and public awareness about sustainable urban transport and logistics; (3) investment in clean technologies for transporting passengers and freight; (4) investment in the integration of multimodal transport, promoting the independence from private vehicles and sustainable modes of last-mile delivery; and (5) logistics management policies that promote a balance between operational efficiency and sustainability during deliveries and collections in urban centers.
The application of ISITransLog in other cities depends only on collecting data about each of the model’s initiatives. However, the model can be adapted to specific characteristics of the city analyzed, such as geography or culture. A city with river transport potential, for example, can include initiatives that encourage sustainable water transport.
As suggestions for future work, the use of GIS (Geographic Information System) can be included in the collection of city data, in order to obtain a more detailed Stage of Implementation. This is because it affords the possibility of to calculating the urban area actively affected by a given initiative.
Author Contributions
Conceptualization, methodology and writing—review and editing, C.M.S.; J.P.L. and F.F.; software, validation and writing—original draft preparation C.M.S. All authors have read and agreed to the published version of the manuscript.
Funding
This research received no external funding.
Institutional Review Board Statement
Not applicable.
Informed Consent Statement
Not applicable.
Data Availability Statement
Not applicable.
Acknowledgments
The authors would like to express their gratitude to the Brazilian agencies CNPq (National Council for Scientific and Technological Development) and FAPEMIG (Foundation for the Promotion of Science of the State of Minas Gerais), which have been supporting the efforts for the development of this work in different ways and periods.
Conflicts of Interest
The authors declare no conflict of interest.
References
- Kuse, M. Rio+20: United Nations Conference on Sustainable Development. J. Rural Plan. Assoc. 2012, 31, 524. [Google Scholar]
- López, C.; Ruíz-Benítez, R.; Vargas-Machuca, C. On the environmental and social sustainability of technological innovations in Urban bus transport: The EU case. Sustainabilaty 2019, 11, 1413. [Google Scholar] [CrossRef]
- Masoumi, H.E. A discrete choice analysis of transport mode choice causality and perceived barriers of sustainable mobility in the MENA region. Transp. Policy 2019, 79, 37–53. [Google Scholar] [CrossRef]
- Van Heeswijk, W.; Larsen, R.; Larsen, A. An urban consolidation center in the city of Copenhagen: A simulation study. Int. J. Sustain. Transp. 2019, 13, 675–691. [Google Scholar] [CrossRef]
- Ko, J.; Lee, S.; Byun, M. Exploring factors associated with commute mode choice: An application of city-level general social survey data. Transp. Policy 2018, 75, 36–46. [Google Scholar] [CrossRef]
- Adetiloye, T.; Pervez, G. A Macro and Micro-Level Evaluation of Stakeholders’ Collaboration for Sustainable City Logistics Operations. Oper. Supply Chain Manag. Int. J. 2015, 8, 90. [Google Scholar] [CrossRef]
- Pojani, D.; Stead, D. Sustainable Urban Transport in the Developing World: Beyond Megacities. Sustainability 2015, 7, 7784–7805. [Google Scholar] [CrossRef]
- Dong, J.; Xu, Y.; Hwang, B.-g.; Ren, R.; Chen, Z. The Impact of Underground Logistics System on Urban Sustainable Development: A System Dynamics Approach. Sustainability 2019, 11, 1223. [Google Scholar] [CrossRef]
- Guo, J.; Ma, S. Environmental impact assessment for city logistics distribution systems. Environ. Eng. Res. 2017, 22, 363–368. [Google Scholar] [CrossRef]
- Ros-McDonnell, L.; De-La-Fuente-Aragon, M.V.; Ros-McDonnell, D.; Carboneras, M.C. Designing an Environmental Zone in a Mediterranean City to Support City Logistics. Int. J. Prod. Manag. Eng. 2018, 6, 1–9. [Google Scholar] [CrossRef]
- Alonso, A.; Monzón, A.; Cascajo, R. Comparative analysis of passenger transport sustainability in European cities. Ecol. Indic. 2015, 48, 578–592. [Google Scholar] [CrossRef]
- Ortega, J.; Moslem, S.; Tóth, J.; Péter, T.; Palaguachi, J.; Paguay, M. Using Best Worst Method for Sustainable Park and Ride Facility Location. Sustainability 2020, 12, 10083. [Google Scholar] [CrossRef]
- Kwiatkowski, M.A. Urban Cycling as an Indicator of Socio-Economic Innovation and Sustainable Transport. Quaest. Geogr. 2018, 37, 23–32. [Google Scholar] [CrossRef]
- Marcucci, E.; Gatta, V.; Marciani, M.; Cossu, P. Measuring the effects of an urban freight policy package defined via a collaborative governance model. Res. Transp. Econ. 2017, 65, 3–9. [Google Scholar] [CrossRef]
- Oses, U.; Rojí, E.; Gurrutxaga, I.; Larrauri, M. A multidisciplinary sustainability index to assess transport in urban areas: A case study of Donostia-San Sebastian, Spain. J. Environ. Plan. Manag. 2017, 60, 1891–1922. [Google Scholar] [CrossRef]
- Bertolini, L.; Le Clercq, F.; Straatemeier, T. Urban transportation planning in transition. Transp. Policy 2008, 15, 69–72. [Google Scholar] [CrossRef]
- Suganthi, L. Multi expert and multi criteria evaluation of sectoral investments for sustainable development: An integrated fuzzy AHP, VIKOR / DEA methodology. Sustain. Cities Soc. 2018, 43, 144–156. [Google Scholar] [CrossRef]
- Rao, C.; Goh, M.; Zhao, Y.; Zheng, J. Location selection of city logistics centers under sustainability. Transp. Res. Part D Transp. Environ. 2015, 36, 29–44. [Google Scholar] [CrossRef]
- Mazzarino, M.; Rubini, L. Smart Urban Planning: Evaluating Urban Logistics Performance of Innovative Solutions and Sustainable Policies in the Venice Lagoon—the Results of a Case Study. Sustainability 2019, 11, 4580. [Google Scholar] [CrossRef]
- Melamed, M.L.; Schmale, J.; von Schneidemesser, E. Sustainable policy—Key considerations for air quality and climate change. Curr. Opin. Environ. Sustain. 2016, 23, 85–91. [Google Scholar] [CrossRef]
- Shindell, D.; Kuylenstierna, J.C.I.; Vignati, E.; van Dingenen, R.; Amann, M.; Klimont, Z.; Anenberg, S.C.; Muller, N.; Janssens-Maenhout, G.; Raes, F.; et al. Simultaneously Mitigating Near-Term Climate Change and Improving Human Health and Food Security. Science 2012, 335, 183–189. [Google Scholar] [CrossRef]
- Toilier, F.; Gardrat, M.; Routhier, J.; Bonnafous, A. Freight transport modelling in urban areas: The French case of the FRETURB model. Case Stud. Transp. Policy 2018, 6, 753–764. [Google Scholar] [CrossRef]
- Jaspers. The Use of Transport Models in Transport Planning and Project Appraisal; Jasper: Bucharest, Romania, 2014. [Google Scholar]
- Mardani, A.; Zavadskas, E.K.; Khalifah, Z.; Jusoh, A.; Nor, K.M. Multiple Criteria Decision-Making Techniques in Transportation Systems: A Systematic Review of the State of the Art Literature. Transport 2015, 31, 359–385. [Google Scholar] [CrossRef]
- Ortega, J.; Tóth, J.; Moslem, S.; Péter, T.; Duleba, S. An Integrated Approach of Analytic Hierarchy Process and Triangular Fuzzy Sets for Analyzing the Park-and-Ride Facility Location Problem. Symmetry 2020, 12, 1225. [Google Scholar] [CrossRef]
- Ortega, J.; Moslem, S.; Palaguachi, J.; Ortega, M.; Campisi, T.; Torrisi, V. An Integrated Multi Criteria Decision Making Model for Evaluating Park-and-Ride Facility Location Issue: A Case Study for Cuenca City in Ecuador. Sustainability 2021, 13, 7461. [Google Scholar] [CrossRef]
- Saaty, T.L.; Vargas, L.G. Decision Making with the Analytic Network Process; Springer: Boston, MA, USA, 2013. [Google Scholar]
- Pedroso, G.; Bermann, C.; Sanches-Pereira, A. Combining the functional unit concept and the analytic hierarchy process method for performance assessment of public transport options. Case Stud. Transp. Policy 2018, 6, 722–736. [Google Scholar] [CrossRef]
- Behzadian, M.; Kazemzadeh, R.; Albadvi, A.; Aghdasi, M. PROMETHEE: A comprehensive literature review on methodologies and applications. Eur. J. Oper. Res. 2010, 200, 198–215. [Google Scholar] [CrossRef]
- Marzouk, M. ELECTRE III model for value engineering applications. Autom. Constr. 2011, 20, 596–600. [Google Scholar] [CrossRef]
- Janiak, M.K.; Żak, J. Multiple Criteria Evaluation of Different Redesign Variants of the Public Tram System. Transp. Res. Procedia 2014, 3, 690–699. [Google Scholar] [CrossRef]
- Lima, J.P.; Abitante, J.D.C.; Pons, N.A.D.; Senne, C.M. A Spatial Fuzzy Multicriteria Analysis of Accessibility: A Case Study in Brazil. Sustainability 2019, 11, 3407. [Google Scholar] [CrossRef]
- Machado, M.H. and Lima, J.P. Multicriteria evaluation of people with reduced mobility accessibility: A study in downtown Itajubá (MG). Urbe. Revista Brasileira Gestão Urbana 2015, 7, 368–382. [Google Scholar] [CrossRef]
- Lima, J.P.; Lobato, K.C.D.; Leal, F.; Lima, R.D.S. Urban Solid Waste Management by Process Mapping and Simulation. Pesqui. Oper. 2015, 35, 143–163. [Google Scholar] [CrossRef][Green Version]
- Costa, H.G. Introdução ao Método de Análise Hierárquica: Análise Multicritério no Auxílio à Decisão; SBPO: Rio de Janeiro, Brazil, 2002. [Google Scholar]
- Fu, S.; Yan, X.; Zhang, D.; Zhang, M. Risk influencing factors analysis of Arctic maritime transportation systems: A Chinese perspective. Marit. Policy Manag. 2018, 45, 439–455. [Google Scholar] [CrossRef]
- Conway, G. The Doubly Green Revolution: Food for All in the Twenty-First Century, 1st ed.; Penguin Books: London, UK, 1997; Volume 1. [Google Scholar]
- Marcial, E.C.O. Megatendências Mundiais 2030: O Que Entidades e Personalidades Internacionais Pensam Sobre o Futuro do Mundo? Contribuição Para um Debate de Longo Prazo Para o Brasil; IPEA: Brasília, Brazil, 2015. [Google Scholar]
- Paskannaya, G.; Shaban, T. Innovations in Green Logistics in Smart Cities: USA and EU Experience. Mark. Manag. Innov. 2019, 6718, 173–181. [Google Scholar] [CrossRef]
- Loo, B.; Tsoi, K.H. The sustainable transport pathway: A holistic strategy of Five Transformations. J. Transp. Land Use 2018, 11, 961–980. [Google Scholar] [CrossRef]
- Bandeira, R.A.D.M.; Goes, G.V.; Gonçalves, D.N.S.; D’Agosto, M.D.A.; de Oliveira, C.M. Electric vehicles in the last mile of urban freight transportation: A sustainability assessment of postal deliveries in Rio de Janeiro-Brazil. Transp. Res. Part D Transp. Environ. 2019, 67, 491–502. [Google Scholar] [CrossRef]
- Reisi, M.; Aye, L.; Rajabifard, A.; Ngo, T. Transport sustainability index: Melbourne case study. Ecol. Indic. 2014, 43, 288–296. [Google Scholar] [CrossRef]
- Europeia, C. Livro Verde: Por uma nova cultura de mobilidade urbana. COM 2007, 551, 25. [Google Scholar]
- Costa, M. Um Indice de Mobilidade Urbana Sustentável. Ph.D. Thesis, Escola de Engenharia de São Carlos da Universidade de São Paulo, São Carlos, Brazil, 2008. [Google Scholar]
- Jeon, C.M.; Amekudzi, A. Addressing sustainability in transportation systems: Definitions, indicators, and metrics. J. Infrastruct. Syst. 2005, 11, 31–50. [Google Scholar]
- Huovila, A.; Bosch, P.; Airaksinen, M. Comparative analysis of standardized indicators for Smart sustainable cities: What indicators and standards to use and when? Cities 2019, 89, 141–153. [Google Scholar] [CrossRef]
- Sdoukopoulos, A.; Pitsiava-Latinopoulou, M.; Basbas, S.; Papaioannou, P. Measuring progress towards transport sustainability through indicators: Analysis and metrics of the main indicator initiatives. Transp. Res. Part D Transp. Environ. 2019, 67, 316–333. [Google Scholar] [CrossRef]
- Souza, L.C.L.; Ramos, R.A.; Silva, A.N.R.D.; Mendes, J.F. Cidades Sustentáveis: Um Desafio Comum Para Brasil E Portugal. In Proceedings of the III ENECS—Encontro Nacional Sobre EdificaçõES E Comunidades Sustentáveis, São Carlos, Brazil, 21–24 September 2003. [Google Scholar]
- Saaty, T.; Vargas, L. Models, Methods, Concepts & Applications of the Analytic Hierarchy Process, 2nd ed.; Springer: New York, NY, USA, 2012. [Google Scholar]
- Brunelli, M.; Critch, A.; Fedrizzi, M. A note on the proportionality between some consistency indices in the AHP. Appl. Math. Comput. 2013, 219, 7901–7906. [Google Scholar] [CrossRef][Green Version]
- Sallis, J.F.; Frank, L.D.; Saelens, B.E.; Kraft, M.K. Active transportation and physical activity: Opportunities for collaboration on transportation and public health research. Transp. Res. Part A Policy Pract. 2004, 38, 249–268. [Google Scholar] [CrossRef]
- Tsamboulas, D.; Kopsacheili, A.G. Methodological Framework for Strategic Assessment of Transportation Policies: Application for Athens 2004 Olympic Games. Transp. Res. Rec. 2003, 1848, 19–28. [Google Scholar] [CrossRef]
- Khan, S.A.R.; Jian, C.; Zhang, Y.; Golpîra, H.; Kumar, A.; Sharif, A. Environmental, social and economic growth indicators spur logistics performance: From the perspective of South Asian Association for Regional Cooperation countries. J. Clean. Prod. 2019, 214, 1011–1023. [Google Scholar] [CrossRef]
- Lima, J.P.; Machado, M.H. Walking accessibility for individuals with reduced mobility: A Brazilian case study. Case Stud. Transp. Policy 2019, 7, 269–279. [Google Scholar] [CrossRef]
- Lawson, A.R.; Ghosh, B.; Pakrashi, V. Quantifying the Perceived Safety of Cyclists in Dublin. Proc. Inst. Civ. Eng. 2015, 168, 290–299. [Google Scholar] [CrossRef][Green Version]
- Dehghanmongabadi, A.; Hoşkara. Challenges of Promoting Sustainable Mobility on University Campuses: The Case of Eastern Mediterranean University. Sustainability 2018, 10, 4842. [Google Scholar] [CrossRef]
- Pucher, J.; Buehler, R. Making cycling irresistible: Lessons from the Netherlands, Denmark and Germany. Transp. Rev. 2008, 28, 495–528. [Google Scholar] [CrossRef]
- IBGE. Panorama de São Paulo. 2020. Available online: https://cidades.ibge.gov.br/brasil/sp/sao-paulo/panorama (accessed on 4 July 2020).
- CET. Mobilidade no Sistema Viário Principal Volumes—2018; CET: São Paulo, Brazil, 2018. [Google Scholar]
- Ciclocidade. A pé e Bicicleta: Aprendento um Com o Outro; Cidade a pé: São Carlos, Brazil, 2018. [Google Scholar]
- Dos Santos, P.M.; Samios, A.; Caccia–Junho, L. 8 Princípios da Calçada; WRI Brasil: São Paulo, Brazil, 2017; p. 136. [Google Scholar]
- Secretaria Especial de Comunicação. São Paulo Passa a Ter a Maior Frota de Ônibus 100% Elétricos do País; Secretaria Especial de Comunicação: São Paulo, Brazil, 2019. [Google Scholar]
- Prefeitura de São Paulo. Cresce o Número de Viagens por Bicicletas Compartilhadas na Cidade de São Paulo. Prefeitura de São Paulo. 2018. Available online: https://www.prefeitura.sp.gov.br/cidade/secretarias/transportes/noticias/?p=257697 (accessed on 30 May 2021).
- Secretaria dos Transportes Metropolitanos. Pitu 2020, Secretaria dos Transportes Metropolitanos, 2006. Available online: http://www.stm.sp.gov.br/Pitu2020/OPitu2020 (accessed on 20 March 2021).
- Sociedade Civil. Mobilidade Urbana e Programa de Metas para a Cidade de São Paulo; Secretaria Civil: São Paulo, Brazil, 2017. [Google Scholar]
- Secretaria dos Transportes Metropolitanos. Pesquisa Origem Destino 2017—50 Anos; Secretaria dos Transportes Metropolitanos: São Paulo, Brazil, 2009. [Google Scholar]
- Prefeitura de São Paulo. Plano Diretor de São Paulo; Prefeitura de São Paulo: São Paulo, Brazil, 2014. [Google Scholar]
- Oliveira, C. Caracterização Socioeconômica dos Deslocamentos por Modo de Transporte—Região Metropolitana de São Paulo, Pesquisa Origem e Destino 2017; Prefeitura de São Paulo: São Paulo, Brazil, 2017. [Google Scholar]
- Silva, A.N.R.D.; Ramos, R.A.; Souza, L.C.L.; Rodrigues, D.S.; Mendes, J.F. SIG—Uma Plataforma para Introdução de Técnicas Emergentes No Planejamento Urbano, Regional e de Transportes: Uma Ferramenta 3D para Análise Ambiental Urbana, Avaliação Multicritério, Redes Neurais Artificiais; Ed. dos Autores: São Carlos, Brazil, 2004. [Google Scholar]
- Ghidini, R. A caminhabilidade: Medida urbana sustentável. Rev. Transp. Públicos 2011, 33, 1. [Google Scholar]


Publisher’s Note: MDPI stays neutral with regard to jurisdictional claims in published maps and institutional affiliations. |
© 2021 by the authors. Licensee MDPI, Basel, Switzerland. This article is an open access article distributed under the terms and conditions of the Creative Commons Attribution (CC BY) license (https://creativecommons.org/licenses/by/4.0/).