Abstract
In sub-Saharan Africa, most households in rural communities keep smallholder poultry, and are exposed to harsh socio-economic conditions caused by COVID-19 pandemic due to the vulnerability of their production systems to crisis. This study assessed the impact of COVID-19 on 525 smallholder poultry farmers in five states of Nigeria. The study was conducted 15 months after the onset of the pandemic in Nigeria using structured questionnaires focused on socio-demography, income, production systems, markets, and food security. Average household size increased from 6.9 before COVID-19, to 8.3 during COVID-19, representing a 20.3% increase in population growth. Over half (52.6%) of this increase was due to childbirths. Average monthly income before and during the pandemic was reduced from NGN 22,565 (USD 62.70) to NGN15,617 (USD 38.10), respectively. During the pandemic, there was a 28.4% increase in the number of farmers living below the international poverty line of USD 1.90 per day. In addition, reliance on chickens for food and income was significantly (p < 0.05) impacted by gender, location, household size, and monthly income. These results show that the COVID-19 pandemic had a significant effect on the livelihoods and food security of farmers, and the findings are essential in developing appropriate post-COVID-19 interventions for smallholder poultry production in Nigeria.
1. Introduction
Globally, the COVID-19 pandemic has caused major disruptions to several agricultural (livestock, crop, and horticulture) activities across different production systems. Consequently, this resulted in significant hardships and economic losses to households, particularly smallholder farmers who are less resilient and more vulnerable to shocks and disturbance within the production system [1,2]. The impact of COVID-19 on smallholder poultry households in sub-Saharan Africa is of particular importance because over 80% of all households keep poultry as a source of livelihood and food security [3]. Smallholder poultry is largely a subsistence-oriented poultry keeping of unimproved or improved dual-purpose (i.e., for eggs and meat) chicken breeds raised under scavenging or semi-scavenging production systems, using family labour and locally available feed resources [4,5,6,7]. In Nigeria, smallholder poultry accounts for between 65 and 77% of total poultry holdings [8,9,10], and women are the primary keepers [11,12] and main actors within the value chain.
In curtailing the outbreak of severe acute respiratory syndrome coronavirus 2 (SARS-CoV-2) in Nigeria, government at both the federal and state level imposed and enforced drastic public health measures such as curfews, movement restrictions, lockdowns (partial and total), social distancing, ban on interstate travel, and closure of markets [13]. These public health measures impacted differently the lives, activities, and economy of people dwelling in different parts of the country [14]. This is partly due to the lack of synergy and cohesiveness between the government at the federal and state level on COVID-19 policy formulation, the extent of implementation, and the type of enforcement required [15]. The contradictory policies and varying levels of enforcement in managing the disease outbreak further contributed to the poverty, hardship, and hunger experienced by the poor [16].
Although the agricultural sector was exempted from some of these restrictions and lockdowns, commercial large-farm holdings and small-scale farming activities operating within an organised sub-sector were the main beneficiaries [17]. Smallholder poultry production operates informally, under a less organised agricultural sub-sector where farmers reside predominantly in rural communities but trade (sell eggs and live birds, purchase day-old chicks) along interstate highways and markets (formal or informal) located in peri-urban and urban centres [18,19,20]. However, due to the COVID-19 pandemic, access to such markets and the hawking of live birds along highways were restricted. In addition, at the community level, extension and animal husbandry information services offered by farmer groups were interrupted due to social distancing. All of this threatened smallholder poultry production, and expose vulnerable, resource-poor, rural households to increased food insecurity and loss of livelihood. Therefore, the objective of this study was to determine the effect of the COVID-19 pandemic on smallholder poultry production in five states of Nigeria as well as its impact on household livelihoods and food security.
2. Materials and Methods
2.1. Description of Study Area and Household Selection
The study locations and households were selected from a previous study (African Chicken Genetic Gains—ACGG) conducted in Nigeria on smallholder poultry [21]. The locations were Kebbi (Sudan Savanna), Nasarawa (Northern Guinea Savanna), Kwara (Southern Guinea Savanna), Imo (Lowland Rainforest/Derived Savana) and Rivers (Mangrove/Freshwater Swamp Forest) states [22]. The states represented different geographical regions (North: Kebbi, Nasarawa, and Kwara; South: Imo and Rivers), and agroecological zones of the country (Figure 1). The features of the agroecological zones were as described by Yakubu [11].
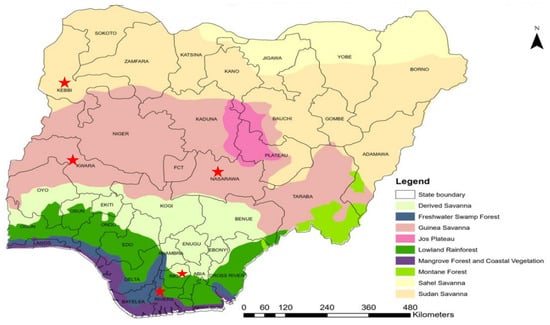
Figure 1.
Map of Nigeria showing the study locations (highlighted red) in the agroecological zones. Reprinted with permission from ref. [23]. Copyright 2019 Federal Department of Forestry.
A total of 525 households were selected. The model for the sampling was: .
For adequate distribution of the households selected in each state, one LGA was purposively selected from each of the three senatorial districts. Each of the three villages was then randomly selected from the respective LGA.
The sampling represented over 40% of the total number of households from the ACGG smallholder poultry baseline survey (1200) (Alemayehu et al. 2018). Eligibility criteria included persons aged 18 years old and above, and having previously participated in both the baseline survey and on-farm activities during the ACGG project [24]. Participation in the ACGG project was an important criterion for household selection so as to allow an unbiased comparison of the results from the baseline survey with this study’s results. For this study, respondents were defined as persons primarily responsible for keeping chickens in the household. All the respondents provided informed consent to participate in the survey. The study was approved by the Review Committee of the CGIAR COVID-19 Hub: ILRI Nigeria 2021. The survey was conducted in 17 days, between 27 May and 13 June 2021. This was 15 months after the first documented case (27 February, 2020) of COVID-19 in Nigeria [25].
2.2. Research Hypothesis
Null hypothesis: There is no significant impact of the COVID-19 pandemic on monthly income, poverty status, food security, flock size, accessibility of markets, sale of live birds/eggs, or household sizes of smallholder poultry farmers in the five agroecological zones of Nigeria.
Alternate hypothesis: The monthly income, poverty status, food security, flock size, accessibility of markets, sale of live birds/eggs, and household sizes of smallholder poultry farmers surveyed in the five agroecological zones of Nigeria are significantly impacted by the COVID-19 pandemic.
2.3. Data Collection and Analysis
This survey was a cross-sectional study conducted using a structured questionnaire with questions in the following areas: socio-demography, household income, flock size and production, markets, information and extension services, and food and consumption. The questions focused on the period before the COVID-19 outbreak (January 2020) and during COVID-19 (February 2020–May 2021). The questionnaires were interviewer administered by trained field officers who visited each of the participants in their respective households. Due to varying levels of COVID-19 restrictions on gatherings in each of the five states, focused group discussions and key informant interviews were not conducted. All the field officers had previously participated in the ACGG project and were familiar with the farmers, local languages, communities, and practice of smallholder poultry production. Each field officer was assigned to a village. Data were collected on smartphones using Google Forms and stored in real-time on Google cloud services. Geolocations of the study areas were also captured [26].
Data were subjected to descriptive (mean, standard deviation, frequency, percentage) and inferential statistics (Chi square (χ2), Wilcoxon signed-rank test, Kruskal–Wallis H one-way analysis-of-variance (ANOVA) test). The following mathematical models [27] were used for the inferential analysis:
where df = degrees of freedom, Oi = observed value in category i, Ei = expected value in category i, and χ2 = Chi-square value. The Chi-square test was used to test the null hypothesis that there is no significant association between the independent variables (gender, location) and the dependent variables (poverty status, flock size, reliance on chickens, accessibility of markets, sale of live birds and eggs), before and during the COVID-19 pandemic.
where z is the test statistic tested against the Z-score, n is the number of sample pairs grouped either by gender (male, female) or region (north, south) before and during COVID-19, and Ri is the (signed) rank of the absolute difference between the ith pair of values. This was used to test the null hypothesis that there is no systematic difference in the mean of the paired observations obtained for household size, average monthly income, and flock size before and during COVID-19 by gender and region.
where H is the Kruskal–Wallis test statistic for the non-parametric one-way ANOVA (H > 2 groups), N is the total number of observations across all groups (location), Ti is the sum of ranks of observations in the ith sample, and ni is the number of observations in the group i (i = 1, 2, …, I). For tied observations, a correlation factor was applied to H and mean ranks were used in comparing the group effect before and during COVID-19.
where ti is the number of observations within the groups of tied ranks. The null hypothesis test was that there is no difference among the five states (location) with respect to household size, monthly income, and flock size before and during COVID-19.
In addition, multivariate logistic regression analysis was used to test the degree of associations (odds ratio) between respondents’ reliance on chickens (binary variable) and some predictors (location, gender, household size, monthly income).
where X is the jth predictor for the jth case representing the covariates X1, X2, …, Xn; β0 is the intercept; β1X1 to βnXn are the regression coefficients that represent log odds; n is the number of predictors; and π is the expected proportional outcome for the binary response variable. This was tested against the null hypothesis that there is no significant relationship between farmers’ reliance on chickens and location, gender, household size, and monthly income.
Effect size (Cohen’s d) was determined using the Wilcoxon signed-rank test parameters to quantify the effect of COVID-19 on respondents’ monthly income, household size, and flock size before and during the pandemic. Data were analysed in R [28] version 3.6.2 and Statistical Package for Social Sciences (SPSS version 20). Prior to analysis, data were tested for normality using the Shapiro–Wilk test. Data visualisations were presented using MS-Excel (Office 2019) and R.
The dollar (USD) to naira (NGN) exchange rate before the COVID-19 outbreak in Nigeria (January 2020) was USD 1 to NGN = 360, whereas the exchange rate during the outbreak of COVID-19 (May 2021) was USD 1 to NGN = 410 [29].
3. Results
3.1. Gender and Age of Respondents
The results of this study represent a total of 525 households, and two-thirds (66%) of the respondents were female (n = 346) whereas over one-third (34%) were male (n = 179) (Figure 2). There were more female respondents than male in all the states except Imo State. Nasarawa (82%) had the highest percentage of female respondents, followed by Kebbi (73%), Rivers (69%), Kwara (56%), and Imo (49%) states. The average age of the respondents was 51.0 ± 21.6 years. The majority of the respondents (70.1%) were aged between 40 and 69 years old. Respondents aged 18 to 39 years and 70 years and above were 18.3% and 11.6%, respectively.
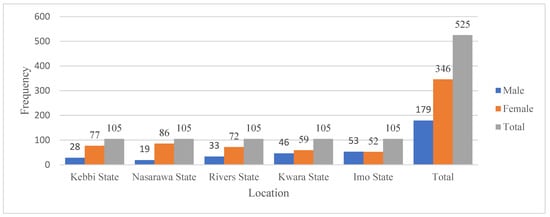
Figure 2.
Gender distribution of respondents across the study locations in Nigeria.
3.2. Household Size
Average household size before and during COVID-19 was 6.95 ± 2.14 and 8.29 ± 2.56, respectively (Table 1). The effect of COVID-19 on average household size was moderate (d = 0.62) and statistically significant (Z = −14.29, p ≤ 0.001). Table 1 shows that across the locations, the percentage increase in average household size in the period before and during COVD-19 was approximately 35.7% (Rivers), 24.5% (Kwara), 23.6% (Imo), 10.1% (Kebbi), and 9.4% (Nasarawa). Respondents in the northern region had a lower (13.2%) percentage increase compared to those in the south (30.3%). Both male (19.7%) and female (19.2%) respondents had about a 20% increase in average household size in the period before and during COVID-19. Gender, location, and region of the respondents had a statistically significant (p ≤ 0.001) association with household size (Figure 3).

Table 1.
Descriptive statistics of household size, monthly income, and flock size by gender, location, and region before and during COVID-19.
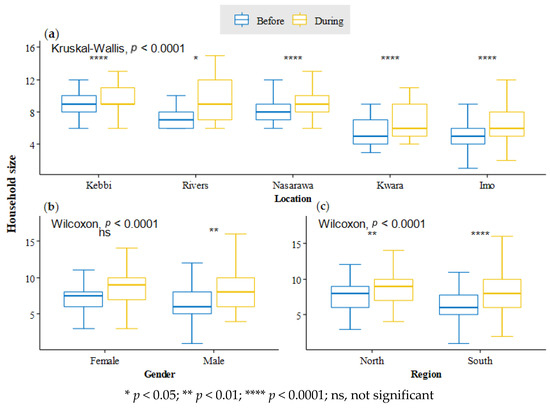
Figure 3.
Household size of respondents by (a) location, (b) gender, and (c) region before and during COVID-19.
Before the pandemic, about two-thirds (65.9%) of the respondents had average household sizes ranging between six and nine, whereas household sizes ranging between one and two, three and four, and 10 and above were reported by 1.5%, 22.7%, and 9.9% of the respondents, respectively (Table 2). During the pandemic, the distribution of respondents across the range of household sizes was 0.2% (1–2), 14.1% (3–4), 54.3% (6–9), and 31.4% (10 and above). Table 2 shows a statistically significant (p < 0.05) distribution of respondents across a range of household sizes by gender and location in the period under study.
Table 2.
Percentage distribution of household sizes before and during the COVID-19 pandemic.
Figure 4 shows that more than half (57%) of the respondents experienced an increase in household size during COVID-19, either due to new childbirths or the arrival of relatives, and a larger proportion (88.8%) of these respondents experienced about a 50% increase in average household size (Table 2). Table 3 shows that over half (56.7%) of the female respondents experienced close to a 100% increase in average household size compared to males (50.3%). Gender (F = 4.79, p = 0.03) and location (F = 12.10, p = 0.00) had a statistically significant influence on the percentage increase in average household size.
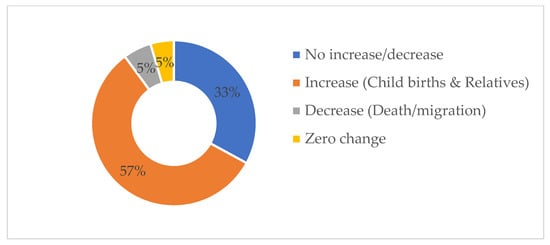
Figure 4.
Household size dynamics during the COVID-19 pandemic.
Table 3.
Percentage distribution of household size increases during the COVID-19 pandemic.
Table 4 and Table 5 highlight the percentage distribution of respondents according to the number of persons added to the households through childbirth and the arrival of relatives during the pandemic. The number of persons added to the households through childbirth ranged from one (22.5%), to two (13.5%), to three and above (16.6%), whereas the number of persons added to the households through arrival of relatives ranged from one, to two, to three, to over three in 13.3%, 15.2, 1.5% and 12.4% of the respondents’ households, respectively. Gender was found to have a statistically significant (χ2 = 10.63, p = 0.01) effect only on the number of children added to households by birth, but location significantly influenced both the number of persons added through childbirth (χ2 = 72.24, p = 0.00) and the arrival of relatives (χ2 = 102.30, p = 0.00).
Table 4.
Percentage distribution of the number of children added to households through childbirth during COVID-19 by gender and location.
Table 5.
Number of persons added to households through arrival of relatives during the COVID-19 pandemic.
3.3. Income
As shown in Table 1, the average monthly income of the respondents before and during COVID-19 was NGN 22,564.95 ± 18,623.52 (USD 62.7) and NGN 15,616.76 ± 15,610.21 (USD 38.1), respectively. COVID-19 had a moderate (d = 0.66) and statistically significant (Z = −15.12, p ≤ 0.001) effect on the average monthly income of the respondents. There was a statistically significant (p ≤ 0.001) effect of gender and location on average monthly income, but region had no statistically significant (p > 0.05) effect (Figure 5). The percentage reduction in average monthly income in the period before and during COVD-19 ranged from 17.4% (Kebbi) to 43.6% (Nasarawa), and from 27.9% (North) to 35.0% (South) across location and region, respectively (Table 1). Males and females both had about a 30.8% reduction in average monthly income.
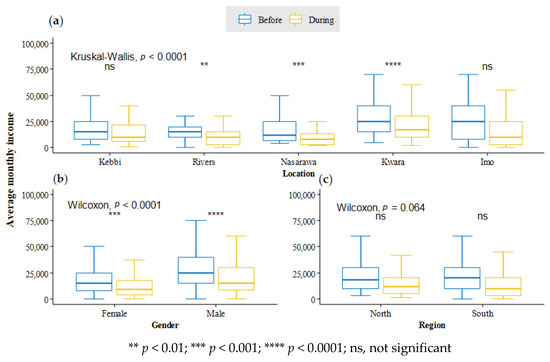
Figure 5.
Average monthly income of respondents by (a) location, (b) gender, and (c) region before and during COVID-19.
During the pandemic, two-thirds of the respondents were observed to be living below the average monthly income, and women account for a greater percentage (73.2%) of this group of persons (Figure 6). As shown in Figure 6, a vast majority of respondents (79.4%) reported a reduction in average monthly income during the pandemic whereas only few (7.4%) experienced an increase. However, some (13.1%) reported no changes in their average monthly income (Figure 7). Table 6 shows the distribution of respondents along a range of average monthly income before and during COVID-19. Gender and location were significantly (p < 0.05) associated with the percentage distribution of respondents across the range of average monthly income.
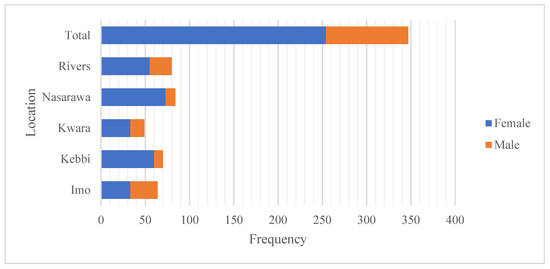
Figure 6.
Households earning below the average monthly income.
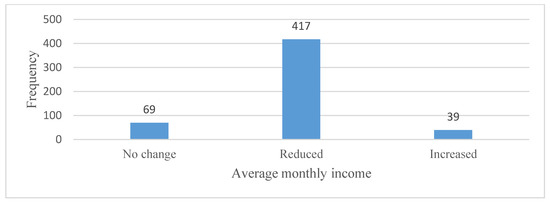
Figure 7.
Changes in average monthly income of respondents.
Table 6.
Respondents’ monthly income before and during the COVID-19 pandemic.
Respondents’ Income Relative to Poverty Line
Table 7 shows the percentage of respondents whose average monthly income was below and above the international poverty line (IPL) of USD 1.90 per day (2011 PPP) [30] before (equivalent of NGN 684/day or NGN 20,520/month) and during (equivalent of NGN 779/day or NGN 23,370/month) COVID-19. The proportion of women living below the IPL before and during the pandemic was 69.9% and 84.1%, respectively (Figure 8). The proportion of respondents living below the IPL before COVID-19 ranged from 42.9% (Kwara) to 76.2% (Rivers), whereas during the pandemic, it ranged from 66.7% (Kwara) to 92.4% (Nasarawa). Before and during COVID-19, gender, location, and household size significantly (p < 0.05) influenced the distribution of respondents in relation to IPL.
Table 7.
Respondents’ income relative to the international poverty line.
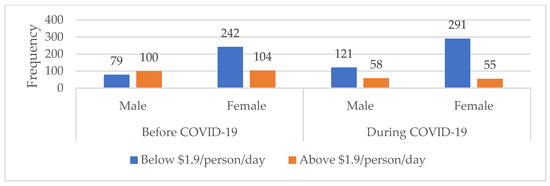
Figure 8.
Gender disaggregation of respondents relative to the international poverty line before and during COVID-19.
Table 8 shows respondents whose average monthly income was above the IPL before COVID-19, but moved below the IPL during COVID-19. This move impacted more females (57) than males (43) and the effect of gender was statistically significant (χ2 = 4.31, p = 0.04). Kwara (27.6%), Imo (24.8%), and Nasarawa (23.8%) states accounted for over 70% of the number of respondents who before COVID-19 were earning above the IPL, but during COVID-19 had moved below the poverty line. This move was also significantly influenced by location (χ2 = 21.10, p = 0.00).
Table 8.
Respondents whose monthly income was above the international poverty line before COVID-19 but below the poverty line during COVID-19.
With respect to the national poverty line of NGN 137,430 per annum (NBS 2020), 35.6% and 53.3% of the respondents were living below the line (i.e., NGN 11,425.50/month) before and during COVID-19, respectively. This represents a 50% increase in the number of respondents within the poverty bracket during COVID-19. According to this national poverty level, 28% of the farmers (338) previously outside the national poverty line before COVID-19 had plunged into poverty. That is, 95 farmers were plunged into poverty.
3.4. Contribution of Chicken to Food Security and Income during the Pandemic
Majority of the respondents’ households (75%) relied more on chickens for food and income during COVID-19. Sixty-four percent of these households (394) were of female respondents compared to male (36%) respondents. Rivers State had the highest number of households (93) that were dependent on chickens, followed by Nasarawa (89), Kwara (76), Kebbi (70), and Imo (66) states.
Table 9 highlights the relationship between household reliance on chickens (Yes/No), and location, gender, household size (arrival of relatives/childbirth), and monthly income (increase/decrease/no change). The model shows that location, gender, household size, and monthly income were good predictors of respondents’ reliance on chickens (β = 1.101, df = 1, p < 0.05). During the pandemic, location, gender, increase in household size due to arrival of relatives, and changes in monthly income were 0.835, 0.574, 1.227, and 0.625 times (odds ratios) more likely to influence (p < 0.05) reliance on chickens, respectively. Table 10 and Table 11 show a bivariate distribution of the reliance on chickens against changes in average monthly income (χ2 = 18.71, p = 0.00) and household sizes (χ2 = 13.62, p = 0.00) during COVID-19. Over 80% of the respondents who reported a reduction in average monthly income during the pandemic relied more on chickens for money and food. A vast majority of the respondents (88.4%) with household sizes greater than six relied more on chickens for money and food during COVID-19.
Table 9.
Association between household reliance on chickens, location, gender, household size, and monthly income during COVID-19.
Table 10.
Association between respondents’ reliance on chickens and changes in income.
Table 11.
Association between respondents’ reliance on chickens and household size.
3.5. Household Flock Size
Average flock size per household was 29.65 ± 2.49 and 30.28 ± 2.97 before and during the pandemic, respectively (Table 1). The difference in flock size was statistically significant (Z = −4.74, p ≤ 0.001), and COVID-19 had a small effect (d = 0.21) on the observed changes in average flock size. Respondents in Imo State had the highest (4.2%) percentage increase in flock size (Nasarawa, 3.7%; Kebbi, 2.8%; Kwara, 0.9%), whereas there was a 1.0% reduction in flock size in Rivers State. Respondents residing in the northern part of the country had a higher (2.5%) percentage increase in flock size compared to those in the south (1.6%). Figure 9 shows that the average flock size was significantly (p ≤ 0.001) influenced by location and region. Gender had no statistically significant (p > 0.05) effect on average flock size.
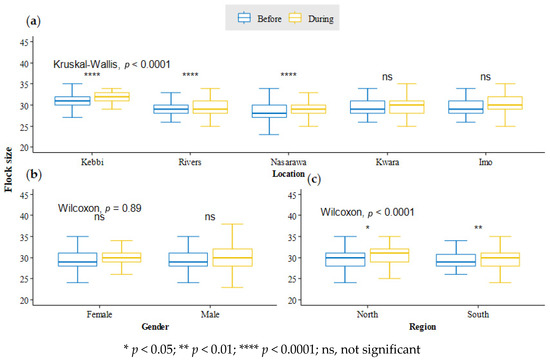
Figure 9.
Average flock size of respondents by (a) location, (b) gender, and (c) region before and during COVID-19.
Table 12 shows that the majority (76.2%) of the respondents reported an increase in flock size during the pandemic through the hatching of chicks by local hens (50.5%), the purchase of DOC (22.8%), or gifts (2.9%). Compared to males (27.7%), more female respondents (53.8%) increased their flock size through the hatching of chicks by local hens. On the other hand, about one-third (32.5%) of male respondents’ flock size increased by purchase of day-old chicks compared to females (17.9%). A greater percentage (62.3%) of respondents attributed the decrease in flock size to the consumption and sale of live birds. About a quarter (24.8%) of the respondents associated the decrease with theft, mortality, and predation, whereas less than one-sixth (13.0%) gave away chickens as gifts or donations. Sale of chickens contributed most to the decrease in flock size for all states except Kwara and Rivers states, where gifts/donations and consumption most influenced the decrease in flock size, respectively. Gender and location significantly (p < 0.05) influenced changes (increase and decrease) in respondents’ flock size during the pandemic.
Table 12.
Changes in respondents’ flock size during COVID-19.
3.6. Markets, Sales, and Access to Extension Services
Table 13 and Table 14 show that gender and location significantly (p < 0.05) influenced respondents’ accessibility to markets and the sale of chicken products during the pandemic. Most of the respondents (84.6%) indicated that COVID-19 restrictions and lockdowns negatively impacted access to markets for the sale of live birds and eggs. This resulted in fewer sales for over two-thirds of the respondents (69.3%) (Table 12). Only 17.5% of the respondents had more sales, and 13.2% of the respondents observed no difference in sales during the pandemic. The restrictions reduced the accessibility of markets for more females (64%) than males (36%) (Table 12). Kebbi State had the highest percentage (99%) of respondents whose access to markets was affected by the restrictions and lockdowns, followed by Imo (96.2%), Kwara/Rivers (91.4%), and Nasarawa (44.8%) states. Access to agricultural extension services was equally impacted for a vast majority of the respondents (88.4%).
Table 13.
Impact of COVID-19 restrictions on accessibility to markets.
Table 14.
Impact of COVID-19 restrictions on sales of live birds and eggs.
4. Discussion
The study participants were selected from locations (Kebbi, Nasarawa, Kwara, Imo, and Rivers states) representative of different agroecology and vegetation zones, where two-thirds of the total poultry population in Nigeria are being raised under smallholder poultry production systems [31,32]. In addition, the participants reflected certain socio-cultural (e.g., childbirth, communal living, family sizes) and socio-economic (e.g., income, markets, agricultural activities) characteristics of households within the respective geographical regions (North West: Kebbi; North Central: Kwara, Nasarawa; South East: Imo; South South: Rivers) [33,34,35].
For this study, there was a distinction between respondents who were the farmers keeping the chickens in the households and the household heads. However, there were respondents (43%) who were both the farmer and the household head. This occurred more with male respondents (88.3%) than with females (19.7%), and the majority of these female respondents resided in Rivers (24) and Imo (18) states. This agrees with previous reports that there are fewer female-headed smallholder poultry households in Nigeria, with Rivers State having a significant proportion of these households compared to the other states [21,36]. The implication of this disparity with respect to women’s empowerment, gender roles (chicken ownership, decision making), and production efficiency within households needs to be further investigated in a post-COVID-19 era. Overall, this study confirms that women are the primary producers of smallholder poultry in Nigeria [12].
There was a 20.3% increase in average household size before (6.9) and during (8.3) COVID-19. The average household size before the pandemic was similar to that observed (6.5) in the baseline study (December 2015) conducted during the ACGG project [21]. This shows that between December 2015 and January 2020 (a four-year period), there was a 6.2% increase in household size. The percentage increase in household size within that four-year period is lower than the 20.3% increase in average household size observed within the 15-month (February 2020–May 2021) COVID-19 period of this study. The alarming increase in household size within this study period was attributed to childbirths and the arrival of relatives. The arrival and welcoming of relatives and extended kin during periods of crisis (death, job loss, insurgency) has been described as an intricate but essential ingredient of societal responsibilities of African, and in particular Nigerian, households [37,38]. Compared with the increase in household size by the addition of relatives, childbirths accounted for over half (52.6%) of the total increase in household size. This is consistent with the ranking of Nigeria as third on the list of countries with the highest expected number of births during the pandemic [39]. Ranking of the states by childbirth was as follows: Kwara (63.8%), Rivers (61.2%), Kebbi/Nasarawa (48.6%), and Imo (40%). This implies that households in the northern part of Nigeria had more childbirths during the pandemic than those in the south and follows a similar trend reported by NDHS [35] for fertility rates prior to the pandemic.
Farmers’ average monthly income was reduced significantly, by about one-third (31%), before (NGN 22,565/USD 62.70) and during (NGN 15,617/USD 38.10) the pandemic. However, the average monthly income (NGN) during COVID-19 was higher than that previously reported for similar smallholder households in Nigeria (NGN 15,100) [12]. This may be attributed to current changes in the price of agricultural commodities (e.g., eggs, meat, live birds) and food inflation, which smallholder poultry farmers may have also profited from [40,41]. During the pandemic, a vast majority of the farmers (78.5%) were living below the international poverty line (USD 1.90/person/day), and there were more poor women (71%) than men (29%). Compared with the southern regions (South East, South South), farmers in the northern parts (North West, North Central) of Nigeria formed a larger proportion (60%) of those living below the poverty line. This corroborates a recent report on the outlook of poverty in Nigeria post COVID-19 that predicted a higher risk of poverty in the north compared to the south [42,43]. There was a 28.3% increase in the number of smallholder poultry farmers living below the poverty line during (412) the pandemic compared to before the pandemic (321). This is within the projected increase in poverty rate due to COVID-19 for the period 2020 (12.8%) to 2022 (45.2%) in Nigeria [42,43,44,45]. Within the 15-month period (February 2020 and May 2021), 100 smallholder poultry farmers (Male: 43, Female: 57) were newly plunged into poverty. This represents about half (49%) of the total number of the farmers (204) living above the poverty line before COVID-19.
ACGG intervention in Nigeria (2015–2019), contributed significantly to bringing smallholder poultry farmers out of poverty [12]. However, due to COVID-19, some of these farmers were plunged back into poverty. This suggests that about half of the gains made through the ACGG interventions have been lost, and the remaining gains are equally at risk of being eroded by the prolonged outbreak of the COVID-19 pandemic.
In addition to location and gender, there was a strong relationship between household size and poverty status both before and during COVID-19. This finding is in agreement with previous studies on the relationship between household size and poverty in rural communities of Nigeria [46,47]. Farmers with household sizes ranging between three and five and six to nine constituted the highest percentage of those living above and below the poverty line, respectively. This suggests that population growth at household levels increases the risk of poverty for smallholder poultry farmers.
Most of the farmers (75%) relied more on chickens as a source of food and income during the pandemic, and Rivers State had the highest percentage (88.6%) of farmers dependent on chickens. The observed reliance on chickens in Rivers State suggests an increased pressure on food and money caused by the high increase (36%) in average household size compared to the other states. During the pandemic, changes in average monthly income and household size significantly influenced farmers’ reliance on chickens for household food and income. Compared with those who experienced no change in reliance on chickens, farmers who relied more on chickens had a larger reduction (42%) in average monthly income, as well as a higher increase (17.7%) in household size during COVID-19 than before COVID-19. This agrees with the reports that smallholder chickens are valuable assets that provide sustenance and supplementary income [48,49] during emergencies such as the COVID-19 pandemic. Increase in household size due to arrival of kin, and not childbirth, was a significant predictor of farmers’ reliance on chickens. This was not surprising, as the presence of more grown-ups in the households increased the demand for food, and chickens are considered a primary choice for low-cost animal protein sources in low-to-middle income countries (LMIC) [50,51,52].
As expected, the increased reliance on chickens by farmers during the pandemic resulted in a decrease in flock size, mostly through sale of live birds and consumption of chickens/eggs. About two-thirds (64.3%) of the farmers (207) whose flock size was reduced due to the sale of live birds were from the northern region of the country. On the other hand, reduction in flock size through consumption of chickens or eggs was highest (54.2%) in the southern parts. This observation is in consonance with the findings of Alabi [12], where chicken and egg consumption were highest in the South South (Rivers) and South East (Imo) states of Nigeria. The result also aligns with the objectives of keeping chickens across the agroecological zones [21]. This implies that irrespective of the COVID-19 pandemic, the purpose of keeping smallholder poultry has not changed.
In spite of the reduction in flock size, average flock size increased by 2.0% during (30.3) the pandemic compared to before (29.7) the outbreak of COVID-19. The average flock sizes observed in this study were higher than those previously reported (28) for a similar group of farmers sampled within the same locations [21].
During COVID-19, less than a quarter (23%) of the farmers purchased day-old chicks, whereas over half (51%) of the farmers resorted to using local hens to brood and hatch chicks for re-stocking. This was largely due to COVID-19-related disruptions in the supply chain of the day-old chicks of the farmer-preferred [11], dual-purpose chicken breeds (FUNAAB Alpha, Noiler, Sasso) [7,22]. This agrees with an earlier report on the logistical challenges associated with poultry input supply chains during the pandemic [15]. Gender played a significant role in the re-stocking options available to farmers during COVID-19, as more women purchased day-old chicks (52%) and used local hens (70%) to increase their flock size, compared to men.
At the outbreak of the pandemic, when curfews, lockdowns, and movement restrictions were in place, there was limited access for most women (64%) to trade at the markets or hawk along the highways. Across each of the states, except Nasarawa (45%), a vast majority (90%) of the farmers were challenged by the inaccessibility of the markets. Nasarawa State also had the lowest percentage of farmers (45%) affected by the restrictions, lockdowns, and closure of markets. This suggests a flexibility in the enforcement of the government’s policy on the closure of markets and movement restrictions. It may also be indicative of the different marketing channels available to smallholder poultry producers in Nasarawa State as well as their ingenuity compared to the other states. As may be expected, Nasarawa State had the highest proportion (38%) of farmers who experienced an increase in the sale of live birds and eggs during the pandemic. However, overall, farmers experienced less sales during the pandemic, and this contributed to the changes in the average monthly income.
5. Conclusions
This study identified the impact of the COVID-19 pandemic on smallholder poultry production in Nigeria, and highlighted its threat to household livelihoods and food security. These findings provide an update on the existing baseline surveys on smallholder poultry production in Nigeria, and are essential for designing appropriate interventions in a post-COVID-19 era. The study emphasises a strong association between gender, location, household size, and monthly income on the livelihoods and food security of smallholder poultry farmers.
Overall, women were more affected by the pandemic than men. Ranking the states based on the observed impact of COVID-19 on average monthly income, poverty rate, household size, flock size, reliance on chickens, sales, and accessibility of markets during the pandemic placed Kwara State (Southern Guinea Savanna) as the most impacted, followed by Rivers State (Mangrove/Freshwater Swamp Forest), Kebbi State (Sudan Savanna), Nasarawa State (Northern Guinea Savanna), and Imo State (Lowland Rainforest/Derived Savanna).
Compared with the other states, Kebbi and Nasarawa states had the highest percentage of female smallholder poultry farmers living below the poverty line. Based on the results provided by this study, the gender implication of the impact of COVID-19 on the production and productivity of smallholder poultry farmers requires a more detailed investigation.
In view of the challenges observed during the pandemic and the unique characteristics of the smallholder poultry production system, there is a need to re-examine the smallholder poultry value chain (SPVC) along geographical regions. This has a possibility of identifying specific distinguishing nodes and actors for redefining the SPVC within the regions. It will also create new marketing channels and supply chains for improved efficiency within the production system.
Considering the role of local chickens during the COVID-19 pandemic, interventions aimed at improving smallholder poultry production systems through the availability of low-input high-output genetics should integrate the conservation and genetic improvement of local chickens. Poultry breeding schemes specific to smallholder poultry may require a considerable modification of the well-established, commercial-oriented breeding scheme set up to accommodate community-based breeding programmes.
Author Contributions
Conceptualization, O.B. and T.A.A.; methodology and design of survey, O.B.; implementation, O.B.; supervising data collection, O.B.; data curation, O.B.; formal analysis; O.B.; visualization, O.B.; writing—original draft preparation, O.B.; writing—review and editing, O.B. and T.A.A.; project proposal development, O.B. and T.A.A.; project administration, O.B. and T.A.A.; funding acquisition, T.A.A. and O.B. All authors have read and agreed to the published version of the manuscript.
Funding
This research was funded by the CGIAR Research Program for Agriculture for Nutrition and Health (A4NH) as part of the CGIAR COVID-19 Hub project in Nigeria.
Institutional Review Board Statement
The study was conducted according to the guidelines of the Declaration of Helsinki, and approved by the Institutional Review Committee of the CGIAR COVID-19 Hub Nigeria (ILRI Component, February 2021).
Informed Consent Statement
Informed consent was obtained from all the participants involved in the study.
Data Availability Statement
Datasets available on request from the corresponding author. Datasets are currently being processed prior to being publicly available at the International Livestock Research Institute (ILRI) dataset portal at https://data.ilri.org/portal/ (accessed on 15 June 2021).
Acknowledgments
The authors appreciate the team members of the African Chicken Genetic Gains (ACGG) project in Nigeria (E.B. Sonaiya, A.O. Adebambo, O. Bamidele, W.A.A. Hassan, A. Yakubu, U.E. Ogundu, F.O. Ajayi, and O. Alabi) and Tadelle Dessie (ACGG/TPGS program leader) for their support during the survey.
Conflicts of Interest
The authors declare no conflict of interest. The funders had no role in the design of the study; in the collection, analyses, or interpretation of data; in the writing of the manuscript, or in the decision to publish the results.
References
- Evans, K. Survey of 9000 Smallholders Finds COVID-19 Pandemic Is Causing Hunger. 2021. Available online: https://livestock.cgiar.org/news/survey-9000-smallholders-finds-covid-19-pandemic-causing-hunger (accessed on 3 August 2021).
- Middendorf, B.J.; Faye, A.; Middendorf, G.; Stewart, Z.P.; Jha, P.K.; Prasad, P.V.V. Smallholder farmer perceptions about the impact of COVID-19 on agriculture and livelihoods in Senegal. Agric. Syst. 2021, 190, 103108. [Google Scholar] [CrossRef]
- Guèye, E.F. The role of family poultry in poverty alleviation, food security and the promotion of gender equality in rural Africa. Outlook Agric. 2000, 29, 129–136. [Google Scholar] [CrossRef]
- Sonaiya, E.B. Poultry husbandry in small rural farms. Entwickl. Ländlicher Raum 1990, 4, 3–6. [Google Scholar]
- FAO. Chicken Genetic Resources Used in Smallholder Production Systems and Opportunities for Their Development; Sørensen, P., Ed.; Smallholder Poultry Production Paper No. 5; FAO: Rome, Italy, 2010; Available online: http://www.fao.org/3/al675e/al675e00.pdf (accessed on 20 May 2021).
- Gerber, P.J.; Steinfeld, H.; Henderson, B.; Mottet, A.; Opio, C.; Dijkman, J.; Falcucci, A.; Tempio, G. Tackling Climate Change through Livestock—A Global Assessment of Emissions and Mitigation Opportunities; FAO: Rome, Italy, 2013; Available online: http://www.fao.org/3/i3437e/i3437e.pdf (accessed on 14 July 2021).
- Bamidele, O.; Sonaiya, E.B.; Adebambo, O.A.; Dessie, T. On-station performance evaluation of improved tropically adapted chicken breeds for smallholder poultry production systems in Nigeria. Trop. Anim. Health Prod. 2020, 52, 1541–1548. [Google Scholar] [CrossRef] [PubMed] [Green Version]
- UNDP. Human Development Report 2006: Beyond Scarcity. Power, Poverty and the Global Water Crisis Technical Report; United Nations Development Programme: New York, NY, USA, 2006. [Google Scholar]
- Sonaiya, E. Family poultry, food security and the impact of HPAI. Worlds Poult. Sci. J. 2007, 63, 132–138. [Google Scholar] [CrossRef]
- Herrero, M. Improving Smallholder Poultry Productivity to 2050 in Nigeria. LiveGaps Factsheet. 2021. Available online: https://research.csiro.au/livegaps/wp-content/uploads/sites/37/2021/02/LiveGAPS-factsheet-Poultry-projections-Nigeria.pdf (accessed on 1 August 2021).
- Yakubu, A.; Bamidele, O.; Hassan, W.A.; Ajayi, F.O.; Ogundu, U.E.; Alabi, O.; Sonaiya, E.B.; Adebambo, O.A. Farmers’ choice of genotypes and trait preferences in tropically adapted chickens in five agro-ecological zones in Nigeria. Trop. Anim. Health Prod. 2020, 52, 95–107. [Google Scholar] [CrossRef] [PubMed] [Green Version]
- Alabi, O.O.; Ajayi, F.O.; Bamidele, O.; Yakubu, A.; Ogundu, E.U.; Sonaiya, E.B.; Ojo, M.A.; Hassan, W.A.; Adebambo, O.A. Impact assessment of improved chicken genetics on livelihoods and food security of smallholder poultry farmers in Nigeria. Livest. Res. Rural 2020, 32, 77. [Google Scholar]
- Dan-Nwafor, C.; Ochu, C.L.; Elimian, K.; Oladejo, J.; Ilori, E.; Umeokonkwo, C.; Steinhardt, L.; Igumbor, E.; Wagai, J.; Okwor, T.; et al. Nigeria’s public health response to the COVID-19 pandemic: January to May 2020. J. Glob. Health 2020, 10, 020399. [Google Scholar] [CrossRef] [PubMed]
- Akanni, L.O.; Gabriel, S.C. The Implication of Covid19 on the Nigerian Economy. Centre for the Study of the Economies of Africa (CSEA). 2020. Available online: http://cseaafrica.org/the-implication-of-covid19-on-the-nigerian-economy (accessed on 31 July 2021).
- Liverpool-Tasie, L.S.O.; Reardon, T.; Belton, B. “Essential non-essentials”: COVID-19 policy missteps in Nigeria rooted in persistent myths about African food supply chains. Appl. Econ. Perspect. Policy 2021, 43, 205–224. [Google Scholar] [CrossRef]
- Otache, I. The effects of the Covid-19 Pandemic on the Nigeria’s economy and possible coping strategies. Asian J. Soc. Sci. Manag. Stud. 2020, 7, 173–179. [Google Scholar] [CrossRef]
- Andam, K.; Edeh, H.; Oboh, V.; Pauw, K.; Thurlow, J. Impacts of COVID-19 on food systems and poverty in Nigeria. Adv. Food Secur. Sustain. 2020, 5, 145–173. [Google Scholar] [CrossRef]
- Tung, D.X.; Costales, A. Market Participation of Smallholder Poultry Producers in Northern Viet Nam. A Living from Livestock Research Report 1 RR Nr. 07-06. 2007. Available online: http://www.fao.org/3/bp288e/bp288e.pdf (accessed on 22 July 2021).
- FAO. Poultry in the 21st Century: Avian Influenza and Beyond. In Proceedings of the International Poultry Conference, Bangkok, Thailand, 5–7 November 2007; Thieme, O., Pilling, D., Eds.; Animal Production and Health Proceedings No. 9. FAO: Rome, Italy, 2008. Available online: http://www.fao.org/3/i0323e/i0323e00.htm (accessed on 25 July 2021).
- Pagani, P.; Abimiku, J.E.; Emeka-Okolie, W. Assessment of the Nigerian Poultry Market Chain to Improve Biosecurity; FAO: Abuja, Nigeria, 2008; Available online: http://www.fao.org/3/ak778e/ak778e.pdf (accessed on 27 July 2021).
- Alemayehu, T.; Bruno, J.; Poole, J.; Getachew, F.; Sonaiya, E.B.; Bamidele, O.; Adebambo, O.; Adeyinka, I.A.; Dessie, T. Household Baseline Data in Nigeria: Monitoring Delivery of Chicken Genetic Gains; ILRI Research Report 47; ILRI: Nairobi, Kenya, 2018; Available online: https://cgspace.cgiar.org/handle/10568/96559 (accessed on 2 July 2021).
- Ajayi, F.O.; Bamidele, O.; Hassan, W.A.; Ogundu, U.; Yakubu, A.; Alabi, O.O.; Akinsola, O.M.; Sonaiya, E.B.; Adebambo, O.A. Production performance and survivability of six dual-purpose breeds of chicken under smallholder farmers’ management practices in Nigeria. Arch. Anim. Breed. 2020, 63, 387–408. [Google Scholar] [CrossRef] [PubMed]
- FORMECU. The Assessment of Vegetation and Land Use Changes in Nigeria. In National Forest Reference Emission Level (FREL) for the Federal Republic of Nigeria; Geomatics International Inc. for Federal Department of Forestry: Abuja, Nigeria, 2019; Available online: https://redd.unfccc.int/files/2019_submission_frel_nigeria.pdf (accessed on 5 August 2021).
- African Chicken Genetic Gains. Available online: https://africacgg.net/ (accessed on 18 July 2021).
- Adepoju, P. Nigeria responds to COVID-19; first case detected in sub-Saharan Africa. Nat. Med. 2020, 26, 444–448. [Google Scholar] [CrossRef] [PubMed] [Green Version]
- MapCustomizer. Available online: https://www.mapcustomizer.com/map/Covid-19%20Impact%20assessment%20survey%20NG (accessed on 6 August 2021).
- Ott, L.R.; Longnecker, M. An Introduction to Statistical Methods and Data Analysis, 5th ed.; Thomson Learning: Pacific Grove, CA, USA, 2001; pp. 308–677. [Google Scholar]
- R Core Team. R: A Language and Environment for Statistical Computing; R Foundation for Statistical Computing: Vienna, Austria, 2020; Available online: https://www.R-project.org/ (accessed on 10 June 2021).
- Central Bank of Nigeria. Available online: https://www.cbn.gov.ng/rates/ExchRateByCurrency.asp (accessed on 22 June 2021).
- World Bank. Principles and Practice in Measuring Global Poverty. 2016. Available online: https://www.worldbank.org/en/news/feature/2016/01/13/principles-and-practice-in-measuring-global-poverty (accessed on 25 June 2021).
- FEWSNET. Revised Livelihoods Zone Map and Descriptions for Nigeria. 2018. Available online: https://fews.net/sites/default/files/documents/reports/Nigeria_LH_zoning_report_09_2018.pdf (accessed on 28 July 2021).
- Herrero, M. Poultry Production in Nigeria. LiveGaps Factsheet. 2021. Available online: https://research.csiro.au/livegaps/findings/livestock-production/poultry-production-in-nigeria (accessed on 1 August 2021).
- Babatunde, R.O.; Omotosho, O.A.; Sholotan, O.S. Factors influencing food security status of rural farming households in North Central Nigeria. Agric. J. 2007, 2, 351–357. [Google Scholar]
- Columbus, O. African cultural values and inter-communal relations: The case with Nigeria. Dev. Ctry. Stud. 2014, 4, 208–217. Available online: https://core.ac.uk/download/pdf/234682106.pdf (accessed on 29 July 2021).
- NDHS. Nigeria Demographic and Health Survey 2018; NPC: Abuja, Nigeria; ICF: Rockville, MD, USA, 2018; Available online: https://dhsprogram.com/pubs/pdf/FR359/FR359.pdf (accessed on 2 August 2021).
- Birhanu, M.Y.; Alemayehu, T.; Bruno, J.E.; Kebede, F.G.; Sonaiya, E.B.; Goromela, E.H.; Bamidele, O.; Dessie, T. Technical Efficiency of Traditional Village Chicken Production in Africa: Entry Points for Sustainable Transformation and Improved Livelihood. Sustainability 2021, 13, 8539. [Google Scholar] [CrossRef]
- Mberu, B.U. Household structure and living conditions in Nigeria. J. Marriage Fam. 2007, 69, 513–527. Available online: http://www.jstor.org/stable/4622453 (accessed on 30 July 2021). [CrossRef]
- Makiwane, M.; Kaunda, C.J. Families and Inclusive Societies in Africa. 2018. Available online: https://www.un.org/development/desa/family/wp-content/uploads/sites/23/2018/05/1-2.pdf (accessed on 30 July 2021).
- UNICEF. Pregnant Mothers and Babies Born during COVID-19 Pandemic Threatened by Strained Health Systems and Disruptions in Services. Press Release. 2021. Available online: https://www.unicef.org/press-releases/pregnant-mothers-and-babies-born-during-covid-19-pandemic-threatened-strained-health (accessed on 10 July 2021).
- Adekunle, C.P.; Akinbode, S.O.; Shittu, A.M.; Momoh, S. Food price changes and farm households’ welfare in Nigeria: Direct and indirect approach. J. Appl. Econ. 2020, 23, 409–425. [Google Scholar] [CrossRef]
- National Bureau of Statistics. Consumer Price Index (CPI) January 2021. 2021. Available online: http://statistics.gov.rw/publication/consumer-price-index-cpi-january-2021 (accessed on 27 July 2021).
- Lain, J.; Vishwanath, T. Tackling Poverty in Multiple Dimensions: A Proving Ground in Nigeria? World Bank Blogs. 2021. Available online: https://blogs.worldbank.org/opendata/tackling-poverty-multiple-dimensions-proving-ground-nigeria (accessed on 5 July 2021).
- World Bank. Poverty and Equity Brief. Nigeria. 2021. Available online: https://databank.worldbank.org/data/download/poverty/987B9C90-CB9F-4D93-AE8C-750588BF00QA/SM2021/Global_POVEQ_NGA.pdf (accessed on 15 July 2021).
- Akindele, S.A. COVID-19: 10.9 Million More Nigerians to Fall into Poverty by 2022. 2020. Available online: https://www.premiumtimesng.com/business/business-news/431566-covid-19-10-9-million-more-nigerians-to-fall-into-poverty22-by-2022-world-bank.html (accessed on 4 August 2021).
- Joseph-Raji, G.A.; Saldarriaga, N.M.A.; Hernandez-Ore, M.A.; Timmis, E.; Ogebe, J.O.; Rostom, A.M.T.; Cortes, M.; Kojima, M.; Okou, C.I.F.; Jenq, C.; et al. Rising to the Challenge: Nigeria’s COVID Response (English); Nigeria Development Update; World Bank Group: Washington, DC, USA, 2020; Available online: http://documents.worldbank.org/curated/en/152691607607461391/Rising-to-the-Challenge-Nigerias-COVID-Response (accessed on 7 August 2021).
- Anyanwu, J.C. Rural poverty in Nigeria: Profile, determinants and exit paths. Afri. Dev. Rev. 2005, 17, 435–460. [Google Scholar] [CrossRef]
- Anyanwu, J.C. Marital Status, Household Size and Poverty in Nigeria: Evidence from the 2009/2010 Survey Data Working Paper Series; No. 180; AfDB: Tunis, Tunisia, 2013; Available online: https://www.afdb.org/sites/default/files/documents/publications/working_paper_180_-_marital_status-_household_size_and_poverty_in_nigeria-_evidence_from_the_2009-2010_survey_data.pdf (accessed on 31 July 2021).
- Akinola, L.; Essien, A. Relevance of rural poultry production in developing countries with special reference to Africa. Worlds Poult. Sci. J. 2011, 67, 697–705. [Google Scholar] [CrossRef]
- Wong, J.T.; de Bruyn, J.; Bagnol, B.; Grieve, H.; Li, M.; Pym, R.; Alders, R.G. Small-scale poultry and food security in resource-poor settings: A review. Glob. Food Sec. 2017, 15, 43–52. [Google Scholar] [CrossRef]
- Heinz, G.; Hautzinger, P. Meat Processing Technology for Small-to Medium Scale Producers. Food and Agriculture Organization of the United Nations Regional Office for Asia and the Pacific. 2007. Available online: http://www.fao.org/3/ai407e/ai407e.pdf (accessed on 27 September 2021).
- Drewnowski, A. The nutrient rich foods index helps to identify healthy, affordable foods. Am. J. Clin. Nutr. 2010, 91, 1095S–1101S. [Google Scholar] [CrossRef] [PubMed]
- Hetherington, J.B.; Wiethoelter, A.K.; Negin, J.; Mor, S.M. Livestock ownership, animal source foods and child nutritional outcomes in seven rural village clusters in Sub-Saharan Africa. Agric. Food Secur. 2017, 6, 9. [Google Scholar] [CrossRef] [Green Version]
Publisher’s Note: MDPI stays neutral with regard to jurisdictional claims in published maps and institutional affiliations. |
© 2021 by the authors. Licensee MDPI, Basel, Switzerland. This article is an open access article distributed under the terms and conditions of the Creative Commons Attribution (CC BY) license (https://creativecommons.org/licenses/by/4.0/).