Investor Inattention to All-Cash Acquisition Announcements: A Joint Day-Time Analysis in the Spanish Market


Abstract
1. Introduction
2. Literature Review and Hypotheses to Test
3. Sample
3.1. Sample Selection
- The exact time of the official acquisition announcement must appear on the CNMV website.
- No other overlapping acquisition announcement must exist by the same firm during the 120 trading days prior to the event day (t0).
- No other contaminating event must exist in the five days prior to and after the event day that may affect the target firm’s price, such as dividend payments, profit announcements or stock splits.
- The selected acquirers are those for which data on the method of payment and the listing status of the target firm were available.
3.2. Sample Characteristics
- −
- Acquirer market value: This variable is defined as the market value of the acquirer’s common stock 20 trading days prior to the acquisition announcement date (in millions of euros).
- −
- Acquirer total assets: The acquirer’s total assets in the most recent December prior to the acquisition announcement date (in millions of euros).
- −
- Acquirer return on assets ratio (ROA): The acquirer’s ROA is defined as the Earnings Before Interest, Taxes, Depreciation and Amortization (EBITDA) divided by the acquiring firm’s total assets at the end of the year prior to the acquisition announcement date.
- −
- Acquirer market-to-book ratio (MTB): The market-to-book ratio is defined as the market value of the acquirer’s common stock 20 trading days prior to the acquisition announcement date divided by the book value of the acquirer’s common stock at the end of the year prior to the acquisition announcement date.
- −
- Target total assets: The target firm’s total assets in the most recent December prior to the acquisition announcement date (in millions of euros).
- −
- Relative size of the target: This variable is computed as the target’s total assets divided by the acquirer’s total assets in the most recent December prior to the acquisition announcement date.
- −
- Public: This is a binary variable taking the value one if the target firm is a listed company and zero otherwise.
- −
- Diversified acquisition: This is a binary variable taking the value one if the two merging partners are in the same two-digit CNAE code (Spanish SIC codes) and zero otherwise.
- −
- Cross-border acquisition: This is a binary variable taking the value one if the target firm is foreign and zero otherwise.
4. Methodology
4.1. Abnormal Return Estimation
4.2. Abnormal Trading Activity Estimation
4.3. Multivariate Analysis of the Differential Market Reaction to Friday Announcements
5. Univariate Results
5.1. Abnormal Returns
5.2. Market Trading Volume by Day of the Week
5.3. Abnormal Trading Volume
6. Differential Market Reaction to Friday Announcements: Multivariate Analysis
6.1. Abnormal Return Multivariate Analysis
6.2. Abnormal Trading-Volume Multivariate Analysis
7. Conclusions
Author Contributions
Funding
Institutional Review Board Statement
Informed Consent Statement
Data Availability Statement
Acknowledgments
Conflicts of Interest
References
- DellaVigna, S.; Pollet, J.M. Investor inattention and Friday earnings announcements. J. Financ. 2009, 64, 709–749. [Google Scholar] [CrossRef]
- DeHaan, E.; Shevlin, T.; Thornock, J. Market (in) attention and the strategic scheduling and timing of earnings announcements. J. Account. Econ. 2015, 60, 36–55. [Google Scholar] [CrossRef]
- Michaely, R.; Rubin, A.; Vedrashko, A. Further evidence on the strategic timing of earnings news: Joint analysis of weekdays and times of day. J. Account. Econ. 2016, 62, 24–45. [Google Scholar] [CrossRef]
- Louis, H.; Sun, A. Investor inattention and the market reaction to merger announcements. Manag. Sci. 2010, 56, 1781–1793. [Google Scholar] [CrossRef]
- Adra, S.; Barbopoulos, L.G. The valuation effects of investor attention in stock-financed acquisitions. J. Empir. Financ. 2018, 45, 108–125. [Google Scholar] [CrossRef]
- Reyes, T. Limited attention and M&A announcements. J. Empir. Financ. 2018, 49, 201–222. [Google Scholar]
- Siganos, A. The daylight saving time anomaly in relation to firms targeted for mergers. J. Bank. Financ. 2019, 105, 36–43. [Google Scholar] [CrossRef]
- Michaely, R.; Rubin, A.; Vedrashko, A. Are Friday announcements special? Overcoming selection bias. J. Financ. Econ. 2016, 122, 65–85. [Google Scholar] [CrossRef]
- Autore, D.; Jiang, D. The preholiday corporate announcement effect. J. Financ. Mark. 2019, 45, 61–82. [Google Scholar] [CrossRef]
- Ben-Rephael, A.; Da, Z.; Israelsen, R.D. It depends on where you search: Institutional investor attention and underreaction to news. Rev. Financ. Stud. 2017, 30, 3009–3047. [Google Scholar] [CrossRef]
- Martynova, M.; Renneboog, L. A century of corporate takeovers: What have we learned and where do we stand? J. Bank. Financ. 2008, 32, 2148–2177. [Google Scholar] [CrossRef]
- Chang, S. Takeovers of privately held targets, methods of payment, and bidder returns. J. Financ. 1998, 53, 773–784. [Google Scholar] [CrossRef]
- Fuller, K.; Netter, J.; Stegemoller, M. What do returns to acquiring firms tell us? Evidence from firms that make many acquisitions. J. Financ. 2002, 57, 1763–1793. [Google Scholar] [CrossRef]
- Moeller, S.; Schlingemann, F.; Stulz, R. Firm size and the gains from acquisitions. J. Financ. Econ. 2004, 73, 201–228. [Google Scholar] [CrossRef]
- Farinós Viñas, J.E.; Herrero, B.; Latorre Guillem, M.A. The Decision to Acquire Listed vs. Unlisted Firms: Determinants and Value Effects in the Spanish Stock Market. Rev. Econ. Apl. 2017, 73, 55–94. [Google Scholar]
- Farinós, J.E.; Herrero, B.; Latorre, M.A. Self-selection bias and the listing status of target firms: Value effects in the Spanish market. Czech J. Econ. Financ. 2017, 67, 423–438. [Google Scholar]
- Farinós, J.E.; Herrero, B.; Latorre, M.A. Market valuation and acquiring firm performance in the short and long term: Out-of-sample evidence from Spain. Bus. Res. Q. 2020, 23, 1–14. [Google Scholar] [CrossRef]
- Kahneman, D. Attention and Effort; Prentice-Hall: Englewood Cliffs, NJ, USA, 1973; Volume 1063. [Google Scholar]
- Barber, B.M.; Odean, T. All that glitters: The effect of attention and news on the buying behavior of individual and institutional investors. Rev. Financ. Stud. 2008, 21, 785–818. [Google Scholar] [CrossRef]
- Pashler, H.E. The Psychology of Attention; MIT Press: Cambridge, MA, USA, 1999. [Google Scholar]
- Peng, L.; Xiong, W. Investor attention, overconfidence and category learning. J. Financ. Econ. 2006, 80, 563–602. [Google Scholar] [CrossRef]
- Peng, L.; Xiong, W.; Bollerslev, T. Investor attention and time-varying comovements. Eur. Financ. Manag. 2007, 13, 394–422. [Google Scholar] [CrossRef]
- Reyes, T. Negativity bias in attention allocation: Retail investors’ reaction to stock returns. Int. Rev. Financ. 2019, 19, 155–189. [Google Scholar] [CrossRef]
- Kudryavtsev, A. Effect of investor inattention on price drifts following analyst recommendation revisions. Int. J. Financ. Econ. 2019, 24, 348–360. [Google Scholar] [CrossRef]
- Peress, J.; Schmidt, D. Glued to the TV Distracted Noise Traders and Stock Market Liquidity. J. Financ. 2020, 75, 1083–1133. [Google Scholar] [CrossRef]
- Daniel, K.; Hirshleifer, D.; Teoh, S.H. Investor psychology in capital markets: Evidence and policy implications. J. Monet. Econ. 2002, 49, 139–209. [Google Scholar] [CrossRef]
- Miller, E.M. Risk, uncertainty, and divergence of opinion. J. Financ. 1977, 32, 1151–1168. [Google Scholar] [CrossRef]
- Gervais, S.; Kaniel, R.; Mingelgrin, D.H. The high-volume return premium. J. Financ. 2001, 56, 877–919. [Google Scholar] [CrossRef]
- Glasner, J. And now, for those other deals. Wired. 2000. Available online: https://www.wired.com/2000/01/and-now-for-those-other-deals/ (accessed on 22 May 2020).
- Hood, M.; Lesseig, V. Investor inattention around stock market holidays. Financ. Res. Lett. 2017, 23, 217–222. [Google Scholar] [CrossRef]
- Padungsaksawasdi, C.; Treepongkaruna, S.; Brooks, R. Investor attention and stock market activities: New evidence from panel data. Int. J. Financ. Stud. 2019, 7, 30. [Google Scholar] [CrossRef]
- Capron, L.; Shen, J.C. Acquisitions of private vs. public firms: Private information, target selection, and acquirer returns. Strat. Manag. J. 2007, 28, 891–911. [Google Scholar] [CrossRef]
- Feito-Ruiz, I.; Fernández, A.I.; Menéndez-Requejo, S. Determinants of the acquisition of listed versus unlisted firms in different legal and institutional environments. Appl. Econ. 2014, 46, 2814–2832. [Google Scholar] [CrossRef]
- Hirshleifer, D.; Lim, S.S.; Teoh, S.H. Driven to distraction: Extraneous events and underreaction to earnings news. J. Financ. 2009, 64, 2289–2325. [Google Scholar] [CrossRef]
- Latorre, M.A.; Herrero, B.; Farinós, J.E. Do acquirers’ stock prices fully react to the acquisition announcement of listed versus unlisted target firms? Out-of-sample evidence from Spain. Appl. Econ. Lett. 2014, 21, 1075–1078. [Google Scholar] [CrossRef]
- Draper, P.; Paudyal, K. Acquisitions: Private versus public. Eur. Financ. Manag. 2006, 12, 57–80. [Google Scholar] [CrossRef]
- Petmezas, D. What drives acquisitions? Market valuations and bidder performance. J. Multinatl. Financ. Manag. 2009, 19, 54–74. [Google Scholar] [CrossRef]
- Martynova, M.; Renneboog, L. The performance of the European market for corporate control: Evidence from the fifth takeover wave. Eur. Financ. Manag. 2011, 17, 208–259. [Google Scholar] [CrossRef]
- Meneu, V.; Pardo, A. Pre-holiday effect, large trades and small investor behaviour. J. Empir. Financ. 2004, 11, 231–246. [Google Scholar] [CrossRef]


| Full Sample | Listed Targets | Unlisted Targets | |
|---|---|---|---|
| Total | 305 | 93 | 212 |
| By Method of Payment | |||
| Cash | 268 | 73 | 195 |
| Stock + Mixed | 37 | 20 | 17 |
| Full Sample | Listed Target Firms | Unlisted Target Firms | ||||||||||
|---|---|---|---|---|---|---|---|---|---|---|---|---|
| Pre-Market | During-Trading | Post-Market | Total on Weekday | Pre-Market | During-Trading | Post-Market | Total on Weekday | Pre-Market | During-Trading | Post-Market | Total on Weekday | |
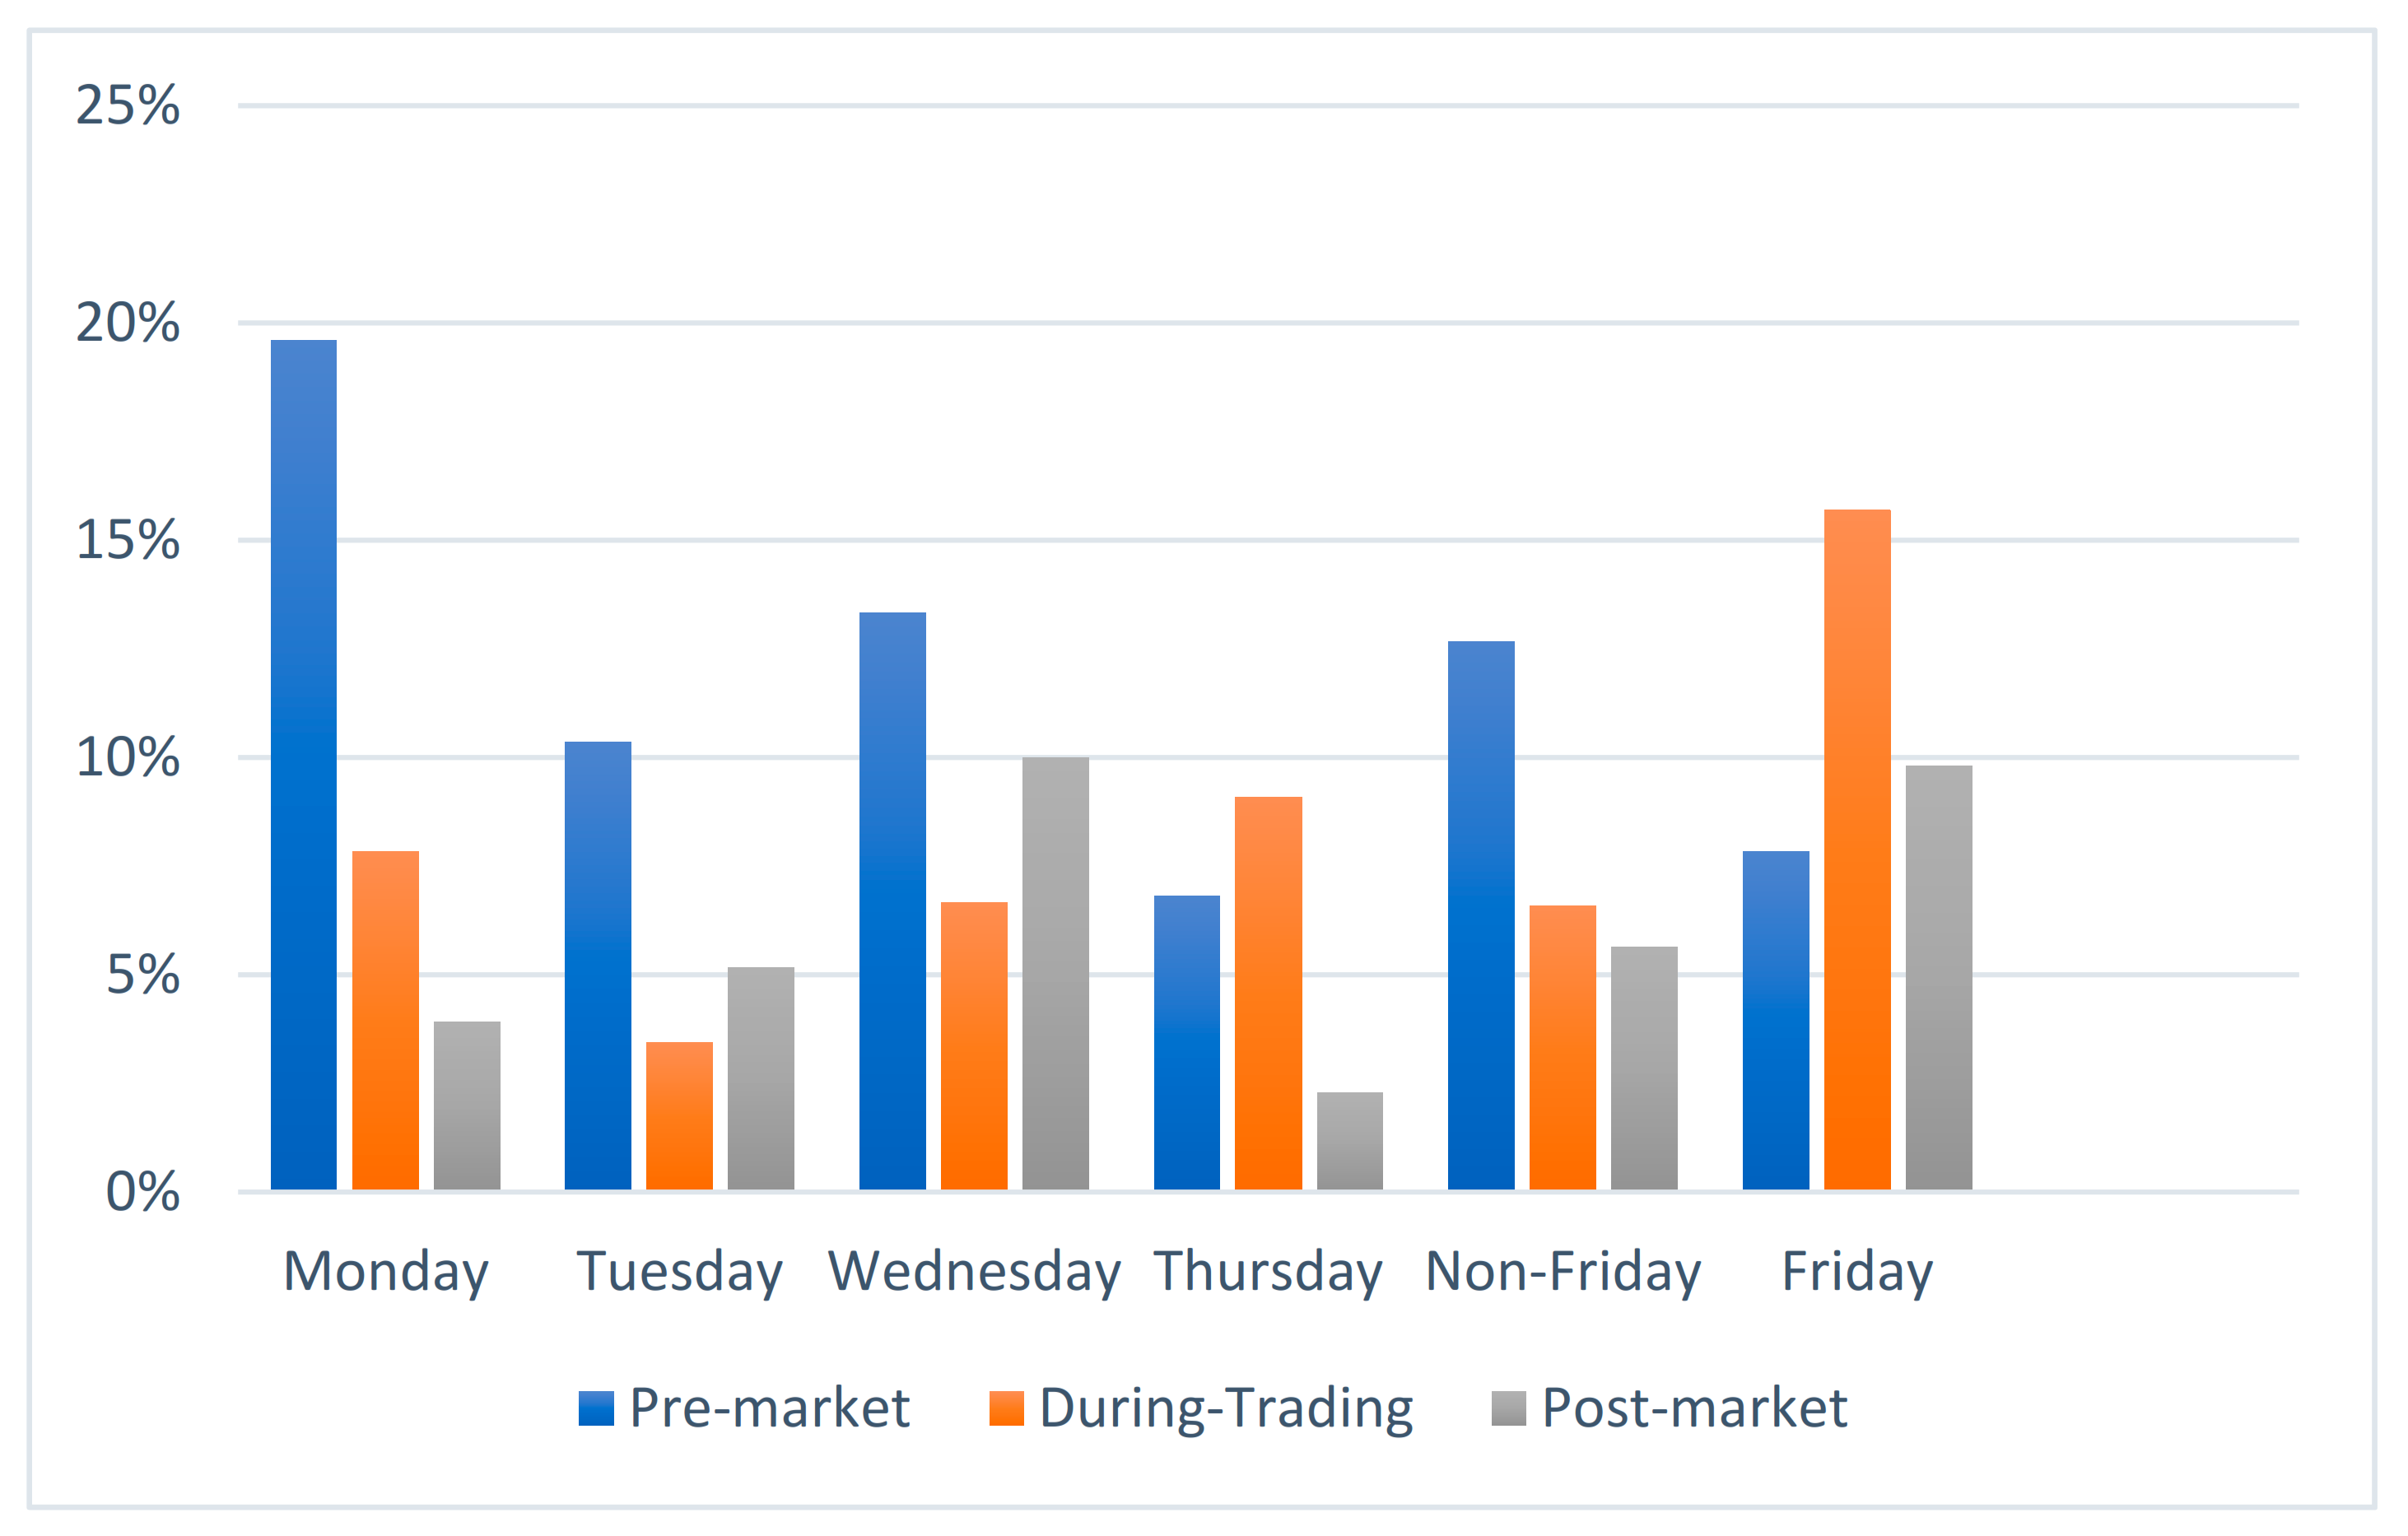
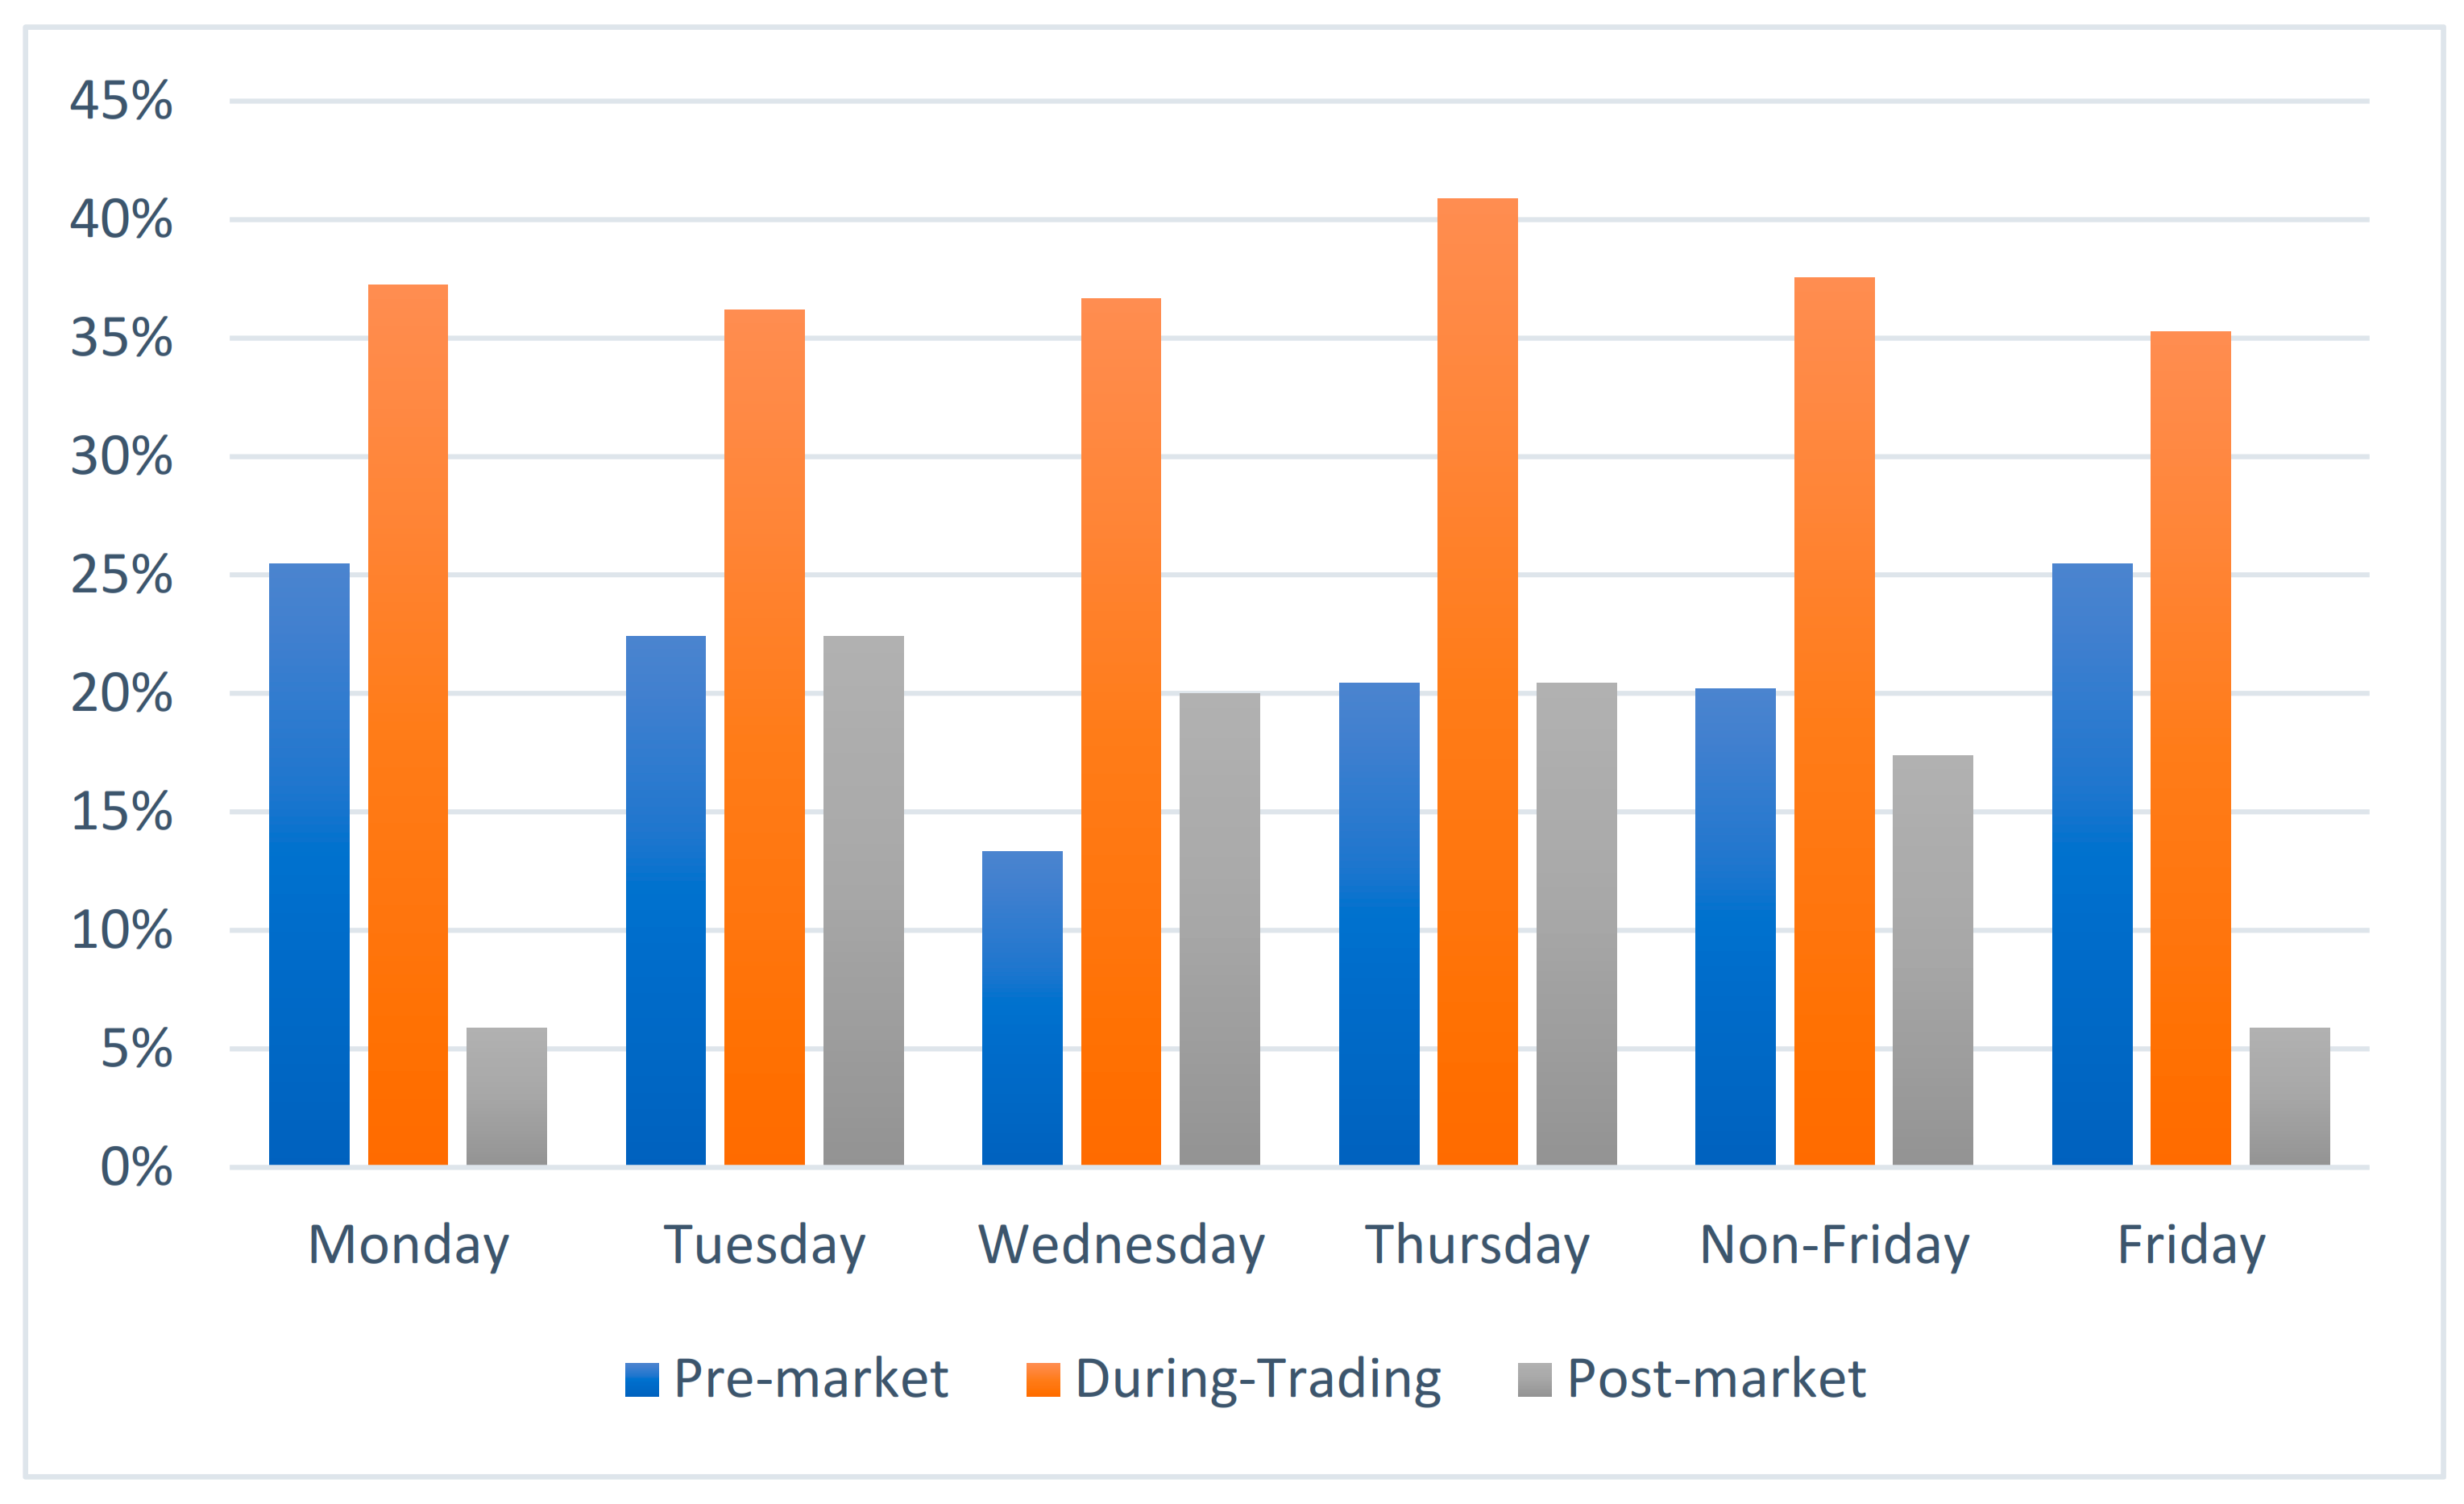
| Monday | 23 | 23 | 5 | 51 | 10 | 4 | 2 | 16 | 13 | 19 | 3 | 35 |
| % of observations | 45.10 | 45.10 | 9.80 | 100.00 | 19.61 | 7.84 | 3.92 | 31.37 | 25.49 | 37.25 | 5.88 | 68.63 |
| Tuesday | 19 | 23 | 16 | 58 | 6 | 2 | 3 | 11 | 13 | 21 | 13 | 47 |
| % of observations | 32.76 | 39.66 | 27.59 | 100.00 | 10.34 | 3.45 | 5.17 | 18.97 | 22.41 | 36.21 | 22.41 | 81.03 |
| Wednesday | 16 | 26 | 18 | 60 | 8 | 4 | 6 | 18 | 8 | 22 | 12 | 42 |
| % of observations | 26.67 | 43.33 | 30.00 | 100.00 | 13.33 | 6.67 | 10.00 | 30.00 | 13.33 | 36.67 | 20.00 | 70.00 |
| Thursday | 12 | 22 | 10 | 44 | 3 | 4 | 1 | 8 | 9 | 18 | 9 | 36 |
| % of observations | 27.27 | 50.00 | 22.73 | 100.00 | 6.82 | 9.09 | 2.27 | 18.18 | 20.45 | 40.91 | 20.45 | 81.82 |
| Non-Friday | 70 | 94 | 49 | 213 | 27 | 14 | 12 | 53 | 43 | 80 | 37 | 160 |
| % of observations | 32.86 | 44.13 | 23.00 | 100.00 | 12.68 | 6.57 | 5.63 | 24.88 | 20.19 | 37.56 | 17.37 | 75.12 |
| Friday | 17 | 26 | 8 | 51 | 4 | 8 | 5 | 17 | 13 | 18 | 3 | 34 |
| % of observations | 33.33 | 50.98 | 15.69 | 100.00 | 7.84 | 15.69 | 9.80 | 33.33 | 25.49 | 35.29 | 5.88 | 66.67 |
| Weekend | 4 | 4 | 3 | 3 | 1 | 1 | ||||||
| % of observations | 100.00 | 100.00 | 100.00 | 100.00 | 100.00 | 100.00 | ||||||
| Total in time-of-day slots | 87 | 120 | 61 | 268 | 31 | 22 | 20 | 73 | 56 | 98 | 41 | 195 |
| Non-Friday Announcements | Friday Announcements | Friday−Non-Friday | |
|---|---|---|---|
| Panel A: Full sample | |||
| Acquirer market value | 6961.01 | 9258.63 | 2297.62 |
| {213} | {55} | (0.390) | |
| Acquirer total assets | 30,711.14 | 63,536.21 | 32,825.07 |
| {213} | {55} | (0.223) | |
| Acquirer ROA | 4.4906 | 5.4147 | 0.9241 |
| {211} | {53} | (0.291) | |
| Acquirer MTB | 1.4759 | 3.0216 | 1.5456 |
| {202} | {51} | (0.211) | |
| Target total assets | 4642.87 | 17,220.37 | 12,577.50 |
| {125} | {18} | (0.120) | |
| Relative size of the target | 0.4032 | 0.7220 | 0.3188 |
| {125} | {18} | (0.211) | |
| Public | 0.2500 | 0.3585 | 0.1085 |
| {213} | {55} | (0.141) | |
| Diversified acquisition | 0.1557 | 0.1321 | −0.0236 |
| {213} | {55} | (0.659) | |
| Cross-border acquisition | 0.5849 | 0.6038 | 0.0189 |
| {213} | {55} | (0.804) | |
| Panel B: Acquisition announcements of listed targets | |||
| Acquirer market value | 13,406.86 | 18,840.47 | 5433.61 |
| {53} | {20} | (0.432) | |
| Acquirer total assets | 59,024.32 | 137,764.40 | 78,740.08 |
| {53} | {20} | (0.256) | |
| Acquirer ROA | 4.7921 | 4.8637 | 0.07161 |
| {53} | {19} | (0.935) | |
| Acquirer MTB | 2.4845 | 1.7876 | −0.6969 |
| {51} | {17} | (0.020) | |
| Target total assets | 7256.11 | 36,294.07 | 29,037.97 |
| {27} | {8} | (0.186) | |
| Relative size of the target | 0.5645 | 0.5104 | −0.0541 |
| {27} | {8} | (0.767) | |
| Diversified acquisition | 0.0566 | 0.1053 | 0.0487 |
| {53} | {20} | (0.544) | |
| Cross-border acquisition | 0.7925 | 0.7368 | −0.0556 |
| {53} | {20} | (0.641) | |
| Panel C: Acquisition announcements of unlisted targets | |||
| Acquirer market value | 4812.40 | 3904.07 | −908.32 |
| {160} | {35} | (0.477) | |
| Acquirer total assets | 21,273.42 | 22,055.75 | 782.34 |
| {160} | {35} | (0.958) | |
| Acquirer ROA | 4.3894 | 5.7226 | 1.3332 |
| {158} | {34} | (0.288) | |
| Acquirer MTB | 1.1353 | 3.6385 | 2.5032 |
| {151} | {34} | (0.148) | |
| Target total assets | 3889.90 | 1961.41 | −1928.49 |
| {98} | {10} | (0.206) | |
| Relative size of the target | 0.3567 | 0.8913 | 0.5346 |
| {98} | {10} | (0.233) | |
| Diversified acquisition | 0.1887 | 0.1471 | −0.0416 |
| {160} | {35} | (0.549) | |
| Cross-border acquisition | 0.5157 | 0.5294 | 0.0137 |
| {160} | {35} | (0.887) | |
| Announcement Day | Listed Target | N | Unlisted Target | N |
|---|---|---|---|---|
| All days | −0.02 | 72 | 0.87 | 193 |
| (0.940) | (0.000) | |||
| Monday | −0.14 | 16 | 0.79 | 35 |
| (0.817) | (0.030) | |||
| Tuesday | −0.67 | 11 | 1.20 | 47 |
| (0.438) | (0.000) | |||
| Wednesday | 0.14 | 18 | 0.84 | 42 |
| (0.845) | (0.023) | |||
| Thursday | −0.52 | 8 | 1.18 | 35 |
| (0.623) | (0.004) | |||
| All non-Friday | −0.21 | 53 | 1.01 | 159 |
| (0.565) | (0.000) | |||
| Friday | −0.52 | 19 | 0.20 | 34 |
| (0.472) | (0.506) | |||
| Friday—non-Friday | 0.71 | −0.81 | ||
| (0.364) | (0.021) |
| Pre-Market (1) | During-Trading (2) | Post-Market (3) | (1)–(2) | (3)–(2) | |
|---|---|---|---|---|---|
| Panel A: Listed Target Firms | |||||
| All days | 0.12 | −0.41 | 0.03 | 0.53 | 0.44 |
| p-value | (0.805) | (0.572) | (0.963) | (0.541) | (0.632) |
| N | 36 | 16 | 20 | ||
| All non-Friday | −0.14 | −1.09 | 0.33 | 0.95 | 1.42 |
| p-value | (0.754) | (0.240) | (0.717) | (0.345) | (0.268) |
| N | 31 | 10 | 12 | ||
| Friday | 1.72 | 0.72 | −0.44 | 1.01 | −1.16 |
| p-value | (0.468) | (0.569) | (0.265) | (0.696) | (0.385) |
| N | 5 | 6 | 8 | ||
| Friday—non-Friday | 1.86 | 1.81 | −0.77 | ||
| p-value | (0.441) | (0.244) | (0.440) | ||
| Panel B: Unlisted Target Firms | |||||
| All days | 1.35 | 0.32 | 1.23 | 1.02 | 0.91 |
| p-value | (0.000) | (0.085) | (0.001) | (0.004) | (0.025) |
| N | 66 | 86 | 41 | ||
| All non-Friday | 1.63 | 0.47 | 1.17 | 1.16 | 0.70 |
| p-value | (0.000) | (0.037) | (0.004) | (0.004) | (0.112) |
| N | 52 | 70 | 37 | ||
| Friday | 0.29 | −0.29 | 1.83 | 0.58 | 2.12 |
| p-value | (0.614) | (0.240) | (0.152) | (0.353) | (0.120) |
| N | 14 | 16 | 4 | ||
| Friday—non-Friday | −1.34 | −0.76 | 0.67 | ||
| p-value | (0.052) | (0.024) | (0.553) | ||
| Monday | Tuesday | Wednesday | Thursday | Non-Friday | N | |
|---|---|---|---|---|---|---|
| vs. | ||||||
| Monday | 1039 | |||||
| Tuesday | −1715.04 a | 1035 | ||||
| Wednesday | −2585.27 a | −870.23 b | 1038 | |||
| Thursday | −2308.16 a | −593.12 c | 277.11 | 1050 | ||
| Friday | −2723.51 a | −1008.47 a | −138.24 | −415.35 | −1069.94 a | 1029 |
| Announcement Day | Listed Target | N | Unlisted Target | N |
|---|---|---|---|---|
| All days | 0.148 | 66 | 0.133 | 170 |
| (0.000) | (0.000) | |||
| Monday | 0.197 | 16 | 0.168 | 31 |
| (0.000) | (0.013) | |||
| Tuesday | 0.257 | 9 | 0.127 | 43 |
| (0.061) | (0.026) | |||
| Wednesday | 0.082 | 16 | 0.173 | 37 |
| (0.267) | (0.023) | |||
| Thursday | 0.258 | 7 | 0.119 | 31 |
| (0.069) | (0.008) | |||
| All non-Friday | 0.179 | 48 | 0.146 | 142 |
| (0.000) | (0.000) | |||
| Friday | 0.064 | 18 | 0.068 | 28 |
| (0.326) | (0.188) | |||
| Friday—non-Friday | −0.115 | −0.078 | ||
| (0.134) | (0.189) |
| Pre-Market (1) | During-Trading (2) | Post-Market (3) | (1)–(2) | (3)–(2) | |
|---|---|---|---|---|---|
| Panel A: Listed target firms | |||||
| All days | 0.189 | 0.074 | 0.139 | 0.115 | 0.065 |
| p-value | (0.000) | (0.342) | (0.061) | (0.193) | (0.528) |
| N | 31 | 15 | 20 | ||
| All non-Friday | 0.177 | 0.108 | 0.241 | 0.069 | 0.133 |
| p-value | (0.000) | (0.292) | (0.028) | (0.529) | (0.342) |
| N | 26 | 10 | 12 | ||
| Friday | 0.250 | 0.004 | −0.014 | 0.246 | −0.018 |
| p-value | (0.142) | (0.974) | (0.860) | (0.217) | (0.903) |
| N | 5 | 5 | 8 | ||
| Friday—non-Friday | 0.072 | −0.104 | −0.255 | ||
| p-value | (0.637) | (0.519) | (0.052) | ||
| Panel B: Unlisted target firms | |||||
| All days | 0.188 | 0.084 | 0.139 | 0.104 | 0.055 |
| p-value | (0.000) | (0.038) | (0.017) | (0.088) | (0.423) |
| N | 60 | 71 | 39 | ||
| All non-Friday | 0.185 | 0.118 | 0.143 | 0.067 | 0.025 |
| p-value | (0.001) | (0.010) | (0.027) | (0.339) | (0.743) |
| N | 47 | 60 | 35 | ||
| Friday | 0.198 | −0.099 | 0.109 | 0.297 | 0.208 |
| p-value | (0.020) | (0.170) | (0.186) | (0.007) | (0.048) |
| N | 13 | 11 | 4 | ||
| Friday—non-Friday | 0.012 | −0.217 | −0.034 | ||
| p-value | (0.895) | (0.014) | (0.706) | ||
| Full Sample | Listed Targets | Unlisted Targets | ||||
|---|---|---|---|---|---|---|
| Coef. | p-Value | Coef. | p-Value | Coef. | p-Value | |
| Intercept | 0.0118 | 0.084 | 0.0009 | 0.943 | 0.0249 | 0.001 |
| FRIDAY | −0.0050 | 0.115 | 0.0009 | 0.895 | −0.0081 | 0.021 |
| PRIVATE | 0.0100 | 0.003 | – | – | – | – |
| LSIZE | −0.0017 | 0.023 | −0.0003 | 0.864 | −0.0021 | 0.015 |
| ROA | 0.0000 | 0.826 | 0.0004 | 0.681 | 0.0001 | 0.623 |
| MTB | 0.0000 | 0.578 | −0.0017 | 0.595 | 0.0000 | 0.290 |
| DIVER | −0.0064 | 0.047 | −0.0150 | 0.167 | −0.0052 | 0.129 |
| CROSS | 0.0016 | 0.598 | 0.0015 | 0.828 | 0.0019 | 0.569 |
| Adj. R2 | 0.087 | 0.0255 | 0.066 | |||
| N | 253 | 68 | 185 | |||
| Full Sample | Listed Targets | Unlisted Targets | ||||
|---|---|---|---|---|---|---|
| Coef. | p-Value | Coef. | p-Value | Coef. | p-Value | |
| Panel A: Pre-market | ||||||
| Intercept | 0.0250 | 0.066 | 0.0064 | 0.736 | 0.0507 | 0.006 |
| FRIDAY | −0.0095 | 0.125 | 0.0041 | 0.699 | −0.0126 | 0.061 |
| PRIVATE | 0.0130 | 0.014 | – | – | – | – |
| LSIZE | −0.0023 | 0.111 | −0.0009 | 0.720 | −0.0039 | 0.059 |
| ROA | −0.0001 | 0.732 | −0.0005 | 0.719 | 0.0000 | 0.913 |
| MTB | 0.0000 | 0.946 | 0.0021 | 0.507 | 0.0000 | 0.773 |
| DIVER | −0.0104 | 0.062 | −0.0160 | 0.283 | −0.0108 | 0.144 |
| CROSS | −0.0064 | 0.201 | −0.0048 | 0.663 | −0.0092 | 0.182 |
| Adj. R2 | 0.188 | 0.064 | 0.166 | |||
| N | 96 | 33 | 63 | |||
| Panel B: During-trading | ||||||
| Intercept | −0.0038 | 0.695 | −0.0472 | 0.180 | 0.0096 | 0.316 |
| FRIDAY | −0.0030 | 0.506 | 0.0035 | 0.836 | −0.0075 | 0.019 |
| PRIVATE | 0.0097 | 0.184 | – | – | – | – |
| LSIZE | −0.0009 | 0.503 | 0.0045 | 0.287 | −0.0013 | 0.339 |
| ROA | 0.0003 | 0.071 | 0.0051 | 0.167 | 0.0003 | 0.025 |
| MTB | 0.0000 | 0.491 | −0.0127 | 0.034 | 0.0000 | 0.983 |
| DIVER | −0.0011 | 0.811 | – | – | −0.0007 | 0.883 |
| CROSS | 0.0049 | 0.231 | 0.0023 | 0.892 | 0.0054 | 0.233 |
| Adj. R2 | 0.061 | 0.312 | 0.0795 | |||
| N | 97 | 15 | 82 | |||
| Panel C: Post-market | ||||||
| Intercept | 0.0420 | 0.019 | 0.0413 | 0.238 | 0.0463 | 0.022 |
| FRIDAY | −0.0035 | 0.643 | −0.0120 | 0.376 | 0.0030 | 0.784 |
| PRIVATE | 0.0115 | 0.139 | – | – | – | – |
| LSIZE | −0.0042 | 0.004 | −0.0028 | 0.481 | −0.0040 | 0.012 |
| ROA | −0.0018 | 0.066 | 0.0000 | 0.997 | −0.0020 | 0.082 |
| MTB | −0.0020 | 0.403 | −0.0115 | 0.163 | 0.0002 | 0.933 |
| DIVER | −0.0075 | 0.317 | – | – | −0.0080 | 0.302 |
| CROSS | 0.0094 | 0.158 | 0.0132 | 0.436 | 0.0112 | 0.206 |
| Adj. R2 | 0.198 | 0.201 | 0.183 | |||
| N | 60 | 20 | 40 | |||
| Full Sample | Listed Targets | Unlisted Targets | ||||
|---|---|---|---|---|---|---|
| Coef. | p-Value | Coef. | p-Value | Coef. | p-Value | |
| Intercept | 0.2640 | 0.015 | 0.2560 | 0.111 | 0.2660 | 0.027 |
| FRIDAY | −0.0910 | 0.043 | −0.1457 | 0.038 | −0.0743 | 0.207 |
| PRIVATE | −0.0096 | 0.826 | – | – | – | – |
| LSIZE | −0.0176 | 0.131 | −0.0006 | 0.974 | −0.0220 | 0.143 |
| ROA | −0.0033 | 0.409 | −0.0081 | 0.468 | −0.0027 | 0.537 |
| MTB | −0.0020 | 0.013 | 0.0003 | 0.991 | −0.0019 | 0.017 |
| DIVER | −0.0708 | 0.242 | 0.1369 | 0.142 | −0.0815 | 0.223 |
| CROSS | 0.0805 | 0.071 | −0.0667 | 0.311 | 0.1095 | 0.049 |
| Adj. R2 | 0.062 | 0.096 | 0.081 | |||
| N | 229 | 64 | 165 | |||
| Full Sample | Listed Targets | Unlisted Targets | ||||
|---|---|---|---|---|---|---|
| Coef. | p-Value | Coef. | p-Value | Coef. | p-Value | |
| Panel A: Pre-market | ||||||
| Intercept | 0.2330 | 0.237 | 0.1611 | 0.432 | 0.1783 | 0.441 |
| FRIDAY | 0.0033 | 0.964 | −0.0467 | 0.652 | −0.0299 | 0.743 |
| PRIVATE | 0.0175 | 0.825 | – | – | – | – |
| LSIZE | −0.0232 | 0.275 | 0.0179 | 0.531 | −0.0175 | 0.575 |
| ROA | 0.0049 | 0.147 | −0.0012 | 0.908 | 0.0031 | 0.425 |
| MTB | 0.0004 | 0.847 | 0.0070 | 0.825 | 0.0009 | 0.683 |
| DIVER | −0.0736 | 0.526 | 0.1216 | 0.036 | −0.1297 | 0.432 |
| CROSS | 0.1345 | 0.058 | −0.2287 | 0.012 | 0.2330 | 0.016 |
| Adj. R2 | 0.0827 | 0.225 | 0.181 | |||
| N | 87 | 29 | 58 | |||
| Panel B: During-trading | ||||||
| Intercept | 0.3156 | 0.122 | 0.0094 | 0.983 | 0.3895 | 0.079 |
| FRIDAY | −0.1348 | 0.091 | −0.0600 | 0.736 | −0.1614 | 0.092 |
| PRIVATE | −0.0406 | 0.640 | – | – | – | – |
| LSIZE | −0.0274 | 0.241 | 0.0160 | 0.709 | −0.0479 | 0.116 |
| ROA | −0.0076 | 0.412 | −0.0334 | 0.357 | −0.0025 | 0.780 |
| MTB | −0.0026 | 0.000 | −0.0236 | 0.666 | −0.0025 | 0.000 |
| DIVER | 0.0684 | 0.459 | – | – | 0.0866 | 0.358 |
| CROSS | 0.0822 | 0.358 | 0.2146 | 0.439 | 0.0911 | 0.356 |
| Adj. R2 | 0.128 | 0.211 | 0.156 | |||
| N | 83 | 15 | 68 | |||
| Panel C: Post-market | ||||||
| Intercept | 0.7083 | 0.003 | 0.7335 | 0.117 | 0.6442 | 0.047 |
| FRIDAY | −0.2041 | 0.057 | −0.2540 | 0.100 | −0.1152 | 0.510 |
| PRIVATE | −0.0106 | 0.901 | – | – | – | – |
| LSIZE | −0.0383 | 0.030 | −0.0425 | 0.310 | −0.0328 | 0.172 |
| ROA | −0.0279 | 0.039 | −0.0280 | 0.408 | −0.0263 | 0.069 |
| MTB | −0.0421 | 0.330 | −0.0206 | 0.784 | −0.0435 | 0.431 |
| DIVER | −0.2722 | 0.073 | – | – | −0.2814 | 0.058 |
| CROSS | 0.0511 | 0.534 | 0.0374 | 0.786 | 0.0508 | 0.638 |
| Adj. R2 | 0.170 | 0.243 | 0.153 | |||
| N | 59 | 20 | 39 | |||
Publisher’s Note: MDPI stays neutral with regard to jurisdictional claims in published maps and institutional affiliations. |
© 2021 by the authors. Licensee MDPI, Basel, Switzerland. This article is an open access article distributed under the terms and conditions of the Creative Commons Attribution (CC BY) license (http://creativecommons.org/licenses/by/4.0/).
Share and Cite
Farinós, J.E.; Herrero, B.; Latorre, M.Á. Investor Inattention to All-Cash Acquisition Announcements: A Joint Day-Time Analysis in the Spanish Market. Sustainability 2021, 13, 721. https://doi.org/10.3390/su13020721
Farinós JE, Herrero B, Latorre MÁ. Investor Inattention to All-Cash Acquisition Announcements: A Joint Day-Time Analysis in the Spanish Market. Sustainability. 2021; 13(2):721. https://doi.org/10.3390/su13020721
Chicago/Turabian StyleFarinós, José Emilio, Begoña Herrero, and Miguel Ángel Latorre. 2021. "Investor Inattention to All-Cash Acquisition Announcements: A Joint Day-Time Analysis in the Spanish Market" Sustainability 13, no. 2: 721. https://doi.org/10.3390/su13020721
APA StyleFarinós, J. E., Herrero, B., & Latorre, M. Á. (2021). Investor Inattention to All-Cash Acquisition Announcements: A Joint Day-Time Analysis in the Spanish Market. Sustainability, 13(2), 721. https://doi.org/10.3390/su13020721