Article

Analysis of CO2 Emissions in the Whole Production Process of Coal-Fired Power Plant

1
State Key Laboratory of Environmental Criteria and Risk Assessment, Chinese Research Academy of Environmental Sciences, Beijing 100012, China
2
Atmospheric Environment Institute, Chinese Research Academy of Environmental Sciences, Ministry of Ecology and Environment (MEE), Beijing 100012, China
3
College of Environmental Science and Engineering, North China Electric Power University, Beijing 102206, China
4
Operation Management Department, National Joint Research Center for Tacking Key Problems in Air Pollution Control, Beijing 100012, China
*
Authors to whom correspondence should be addressed.
Sustainability 2021, 13(19), 11084; https://doi.org/10.3390/su131911084
Submission received: 26 August 2021 / Revised: 24 September 2021 / Accepted: 26 September 2021 / Published: 7 October 2021
(This article belongs to the Special Issue Environmental and Economic Analysis of Low-Carbon Energy Technologies)

Abstract

:
The linear programming (LP) model has been used to identify a cost-effective strategy for reducing CO2 emissions in power plants considering coal washing, pollutant removal, and carbon capture processes, thus CO2 emissions in different production processes can be obtained. The direct emissions (combustion emissions and desulfurization emissions) and indirect emissions (pollutant removal, coal washing, and carbon capture) of CO2 were all considered in the LP model. Three planning periods were set with different CO2 emission control desirability to simulate CO2 emissions of the different reduction requirements. The results can reflect the CO2 emissions across the whole production process of a coal-fired power plant overall. The simulation results showed that for a coal-fired power plant containing two 1000 MW ultra super-critical sets, when the desirability was 0.9, the CO2 total emissions were 2.15, 1.84, and 1.59 million tons for the three planning periods. The research results suggest that the methodology of LP combined with fuzzy desirability function is applicable to represent the whole production process of industry sectors such as coal-fired power plants. The government policy makers could predict CO2 emissions by this method and use the results as a reference to conduct effective industrial and energy structure adjustment.

1. Introduction

The report of the AR6 Climate Change 2021: The Physical Science Basis has recently been released by the Intergovernmental Panel on Climate Change (IPCC), which suggests that the global surface temperature has increased with a speed much faster than over the 50 years before 1970, which are mainly due to the greenhouse gases released by humans. Due to the experienced high economic growth over the past 40 years, China has become the country with the largest carbon emissions in the world [1,2,3,4,5]. Thus, China is facing tremendous domestic and international pressure to reduce carbon dioxide emissions [5]. In September 2020, China proposed at the United Nations General Assembly that it would strive to achieve a “carbon neutral” goal by 2060. This displayed China’s determination to reduce the carbon emissions to the global community. Coal power plants occupy a major position in the Chinese power sector, where 66% of its total electricity production originates from coal, according to International Energy Agency. The contributions of electricity and heat supply sectors to the total CO2 emissions of China is significant at 4896 Mt while the coal-fired power generation sector contributed to 97% or 4747.9 Mt of carbon dioxide emissions [6]. Thus, it is vital that focus is applied to coal-fired power plants and the resulting CO2 emissions in order to mitigate global warming problems and provide plans for future adjustments in China’s electrical power sectors [7].
The optimization model has been widely used to identify cheaper strategies for the reduction in greenhouse gas emissions in electrical power systems [8]. Most of the optimization models are based on bottom-up data, which considers the technology characteristics and parameters, and can be accordingly called bottom-up optimization models. The advantages of bottom-up models are that they usually include a great deal of detail about the model system, and are able to identify the very specific technological options and the associated investments and costs, so the model has been applied in many sectors [9,10,11,12]. Huang et al. [13] investigated energy savings and CO2 abatement using an extended energy conservation supply curve (ECSC) and an extended marginal abatement cost curve to help the cement industry find cost-effective measures with the greatest potential in terms of energy savings and CO2 abatement. Bhadbhade et al. [14] and Zuberi [15] investigated the current potential for energy efficiency (EE) improvement and CO2 abatement in the Swiss metals and cement sectors, respectively, by means of bottom-up cost curves. These results could help overcome the techno-economic barriers in implementing best practices in the high value-added metals and cement sectors. Wang et al. [16,17] developed optimization models for multi-regional electricity generation and trading strategies in China based on power-plant constraints and renewable portfolio standard targets. However, a shortcoming of bottom-up models is that they single out the system of the study from the entire economic system and fail to take the indirect characteristics into consideration. In order to overcome these shortcomings, more and more researchers are using the linear programming (LP) method to solve optimization problems in the field of building management, particularly in problems related to environmental impact, energy consumption, or energy efficiency.
There have been a wide range in studies for bottom-up emission power plant models [18,19,20,21,22,23]. Coal-fired power plants are still the major source of electrical power in China, thus understanding CO2 emissions in future scenarios is necessary for formulating carbon reduction goals and planning adjustments to the power industries. There are several model issues that need to be resolved in order to analyze CO2 emissions across the whole production process for coal-fired plants: (1) How to set the model to make sure the stability and rationalization of the generating system at the same time reducing CO2; (2) how to reflect the direct and indirect CO2 emissions in the whole production process of a coal-fired power plant; and (3) how to reflect CO2 emissions in different scenarios and limits.
Thus, in order to address these issues, linear programing was applied to the models in this study to solve the up-bottom issues. This would allow CO2 emissions predictions and different desirability levels and also investigate the direct and indirect emissions in the whole production process of a coal-fired power plant. Scenarios analysis has been applied as a complementary method to obtain more decision-making plans under different desirability levels. The developed model was applied in a simulated power plant to provide effective support for the formulation of carbon emissions reduction measures. These simulated methods and their results allow for the prediction of CO2 emissions potentials and provide a foundation for future adjustments in the energy sector to reduce CO2 emissions overall.

2. Methodology

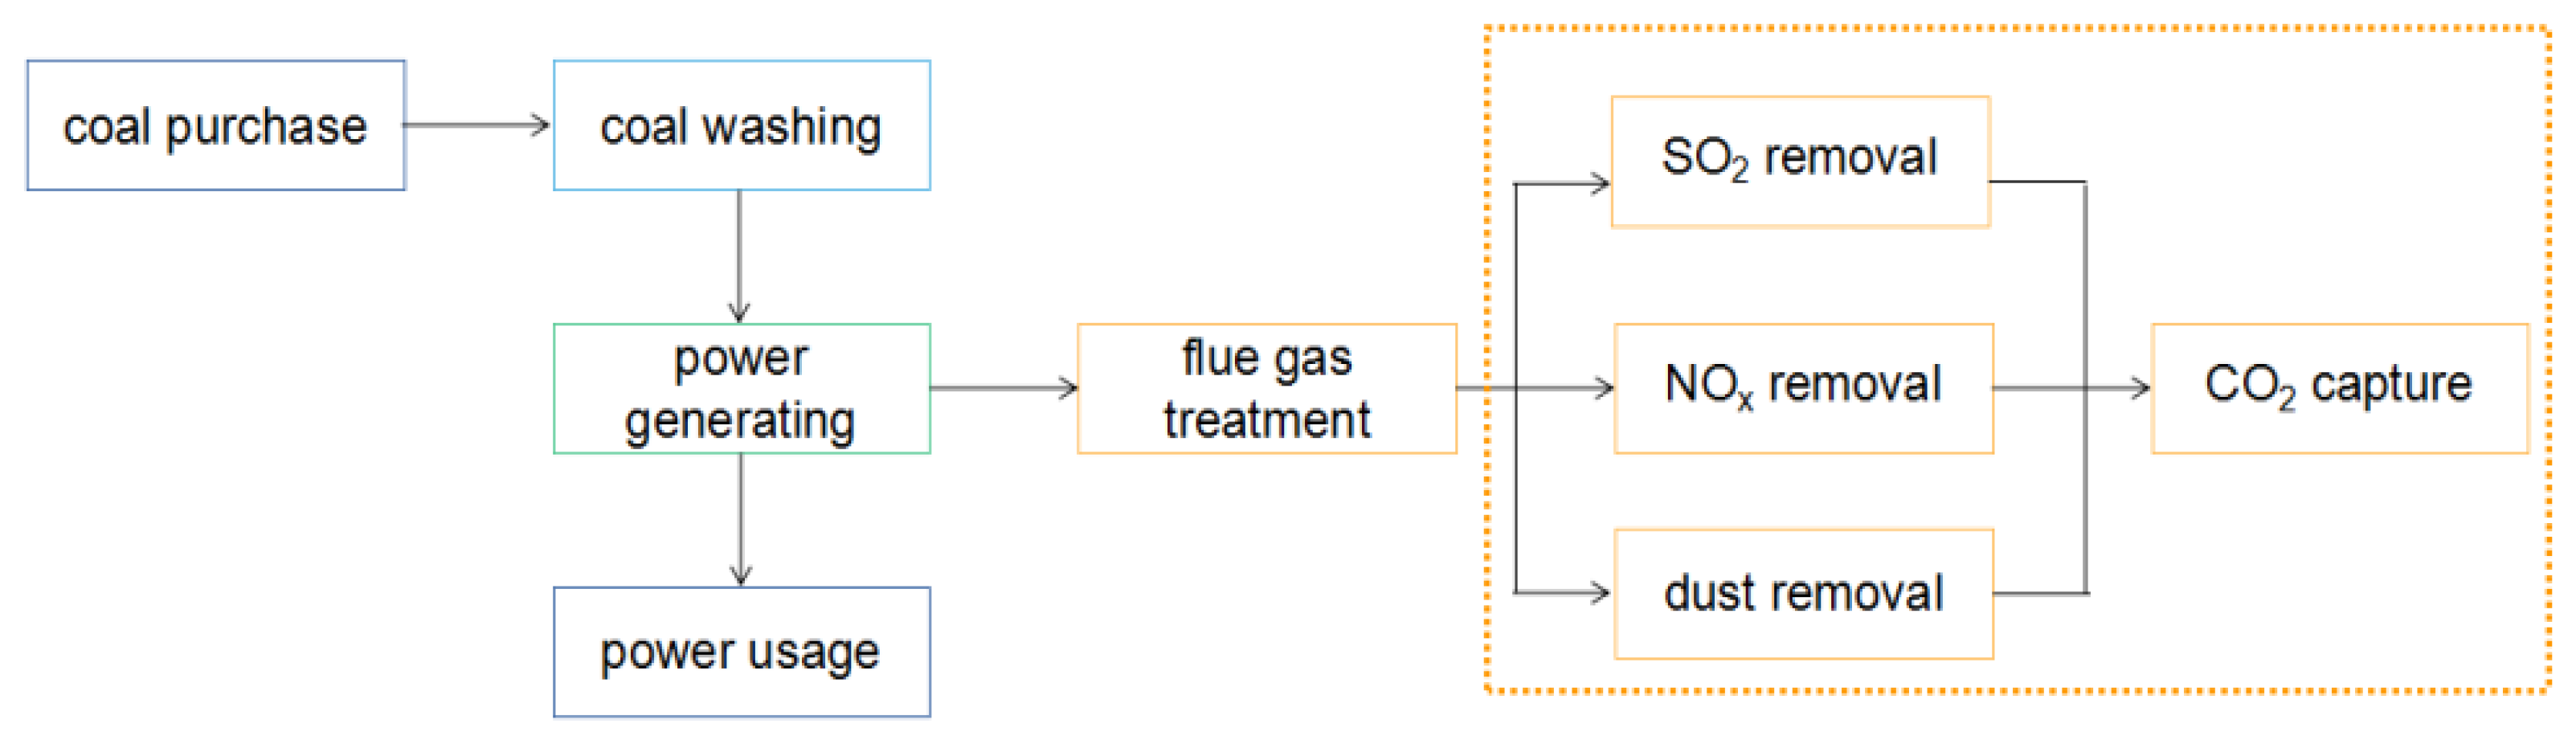
2.1. The Whole Coal-Fired Power Generation Process Analysis

Many steps in coal-fired power generation lead to either direct or indirect CO2 emissions, whether that be coal washing, coal fired, or pollution removal processes. Thus, in order to analyze the generating cost and pollution emissions integrally, the programming model should be established based on the whole coal-fired power generation process. The whole coal-fired power generation process was defined (see Figure 1) in this study. As seen in Figure 1, the key steps in the whole coal-fired power generation process has been selected to construct the programming model, which includes coal washing, coal-fired generation, pollution removal, and CO2 capture processes. The CO2 emissions and other air pollution were calculated under the objective function of generating cost.

2.2. Linear Programming

Consider a linear programming model as follows:
min f = C X
Subject to:
A X B ,
X 0 .
where
C = c 1 , c 2 , ^ c n ,
A = a 11 a 1 n a m 1 a m n = A 1 , A 2 , ^ A m T ,
A i = a i 1 , a i 2 , ^ a i n , i ,
B = b 1 , b 2 , ^ b n T ,
X = x 1 , x 2 , ^ x n T
where f refers to an objective function; A is the parameter matrix; B and C are the parameter vectors; and X is the independent vector.

2.3. Fuzzy Linear Programming

Consider an interval fuzzy programming model as follows:
max f = C X
subject to:
A X ˜ B
X 0
where = and ˜ represent fuzzy equality and fuzzy inequality, respectively. Based on the principle of fuzzy flexible programming, a connection between the value of λ and membership function would be established. Specifically, the flexibility of constraint conditions and the fuzziness of the system objective would be denoted by the fuzzy number set. [ λ ] as the degree of membership associated with the degree of satisfaction represents the “fuzzy constraint” or “fuzzy object”. λ = min μ G , μ C 1 , μ C 2 , ^ μ C m denotes the membership level. Therefore, the fuzzy linear programming model would be converted as follows:
max λ
subject to:
λ μ G , μ C i ( i = 1 , 2 , ^ m )
0 λ 1
μ G = 1 , C X f C X f f f , f C X f 0 , C X f
μ C i = 1 , ( A X ) i b i 1 ( A X ) i b i P i , b i ( A X ) i b i + P i 0 , ( A X ) i b i + P i , i
(Take Equations (13) and (14) into (11), and simplify the formulation, and then:
max λ
subject to:
C X λ f + ( 1 λ ) f
( A X ) i b i + ( 1 λ ) P i , i
X 0
0 λ 1

3. Case Study

3.1. Overview of the Simulation Case

A hypothetical coal-fired power plant was used in this study as the simulation case. The coal-fired power plant contained two 1000 MW ultra super-critical sets, and the coal consumption was about five million tons a year, and the generating capacity was about 10,000 GW·h. Due to the site limitations, the power plant could store the coal for 20 days, thus the power plant would purchase one or more kinds of the coal with the calorific values of 18.8, 20.9, 23.0, and 24.3 MJ/kg (named C1, C2, C3, and C4), respectively, for each month according to the coal price and generating cost. After being purchased, the coal was sent to the coal washing plant. The coal was washed by the coal jigging method until the mass fraction of sulfur in coal was lower than 1%, and then the coal was sent to the power plant to be blended. The coal-fired power plant was also equipped with wet flue gas desulfurization (WFGD), selective catalytic reduction (SCR), and bag-hose precipitation devices. Absorptive methods were also used to capture CO2 in the power plant.
In order to study the air pollution and carbon dioxide removal effect under the objective function of the minimum generating cost in different scenarios, three planning periods were considered, each planning period lasting for three years. The parameters of generating cost, power consumption of coal washing, air pollution emission amounts, and power consumption of air pollution removal for each planning period are shown in Table 1, Table 2, Table 3 and Table 4, respectively.
Desirability function was combined with the fuzzy linear programming of this study to analyze the solution of the programming model at the different desirability level, and the desirability degree was set as 0.9, 0.7, 0.5, 0.3, and 0.1 in each planning period.

3.2. Model Building

A linear programming model was established with the minimum generating cost as the objective function. In this study, the generating cost of the coal-fired power plant was considered to be composed of the resource cost, coal washing cost, power generating cost, air pollution treatment cost, and CO2 capture cost. The model is shown below concretely.

3.2.1. Objective Function

Considering the coal consumption and pollutant treatment costs, the minimum generating cost of the power plant was set as the objective function in this study.
min f = t = 1 T i = 1 I Z i t C Z i t + t = 1 T i = 1 I Z i t C Z S i t + t = 1 T i = 1 I Z i t W i t P V i t + t = 1 T i = 1 I k = 1 K Z i t W i t P P t k T P t k C P t k + t = 1 T i = 1 I Z i t F C i t T C t C C t M t 44 12
Resource cost:
t = 1 T i = 1 I Z i t C Z i t
where Zit is the coal mass of i kind in the period of t, t; CZit is the coal price of i kind in the period of t, CNY/t; t represents the planning period; and i = 1, 2, 3, 4, represent C1, C2, C3, and C4, respectively.
Coal washing cost:
t = 1 T i = 1 I Z i t C Z S i t
where CZSit is the unit coal washing price of i kind in the period of t, CNY/t.
Power generating cost:
t = 1 T i = 1 I Z i t W i t P V i t
where Wit is the power generating of the i kind coal per unit mass in the period of t, KW·h/t. PVit is the cost of power generating per unit, KW·h/t.
Air pollution removal cost:
t = 1 T i = 1 I k = 1 K Z i t W i t P P t k T P t k C P t k
where PPtk is the emission amount of k kind air pollutant per unite power generating, t/KW·h; and k = 1, 2, 3, represent SO2, NOx, and particulate matter, respectively. TPtk is the removal efficiency of k kind air pollution in the period of t, %. CPtk is the air pollution removal cost per unit mass of k kind air pollution, CNY/t.
CO2 capture cost:
t = 1 T i = 1 I Z i t F C i t T C t C C t M t 44 12
where FCit is the combustion efficiency of i kind coal in the period of t; TCt is the CO2 capture efficiency in the period of t; CCt is unit CO2 capture cost in the period of CNY/t; and Mt is the usage rate of CO2 capture technology in the period of t, %.

3.2.2. Constraint Conditions

(1) Electric quantity constraint:
i = 1 I Z i t W i t D E t , t
where DEt is the power generating demand of the different planning periods, KW·h.
Resource constraint:
Z i t M Z i t , i , t
where MZit is the maximum supply quantity of i kind coal in the period of t, t.
Air pollutant emission constraint:
i = 1 I Z i t W i t 1 T P t k P P t k E P t k , t , k
where EPtk is the emission amount of k kind air pollution in the period of t, t.
Fuzzy desirability function:
It is regulated that CO2 emissions at each planning period decrease by 20% compared to the last planning period.
S 0 F t i = 1 I ( Z i t W i t ) S 0 S 0 ( 1 20 % ) t λ
F t = i = 1 I Z i t F C i t 1 T C t M t 44 12 + i = 1 I Z i t F C i t 1 M t 44 12 + i = 1 I Z i t C K i t S t + i = 1 I k = 1 K Z i t W i t P P t k T P t k F P t k S t + i = 1 I Z i t F C i t T C t M t E C t S t 44 12 + i = 1 I k = 1 K Z i t W i t P P t , k = 1 T P t , k = 1 44 64
where Ft is the total emission amounts of CO2 in the period of t including direct emissions and indirect emissions, t. S0 represents the CO2 emissions of per unit power generating at the base year of the planning period, t/KW·h. CKit is the coal washing power consumption per unit i kind coal in t period, KW·h/t. FPtk is the air pollution removal power consumption per unit i kind coal in t period, KW·h/t. ECt is the power consumption of unit CO2 capture, KW·h/t. St is CO2 emission amounts per unit electricity consumption, t/KW·h. λ is the desirability, which were 0.1, 0.3, 0.5, 0.7, and 0.9, respectively, in each planning period.

4. Results Analysis and Discussion

4.1. System Cost Analysis

The model in this study used the minimum total generating cost as the objective function, after calculation, the model operation results of the total and unit power generating costs at the different desirability values are shown in Figure 2. It can be seen in Figure 2 that the total and unit power generating costs all increased with the increase in the desirability values. The total power generating cost of the three planning periods were 7.13, 7.40, 7.70,7.97, and 8.28 billion CNY, and the unit power generating cost were 0.73, 0.76, 0.79, 0.82, and 0.85 CNY/KW·h at the desirability values of 0.1, 0.3, 0.5, 0.7, and 0.9, respectively. It can be seen that the unit power generating cost had a linear relation with the desirability values, and the results suggest that when the desirability value increases by 0.2, the unit power generating cost will increase 0.03 CNY/KW·h.
The power generating production and coal consumption of the three planning period are shown in Table 5. It is expected that China’s energy needs will continue to increase, thus in this study, the power generating production increased with the planning period time, and the total power generating production of the three planning periods were 97,436.56 GW·h. Four kinds of coal (C1, C2, C3, and C4) were considered in this study with the calorific values of 18.8, 20.9, 23.0, and 24.3 MJ/kg, which were 64.3%, 71.4%, 78.6%, and 82.6% of the calorific values of the standard coal. As shown in Table 1, the generating cost of using C1, C2, C3, and C4 were 0.135, 0.125, 0.115, and 0.11, respectively. Thus, during the whole planning period, using C4 for generating was the most economical, and after the calculation, the coal consumption for generating was 382 g/KW·h C4 in this case.

4.2. Air Pollutant Emissions Analysis

The air pollutant emissions of the three planning periods are shown in Figure 3, and the emission intensities of the three air pollutants are shown in Table 6. It can be seen in Figure 3 that the air pollutant emissions increased with the power generating amounts, which were 17,431, 17,937, and 18,095 tons for SO2; 13,327, 13,812, and 14,178 tons for NOx; 1039, 1069, and 1078 tons for PM in the three planning periods, respectively. Though the emissions increased with the power generating amounts, the air pollutant emissions intensity of SO2, NOx, and PM all decreased with the increase in the planning period, which increases with the planning period due to the pollutants’ removal level.

4.3. Carbon Dioxide Emissions Analysis

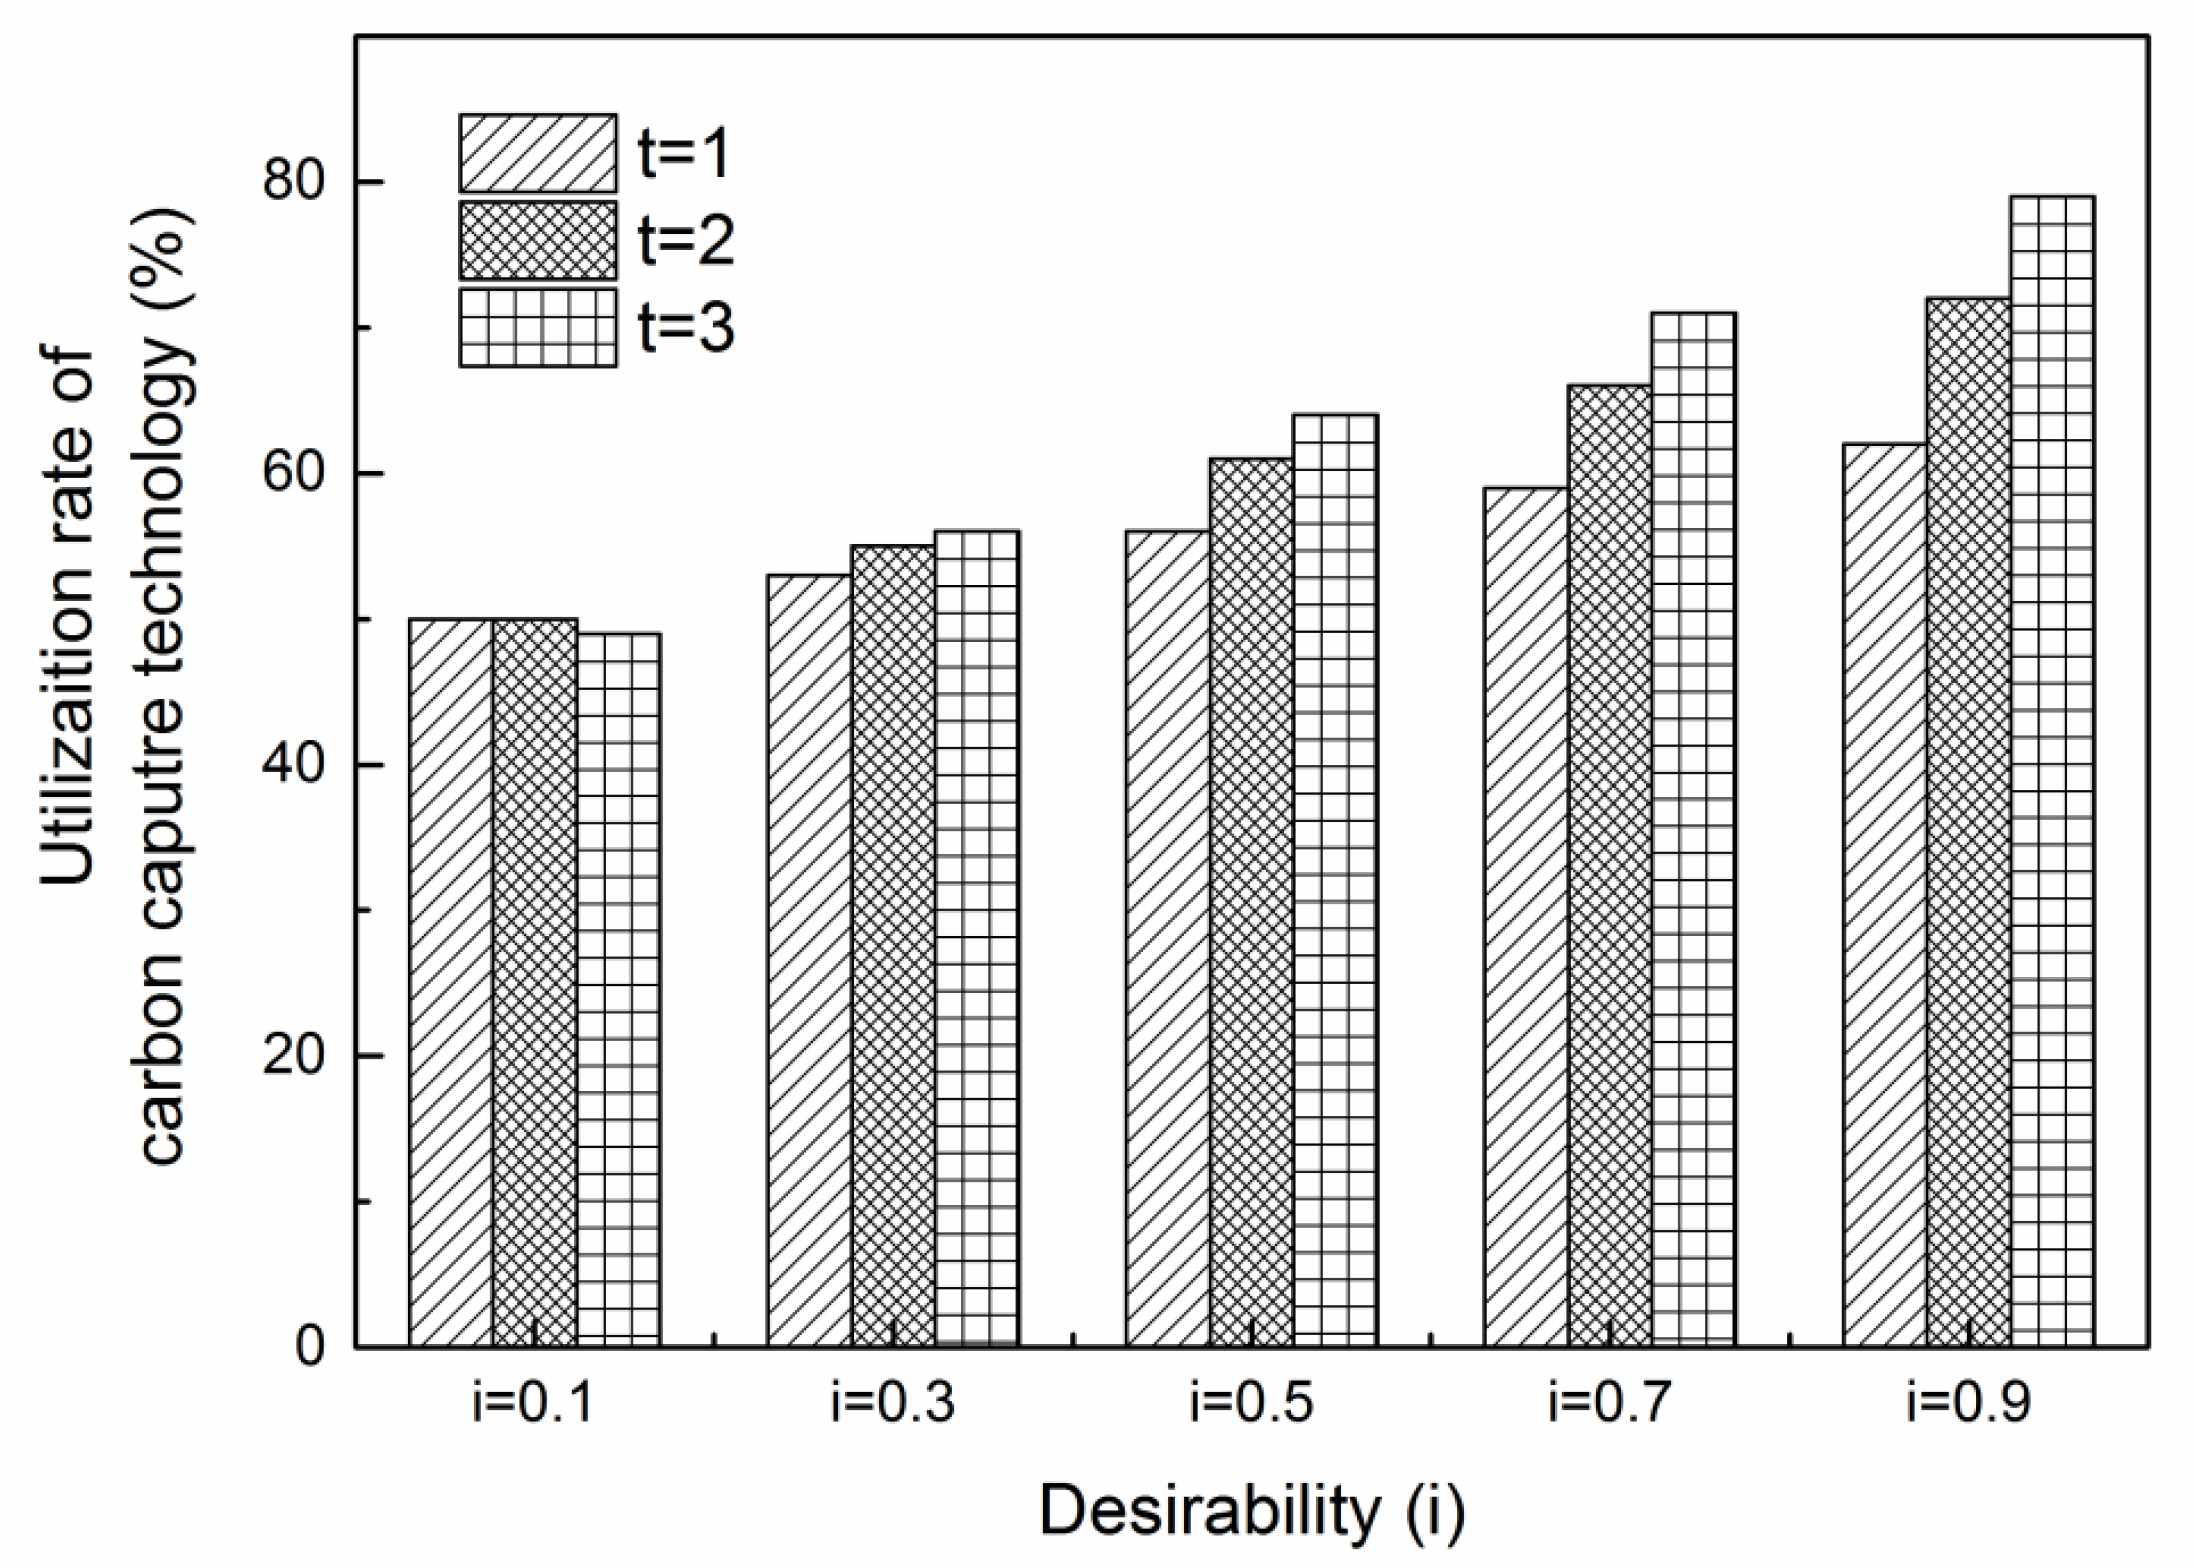
4.3.1. The Utilization Rate of Carbon Capture Technology

Applying carbon capture technology is an effective method to help coal-fired power plants to reduce carbon dioxide emissions. The extravagant cost, however, provides major constraints in the actual application of carbon capture technologies for coal-fired plants. Thus, it is important to analyze the utilization rate of carbon capture technology at different planning periods with different desirability.
The utilization rate of carbon capture technology for different planning periods with different desirability is shown in Figure 4. It can be seen from the figure that with the increase in the desirability, the utilization rates of carbon capture technology all increased in the three planning periods. In order to obtain good carbon dioxide removal effects, the power plants must increase the investment in the application of carbon capture technology. It is noteworthy that when the desirability was 0.1, the utilization rate of carbon capture technology in the first and second planning period was similar, however, that of the third planning period showed a small decrease. It can be suggested that the power generation technology improved in the third planning period, which caused the carbon emission of unit electric energy production to decrease. Lower desirability also means more carbon dioxide permissible discharge. Thus, the utilization rate of carbon capture technology in the third planning period decreased slightly and the rate of the utilization of carbon capture technology increased with the increase in the desirability value.

4.3.2. Carbon Dioxide Emissions

In this model, the total emissions of carbon dioxide are composed by the direct and indirect emissions parts. Specifically, carbon dioxide emissions released by the combustion process and limestone-gypsum handling system resulted in direct emissions; while energy consumption of the carbon dioxide capture system, pollutant removal system, and coal washing process led to direct emissions. These simulated results are discussed below.

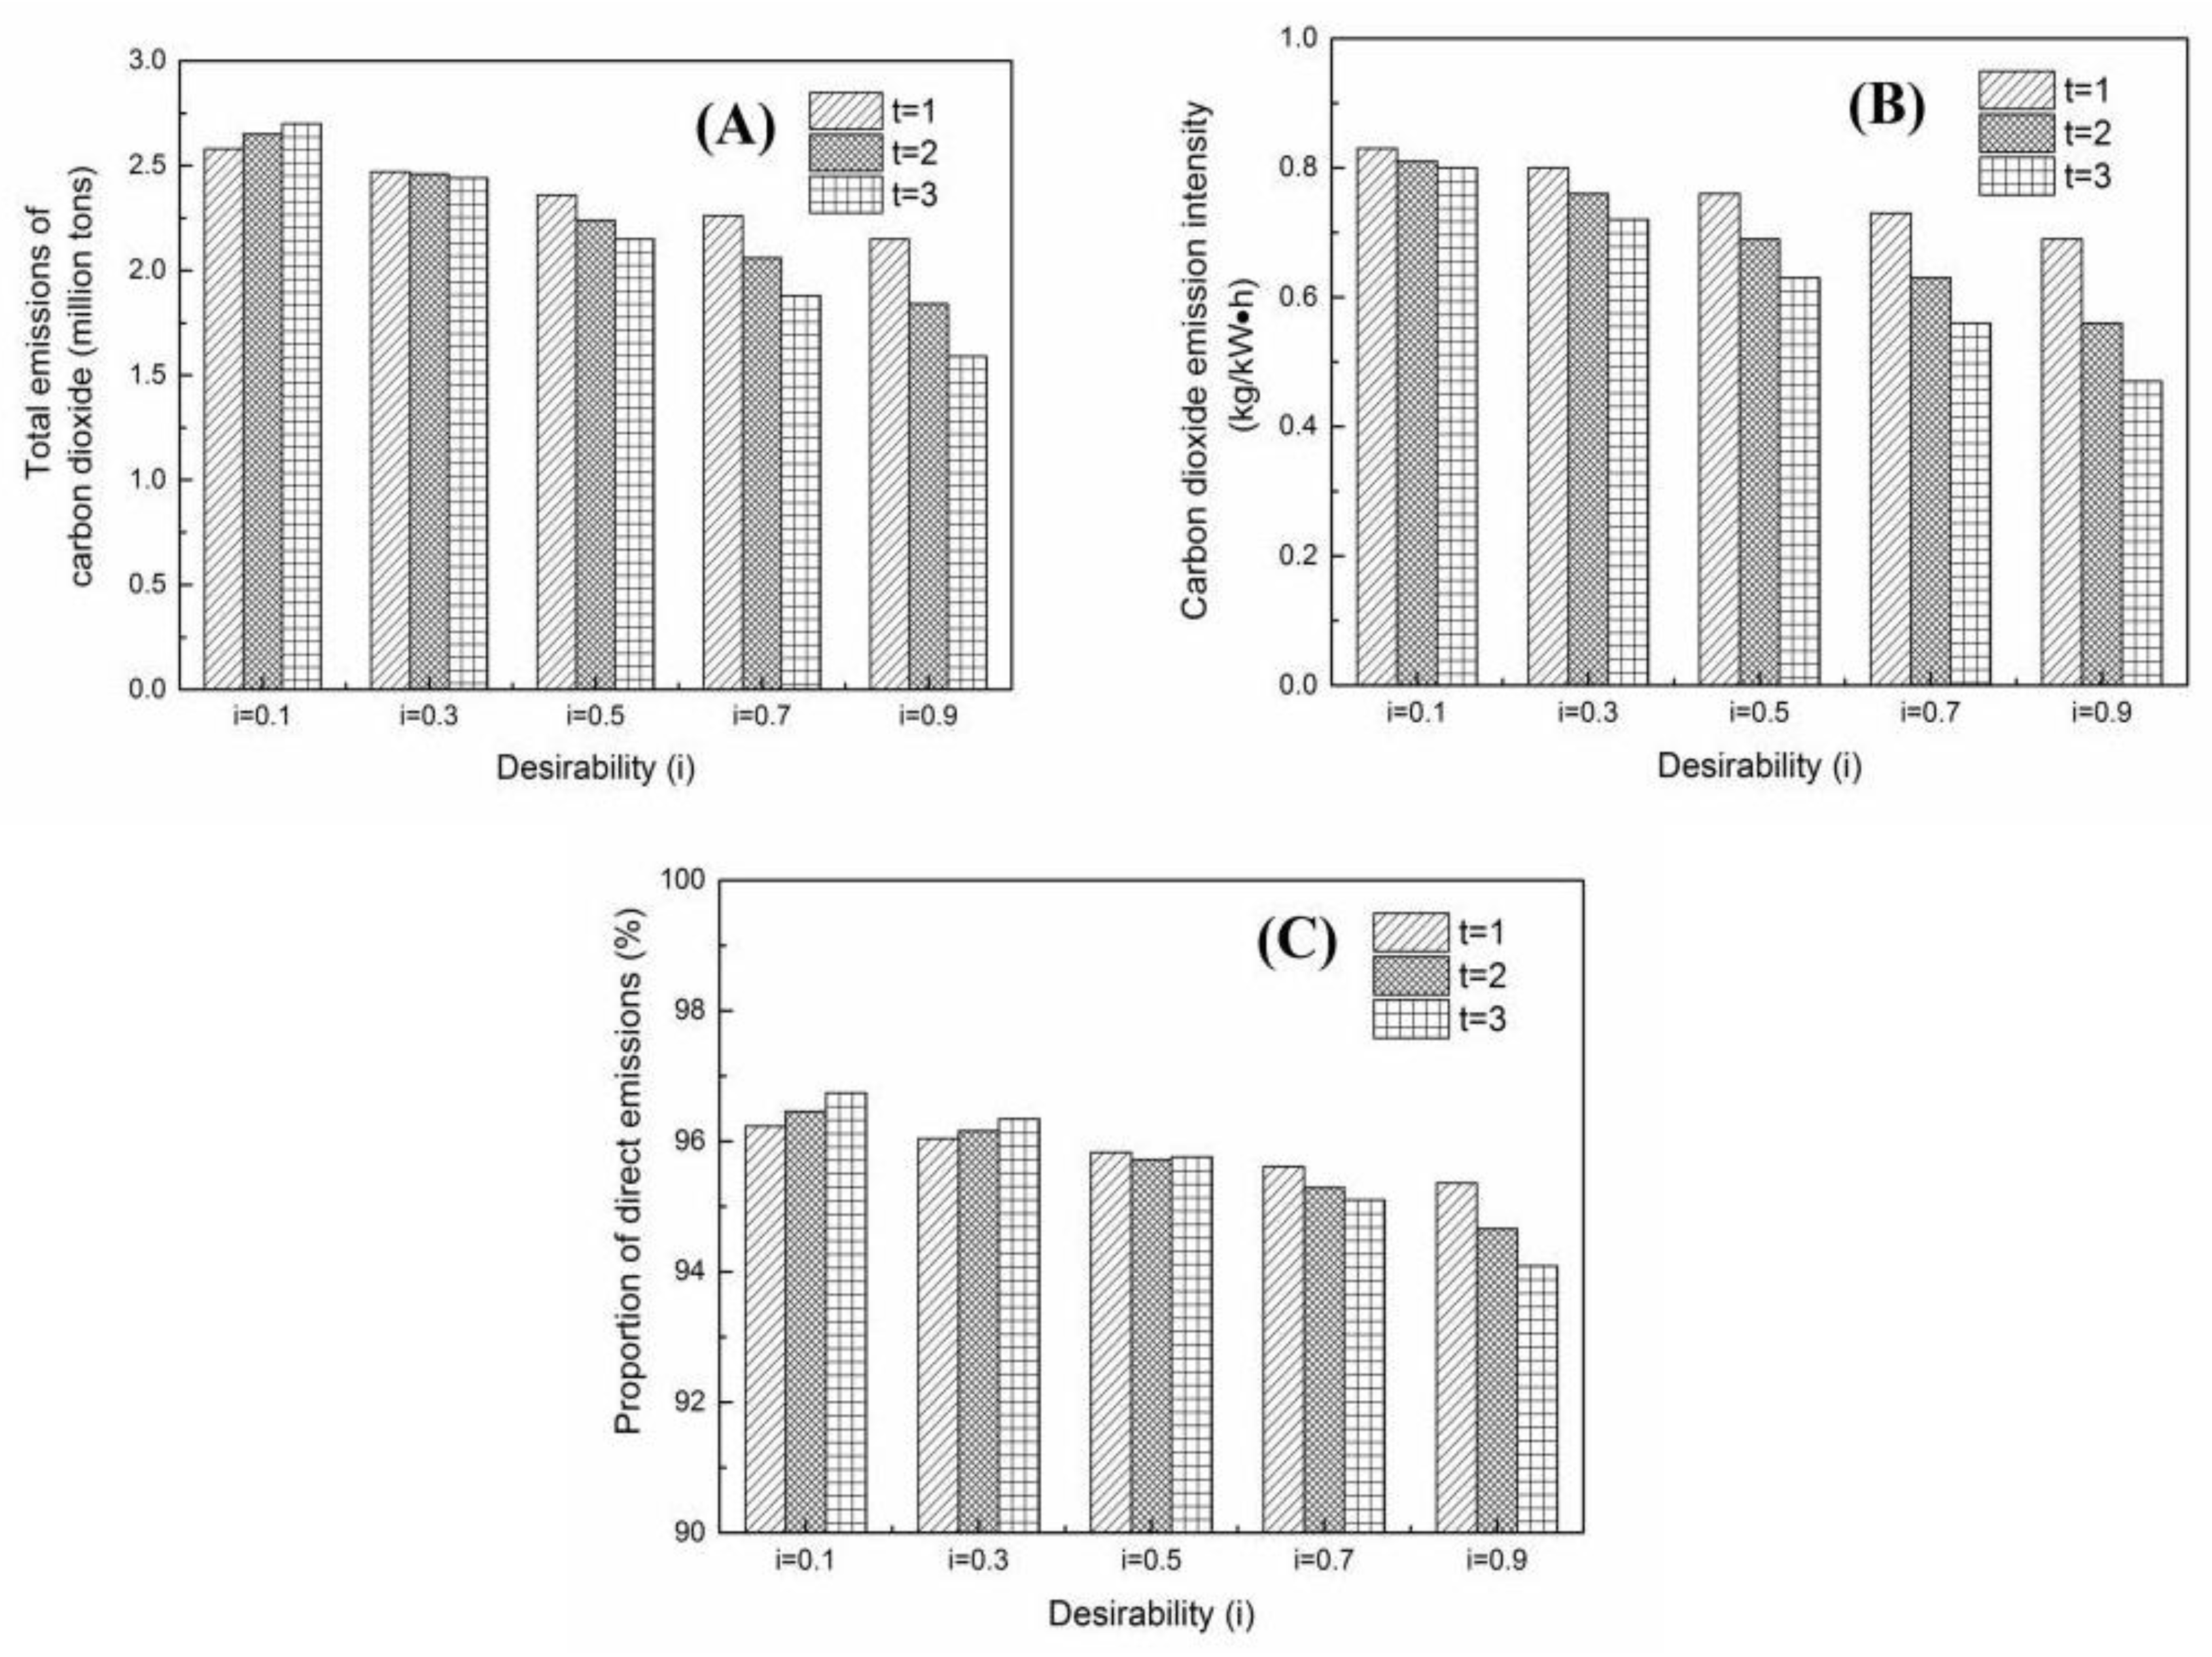
Analysis of the Total Carbon Dioxide Emissions

Total emissions of carbon dioxide at different planning periods with different desirability are shown in Figure 5A. As seen in this figure, total emissions of carbon dioxide decreased with the increase in the desirability value for each planning period. When the desirability was 0.1, total emissions of carbon dioxide increased with the increase in the planning period due to the moderate emission limits, which were 2.58, 2.65, and 2.70 million tons, respectively. However, when the desirability was above 0.3, total emissions of carbon dioxide all decreased with the increase in the desirability, and the emission reductions increased with the increase in the desirability value. When the desirability value was 0.9, which was the strictest emission limit of the simulation, the total emissions of carbon dioxide were 2.15, 1.88, and 1.59 million tons for the three planning periods, respectively.
Carbon dioxide emission intensities at different planning periods with different desirability are shown in Figure 5B. As seen in Figure 5B, the carbon dioxide emission intensity decreased with the increase in the desirability for each planning period, and the carbon dioxide emission intensities were 0.83, 0.80, 0.76, 0.73, and 0.69 kg/kW·h in the first planning period, and 0.80, 0.72, 0.63, 0.56, and 0.47 kg/kW·h in the third planning period. With the increase in application of carbon dioxide capture technology, carbon dioxide emissions intensities all decreased with the increase in the planning periods under each desirability, and the decrease rates of the third planning period to the first planning period were 4%, 9%, 17%, 23%, and 32% under the desirability values of 0.1, 0.3, 0.5, 0.7, and 0.9, respectively. When the desirability was 0.1, the total emissions of carbon dioxide increased, and the emission intensities decreased with the increase in the planning period, suggesting that under the moderate emission limits, the increase level in the application of carbon dioxide capture technology was lower than the energy production increase level in order to pursue a higher economic benefit.
Figure 6 clearly shows that CO2 direct emissions decrease, while the indirect emissions of CO2 increase with the increase in the desirability for each planning period. As seen in Figure 6A, when the desirability was 0.1, CO2 direct emissions increased with the increase in the planning period that had the same tendency with the total CO2 emissions, which is because in the simulation, when the desirability is low, the upper limit of CO2 emissions is high enough, so more energy production leads to the high direct CO2 emissions for pursuing high economic benefit. With the increase in the desirability value, the upper limit of CO2 emissions becomes lower gradually, and CO2 reductions were enhanced with the increase in the planning period when the desirability was above 0.3. Indirect emissions of CO2 decreased with the increase in the planning period under each desirability, and increased with the increase in desirability for each planning period due to the stricter requirements of CO2 capture and pollution removal.
Proportions of CO2 direct emissions at different planning periods with different desirability are shown in Figure 5C. As seen in Figure 5C, the proportions of CO2 direct emissions increased with the increase in the planning period at the low desirability level (0.1 and 0.3), and decreased with an increase in the planning period at higher desirability levels (0.7 and 0.9). When the desirability was 0.5, the proportions of CO2 direct emissions of the three planning periods were similar. The results suggest that with the enhancing of CO2 reduction, CO2 indirect emissions increase due to the increase in the power consumption of the technology improvement. Thus, CO2 indirect emissions due to the powered devices should be considered when the power plant pursues low direct emissions of CO2.

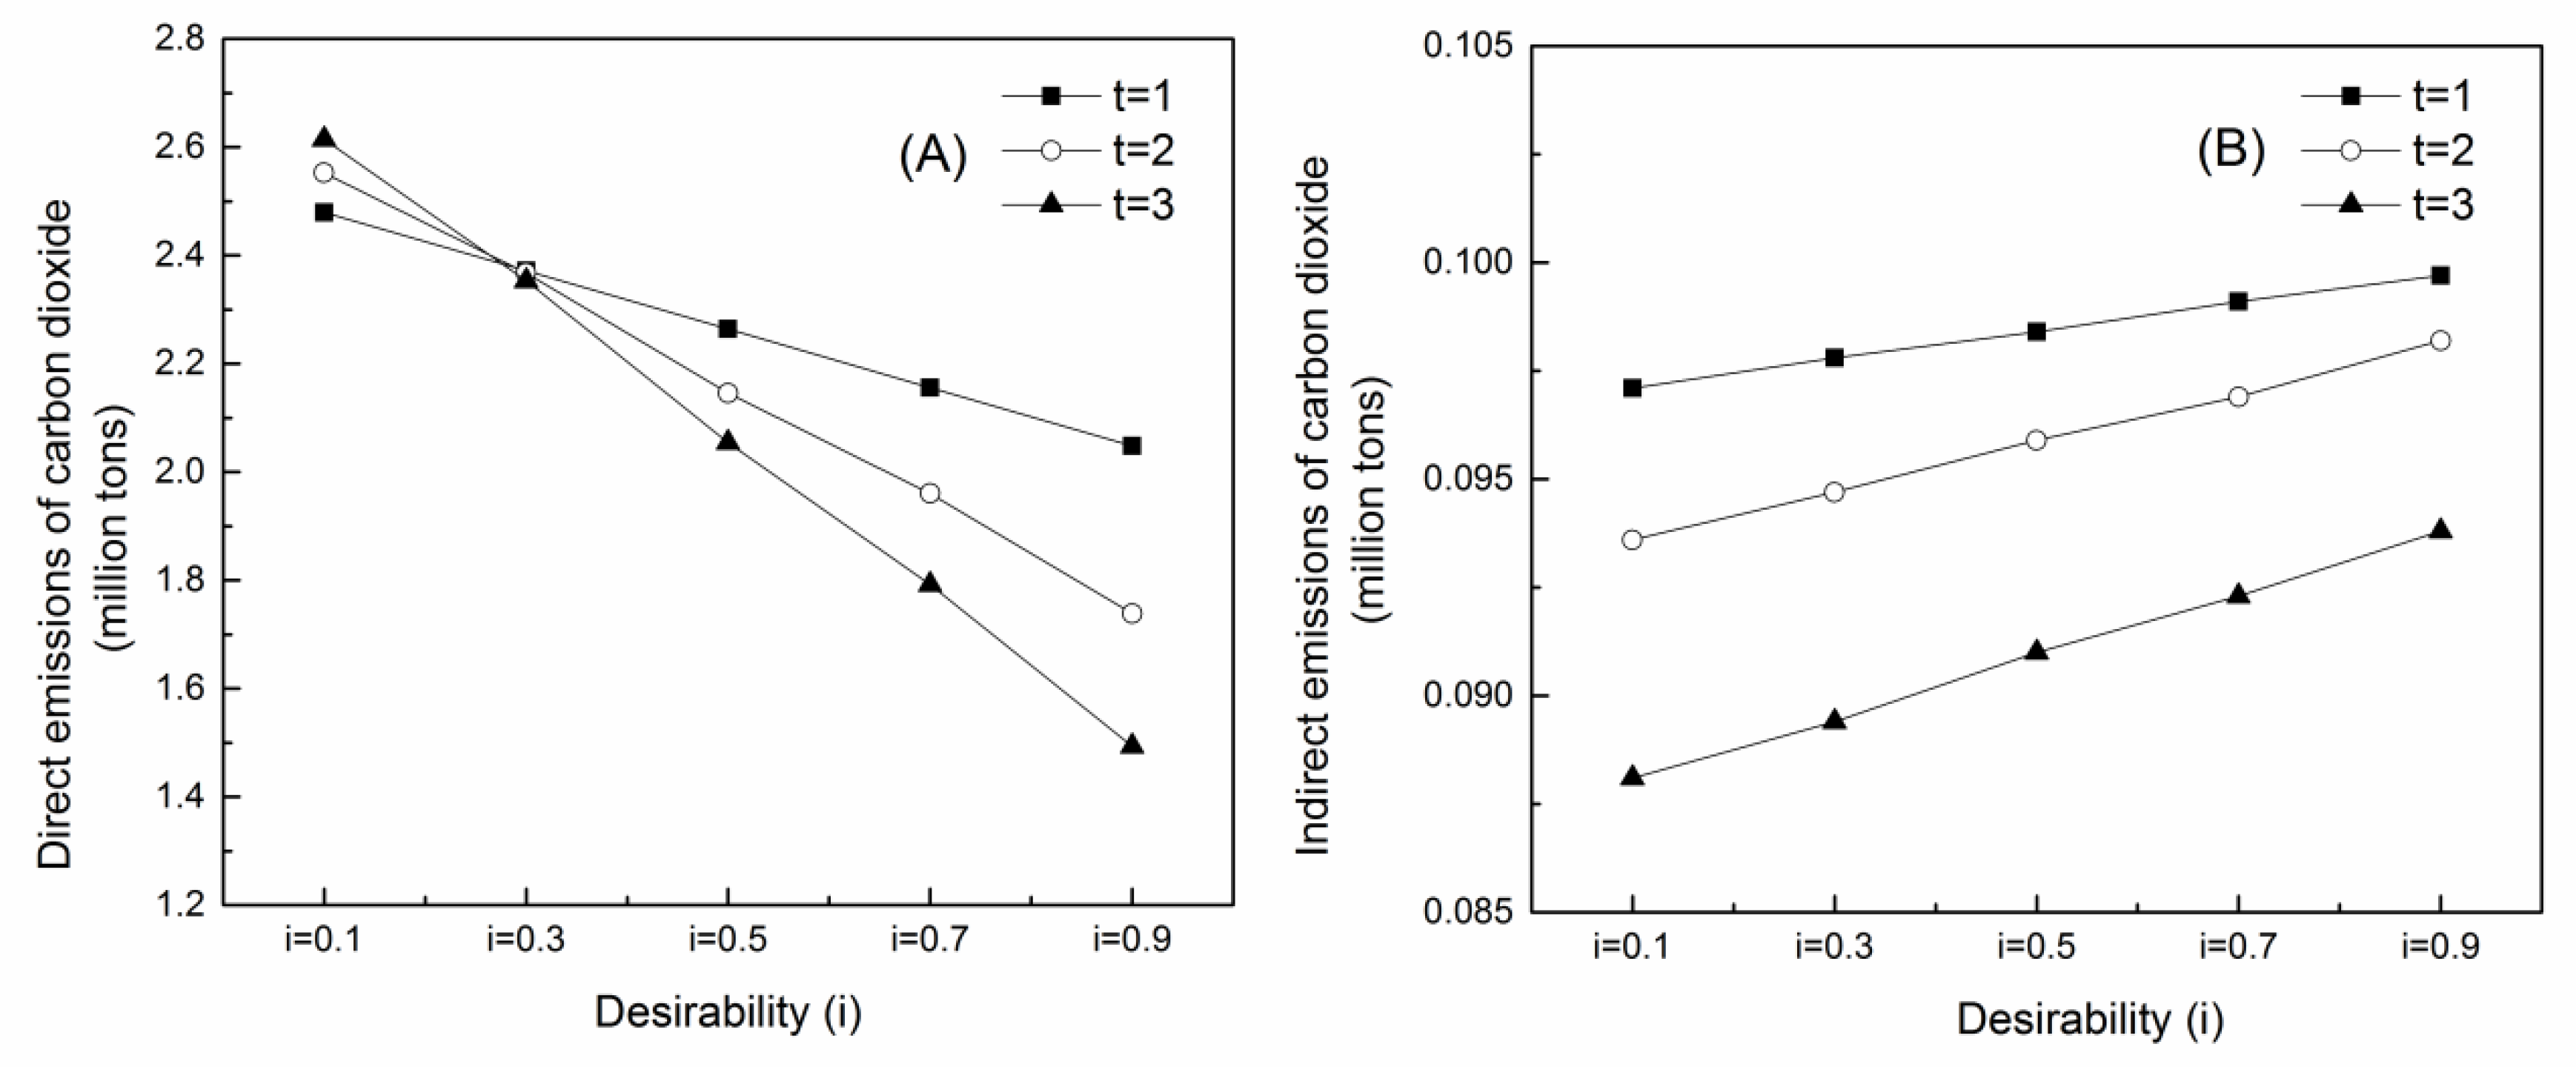
Analysis of the Direct and Indirect Carbon Dioxide Emissions

Proportions of direct CO2 emissions by combustion in the total direct emissions are shown in Table 7. It can be suggested that the combustion is the major source (97%) of direct CO2 emissions. When the desirability is 0.1, CO2 combustion emissions are similar at different planning periods. When the desirability is above 0.3, CO2 combustion emissions decrease with the increase in the planning period, suggesting that CO2 emission controls produce effects. Proportions of indirect CO2 emissions by CO2 capture technology in total indirect emissions are shown in Table 8. As seen in Table 8, proportions of indirect CO2 emissions by CO2 capture technology increased with the increase in the planning periods and desirability. CO2 emission control technology application can be reflected by the indirect CO2 emissions by CO2 capture technology, thus the greater the CO2 capture technology applications, the higher indirect emission proportions of the technology and less direct CO2 emissions by combustion.

5. Conclusions

The methodology of linear programming combined with fuzzy desirability function was applicable to reflect the CO2 emissions across the whole production process of coal-fired power plants. CO2 emissions were roundly predicted by the simulated model under five desirability values of the three planning periods, respectively. The main simulation results can be concluded below:
(1)
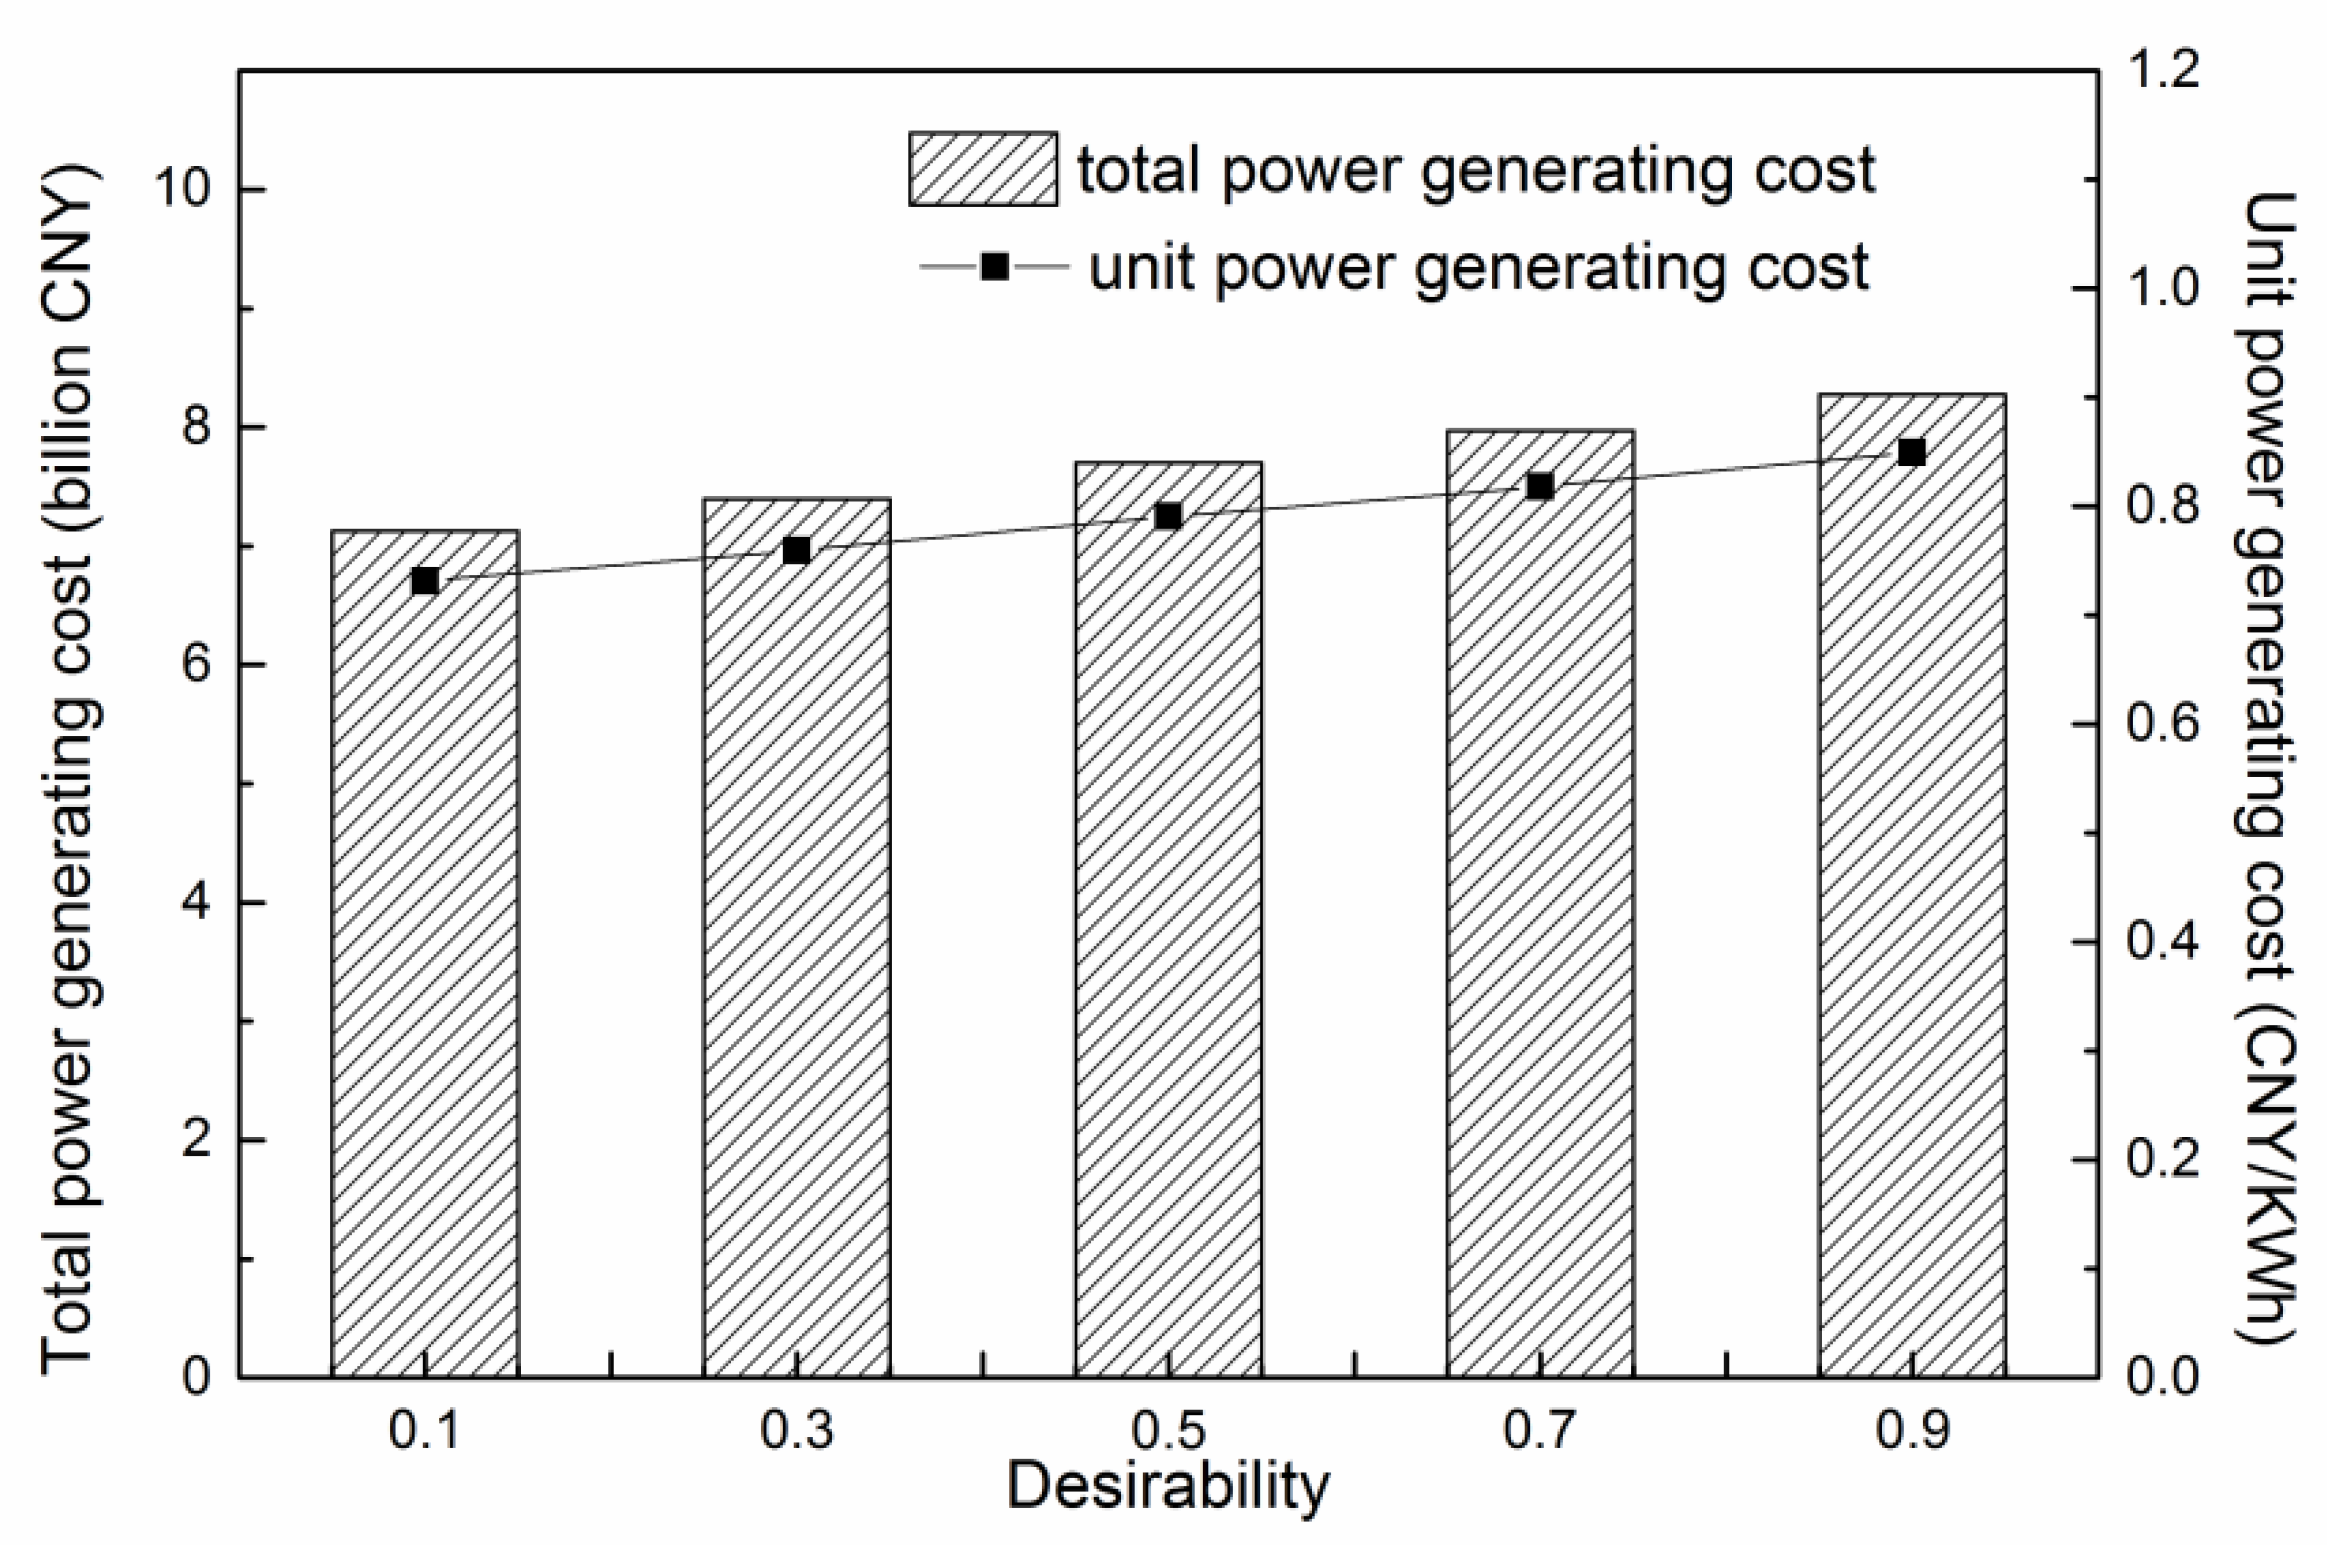
The simulation results showed that for the coal-fired power plant contained two 1000 MW ultra super-critical sets, the total power generating cost of the three planning periods were 7.13, 7.40, 7.70, 7.97, and 8.28 billion CNY, and the unit power generating costs were 0.73, 0.76, 0.79, 0.82, and 0.85 CNY/KW·h at the desirability values of 0.1, 0.3, 0.5, 0.7, and 0.9, respectively.
(2)
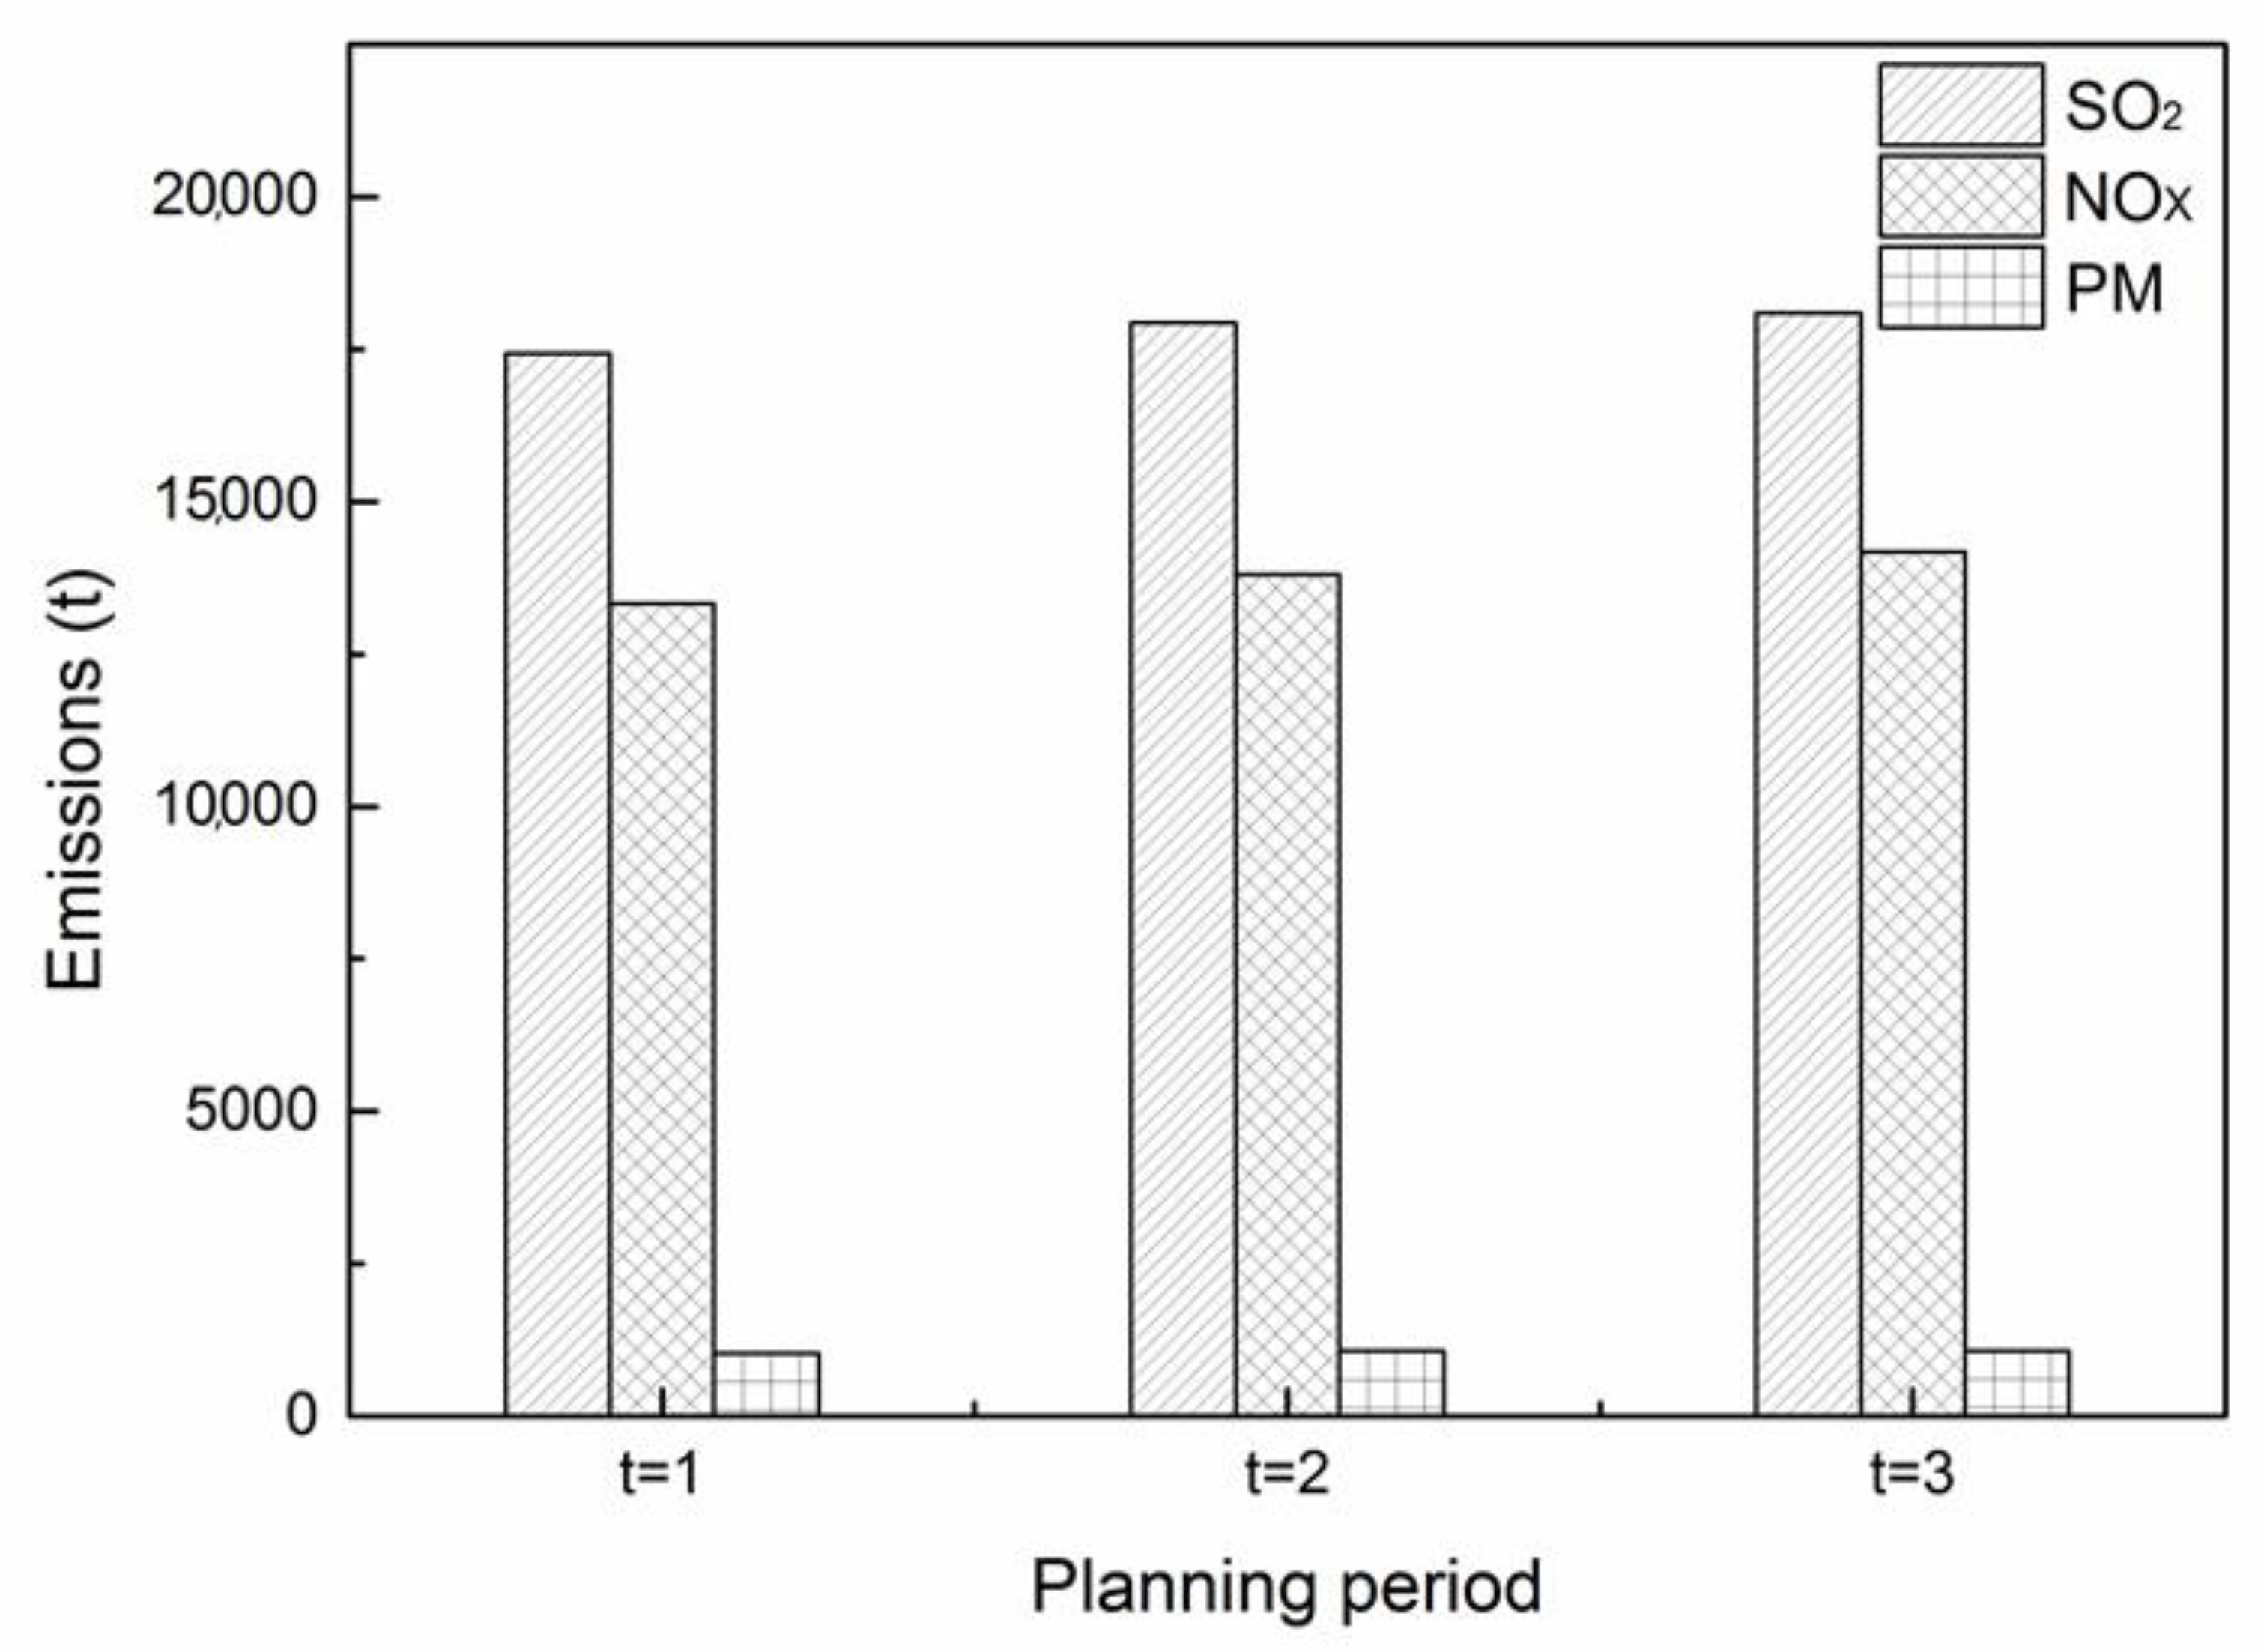
With the increase in the planning periods, the air pollutant emissions increased with the power generating amounts while the air pollutant emission intensity of SO2, NOx, and PM all decreased with the increase in the planning period.
(3)
When the desirability value was 0.1, the CO2 emissions limit was moderate and the CO2 emissions increased with the planning periods to obtain more economic benefits. When the desirability was above 0.3, the total emissions of CO2 all decreased with an increase in the desirability values. The total emissions of carbon dioxide were 2.15, 1.88, and 1.59 million tons for the three planning periods, respectively, at the desirability value of 0.9.
(4)
CO2 direct emissions accounted for above 96% of total CO2 emissions. High desirability values meant high requirements for reducing CO2 and air pollutant removal, thus with the increase in the desirability for each planning period, CO2 direct emissions decreased, while the indirect emissions of CO2 increased due to more applications of carbon capture and pollutant removal devices.
(5)
Combustion emissions and desulfurization emissions composed the direct emissions of CO2. CO2 combustion emissions were similar at different planning periods at the desirability of 0.1. When the desirability was above 0.3, CO2 combustion emissions decreased with the increase in the planning period. Proportions of indirect CO2 emissions by CO2 capture technology increased with the increase in the planning periods and desirability, and more CO2 capture technology application, higher indirect emission proportions of the technology, and less direct CO2 emissions by combustion.
Thus, from the conclusions above, for the power plants to the whole energy production processes, reinforcing the investment of carbon capture technology is an effective way to reduce CO2 emissions. However, with the increased requirements for emissions reduction, the indirect emissions of CO2 will increase. Thus, on one hand, it is meaningful to find the balanced energy producing strategy to keep the direct and indirect CO2 emissions at a low level on the premise of ensuring economic benefits; on the other hand, it is also important to find an energy conservation and pollution reduction approach to control CO2 emissions for coal fired power plants in the future.

Author Contributions

Conceptualization, H.W. and Z.F.; Methodology, Z.F.; Writing—original draft preparation, H.W.; Writing—review and editing, H.W.; Supervision, S.W.; Project administration, W.Z.; Funding acquisition, W.Z. All authors have read and agreed to the published version of the manuscript.

Funding

This work was supported by a National Key Research and Development Program (2019YFC0214200).

Institutional Review Board Statement

Not applicable.

Informed Consent Statement

Not applicable.

Conflicts of Interest

The authors declare no conflict of interest.

References

  1. Huanyu, Z.; Malin, S.; Zhiyang, S. The evolution of renewable energy and its impact on carbon reduction in China. Energy 2021, 237, 121639. [Google Scholar]
  2. Long, X.; Naminse, E.Y.; Du, J.; Zhuang, J. Nonrenewable energy, renewable energy, carbon dioxide emissions and economic growth in China from 1952 to 2012. Renew. Sustain. Energy Rev. 2015, 52, 680–688. [Google Scholar] [CrossRef]
  3. Okwanya, I.; Alhassan, A.; Migap, J.P.; Adeka, S.S. Evaluating renewable energy choices among rural communities in Nigeria. An insight for energy policy. Int. J. Energy Sect. Manag. 2020, 15, 157–172. [Google Scholar] [CrossRef]
  4. Song, M.; Zhao, X.; Shang, Y. The impact of low-carbon city construction on ecological efficiency: Empirical evidence from quasi-natural experiments. Resour. Conserv. Recycl. 2020, 157, 104777. [Google Scholar] [CrossRef]
  5. Zhao, X.; Shang, Y.; Song, M. Industrial structure distortion and urban ecological efficiency from the perspective of green entrepreneurial ecosystems. Soc. Econ. Plan. Sci. 2020, 72, 100757. [Google Scholar] [CrossRef]
  6. International Energy Agency. Data and Statistics. Available online: https://www.iea.org/data-and-statistics?country=WORLD&fuel=Energy%20supply&indicator=TPESbySource (accessed on 25 August 2021).
  7. Tomoaki, N. Developing effective CO2 and SO2 mitigation strategy based on marginal abatement costs of coal-fired power plants in China. Appl. Energy 2021, 294, 116978. [Google Scholar]
  8. Jidong, K.; Tsan, S.; Bin, S. Optimizing electricity mix for CO2 emissions reduction: A robust input-output linear programming model. Eur. J. Oper. Res. 2020, 287, 280–292. [Google Scholar]
  9. Juan, C.; González, P.; Takaaki, F.; Toshihiko, N. Analysis of CO2 emissions reduction potential in secondary production and semi-fabrication of non-ferrous metals. Energy Policy 2013, 52, 328–341. [Google Scholar]
  10. Boqiang, L.; Xiaoling, O. Analysis of energy-related CO2 (carbon dioxide) emissions and reduction potential in the Chinese non-metallic mineral products industry. Energy 2014, 68, 688–697. [Google Scholar]
  11. Zongguo, W.; Huifang, L. Analysis of potential energy conservation and CO2 emissions reduction in China’s non-ferrous metals industry from a technology perspective. Int. J. Greenh. Gas Con. 2014, 28, 45–56. [Google Scholar]
  12. Nan, Z.; David, F.; Michael, M.; Nina, Z.; Virginie, L.; Jing, K.; Yamina, S. Analysis of potential energy saving and CO2 emission reduction of home appliances and commercial equipments in China. Energy Policy 2011, 39, 4541–4550. [Google Scholar]
  13. Yun-Hsun, H.; Jung-Hua, W. Bottom-up analysis of energy efficiency improvement and CO2 emission reduction potentials in the cement industry for energy transition: An application of extended marginal abatement cost curves. J. Clean. Prod. 2021, 296, 126619. [Google Scholar]
  14. Bhadbhade, N.; Zuberi, M.J.S.; Patel, M.K. A bottom-up analysis of energy efficiency improvement and CO2 emission reduction potentials for the Swiss metals sector. Energy 2019, 181, 173–186. [Google Scholar] [CrossRef]
  15. Zuberi, M.J.S.; Patel, M.K. Bottom-up analysis of energy efficiency improvement and CO2 emission reduction potentials in the Swiss cement industry. J. Clean. Prod. 2017, 142, 4294–4309. [Google Scholar] [CrossRef]
  16. Wang, H.Y.; Su, B.; Mu, H.L.; Li, N.; Jiang, B.; Kong, X. Optimization of electricity generation and interprovincial trading strategies in Southern China. Energy 2019, 174, 696–707. [Google Scholar] [CrossRef]
  17. Wang, H.Y.; Su, B.; Mu, H.L.; Li, N.; Gui, S.; Duan, Y.; Jiang, B. Optimal way to achieve RPS policy goals from electricity generation, transmission and trading perspectives in Southern China. Energy Policy 2020, 139, 111319. [Google Scholar] [CrossRef]
  18. Boffino, L.; Conejo, A.; Sioshansi, R.; Oggioni, G. A two-stage stochastic optimization planning framework to decarbonize deeply electric power systems. Energy Econ. 2019, 84, 104457. [Google Scholar] [CrossRef]
  19. Domnguez, R.; Conejo, A.J.; Carrin, M. Toward fully renewable electric energy systems. IEEE Transact. Power Syst. 2015, 30, 1. [Google Scholar] [CrossRef]
  20. Lara, C.; Mallapragada, D.; Papageorgiou, D.; Venkatesh, A.; Grossmann, I. Deterministic electric power infrastructure planning: Mixed-integer programming model and nested decomposition algorithm. Eur. J. Oper. Res. 2018, 271, 1037–1054. [Google Scholar] [CrossRef]
  21. Moret, S.; Babonneau, F.; Bierlaire, M.; Marchal, F. Decision support for strategic energy planning: A robust optimization framework. Eur. J. Oper. Res. 2020, 280, 539–554. [Google Scholar] [CrossRef]
  22. Munoz, F.D.; Hobbs, B.F.; Watson, J.P. New bounding and decomposition approaches for MILP investment problems: Multi-area transmission and generation planning under policy constraints. Eur. J. Oper. Res. 2016, 248, 888–898. [Google Scholar] [CrossRef] [Green Version]
  23. Ruiz, C.; Conejo, A.J. Robust transmission expansion planning. Eur. J. Oper. Res. 2015, 242, 390–401. [Google Scholar] [CrossRef]
Figure 1. The process of coal-fired power generation.
Sustainability 13 11084 g001
Figure 2. Power generating cost at different desirability.
Sustainability 13 11084 g002
Figure 3. Air pollutant emissions at different planning periods.
Sustainability 13 11084 g003
Figure 4. The utilization rate of carbon capture technology at different planning periods with different desirability.
Sustainability 13 11084 g004
Figure 5. Total emissions (A), carbon dioxide emission intensity (B), and proportion of CO2 direct emissions (C) of carbon dioxide at different planning periods with different desirability.
Sustainability 13 11084 g005
Figure 6. Direct (A) and indirect (B) emissions of carbon dioxide.
Sustainability 13 11084 g006
Table 1. Generating cost for the three planning periods.
Coal TypePlanning Periods
Generating cost
(CNY/KW·h)
t = 1t = 2t = 3
C10.1350.1350.135
C20.1250.1250.125
C30.1150.1150.115
C40.110.110.11
Table 2. Power consumption of coal washing for the three planning periods.
Coal TypePlanning Periods
Power consumption of coal washing
(KW·h/t)
t = 1t = 2t = 3
C1777
C2888
C3999
C4101010
Table 3. Air pollution emission amounts for the three planning periods.
PollutantsPlanning Periods
Air pollution emission amounts
(g/KW·h)
t = 1t = 2t = 3
SO28.037.877.63
NOx6.906.766.56
Particulate matter (PM)3.353.283.18
Table 4. Power consumption of air pollution removal for the three planning periods.
PollutantsPlanning Periods
Power consumption of air pollution removal
(KW·h/t)
t = 1t = 2t = 3
SO2150015001500
NOx300030003000
Particulate matter (PM)110110110
Table 5. Power generating production and coal consumption of the three planning periods.
Power Generating Production (GW·h)Coal Consumption
(Million Tons)
i = 1i = 2i = 3i = 4
Planning periodt = 131,011.000001.21
t = 232,561.550001.25
t = 333,864.010001.26
Total 97,436.560003.72
Table 6. Air pollutant emissions intensity.
Planning Period (t)Emission Intensity (g/kW·h)
SO2NOxPM
10.560.430.034
20.550.420.033
30.530.420.032
Table 7. Proportions of direct CO2 emissions by combustion in total direct emissions.
Desirabilityt = 1t = 2t = 3
i = 0.198.07%98.07%98.10%
i = 0.397.99%97.92%97.89%
i = 0.597.89%97.71%97.59%
i = 0.797.78%97.49%97.23%
i = 0.997.67%97.17%96.68%
Table 8. Proportions of indirect CO2 emissions by CO2 capture technology in total indirect emissions.
Desirabilityt = 1t = 2t = 3
i = 0.111.26%10.97%10.62%
i = 0.311.85%11.93%11.96%
i = 0.512.44%13.06%13.43%
i = 0.713.02%13.98%14.69%
i = 0.913.59%15.06%16.08%
Publisher’s Note: MDPI stays neutral with regard to jurisdictional claims in published maps and institutional affiliations.

