Abstract
Artificial downwelling, which is an ecological engineering method, potentially alleviates bottom hypoxia by bringing oxygen-rich surface water down below the pycnocline. However, the downward flow is likely to disturb sediments (or induce sediment resuspension) when reaching the bottom and then have unwanted side effects on the local ecosystem. To evaluate this, our paper presents a theoretical model and experimental data for the sediment resuspension caused by artificial downwelling. The theoretical model considers the critical conditions for sediment resuspension and the scour volume with the downwelling flow disturbing sediment. Experiments with altered downwelling flow speeds, discharge positions relative to the bottom, and particle sizes of sediment were conducted in a water tank, and the results were consistent with our theoretical model. The results show that the critical Froude number (hereinafter Fr) for sediment resuspension is 0.5. The prevention of sediment resuspension requires the downwelling flow speed and the discharge position to be adjusted so that Fr < 0.5; otherwise a portion of sediment is released into the water and its volume can be predicted by the derived formulation based on the Shields theory. Furthermore, sediment resuspension has side effects, such as a water turbidity increase and phosphorus release, the magnitudes of which are discussed with respect to engineering parameters. Further study will focus on field experiments of artificial downwelling and its environmental impacts.
1. Introduction
Widely observed coastal hypoxia has been posing a threat to the aquatic environment [1]. Methods such as external nutrient loads control and large-scale engineering have been suggested to be effective at reducing hypoxia [2]. Among them is artificial downwelling, which brings oxygen-rich surface water down below the pycnocline to mitigate bottom hypoxia [3,4]. Stigebrandt et al. [2] proposed the idea of using an erect pipe to generate artificial downwelling. Sasaki et al. [5] developed a mechanical circulator driven by electricity to transport the surface water to the bottom through a draft tube, and its effectiveness was verified by field tests. The field tests indicated that the quality of both the water and sediment was improved in the short term by the mechanical circulator, while long-term sediment processes were not addressed. Stigebrandt et al. [6] used the pump system and fabric pipes to conduct an experiment in the By Fjord, and the change of the biogeochemical state in this area was discussed. The downwelling device described by them was equipped with a nozzle directing the outflow from the vertical pipe into four horizontal jets, in order to avoid erosion of the seabed, but this increased the energy loss of the equipment. Antonini et al. [7] introduced an innovative wave-driven device called OXYFLUX and performed flume experiments to investigate the dynamic response of this device. Though OXYFLUX was not tested in real seas, it did provide useful design recommendations for similar devices. Inspired by the above concepts, Xiao et al. [8] experimentally studied a tidal pump that combined a 90° bend with a vertical erect pipe, suggesting that parameters like the immersed length of the pump below the pycnocline and the pump geometry could be used to regulate downwelling flow.
Sediment resuspension, which is commonly observed in aquatic systems, results from either natural disturbance or anthropogenic activities [9,10,11]. Sediment resuspension caused by natural processes like waves, currents, tides, and bioturbating activities may have broad effects on biogeochemical cycles, nutrients release, and aquatic food webs in the long term and short term [12,13,14]. However, excessive resuspension may induce issues like a water quality decrease, algal blooms, and biological toxicity, posing a great threat to the ecological environments of these aquatic systems [15,16,17,18]. Many methods such as laboratory flume experiments, field observation, and numerical models are applied to study sediment resuspension [19,20,21]. Among these methods, laboratory experiment is the most basic one. Various studies have mentioned that sediment resuspension is caused by different engineering techniques, such as bottom trawling, sediment dredging and sea plowing [22,23,24]. These techniques sometimes fail to control sediment resuspension, which in turn decreases the water quality and damages the aquatic community. In the scenario of artificial downwelling, sediment is also at risk of disturbance. In particular, attention has focused on the development of various mechanical devices for artificial downwelling [25,26]. However, one of the key problems of artificial downwelling is how to avoid disturbing the surrounding environment, causing issues such as sediment resuspension and then nutrient release.
The aim of the present study is to find the critical conditions for sediment resuspension and the quantitative relationship between sediment resuspension and artificial downwelling. The objective was achieved by (i) a theoretical model, which was proposed to predict the particle resuspension for given conditions of artificial downwelling, and (ii) a total number of 50 tests for sediment resuspension and nutrients release, which were conducted with artificial downwelling generated under different parameters, including the downwelling flow speed, discharge distance to the bottom, and particle size of sediment. The results of this study will provide theoretical and experimental support for artificial downwelling engineering, where sediment resuspension needs to be avoided or reduced.
This paper is organized as follows: (1) materials and methods for experiments; (2) theoretical considerations for sediment resuspension; (3) validation of the theoretical model and discussion of the experimental results; (4) a summary of conclusions.
2. Materials and Methods
2.1. Experimental Apparatus
The experimental investigation was conducted in a cubic acrylic tank with a side length of 30 cm, as shown in Figure 1. A vertical panel which divided the flume into two chambers to reduce cross flow was set 10 cm from the flume wall. Water in the left chamber was lifted up by an electric pump and then entered into the right chamber as downwelling flow. The downwelling pipe was set vertically along the center axis of the right chamber with a nozzle diameter of 0.8 cm. The height of the discharge point was adjusted by moving the pipe up and down. Below the discharge point was the sediment layer.
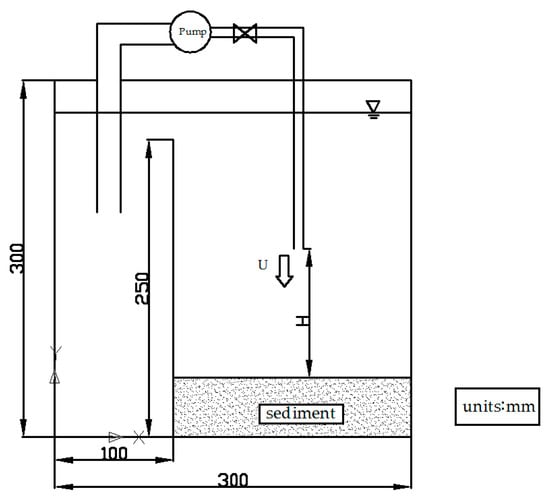
Figure 1.
The sketch of the experiment setup.
2.2. Sediments and Nutrients
Since the physicochemical property of sediment collected in different lakes or seas varies greatly, it is difficult to figure out what role the particle size plays in experiments [27,28]. To simplify the experiments and find out how the sediment particle size will affect sediment resuspension during artificial downwelling, different diameters of homogenous silica particles were used in the experiments [29,30,31]. Three particle sizes were used according to the literature [29], D1: 75, D2: 120, and D3: 212 µm. The experiment results can be applied to natural sediments with a mixture of particles of different sizes by weighted average method when the particle diameters of natural sediments are between 75 and 212 µm [32].
Phosphorus mainly exists as phosphate ions () in seawater and constitutes the most limiting element for algal growth [33]. Schindler demonstrated that the phosphorus concentration in lakes has a remarkable linear relationship with the chlorophyll concentration by experiments and field observations [34]. The release of a large amount of phosphorus from sediment may bring out an algal bloom. For these reasons, phosphorus was chosen as the representative nutrient in this study. We used the KH2PO4 solution as artificial pore water without considering other compositions. Given that the concentration of pore water varies significantly at different sites, KH2PO4 concentrations of 0.011 and 0.5 g/L were applied in the experiments [35,36].
2.3. Methods
It has been proven that sediment resuspension is sensitive to the downwelling flow velocity, discharge distance to the bottom, and particle size of sediment [9,37,38,39]. These parameters were therefore chosen in the current experiments to investigate the impacts of downwelling on sediment resuspension and nutrients release. Four different values of jet height (2, 4, 6, and 8 cm) and three particle of different diameters (75, 120, and 212 µm) were used in the experiments. In total, 50 experiments were conducted. More details of the experiments are presented in Table 1.

Table 1.
Range of experiments.
The experimental procedure was as follows:
- (1)
- At the beginning of the experiments, the homogeneous silica particles were spread so that they were flat in the tank and immersed in 0.9 L of artificial pore water. They were then kept undisturbed for 24 h;
- (2)
- The tap water was added into the flume slowly by a peristaltic pump, to avoid sediment resuspension. The water line was 26 cm above the bottom of the flume. Then, the apparatus was kept static for another day once the preparatory work mentioned before had been completed [40,41];
- (3)
- Water samples were collected from the center of the chambers 5 cm below the water line for measuring the water turbidity and phosphorus concentration. To reduce occasional errors, two replicate samples were collected;
- (4)
- The pump was started. The downwelling flow impinged the sediment-forming scour hole and the shape of the hole was nearly unchanged after 4 h;
- (5)
- The pump was closed and water samples were collected again. For the convenience of measuring the shape of the scour holes, water was carefully drained from the flume by syringes;
- (6)
- The needle water-level gauge was used to approximately measure the shape of the scour hole. The needle was inserted into the hole until it touched the sediment surface and was moved horizontally and vertically. After we had obtained the measured values, this step was repeated three times to minimize errors and the average value was used as the dimension of the hole;
- (7)
- The turbidity and phosphorus concentration of the water samples were measured. The water turbidity was measured by a turbidity meter (SGZ-B) and the phosphorus concentration was analyzed by the phosphomolybdenum blue spectrophotometry method [42];
- (8)
- Steps (1) to (7) were repeated until all tests had been completed.
3. Theoretical Considerations for Sediment Resuspension
In the early stage of sediment resuspension, particles begin to move when the applied shear stress exceeds the critical shear stress. In this study, sediment was impinged by the downwelling flow. The downwelling flow applies shear stress to the bottom to initiate sediment resuspension and the scour hole will come into being in the meantime. An equilibrium state will asymptotically be reached once the hydrodynamic force produced by the downwelling flow is equal to the resistance caused by the sediment bed. To quantify the influence of downwelling flow on the sediment resuspension, a semi-empirical equation for the volume of the scour hole was developed based on the Shields criterion and experimental results. Figure 2 is a definition sketch.
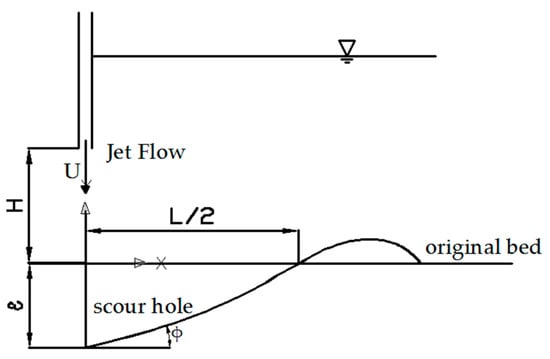
Figure 2.
Definition sketch.
The bed shear stress τb and critical shear stress τc can be described as follows, respectively:
where Cf is a friction coefficient, ρf is the fluid density, and ub is the diffused shear velocity in the scour hole, and
where u*c is the critical shear velocity at a certain slope of the scour hole, C1 is another friction coefficient, and uc is the critical shear velocity for incipient motion.
For a simplified expression of the Shields curve for u*cs, the critical shear velocity required for particle incipient motion is as follows [43]:
where C2 is an adjustable coefficient, g is the gravitational acceleration, ρs is the density of the sediment, and D is the size of the particles.
With the flow continuously impinging on the sediment, the Shields critical shear velocity u*cs will be affected by the bed slope. An equation accounting for this factor was presented by Chiew et al. [44]:
where φ is the angle of the bed slope and θ is the angle of repose of sediment. The value of θ is related to the forces acting tangentially and normally on the sediment. An average value of θ = 36° was used in the study conducted by Chiew et al. [44].
For ub, Meilan Qi et al. proposed a dimensional analysis and conservation of momentum as [38]
where ubj refers to the vertical flow velocity near the sediment bed, C3 is a proportionality coefficient, H is the vertical distance from the nozzle to the sediment surface, and x is the horizontal distance in the transition flow direction from the impinging point. Figure 3 is an axial symmetric view of the jet.
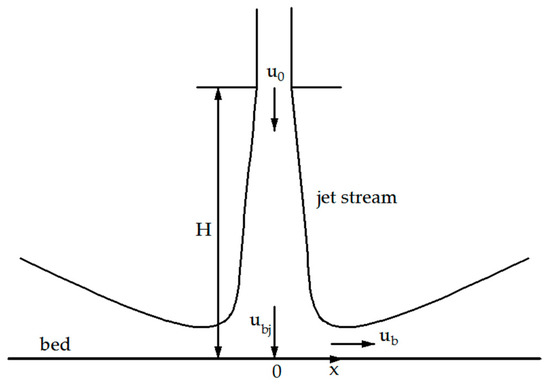
Figure 3.
Axial symmetric view of the impinging jet.
Combining Equations (2) to (5) and the conditions ub = uc and x = L/2, we can get the following equation:
where C4 is a coefficient and L is the length of the scour hole in the state of equilibrium.
To formulize the depth of the scour hole under equilibrium conditions, a formula for the decay of the centerline velocity of the downwelling flow is introduced [45]:
where u0 is the flow velocity near the nozzle and it is equivalent to U, C5 is a coefficient determined by experiments, y is the distance from the nozzle to the bottom of the scour hole along the centerline, and d is the diameter of the nozzle. The value of ub depends on momentum flux, and it is related to Froude numbers. This equation was also used successfully by Aderibigbe et al. [43], and they did a series of experiments when the Reynolds number reached about 70,000. Equation (7) and C5 are valid for jets when Re ≤ 70000. Due to the limitations of the experiments and literatures, more tests are needed to judge whether Equation (7) and C5 are still valid or not for jets when Re is larger than 70,000.
Combining Equations (2) to (4) and (7) and the conditions ub = uc and y = ε+H, the following equation for the equilibrium scour depth ε is obtained:
Assuming that the section of the scour hole is approximately conical in the limited depth of sediment layer [43], the equation for the scour volume can be derived by combining Equations (5)–(8) as follows:
where V is the volume of the scour hole, and C7 and C8 are both adjustable coefficients.
4. Results and Discussion
4.1. Experimental Investigations
A total of 50 tests were performed and the details are summarized in Table 1.
To attain effective results illustrative of the real environment, gravitational similarity should be first guaranteed and then frictional effect. It is, however, impossible to achieve both simultaneously. In our experiments, the Reynolds numbers of the pipe jet were ranging from 780 to 2800, thus the jet was not fully turbulent. Large gaps between the experimental Reynolds number and the actual one suggest very different frictional conditions, but they have little impact on the flow. Experiments were conducted on a model at 1:80 scale. The experimental data were used to determine the adjustable coefficients C7 and C8 in Equation (9), and a semi-empirical equation was obtained, which reveals the dependence of the scour volume on the ratio of jet momentum force to particle friction. In addition, the water turbidity change and phosphorus concentration differences caused by downwelling under different hydrodynamic conditions have also been discussed.
4.2. Sediment Resuspension
Tests 45–49 employed lower flow velocities to explore the critical conditions for sediment resuspension. As is shown in Figure 4, in the early stage of sediment resuspension, the dimension of the scour hole increased with the growth of the flow velocity.
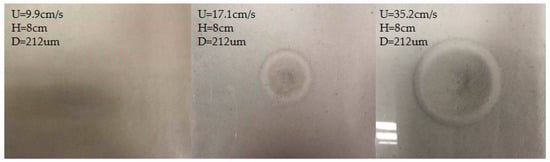
Figure 4.
Photos of the scour hole varying with flow speed.
Figure 5 demonstrates a critical condition for sediment resuspension. The critical value of the ratio of jet momentum force to particle resistance,
was approximately 0.5. By regulating the height of the nozzle and the flow velocity, Fr < 0.5 could be achieved, to avoid sediment resuspension.
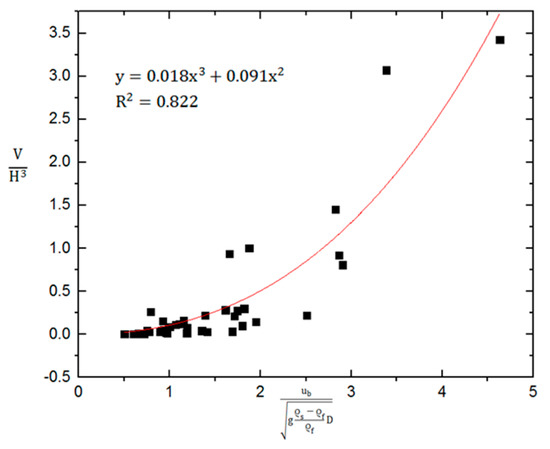
Figure 5.
Scour volume for downwelling flow.
Based on the experimental data, the coefficients C7 and C8 in Equation (9) were obtained by the regression method, expressed as
The fitting curve of Equation (9) is plotted in Figure 4 and is expressed as
Figure 6 is a photo of scour hole variation with jet height. Figure 7a–c shows the effects of jet height on the volume of the scour hole when D = 75, 120, and 212 µm. From the recorded data, it is apparent that the volume of the scour hole did not keep increasing as the jet height decreased. The critical height was defined once the scour hole reached its maximum volume. A reasonable explanation for this is that an impinging jet tended to be narrower under a smaller jet height, where little hydrodynamic effect was produced beyond the scour hole to remove suspended particles.
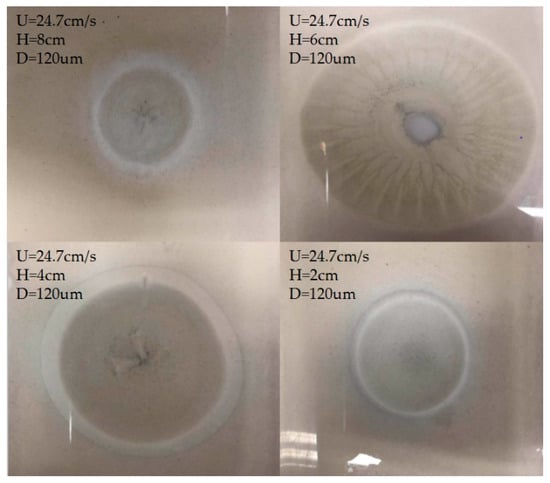
Figure 6.
Scour hole photos for visual comparison.
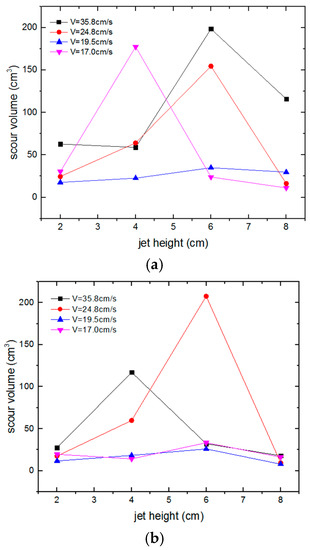
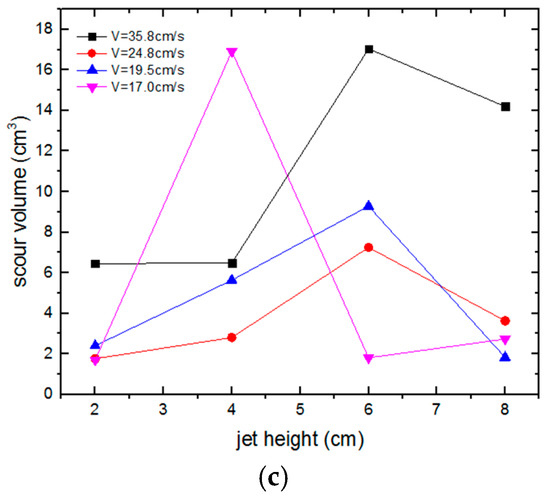
Figure 7.
(a) Variation of the scour volume with jet height (D = 75 µm). (b) Variation of the scour volume with jet height (D = 120 µm). (c) Variation of the scour volume with jet height (D = 212 µm).
Figure 8 presents the distribution of scour volume with different diameters of sediment particles. Obviously, all of the data for the particle size D = 75 µm were greater than those for the particle size D = 212 µm. This can be explained by the fact that larger particles needed a greater hydrodynamic force for incipient motion and it was more difficult to resuspend them. However, the data for D = 120 µm were not totally distributed between the data for D = 75 µm and D = 212 µm. For Test 3 and Test 6 (D = 75 µm), the scour volumes were not greater than those in Test 19 and Test 22 (D = 120 µm), which was probably due to the optimum conditions being achieved in Test 19 and Test 22 and the particle sizes’ effects on the scour volume not being that big.
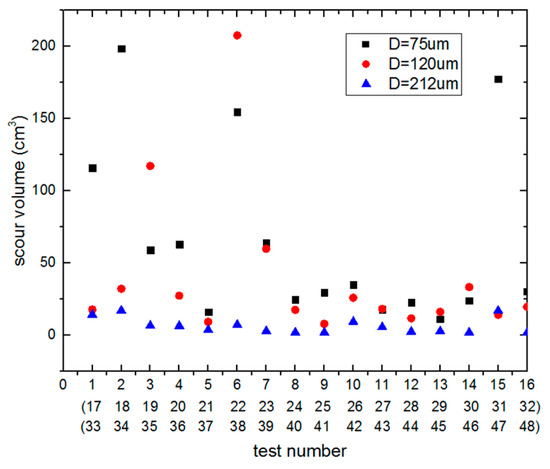
Figure 8.
Distribution of the scour volume with different diameters of particles.
When sediment resuspension occurs, the suspended particles from the scour hole are distributed in ambient water, thus increasing the water turbidity [46]. Controlling the water turbidity during sediment resuspension is of significance to engineering applications and ecological management [47]. In this study, the value of water turbidity mainly depended on the scour volume. Here, a quantitative relation between water turbidity and scour volume has been established based on the experimental data. Figure 9a,b shows that the water turbidity increased linearly with the scour volume when D = 75 µm and D = 120 µm. Based on these results, we could also estimate the water turbidity by combining Equation (11) and the linear relation between the scour volume and water turbidity. When D = 212 µm (Figure 9c), the water turbidity was low and no obvious relationship between the scour volume and turbidity existed. There are two reasons that can probably explain this. One reason is that the flow velocity was small and only a few particles were resuspended. Another reason is that the high sinking speed of these relatively large particles made them quickly fall on the sediment.
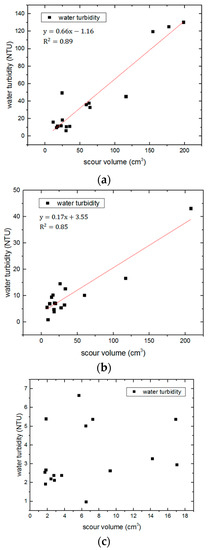
Figure 9.
(a) Correlation between the scour volume and turbidity (D = 75 µm). (b) Correlation between the scour volume and turbidity (D = 120 µm). (c) Correlation between the scour volume and turbidity (D = 212 µm).
According to Stokes’ law, we can estimate the particle sinking speed by the following Equation:
Here, v is the sinking speed of the particle, r is the diameter of the particle, ρ is the density of the particle, ρ0 is the density of the fluid, η is the dynamic viscosity of the fluid, and g is the gravitational acceleration.
The obtained particle sinking speed is about 3.7 cm/s and this indicates that the sinking speed is large enough to influence the observed water turbidity.
4.3. Phosphorus Release
Generally, there are two main reasons for a change of phosphorus concentration in the main water body. As pore water is released from the sediment, it will deliver more phosphorus into the ambient water [15,48]. Another reason is that the desorption and absorption of phosphorus occurs in the presence of resuspended particles [49]. Figure 10a,b shows that the phosphorus concentration differences vary with the scour volume for a given concentration of pore water. Unlike turbidity, these two figures show that the phosphorus concentration differences do not change linearly with the scour volume. This is probably due to the desorption and adsorption of phosphorus from the particle. In our experiments, variables such as the particle size, flow rate, and jet height could have influence on the phosphorus concentration change. Deriving an equation to describe the quantitative relationship between the experimental variables and phosphorus concentration is quite difficult.
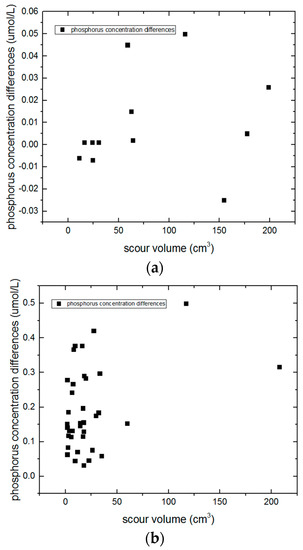
Figure 10.
(a) Variation of phosphorus concentration differences with scour volume (C = 0.011 g/L). (b) Variation of phosphorus concentration differences with scour volume (C = 0.5 g/L).
Moreover, from Figure 10a, we know that when the pore water concentration C = 0.011 g/L, there are a few points where phosphorus concentration differences are less than 0. This can be explained by the fact that the release of phosphorus from the sediment after disturbance is smaller than the adsorption of phosphorus by particles. When C = 0.5 g/L, most of the data for phosphorus concentration differences are higher than those when C = 0.011 g/L, which indicates that sediments with a higher phosphorus concentration of pore water tend to release more phosphorus after disturbance.
5. Conclusions
In the present study, the effects of artificial downwelling on sediment resuspension have been investigated theoretically and experimentally. A theoretical model which establishes the quantitative relationship between the sediment resuspension and hydrodynamic parameters of artificial downwelling has been presented based on the Shields criterion. The empirical model could be used to estimate or predict the scour volume. The proposed theoretical model has been confirmed by experimental data. In the experiments, the downwelling flow velocity, discharge distance to the bottom, and particle size of sediment were chosen as variables. The results show that the critical Froude number for sediment resuspension is approximately equal to 0.5. Sediment resuspension is avoided when Fr < 0.5, which can be achieved by regulating the downwelling flow velocity and discharge distance. When Fr > 0.5, a scour hole forms and there exists a critical discharge distance to the bottom, at which point the scour hole has the largest volume.
The experimental results also show that phosphorus concentration differences and water turbidity change are closely related to sediment resuspension. The water turbidity during sediment resuspension has a linear relationship with the scour volume when the particle size D = 75 µm and D = 120 µm. Sediment with a higher phosphorus concentration tends to release more phosphorus after disturbance. The quantitative relation between phosphorus release and sediment resuspension is affected by the discharge distance, flow velocity, and sediment particle size, which should be further studied. Furthermore, our findings can be applied in places like Markermeer in Europe, Baltimore Harbor in America, Lake Taihu in China, and the East China Sea [14,50,51,52].
Although flume experiments have some limitations, the obtained results could be used to guide the design of artificial downwelling. Further study will focus on field experiments of artificial downwelling and its potential impacts on the environment. Moreover, particle resuspension caused by artificial downwelling has wide applications in industry, including in the assessment of the stability of hydraulic structures, water delivery and utility systems, and nuclear engineering.
Author Contributions
Conceptualization, and writing—review and editing, W.F.; data curation, formal analysis, investigation, validation, and writing—original draft preparation, W.B.; methodology, C.X.; supervision, Z.Z., Y.P., Y.C. and S.L. All authors have read and agreed to the published version of the manuscript.
Funding
This research was financially funded by the National Natural Science Funds of China (No. 41976199); and the National Key Research and Development Program of China (No. 2016YFA0601400).
Conflicts of Interest
The authors declare no conflict of interest.
References
- Diaz, R.J.; Rosenberg, R. Spreading dead zones and consequences for marine ecosystems. Science 2008, 321, 926–929. [Google Scholar] [CrossRef] [PubMed]
- Stigebrandt, A.; Gustafsson, B.G. Improvement of baltic proper water quality using large-scale ecological engineering. AMBIO 2007, 36, 280–286. [Google Scholar] [CrossRef]
- Ouchi, K.; Nakahara, H. The deep ocean water upwelling machine using density current-creation of fishing ground and absorption of CO2. In Proceedings of the OCEANS’99 MTS/IEEE, Riding the Crest into the 21st Century, Seattle, WA, USA, 13–16 September 1999; IEEE: Piscataway, NJ, USA, 1999; pp. 1019–1024. [Google Scholar]
- Ouchi, K.; Otsuka, K.; Nakatani, N.; Yamatogi, T.; Awashima, Y. Effects of density current generator in semi-enclosed bay. In Proceedings of the OCEANS 2008-MTS/IEEE Kobe Techno-Ocean, Kobe, Japan, 8–11 April 2008; IEEE: Piscataway, NJ, USA, 2008; pp. 1–5. [Google Scholar]
- Sasaki, J.; Kanayama, S.; Nakase, K.; Kino, S. Effective application of a mechanical circulator for reducing hypoxia in an estuarine trench. Coast. Eng. J. 2009, 51, 31. [Google Scholar] [CrossRef]
- Stigebrandt, A.; Liljebladh, B.; de Brabandere, L.; Forth, M.; Granmo, A.; Hall, P.; Hammar, J.; Hansson, D.; Kononets, M.; Magnusson, M.; et al. An experiment with forced oxygenation of the deepwater of the anoxic By Fjord, western Sweden. Ambio 2015, 44, 42–54. [Google Scholar] [CrossRef]
- Antonini, A.; Lamberti, A.; Archetti, R. OXYFLUX, an innovative wave-driven device for the oxygenation of deep layers in coastal areas: A physical investigation. Coast. Eng. 2015, 104, 54–68. [Google Scholar] [CrossRef]
- Xiao, C.; Fan, W.; Qiang, Y.; Xu, Z.; Pan, Y.; Chen, Y. A tidal pump for artificial downwelling: Theory and experiment. Ocean Eng. 2018, 151, 93–104. [Google Scholar] [CrossRef]
- Schoellhamer, D.H. Anthropogenic sediment resuspension mechanisms in a shallow microtidal estuary. Estuar. Coast. Shelf Sci. 1996, 43, 533–548. [Google Scholar] [CrossRef]
- Ogilvie, B.G.; Mitchell, S.F. Does sediment resuspension have persistent effects on phytoplankton? Experimental studies in three shallow lakes. Freshw. Biol. 2010, 40, 51–63. [Google Scholar] [CrossRef]
- Soares, C.; Sobral, P. Bioturbation and Erodibility of Sediments from the Tagus Estuary. J. Coast. Res. 2009, 25, 1429–1433. [Google Scholar]
- Ferré, B.; De Madron, X.D.; Estournel, C.; Ulses, C.; Corre, G.L. Impact of natural (waves and currents) and anthropogenic (trawl) resuspension on the export of particulate matter to the open ocean. Application to the Gulf of Lion (NW Mediterranean). Cont. Shelf Res. 2008, 28, 15. [Google Scholar] [CrossRef]
- Saint-Béat, B.; Dupuy, C.; Agogué, H.; Carpentier, A.; Chalumeau, J.; Como, S.; David, V.; De Crignis, M.; Duchêne, J.-C.; Fontaine, C. How does the resuspension of the biofilm alter the functioning of the benthos–pelagos coupled food web of a bare mudflat in Marennes-Oléron Bay (NE Atlantic)? J. Sea Res. 2014, 92, 144–157. [Google Scholar] [CrossRef]
- Pardo, M.A.D.L.; Bakker, M.; Kessel, T.V.; Cozzoli, F.; Winterwerp, J.C. Erodibility of soft freshwater sediments in Markermeer: The role of bioturbation by meiobenthic fauna. Ocean Dynam. 2013, 63, 9–10. [Google Scholar]
- Ni, Z.; Zhang, L.; Yu, S.; Jiang, Z.; Zhang, J.; Wu, Y.; Zhao, C.; Liu, S.; Zhou, C.; Huang, X. The porewater nutrient and heavy metal characteristics in sediment cores and their benthic fluxes in Daya Bay, South China. Mar. Pollut. Bull. 2017, 124, 547–554. [Google Scholar] [CrossRef] [PubMed]
- Havens, K.E.; Jin, K.-R.; Iricanin, N.; James, R.T. Phosphorus dynamics at multiple time scales in the pelagic zone of a large shallow lake in Florida, USA. Hydrobiologia 2007, 581, 25–42. [Google Scholar] [CrossRef]
- Järvenpää, M.; Lindström, K. Water turbidity by algal blooms causes mating system breakdown in a shallow-water fish, the sand goby Pomatoschistus minutus. Proc. Biol. Sci. 2004, 271, 2361–2365. [Google Scholar] [CrossRef]
- Nathana, K.; Joelp, A.; Trevorh, B.; Emmal, J. Contemporary ecological threats from historical pollution sources: Impacts of large-scale resuspension of contaminated sediments on sessile invertebrate recruitment. J. Appl. Ecol. 2010, 46, 770–781. [Google Scholar]
- Mehta, A.J. On estuarine cohesive sediment suspension behavior. J. Geophys. Res.-Oceans 1989, 94, 14303–14314. [Google Scholar] [CrossRef]
- Amos, C.L.; Daborn, G.R.; Christian, H.A.; Atkinson, A.; Robertson, A. In situ erosion measurements on fine-grained sediments from the Bay of Fundy. Mar. Geol. 1992, 108, 175–196. [Google Scholar] [CrossRef]
- Cozzoli, F.; Gjoni, V.; Del Pasqua, M.; Hu, Z.; Ysebaert, T.; Herman, P.M.; Bouma, T.J. A process based model of cohesive sediment resuspension under bioturbators’ influence. Sci. Total Environ. 2019, 670, 18–30. [Google Scholar] [CrossRef]
- Pilskaln, C.H.; Churchill, J.H.; Mayer, L.M. Resuspension of sediment by bottom trawling in the gulf of Maine and potential geochemical consequences. Conserv. Biol. 2010, 12, 1223–1229. [Google Scholar] [CrossRef]
- Jones-Lee, A.; Lee, G.F. Role of iron chemistry in controlling the release of pollutants from resuspended sediments. Remediat J. 2010, 16, 33–41. [Google Scholar] [CrossRef]
- Roberts, D.A. Causes and ecological effects of resuspended contaminated sediments (RCS) in marine environments. Environ. Int. 2012, 40, 230–243. [Google Scholar] [CrossRef] [PubMed]
- Fan, W.; Pan, D.; Xiao, C.; Lin, T.; Pan, Y.; Chen, Y. Experimental study on the performance of an innovative tide-induced device for artificial downwelling. Sustainability. 2019, 11, 5268. [Google Scholar] [CrossRef]
- Xiao, C.; Fan, W.; Yao, Z.; Qiang, Y.; Pan, Y.; Chen, Y. On the total entrained flow rate of artificial downwelling. Ocean Eng. 2019, 181, 13–28. [Google Scholar] [CrossRef]
- Jian, H.; Xu, Q.; Xi, B.; Wang, X.; Li, W.; Gao, G.; Huo, S.; Xia, X.; Jiang, T.; Ji, D. Impacts of hydrodynamic disturbance on sediment resuspension, phosphorus and phosphatase release, and cyanobacterial growth in Lake Tai. Environ. Earth Sci. 2015, 74, 3945–3954. [Google Scholar]
- Qian, J.; Zheng, S.S.; Wang, P.F.; Wang, C. Experimental study on sediment resuspension in Taihu Lake under different hydrodynamic disturbances. J. Hydrodyn. 2011, 23, 826–833. [Google Scholar] [CrossRef]
- Colomer, J.; Fernando, H.J.S. Resuspension of sediments by multiple jets. J. Hydraul. Eng. 1999, 125, 765–770. [Google Scholar] [CrossRef]
- Precht, E.; Huettel, M. Advective pore-water exchange driven by surface gravity waves and its ecological implications. Limnol. Oceanogr. 2003, 48, 1674–1684. [Google Scholar] [CrossRef]
- Colomer, J.; Casamitjana, X.; Fernando, H.J.S. Resuspension and Sedimentation of Particles from a Sediment Bed by Turbulent Jets. Appl. Sci. Res. 1997, 59, 229–242. [Google Scholar] [CrossRef]
- Huisman, B.J.A.; Sirks, E.E.; van der Valk, L.; Walstra, D.J.R. Time and spatial variability of sediment grading in the surfzone of a large scale nourishment. J. Coast. Res. 2014, 70, 127–132. [Google Scholar] [CrossRef]
- Scarlatos, P.D. Experiments on water-sediment nutrient partitioning under turbulent, shear and diffusive conditions. Water Air Soil Pollut. 1997, 99, 411–425. [Google Scholar] [CrossRef]
- Schindler, D.W. Evolution of phosphorus limitation in lakes. Science 1977, 195, 260–262. [Google Scholar] [CrossRef] [PubMed]
- Christensen, K.K.; Andersen, F.Ø. Influence of Littorella uniflora on phosphorus retention in sediment supplied with artificial porewater. Aquat. Bot. 1996, 55, 183–197. [Google Scholar] [CrossRef]
- Graca, B.; Witek, Z.; Burska, D.; Białkowska, I.; Łukawska-Matuszewska, K.; Bolałek, J. Pore water phosphate and ammonia below the permanent halocline in the south-eastern Baltic Sea and their benthic fluxes under anoxic conditions. J. Mar. Syst. 2006, 63, 141–154. [Google Scholar] [CrossRef]
- Antonini, A.; Gaeta, M.G.; Lamberti, A. Wave—Induced devices for the oxygenation of deep layer: A physical investigation. Coast. Eng. P 2012, 1, 33. [Google Scholar] [CrossRef]
- Meilan, Q.; Fujisak, K.; Tanaka, K. Sediment resuspension by turbulent jet in an intake pond. J. Hydraul. Res. 2000, 38, 323–330. [Google Scholar]
- Mazurek, K.A.; Rajaratnam, N.; Sego, D.C. Scour of cohesive soil by submerged circular turbulent impinging jets. J. Hydraul. Eng. 2001, 127, 598–606. [Google Scholar] [CrossRef]
- Wu, Y.; Wen, Y.; Zhou, J.; Wu, Y. Phosphorus release from lake sediments: Effects of pH, temperature and dissolved oxygen. KSCE J. Civ. Eng. 2014, 18, 323–329. [Google Scholar] [CrossRef]
- Phillips, I.R.; Burton, E.D.; Hawker, D.W. Effect of diffusion and resuspension on nutrient release from submerged sediments. Toxicol. Environ. Chem. 2005, 87, 373–388. [Google Scholar] [CrossRef]
- Ji, W.; Yu, T. Technical Regulations for Marine Chemical Investigation, 1st ed.; Ocean Press: Beijing, China, 2006; pp. 31–34. [Google Scholar]
- Aderibigbe, O.O.; Rajaratnam, N. Erosion of loose beds by submerged circular impinging vertical turbulent jets. J. Hydraul. Res. 1996, 34, 19–33. [Google Scholar] [CrossRef]
- Chiew, Y.M.; Parker, G. Incipient sediment motion on non-horizontal slopes. J. Hydraul. Res. 1994, 32, 649–660. [Google Scholar] [CrossRef]
- Chee, S.P.; Yuen, E.M. Erosion of unconsolidated gravel beds. Can. J. Civ. Eng. 1985, 12, 559–566. [Google Scholar] [CrossRef]
- Sims, C.; Cotching, B. Erosion and water quality turbidity and sediment loads from selected catchments in north-west Tasmania. Nat. Resour. Manag. 2000, 3, 8–14. [Google Scholar]
- Macdonald, R.K.; Ridd, P.V.; Whinney, J.C.; Piers, L.; Neil, D.T. Towards environmental management of water turbidity within open coastal waters of the Great Barrier Reef. Mar. Pollut. Bull. 2013, 74, 82–94. [Google Scholar] [CrossRef] [PubMed]
- Borglin, S.; Wilke, A.; Jepsen, R.; Lick, W. Parameters affecting the desorption of hydrophobic organic chemicals from sediments. Environ. Toxicol. Chem. 2010, 15, 2254–2262. [Google Scholar] [CrossRef]
- Ouyang, Q.L.; Gao, G.Q.; Liu, S.S.; Shi, X.L.; Ju, H.Y. Study on adsorption and desorption of suspended sediments to phosphorus in Ganjiang River. Adv. Mater. Res. 2012, 599, 669–672. [Google Scholar] [CrossRef]
- Maa, J.P.-Y.; Sanford, L.; Halka, J.P. Sediment resuspension characteristics in Baltimore harbor, Maryland. Mar. Geol. 1998, 146, 137–145. [Google Scholar] [CrossRef]
- Qin, B.; Hu, W.; Gao, G.; Luo, L.; Zhang, J. Dynamics of sediment resuspension and the conceptual schema of nutrient release in the large shallow Lake Taihu, China. Chin. Sci. Bull. 2004, 49, 54–64. [Google Scholar] [CrossRef]
- Pan, Y.; Li, Y.; Fan, W.; Zhang, D.; Chen, Y. A sea trial of air-lift concept artificial upwelling in the East China Sea. J. Atoms Ocean Tech. 2019, 36, 2191–2204. [Google Scholar] [CrossRef]
© 2020 by the authors. Licensee MDPI, Basel, Switzerland. This article is an open access article distributed under the terms and conditions of the Creative Commons Attribution (CC BY) license (http://creativecommons.org/licenses/by/4.0/).