Abstract
In Europe, the share of people aged 65 years and above is expected to increase exponentially, and in 2050, for the first time in human history, the number of older people will be larger than the number of children under the age of 15. Aging is associated with increased vulnerability and dependence on medical care services. For these reasons, providing access to health services to people aged 65 years and over is crucial. From the perspective of social equity, everyone should have the opportunity to access healthcare services equally, but due to economic and geographical issues, achieving this level of equity is challenging. The aim of this study was to fill the gap between scientific and actual practices using an accessibility measure to evaluate urban accessibility to primary healthcare services and to support decision-makers to better allocate resources in local restructuring of welfare policies. The accessibility measure was designed considering both the land use and the transportation components, the local healthcare supply system, and a multimodal transportation network. The methodology was applied to the city of Naples considering Local Health Agency (ASL) healthcare services to the elderly. The ASL is the largest health agency in Europe, consisting of 17 buildings serving nearly 200,000 elderly. The results show that the entire elderly neighborhood population suffers from poor accessibility to primary health services, especially in the city suburbs, and that the methodology could be effectively applied to urban planning strategies to achieve a high quality of life for elderly people. Due to poor dialogue between the authorities, this could help to improve the decision-making process through the lens of social equity.
1. Introduction
Demographic aging is increasing in urban areas and its economic and social consequences are comparable to those of the Industrial Revolution [1]. The prospects of the European population are distinctive, not only due to a considerable decline in population growth compared to other continents, but especially due to the combination of advanced aging and a shrinking labor force [2]. In Europe, the share of people aged 65 years and over is expected to increase from 19.4% in 2017 to 30% of the total population in 2060, and in 2050, for the first time in human history, the number of older people will be larger than the number of children under the age of 15 [3]. In the European context, the demographic shift will be dramatic in Germany, Portugal, Spain, and Italy, where the most aged major cities are located. The Italian Institute of Statistics [4] forecasts a significant reduction in the total population, from over 60 million people in 2018 to 46 million in 2065, with a simultaneous notable increase in the proportion of the Italian population over 65, from 22.7% in 2019 to 30.5% in 2065. This means that Italy would be an even older nation.
Considering their significant increase in number and their health conditions, the elderly is a group of interest: Due to improvements in nutrition, sanitation, and medical care, older people are healthier than previous generations of the same age. However, aging is also associated with an increasing vulnerability and dependence on medical care services. From the perspective of social equity, everyone should have the opportunity to access such services equally, but due to economic and geographical issues, achieving this level of equity is challenging [5]. Local authorities should prioritize the implementation of policies to promote higher life-quality standards for this increasing portion of population. The accessibility approach can be useful to achieve this aim because it considers both the land use system, consisting of the amount, quality, and spatial distribution of supply and demand of activities, and the transport system, considering individual needs, abilities, and opportunities [6,7]. Many studies showed that mobility and accessibility trends of the elderly are a critical aspect of transport systems [8,9,10,11], so the provision of a sustainable transport system, designed to meet the elderly’s mobility needs, is urgently required [12]. The activity system needs to be shaped and organized to provide a uniform level of access within the same city. Providing decision support tools to a local administrator for evaluating and assessing the accessibility level to medical care services in urban areas is crucial [13].
The problem that motivated this study is the existing gap between scientific and actual practices given the lack of an accessibility measure that can be used to evaluate urban accessibility to essential urban services for the elderly and to support decision-makers to better allocate resources in local restructuring urban policies. This study represents a further development of our previous study [14]. The accessibility paradigm has been largely discussed by the international scientific literature and has translated into numerous computable measures, which differ considerably in their applications and, most of all, in their theoretical basis. Accessibility is defined as a multidisciplinary concept, and this can lead to a lack of clarity and intelligibility in research. Accessibility measures have hardly ever been used in real practice: Urban development plans in Italy are formed by urban planners and consultants, usually using conventional tools that lack deep integration with the main urban subsystems (transportation, land use, and urban actors). For the same reasons, comparisons of accessibility among similar cities are difficult.
The main contribution of this work is the proposal of geographic information system (GIS)-based method to evaluate accessibility to public primary healthcare services. Our objective was to measure the accessibility of elderly people to public primary health care services according to the active accessibility paradigm.
The remainder of this paper is organized as follows: In Section 2, the existing work regarding measurement of accessibility of the elderly to public services in different countries is reviewed. Then, our methodology, the case study city (Naples), and the modeling method are described. Section 3 presents the findings of the model. The discussion, including the contributions to urban planning for a healthier city in Italy, the status of Naples compared to other cities, and the associations of these accessibilities with the mobility of the older people, is then presented.
2. Literature Review
The concept of accessibility is broad and flexible [15] in various aspects including physical, psychological, economic, and social issues, which can be dependent on per capita land use and transport network [7]. Through this lens, the accessibility paradigm is far from the location-based notion traditionally used in transport studies, namely related to the costs (time and money) needed to reach a destination. Accessibility is a multidisciplinary concept that cannot be assessed as a simple count of facilities or services by some geographical unit, without considering factors such as spatial externalities, the structure of the transport network, the choice behavior of travelers, the frictional effects of distance, properties of the supply side, and measurement issues related to the large scale of analysis. Different definitions have been developed by the scientific community. No consensus exists in the literature, which is natural due to the lack of a best approach to define and compute accessibility. Accessibility is often defined as the amount and diversity of places that can be reached within a given travel time and/or cost [16]. Hansen [17] defined accessibility as the different possibility/ability to negotiate space and time in everyday life to accomplish practices and maintain relationships that people perceive as necessary for normal social participation. Geurs and van Wee [7] described accessibility as the extent to which land use and the transport system enable (groups of) individuals or goods to reach activities or destinations by means of a (combination of) transport mode(s). In line with this definition, accessibility is closely related with the interplay between transport systems and land use patterns and is used when referring to a location’s perspective. Bhat [18] defined accessibility as a measure of the ease of an individual to pursue an activity of a desired type, at a desired location, by a desired mode, and at a desired time. According to these definitions, increased accessibility in a society is a means of achieving increased social inclusion, social justice, and, hence, social sustainability [18].
Since its introduction to urban and spatial planning fields, different measures have been proposed. We provide a summary of the most commonly used accessibility measures.
Contour measures, also known as opportunity measures or isochrones measures, define catchment areas by drawing one or more isochrones around a node and measure the number of available opportunities within each boundary. This measure is both easy to compute and interpret even though the definition of travel time thresholds can be arbitrary and difficult to differentiate in relation to activities and travel purposes. Gravity-based measures were introduced in the scientific literature during the late 1940s. Since then, they were widely used in social and geographical studies, defining catchment areas by measuring travel impediment on a continuous scale. The measure combines both land use and transport elements, and due to the introduction of a distance-decay function, it also considers a person’s mobility capital. From a scientific point of view, gravity-based accessibility measures have a strong theoretical base [7], which is well accepted in transport planning field. Furthermore, they consider the spatial interaction between the distribution of the demand and the accessibility level of opportunities (competition effects) [19]. Moreover, this accessibility measure, in principle, can take consideration of the variations across individuals, which means that the measure can be differently specified according to the characteristics of individuals for whom the accessibility is estimated [20]. From a practice point of view the complexity of the model framework might require high hardware and software requirements and a certain degree of technical expertise to perform the calculation. On the other hand, gravity-based measures can be easily integrated with GIS in order to create and customize maps, build and maintain geographic data sets, and perform many different types of spatial analysis. According to these features, the measure can provide a clearer visualization module that could facilitate feedbacks in the consultation process with local authorities and economic stakeholders. At the same time, the possibility of a multimodal transport analysis can provide insights into the equity of alternative transportation investments. More recent researches are focusing on utility-based measures, which interpret accessibility as the outcome of a set of travelers’ choices. Utility-based measures have a sound theoretical ground in random utility theory [21]: It is founded on the assumption that people select the alterative with the highest utility. Although transportation studies widely use various accessibility measures to explain travel behavior, most of these measures are developed to elaborate on motorized modes of travel [22]. The application of utility-based models to measure accessibility is able to assess also individual and social benefits of accessibility, even in monetary terms. The main drawback is that utility-based measures could be difficult to compute, interpret, and communicate.
In this study, we focused on gravity-based measures because they can be translated from scientific literature to real practices, due to their easy representation and interpretability. Next, we provide an overview of some accessibility measures.
Measures of Accessibility Measures to Healthcare Services
Table 1 reviews some accessibility measures; most of them are gravity-based measures and their focus is the healthcare provision system at different scales (urban, regional, or national). Most of the selected accessibility measures rely on the incomparable analytic and managerial capabilities of GIS (Geographical Information System). Since their inception in the 1990s, GISs have provided an essential contribution to integrated spatial decision support systems. This approach takes advantage of the management, manipulation, and display capabilities of a GIS coupled with specialized software for solutions to complex problems [23,24,25]. Hence, following the research timeline on the theme, the accessibility measures became increasingly advanced and sophisticated due to considerable computing support.

Table 1.
Healthcare service provision accessibility.
Love and Lindquist [26] proved, using contour measure, that within Illinois (USA), more than half of the elderly population reside in land areas outside the 20-mile radius catchment zones of hospitals with geriatric facilities. Even though this number was obtained using the Euclidean distance (using network distance would have improved the analysis), it could help authorities during a first stage of analysis to identify critical areas where potential actions should be prioritized. For part of the same study area (10 counties in the Chicago area), Luo and Wang [27] compared an ordinary gravity-based measure and a two-step floating catchment area (2SFCA) method to assess accessibility to physicians. 2SFCA has been used and enhanced to include more variables and to adapt its form to the study area of interest. The method consists of two analysis steps: The first one computes the ratio between supply and demand of each health facility; the second step computes accessibility as the weighted sum of these ratios using a distance-decay function. 2SFCA is an upgrade of the floating catchment area (FCA) accessibility measure, since it differentiates cost thresholds on a continuous scale by using distance-decay functions. According to the set of chosen parameters, it could be adapted to different user clusters. The comparison of the two methods showed that 2SFCA is recommended because it is simpler and easier to compute and interpret while improving the designation of health professional shortage areas. The territorial reference scale is still large (10 counties in the Chicago area).
For the European contexts, several experiments have been conducted: Bauer and Groneberg [28] assessed accessibility for general health care services using the FCA method. Pan et al. [29] also worked with measures based on the FCA methodology, assessing accessibility to healthcare services in Sichuan, China. The authors compared the enhanced two-step floating catchment area (E2SFCA), which calculates population-adjusted density of hospitals, with another spatial accessibility measure, the nearest-neighbor method, which only considers the nearest hospitals. Even though E2SFCA needs a more advanced operationalization, the authors stated that it is more meaningful for assessing associations of the spatial access to hospitals with other factors, such as population density and investment in public healthcare provision. Gòmez et al. [31] proposed 3SFCA (three steps floating catchment area) that introduces three different parameters to assess spatial accessibility to hemodynamic rooms: A selection weight based on travel times, a supply–demand ratio, and a distance-decay Gaussian function. The results showed that a proper use of accessibility indicators along with the application of GIS tools enables the efficient analysis of health services coverage. Houtari et al. [30] developed a methodology to design optimal catchment areas of tertiary hospitals in Finland, comparing them with administrative and normative catchment areas. The research focused on the need to update the national public health care geography, which refers to decisions after the Second World War. To optimize public resources provision, the authors highlighted how accessibility measures could be implemented when designing administrative catchment areas as they represent the trade-off between adequate client volumes and maintaining reasonable accessibility for all potential clients. This last application was selected for review since it focuses on how accessibility measures can be helpful to the decision-making process. From the reviewed studies, proximity is one of the most influential, if not the most influential, factors affecting accessibility [15]. Hence, more research is needed to include as many variables as possible, to better assess elderly access to health services.
3. Materials and Methods
Due to increasing political and scientific interest on the topic, several methods and approaches have been produced for determining healthcare accessibility and, based on the application context, these measures vary in terms of theoretical basis, operationalization, interpretability, and communicability [7,32]. The simplest method to assess healthcare accessibility is to use contour measures (or opportunity measures), defining catchment areas by drawing one or more travel time contours around a node and measuring the number of opportunities within each contour. This measure is easy to compute and understand but its theoretical basis is poor, since different distances within the same area are not weighted for evaluating accessibility. In a metropolis where many alternatives exist, the distance to the nearest primary care service may not match demand. To define catchment areas by measuring travel impediment on a continuous scale, gravity measures were introduced: even though they are more accurate representations of travel resistance than contour measures, they tend to be less legible and neglect the variation across individuals living in the same area [29]. Utility-based accessibility measures are the link between infrastructure provision and perceived individual and societal benefits, assuming that people select the healthcare alternative with the highest utility. Despite the strong theoretical basis [21], computing and interpreting these measures can be difficult.
To answer the main question in this study, a GIS-based procedure was developed to evaluate the level of accessibility to essential urban services for the elderly, considering the demographic characteristics of potential users, multimodal transport services (characteristics of street walking, frequency of service, and location of urban transport stops) and characteristics of health services. Methodologically, our approach integrates the use of open data (spatial and alphanumeric) and organizational capability, including analysis and representation with GISs.
In the first step, we created a geodatabase using GIS software, containing different types of data (spatial and alphanumeric). To improve the data output accuracy of the GIS-based procedure, we introduced a regular spatial grid to divide the area of analysis into small spatial units. The use of grid frames is crucial for experimental and observational science, as well as for providing the most common framework for spatially explicit models [33]. The hexagonal cell, which is the minimum spatial unit into which the study area is divided, and its sides, may have dimensions previously selected by the user based on the area to be analyzed [34]. In the literature, the use of a hexagonal cell rather than a square is advised for areas that have problems related to the connectivity of different space units and the identification of shorter paths for calculating travel distances [35]. For this GIS-based procedure, we used as a spatial unit a regular hexagonal cell with a side length of 50 m, which provides greater aesthetic attraction but, above all, increased accuracy in the calculation and visualization of numerical data. According to previous studies, a proportional function based on the residential buildings footprint in each cell [13,36] was used to assign the census tracks socio-economic data to hexagonal elements.
In the second step, geoprocessing, joint data, and network analysis operations were used to elaborate the data to evaluate the travel time and accessibility level to health services for the elderly. To evaluate travel times from each hexagonal cell to the main local health buildings, we created a multimodal transport network. We considered the network as the combination of both walkable streets and local public transport lines (bus and metro) to better simulate elderly mobility habits.
The methodology is based on a multimodal transport network, which is the combination of a pedestrian and public transport graphs. The pedestrian graph is composed of walkable roads and was obtained by removing non-walkable streets from the network, such as highways. Every link of the pedestrian graph was considered equally walkable: further features, such as the presence of pavement, green areas, benches, etc., could be added to assess the quality of urban environment from the elderly perspective. The public transit network is based on both geographic and alphanumeric information and the general transit feed specification (GTFS) data. GTFS data are a collection of at least 6 and up to 13 files concerning transit agency, routes, bus stops, schedules, etc. Due to GIS tools, GTFS data can be added to a network feature to create the public transit graph, which is composed of nodes (bus and metro stops), links (routes), and connectors to the walkable roads. The latter do not have a physical correspondence, but they are dummy elements that simulate the spatial and temporal discontinuity of public transport modes. The multimodal network is associated to a transit network dataset, which defines variables and limits (walking speeds, speed of bus and metro, etc.), useful for model travel times.
ArcGIS Pro 2.2 Network Analysis (Esri, Redlands, CA, USA) a practical tool used to compute the Origin–Destination matrix. The OD matrix contains the total travel time (combination of pedestrian and transit times) to travel from residences to essential urban services. The analyses can be run during morning peak hour (09:00), for an average adult, for a 65–69-year-old person, for a 70–74-year old person, and for someone aged over 75, considering four different walking speeds for each age category [13].
In the third step, maps and tables were produced to numerically and spatially quantify the results of the GIS-based procedure and support the planning process of decision-policy makers. The results of this procedure can be used by the elderly to choose a more accessible neighborhood.
Table 2 provides the list of alphanumeric and spatial data (vector and raster) requests for the application of the GIS-based procedure. Table 1 provides the list of alphanumeric and spatial data (vector and raster) requests for the application of the GIS-based procedure.
Table 2.
Data selected for the implementation the geographic information system (GIS)-based procedure.
The accessibility level was measured for each hexagonal cell, using the following formulas:
The first step of the methodology is aimed at computing a ratio between the supply of primary health services and the demand of elderly people. The second formula aims at defining accessibility for each hexagonal cell of the grid, i; d identifies the healthcare district, which is the administrative boundary of the healthcare services; j identifies the healthcare building; i identifies the generic hexagonal cell of the grid; is the sum of elderly people dwelling in cell i; is the total travel time, which is the combination of pedestrian and transit movements to get from residence places (i) to healthcare buildings (j); β is the coefficient of the impedance function, equal to 1 for this application; is the number of available services, also considering the kind of surgery (k) within each district (d). For what concerns the first formula, the denominator has three different elements. Each element refers to a different age group (people aged between 65 and 69, 70 and 74 and over 75). This scheme was necessary since total travel time was differently computed for each age group, according to the assumption that, while ageing, walking speed decreases [13]. Equation (2) presents a similar structure for the same reason.
The developed methodology applies FCA measures, which are a special case of gravity-based measures that aim at defining accessibility around a place of interest (primary healthcare services, for the application in Naples proposed in this article), considering its supply capacity, demand use, and proximity features. According to more recent academic practices in this field, we propose a 2SFCA capable of measuring the accessibility to healthcare provision services for each cell of the urban environment. The method is an upgrade of the FCA method as it introduces a distance-decay function that differentiates cost thresholds on a continuous scale.
In detail, Equation (1) defines a ratio between the healthcare supply, number of surgeries within the same district, and demand, which is the number of people per age group (65–69, 70–74, and over 75). This first measure is an indicator of the stress level of each district: the higher the number of resident elderly, and the fewer the healthcare buildings, the more stressed the district. When considering the demand, the total (sum of pedestrian and transit components) travel time to the power of –β, where β is equal to 1, is considered an impedance factor. The total travel times are simulated with three different speeds for the three age groups, since walking speed decreases with aging. Equation (2) assesses the accessibility of each cell of the grid as the sum of three elements for the three age groups. Each element is the sum extended to the healthcare buildings that serve the generic cell i of the product of the supply/demand ratio of the district and impedance function to reach the j healthcare building from i.
According to the literature review [5,28], we identified five different accessibility classes for this case study considering a quintile classification.
4. Case-Study Area
In the Italian context, integrated planning approaches that holistically considers the different urban components have rarely been applied. For the health and urban planning sectors, one of the main limitations to applying an integrated approach depends on the different authorities that manage these two sectors. The local authority is responsible for urban planning and the regional authority is responsible for the organization of different health services. The absence of constant dialogue and a specific norm that imposes the collaboration between the different actors, both public and economic, is a serious issue for the future. In particular, these issues will become more serious due to the increase in elderly people in urban areas, as well as their specific needs.
The proposed GIS-based procedure was applied to the city of Naples to evaluate the urban accessibility of the elderly to public primary health services: Table 3 shows the number of available surgeries within each district. We selected this case study because it is a representative example of a complex southern European city with high population density, non-uniform urban structure, and the absence of a specific plan to satisfy the elderly people’s needs.
Table 3.
Available surgeries for each health structure, within each district. (* ORL stands for Otolaryngology).
The city of Naples has 970,185 inhabitants [4] within 117.27 km² and it is the fifth Italian city in terms of population density. The city has been affected by a gradual increase in the elderly population: From 2008 to 2018, the elderly population of the city increased 20,052 [4].
The Naples Local Health Agency (ASL) is responsible for the primary healthcare supply in the city boundary and has a very complex structure due to the numerous demands (nearly one million units) and the socio-economic and health heterogeneity within the area. The Naples ASL has eight hospital institutions spread throughout the city, but, to better program and allocate resources and to monitor and manage medical care and treatments, health districts play a strategic role. The Italian law (D.Lgs. 229/1999 Art. 3) regulates health district functions and identifies them as territorial joints of ASL, the closest health supply for citizens. A programmatic document of health services supply at local level organizes the district activities and those that are the responsibility of upper health public agencies and equivalent private services.
Health districts play a strategic role in the present welfare system, which aims to integrate this form of assistance with more institutionalized solutions, such as physicians and voluntary organizations. They represent a significant tool in limiting social exclusion in urban areas. For the first application of this methodology, we selected local health primary services supplied by Naples ASL. In particular, the municipality of Naples is divided into 10 health districts, whose administrative boundaries overlap one or more neighborhood borders, as shown in Table 2. Notably, that district boundaries represent administrative restriction to services availability, as only neighborhood residents can access to healthcare provision within the district. Their structures are spread throughout the whole city and they offer the following primary services to the elderly: Cardiology, geriatrics, urology, neurology, pulmonology, orthopedics, dentistry, otolaryngology, ophthalmology, and diabetology. They are managed by Campania Region and Naples ASL. Figure 1 highlights the spread of healthcare services within the city and within each district. It represents the supply component of the accessibility measure. Figure 2 depicts the Naples city multimodal transport network (pedestrian and transit) used to compute travel times, which are mapped in Figure 3, considering three different walking speeds for the three age groups (0.8 m/s for people aged 65–69 years, 0.7 m/s for people aged 70–74 years, and 0.5 m/s for people aged 75 and above) [1].
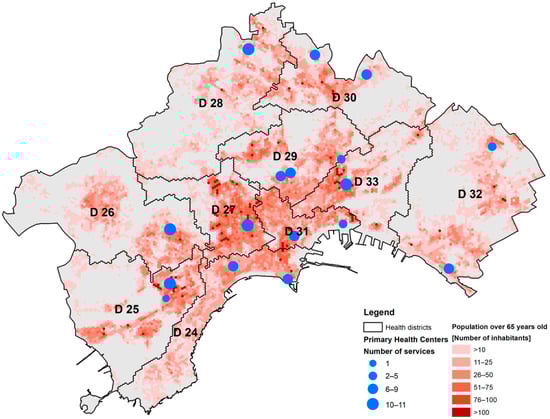
Figure 1.
The distribution of inhabitants aged 65 years and over, in Naples, Italy.
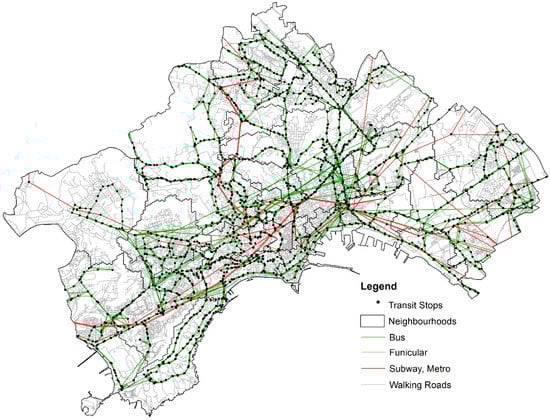
Figure 2.
The multimodal transport network in the City of Naples, Italy
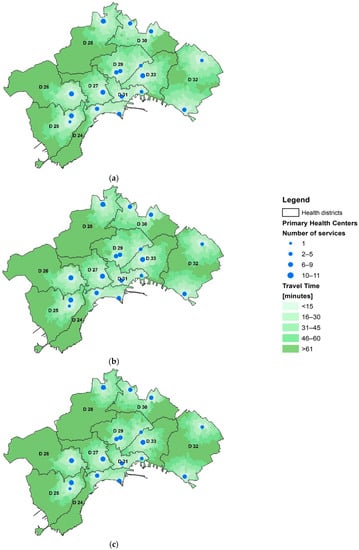
Figure 3.
Travel time to primary health centers for three different groups of elderly: (a) 65–69, (b) 70–74, and (c) over 75 years.
A preliminary reading of the data reported in the Table 4 suggests some issues related to the spatial distribution of the elderly and health services within the city of Naples.
Table 4.
District neighborhoods and population.
5. Results and Analysis
Here, we summarize the accessibility of the elderly to primary health facilities in Naples as an example of large Italian cities. Table 5, Table 6 and Table 7 report the number of elderly (65–69, 70–74, and over 75 years) in Naples, respectively. For those aged 65–69 year, Districts 25 (Bagnoli and Fuorigrotta), 26 (Pianura and Soccavo), 27 (Arenella and Vomero), and 33 (Vicaria, San Lorenzo and Poggioreale) required an in-depth evaluation. District 27 is inhabited by about 4,000 elderly people aged between 65 and 69 who suffer from a very poor accessibility to primary health services and this percentage increases to nearly 70% if we also consider a low, poor, and a very poor level of accessibility. A total of 87.3% of dwellers in District 30 (Miano, Secondigliano, S. Pietro a Patierno) have very good access to primary health services. This highlights the deep social and spatial inequity even for bordering neighborhoods. This analysis highlights that no difference exists between core urban areas and suburbs: Vomero is one of the central neighborhoods and its dwellers have poorer accessibility compared with residents in District 33, which includes suburban areas.
Table 5.
The level of accessibility to health care services of those aged 65–69 years per district.
Table 6.
The level of accessibility to health care services of those aged 70–75 years per district.
Table 7.
The level of accessibility to health care services of those aged over 75 years per district.
For the second age range (70–74), in District 27, more elderly people suffered from a low accessibility level. Over 70% of the elderly have a medium or low level of accessibility, which is about 5000 people. Both Districts 25 and 26 have the same results as for people aged between 65 and 69 years. District 33 (Vicaria, San Lorenzo, Poggioreale) is not the worst in this context, but it could be further investigated since nearly 40% of its 70–74-year-old residents suffer from a low level of accessibility.
Previous considerations are confirmed even for this last age range (over 75 years): Districts 25, 26, and 27 have the highest rate of dwellers with the poorest accessibility levels (37, 31, and 42%, respectively). Due to the slowest walking speed for this elderly age group (0.5 m/s), in every district, the number of people with a low, poor, and very poor level of accessibility increases considerably.
Figure 4 highlights the overall accessibility levels experienced by the elderly inhabitants of Naples. Information portrayed in this map could make a valuable contribution in supporting the decision-making processes associated with any attempts to locally restructure services with the aim of improving the spatial allocation of primary care resources. The methodology is based on the assumption that primary health buildings’ locations is a significant consideration as well as their resources, in terms of physicians, number of surgeries, and operating hours, which all contribute to these results.
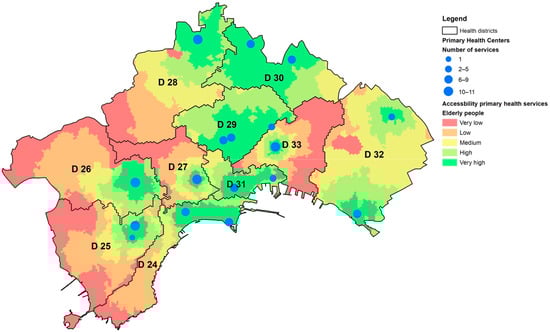
Figure 4.
Level of accessibility of the elderly to health services.
6. Conclusions
In this study, based on the data of 2011 [4] we evaluated spatial accessibility to primary health services in Naples, Italy. The situation we depict is referred to the largest Local Health Agency (ASL) of Europe, ASL Napoli 1, with nearly 1 million of users and 6,000 employees. The city of Naples provided a representative study area also due to its morphology and socio-economic and demographic structure. This paper presented a quantitative method to assess accessibility to primary health services, considering as a principal mean of access to the local health system supply to the elderly a multimodal transport network. We employed a 2SFCA measure for evaluation, that confirms that entire neighborhoods suffer a very poor accessibility level. An important implication of this fact is that both municipal local authorities and healthcare institutions need to carry on their primary responsibility in planning and implementing the allocation of healthcare resources, and to be cautious in the process of marketizing public hospitals, in order to improve social justice and reduce disparity in the access to healthcare services. This necessitates more precise and holistic land use planning policies, also considering the needs and availability of the elderly. We also found that the healthcare provision system has a very complex structure, due to several agreements by private services that support public institutions. Unfortunately, it is very hard to access to this data, even though analyses based on high-resolution data and sophisticated spatial analytical methods would provide critical information for decision making at the local scale. Due to the limitation of data availability, this study provides only a snapshot of spatial access to District healthcare structure in Naples, which is not sufficient to fully evaluate the effect/impact of the Healthcare Local Agency supply within the city of Naples. Accessibility to the main urban facilities is clearly a decisive element to guarantee paths for the promotion and protection of wellbeing, in particular for the elderly. Improving access to social and health services is an essential part in planning future cities towards zero inequalities. The continuous growth of the elderly in the last decades, as well as prospects predict, will generate a serious social exclusion phenomenon. One of the limits of our methodology is that the urban features linked to elderly walkability within the urban environment are missing: the quality of pavements, the presence of green areas, the safety performance of cross-roads, and other walking comfort attributes (i.e., benches, fountains, etc.) are some further contributes that could be added for future developments. In fact, the study of scientific literature confirms the close relationship between service area extension, transport service frequency and age of users in the evaluation of accessibility to urban services. Moreover, future developments will further investigate the organization of public health services, as well as their relationships with private heath provision. In order to analyze the overall urban services supply, future applications could be run for different timing intervals to estimate the accessibility level and its variability during daytime. The methodology and the operational procedure proposed can potentially be used as a decision support tool, in order to design new infrastructures or to optimize existent resources, in a G2B (Government to Business) point of view. In order to gain this aim, it would be useful to consider the whole primary health supply system, also considering its administrative rules and, since the main objectives of our research are the elderly, a distance-decay function could be introduced to better compute their mobility availability. Such decision support systems are efficient tools for policy makers and urban planners, even though their contribution to knowledge production concerning the interactions of urban planning with several other societal issues are usually neglected.
Author Contributions
Conceptualization, G.C. and C.G.; Methodology, G.C.; Software, G.C.; Validation, G.C. and C.G.; Formal Analysis, C.G.; Investigation, C.G.; Resources, G.C. and C.G.; Data Curation, G.C.; Writing Original Draft Preparation, G.C. and C.G.; Writing Review & Editing, C.G.; Supervision, H.E.M. All authors have read and agreed to the published version of the manuscript.
Funding
This research received no external funding.
Conflicts of Interest
The authors declare no conflict of interest.
References
- Arup; Help Age International; Intel; Systematica. Shaping Ageing Cities. 10 European Case Studies. 2015. Available online: https://ifa.ngo/wp-content/uploads/2015/09/Shaping-Ageing-Cities_A4_web-1.pdf (accessed on 2 September 2019).
- European Commission. Population Ageing in Europe Facts, Implications and Policies; European Commission: Brussels, Belgium, 2014. [Google Scholar]
- Eurostat. Population Structure and Ageing; Retrieved; European Commission: Kirchberg, Luxemburg, 2018. [Google Scholar]
- Statistiche Istat. Popolazione residente—Censimento 2011—Superficie Delle Abitazioni Occupate da Persone Residenti. Istat. Italian National Institute of Statistics. Available online: http://daticensimentopopolazione.istat.it/ (accessed on 9 November 2016).
- Kim, Y.; Byon, Y.-J.; Yeo, H. Enhancing healthcare accessibility measurements using GIS: A case study in Seoul, Korea. PLoS ONE 2018, 13, e0193013. [Google Scholar] [CrossRef]
- Papa, E.; Coppola, P.; Angiello, G.; Carpentieri, G. The learning process of accessibility instrument developers: Testing the tools in planning practice. Transp. Res. Part A Policy Pract. 2017, 104, 108–120. [Google Scholar] [CrossRef]
- Geurs, K.T.; van Wee, B. Accessibility evaluation of land-use and transport strategies: Review and research directions. J. Transp. Geogr. 2004, 12, 127–140. [Google Scholar] [CrossRef]
- Buehler, R.; Nobis, C. Travel Behavior in Aging Societies: Comparison of Germany and the United States. Transp. Res. Rec. 2010, 2182, 62–70. [Google Scholar] [CrossRef]
- Currie, G.; Delbosc, A. Exploring public transport usage trends in an ageing population. Transportation 2010, 37, 151–164. [Google Scholar] [CrossRef]
- Aceves-González, C.; Cook, S.; May, A. Bus use in a developing world city: Implications for the health and well-being of older passengers. J. Transp. Health 2015, 2, 308–316. [Google Scholar] [CrossRef]
- Voss, C.; Sims-Gould, J.; Ashe, M.C.; McKay, H.A.; Pugh, C.; Winters, M. Public transit use and physical activity in community-dwelling older adults: Combining GPS and accelerometry to assess transportation-related physical activity. J. Transp. Health 2016, 3, 191–199. [Google Scholar] [CrossRef]
- O’Neill, D. Towards an understanding of the full spectrum of travel-related injuries among older people. J. Transp. Health 2016, 3, 21–25. [Google Scholar] [CrossRef]
- Papa, E.; Carpentieri, G.; Guida, C. Measuring walking accessibility to public transport for the elderly: The case of Naples. TeMA J. Land Use Mobil. Environ. 2018. [Google Scholar] [CrossRef]
- Carpentieri, G.; Guida, C.; Masoumi, E.H. Measuring Multimodal Accessibility to Urban Services for Elderly. An application at primary health services in the city of Naples. In Planning, Nature and Ecosystem Services; Gargiulo, C., Zoppi, C., Eds.; FedOA Press: Naples, Italy, 2019; pp. 810–825. [Google Scholar] [CrossRef]
- Lin, T.; Xia, J.; Robinson, T.P.; Goulias, K.G.; Church, R.L.; Olaru, D.; Tapin, J.; Han, R. Spatial analysis of access to and accessibility surrounding train stations: A case study of accessibility for the elderly in Perth, Western Australia. J. Transp. Geogr. 2014, 39, 111–120. [Google Scholar] [CrossRef]
- Bertolini, L.; le Clercq, F.; Kapoen, L. Sustainable accessibility: A conceptual framework to integrate transport and land use plan-making. Two test-applications in the Netherlands and a reflection on the way forward. Transp. Policy 2005, 12, 207–220. [Google Scholar] [CrossRef]
- Hansen, W.G. How Accessibility Shapes Land Use. J. Am. Inst. Plan. 1959, 25, 73–76. [Google Scholar] [CrossRef]
- Bhat, C.; Handy, S.; Kockelman, K.; Mahmassani, H.; Chen, Q.; Weston, L. Accessibility Measures: Formulation Considerations and Current Applications; University of Texas at Austin, Center for Transportation Research: Austin, TX, USA, 2000. [Google Scholar]
- Papa, E.; Coppola, P. Gravity-based accessibility measures for integrated transport-land use planning (GraBAM). In Accessibility Instruments for Planning Practice; Hull, A., Silva, C., Bertolini, L., Eds.; COST Office: Brussels, Belgium, 2012; ISBN 978-989-20-3187-3. [Google Scholar]
- Vale, D.S.; Pereira, M. The influence of the impedance function on gravity-based pedestrian accessibility measures: A comparative analysis. Environ. Plan. B Urban Anal. City Sci. 2017, 44, 740–763. [Google Scholar] [CrossRef]
- Domencich, T.A.; McFadden, D. Urban Travel Demand-a Behavioral Analysis; North-Holland Publishing Co./American Elsevier: New York, NY, USA, 1975. [Google Scholar]
- Berjisian, E.; Habibian, M. Walking accessibility, Gravity-based versus utilitybased measurement. In Proceedings of the 96th Annual Meeeting of Transportation Research Board, Washington, DC, USA, 8–12 January 2017. 17-02983. [Google Scholar]
- Armstrong, M.P.; Rushton, G.; Honey, R.; Dalziel, B.T.; Lolonis, P.; De, S.; Densham, P.J. Decision support for regionalization: A spatial decision support system for regionalizing service delivery systems. Comput. Environ. Urban Syst. 1991, 15, 37–53. [Google Scholar] [CrossRef]
- Lolonis, P.; Armstrong, M.P. Location-allocation models as decision aids in delineating administrative regions. Comput. Environ. Urban Syst. 1993, 17, 153–174. [Google Scholar] [CrossRef]
- Love, D.; Lindquist, P. The geographical accessibility of hospitals to the aged: A geographic information systems analysis within Illinois. Health Serv. Res. 1995, 29, 629–651. [Google Scholar]
- Luo, W.; Wang, F. Measures of spatial accessibility to health care in a GIS environment: Synthesis and a case study in the Chicago region. Environ. Plan. B Plan. Des. 2003, 30, 865–884. [Google Scholar] [CrossRef]
- Bauer, J.; Groneberg, D.A. Measuring Spatial Accessibility of Health Care Providers–Introduction of a Variable Distance Decay Function within the Floating Catchment Area (FCA) Method. PLoS ONE 2016, 11, e0159148. [Google Scholar] [CrossRef]
- Pan, J.; Zhao, H.; Wang, X.; Shi, X. Assessing spatial access to public and private hospitals in Sichuan, China: The influence of the private sector on the healthcare geography in China. Soc. Sci. Med. 2016, 170, 35–45. [Google Scholar] [CrossRef]
- Huotari, T.; Antikainen, H.; Keistinen, T.; Rusanen, J. Accessibility of tertiary hospitals in Finland: A comparison of administrative and normative catchment areas. Soc. Sci. Med. 2017, 182, 60–67. [Google Scholar] [CrossRef]
- Gómez, J.N.; Loures, L.; Castanho, R.; Cabezas, J.; Panagopoulos, T. Assessing the feasibility of GIS multimethod approach to ascertain territorial accessibility to hemodynamics rooms in Spain mainland. Habitat Int. 2018, 71, 22–28. [Google Scholar] [CrossRef]
- Scheurer, J.; Curtis, C.; Porta, S. Spatial Network Analysis of Public Transport Systems; Developing a Strategic Planning Tool to Assess the Congruencfe of Movement and Urban Structure in Australian Cities. In Australasian Transport Research Forum; ATRF: Melbourne, Australia, 25 September 2007. [Google Scholar]
- Jin, X.; Liu, H.; Luan, Q.; Huang, W. Technique and methods for spatialization of socioeconomic data. In Geoinformatics 2007: Geospatial Information Science; International Society for Optics and Photonics: Bellingham, WA, USA, 2007; Volume 6753. [Google Scholar]
- Papa, E.; Carpentieri, G.; Angiello, G. A TOD Classification of Metro Stations: An Application in Naples. In Smart Planning: Sustainability and Mobility in the Age of Change; Papa, R., Fistola, R., Gargiulo, C., Eds.; Springer International Publishing: Cham, Switzerland, 2018; pp. 285–300. [Google Scholar] [CrossRef]
- Kibambe Lubamba, J.-P.; Radoux, J.; Defourny, P. Multimodal accessibility modeling from coarse transportation networks in Africa. Int. J. Geogr. Inf. Sci. 2013, 27, 1005–1022. [Google Scholar] [CrossRef]
- Carpentieri, G.; Favo, F. The End-use Electric Energy Consumption in Urban Areas: A GIS-based methodology. An application in the city of Naples. TeMA J. Land Use Mobil. Environ. 2017, 10, 139–156. [Google Scholar] [CrossRef]
- Comune di Napoli. Open data. 2018. Available online: www.opendata.comune.napoli.it (accessed on 2 September 2019).
- Azienda Sanitaria Locale Napoli 1. Regione Campania, Sanità. 2018. Available online: https://www.aslnapoli1centro.it/ (accessed on 2 September 2019).
- Open Street Map. Map Features. 2019. Available online: https://www.openstreetmap.org/#map=5/42.088/12.564 (accessed on 2 September 2019).
- Geoportale Nazionale. Ministero dell’Ambiente, Ministero dell’Ambiente e della Tutela del Territorio e del Mare. 2019. Available online: http://www.pcn.minambiente.it/mattm/ (accessed on 2 September 2019).


© 2020 by the authors. Licensee MDPI, Basel, Switzerland. This article is an open access article distributed under the terms and conditions of the Creative Commons Attribution (CC BY) license (http://creativecommons.org/licenses/by/4.0/).