Abstract
The causal relationship between zonal freight turnover and gross domestic product (GDP) are receiving increasing attention to coordinate the balanced development of freight transportation and zonal economic level effectively. However, studies on the causality direction between freight transportation and economic have so far been in debate. To understand the relationship of causality direction between transportation and economic development for different zones which can provide decision support for public policies, econometrics is used to analyze the relationship between them. This paper investigates the relationship between GDP and freight turnover for economic zones of stationary series and non-stationary sequences using the vector autoregressive (VAR) and the vector error correction models (VECM). The impulse response analysis and variance decomposition are conducted to verify the effectiveness of the models. The Granger causality test is exploited to discover the relationship between transportation and economic development in each economic zone. The data on freight transportation and GDP in China from 2003 to 2018 is used. Results show that the relationship between freight turnover and GDP in the Northeast economic zone is bidirectional. A unidirectional relationship exists between freight turnover and GDP in the Circum Bohai-Sea, the Pearl River, Middle Part, Southwest, and Northwest zone. And the Granger causality is not obvious in the Yangtze River economic zone. In addition, suggestions for the zonal development of transportation and economic systems are provided. This study can provide a basis to adopt relevant policies and measures of sustainable development between transportation and economic growth for different zones.
1. Introduction
Rapid exchange of information and investment between different economies promote zonal logistics and transportation. The development of Transportation can meet the needs of the economy and enables the circulation of goods in different zones, which can stimulate the improvement of the zonal economy and enhance the attraction of the zonal economy. Accordingly, rapid economic growth produces large transport demands and results in the motivation to promote transportation. The mechanism between transportation and economic growth provides the basis for formulating the development strategy for the zonal economy and transportation, which can promote the coordination of zonal economic and transport development. Studies on the correlation between transportation and economic improvement are conducive to understand the factors that influence the advancement of a zone on the whole.
A large amount of literature has investigated the correlation between transportation and economic development [1,2]. However, whether the development of transportation promotes economic development or vice versa is still a matter of debate. A number of studies suggested transportation system development has a positive impact on economic growth [3,4]. Other studies have shown that economic growth may have a positive feedback effect on transportation [5]. Numerous empirical studies have identified a long-run equilibrium relationship between transportation and economic development [6]. Some studies have found a bidirectional relationship between transportation infrastructure and economic growth [4,7]. The previous studies cannot determine whether the relationship between transportation and economic development is one-way or interactive. The interrelationship between them remains unclear. It is necessary to further analyze the relationship of causality direction between transportation and economic development. In addition, only a few studies have attempted to identify the interaction between China’s transportation and zonal economic growth, and no clear consensus has been reached in the literature regarding this interaction.
The circulation of goods is an essential indicator of the development of transportation. In the transportation system, zonal freight turnover closely relates to economic development. The gross domestic product (GDP) is the index that can best evaluate the economic development of a country or zone. Several studies have analyzed the bidirectional relationship between freight transportation using various approaches. However, these approaches have limitations. First, most methods do not make it easy to determine endogenous and exogenous variables since the variables about social and economic are generally interdependent. Second, several approaches such as structural equation modeling (SEM) cannot consider the dynamic relationship. The lagged effects cannot be incorporated into the model. Third, several models focus on the sensitivity analysis of the variables but are difficult to be used in forecasting and simulation.
Therefore, the purpose of this paper is to analyze the relationship of causality direction between freight and economic growth using the econometric method to provide decision support for public policies for transportation and economic development. The VAR and VECM were used to analyze the relationship between freight turnover and GDP of different zones in this paper. In the VAR and VECM, all of the variables are endogenous. Besides, the lags of all variables can be considered in the model. Moreover, the lagged rank of the model can be calibrated by test. The results of the model can be used in forecasting or simulation simply and intuitively. China appears to have obvious progress in economic and transportation infrastructure in the past decades due to the development stages. Besides, China’s various policies have promoted infrastructure development and economic growth in different zones. Economic growth and transport data in china may be easy to observe and compare. Therefore, GDP and freight turnover data collected in China at the zonal level were used to estimate the VAR model. Moreover, the development status of each zone was evaluated. This study provides suggestions on the development of zonal transportation and logistics based on the relationship between economics and transportation, which can provide a basis for different zones to adopt relevant policies and measures.
The hypothesis is that transportation has a positive impact on zonal economic growth, while we hypothesize transportation and regional economic growth have a causal relationship for Chinese zones. To test our hypothesis, the VAR and VECM are applied to determine the relationship between GDP and freight turnover for economic zones of stationary series and non-stationary sequences. In addition, the Granger causality analysis is used to examine the causality direction between freight transportation and economic using zonal data.
The contribution of this study is reflected in three aspects. First, this study analyzes the relationship of causality direction between freight transportation and economic growth considering the lag effect. The interrelationship between them remains unclear. Second, previous studies do not obviously consider heterogeneity in determining the interaction between transportation and zonal economy in China. There are more economic activities in the eastern coastal zones, while economic development in other zones is relatively lagged. In addition, there are large differences in the level of transportation system development between zones. The relationship between transportation and economic growth ignoring spatial heterogeneity could cause partial estimation results, hence leading to a misleading inference about causal relationships [8]. Therefore, integrating potential differences in the relationship between transportation and economic growth across zones in our study offers reliable information for the government to coordinate the zonal development and reduce the zonal gap. Third, this study could benefit the China government from more valuable decisions for transportation investment at the zonal level by understanding the relationship between transportation and economy by zone. By doing so, the sustainable development of the economy and society can be realized through reasonable investment and resource allocation of transportation.
This paper first reviews the literature on the relationship between the transportation system and the economy. Section 3 analyzes the data and describes the methods. Section 4 gives the results, followed by a detailed discussion of the possible policy effects. Figure 1 presents the main research ideas.
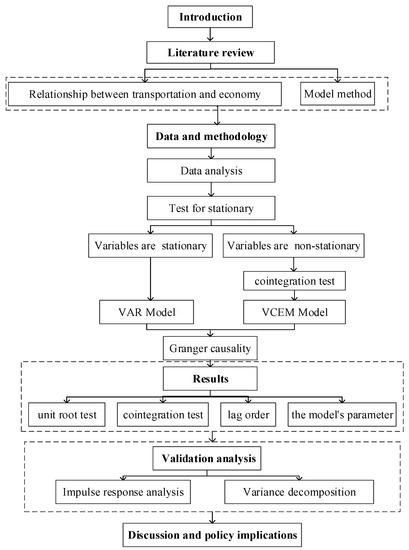
Figure 1.
Research Framework.
2. Literature Review
2.1. Relationship between Transportation and Economy
Several studies examined the one-way impact of transport on economic growth. Saidi et al. [9] examined the effect of transportation on economic development using data in the Middle East and North Africa zone from 2000 to 2016. They found that transportation contributes to economic growth. Achour [10] analyzed the causal relationship among transportation (railway and highway), the added value of traffic, and total capital formation based on the data in Tunisia using the Johansen multivariate co-integration method. Results showed that the benefit of traffic to the total capital formation has one-way causality. Han [11] investigated the internal relationship between transportation and economy based on macroeconomic data such as railway passenger, freight and turnover volume, and GDP. Results showed that passenger volume had contributed significantly to economic growth. Wetwitoo et al. [12] investigated the relationship between high-speed rail and zonal economic production. Results showed that high-speed rail had a strong impact on economic productivity. Halaszovich et al. [13] studied the impact of the national transportation system on international trade and foreign investment performance. Results showed that the transportation system has a positive effect on trade and investment.
Different from the studies above, several studies have also discussed the influence of economic development on transportation. Transportation and economic growth are considered to be a feedback relationship. Kuzu et al. [14] investigated the long-standing relationship between the logistics industry and economic growth based on econometric models using data that include information on GDP and transport warehouse turnover. GDP data were used to measure economic growth, whereas the transport warehouse turnover was an indicator of logistic development. Results showed that economic growth can promote the development of logistics. Gao et al. [15] analyzed the relationship between comprehensive transport freight index and GDP to detect the problems in the development of transportation. Results showed that freight volume and freight turnover is confidently interrelated with GDP. Guo et al. [16] analyzed the correlation between traffic facilities and an economy based on a general VAR model using the GDP data of China, railway, and highway mileage from 1964 to 2004. Results showed that the chosen variables are co-integrated with positive and negative contributions of railway and highway investments to GDP, respectively.
However, several scholars considered that the promotion of transportation to the economy is not obvious. Chi et al. [17] examined the dynamic impact of economic growth on the US aviation industry and showed that the aviation business grew with the economy. However, air passenger services contributed to economic growth in the short term. Banister et al. [18] assumed that national transportation functioned in promoting economic growth. Economic growth conditions including economic externality, transportation infrastructure investment, and political environment should be provided. Deng et al. [19] analyzed the impact of transport infrastructure on economic growth using zonal data from 1987 to 2010. Results showed that the impact of transport on the economy depends largely on the level of the transport network. Park et al. [20] examined the role of various types of transport infrastructure in the Organization for Economic Cooperation and Development (OECD) and non-OECD countries. Results showed that air and land transport in developing countries are often independent of economic growth.
Although the majority of previous studies are limited to one-way analysis, several scholars noted that an interaction exists between transportation and economic improvement. Meng et al. [21] adopted cluster analysis to explore the internal connection between zonal railway freight volume and zonal GDP. They showed that the relationship between railway transportation and economic improvement was mutually promoting and mutually restricting. Lei [22] calculated the coupling coordination degree to study the interaction, coupling, and optimal allocation between the traffic and zonal economy of the Hui community. Results reflected the interaction between the traffic of the Hui community and the zonal economy. Muller et al. [23] investigated the relationship between freight volume of various industries and economic activities. Results showed that there was a strong correlation between most transported goods and developed economic indicators. Zhu et al. [24] explored the internal relationship between freight transport and economic growth. The results showed that the relationship between freight volume and zonal GDP was interdependent and causal.
The simultaneous equation model is another method that has been widely used in the analysis of the bidirectional relationship between transportation and economic development. Jiang et al. [25] proposed a simultaneous equation model to consider the bi-directional relationship between multimodal transportation and economic development comprehensively. Listiono [26] studied the correlation between freight and economic growth experienced by 1990 countries between 1980 and 2014 adopting the simultaneous equation model for estimation. Results showed there was a two-way causal relationship between economic growth and the transport of goods in both high-income and low-income countries. However, the simultaneous equation model did not incorporate the lagged effect into the model. These models cannot capture the dynamic relationship between transportation and economic improvement.
Tong et al. [27] analyzed the interaction between economic growth and freight transport. Results showed that there was a two-way Granger causality between them in the underdeveloped central and western zones. Pradhan et al. [28] used VECM to study the interaction between transport infrastructure and economic growth in G-20 countries from 1961 to 2016. The results showed that transportation infrastructure promotes economic growth. In return, economic growth has also boosted transport infrastructure. These studies focus on the relationship between economy and transportation improvement. However, there is a lack of analysis and application at the level of the economic zone. In summary, this paper aims to gain insight into the dynamic and relationship of causality direction between freight turnover and economic development for zones considering the lagged effects.
2.2. Model Method
Dynamic time series approach, such as co-integration and Granger causality, has emerged as an analysis tool for basic data. Some scholars focused on the contribution rate of transportation to economic development, mainly adopting the methods of the multiplier model [29], VAR, the Johansen co-integration method [30,31], and the generalized method of the moment [32]. Some experts put forward the “economic growth theory” [33], “threshold regression method” [34], the VECM method, and other theoretical results. Several scholars have used the VAR method, the Granger causality test, and other methods to carry out the quantitative research of the transportation infrastructure and economic development. The Quantile-on-Quantile (QQ) approach is applied for empirical analysis about the effect of economic growth on transportation services with sub-indices [35]. Generation panel unit root and cointegration tests are used to take account of possible cross-section dependence in the data [36]. Granger–Causality argument has been used as a formal way of studying the direction of causation between fixed investment and economic growth. The input-output model is used to investigate sector production capacities and of both forward and backward propagations within the economic system [37]. The integrated supply and demand model can be presented to determine optimal transportation systems operations [38]. The Time Series Cross-Section (TSCS) is used to test causality results between aviation and economic growth [39].
To sum up, the VAR method is based on the statistical properties of data. The VAR model has many advantages in practical operation and is one of the most straightforward models to deal with multiple related economic indicators and predictions. Under certain conditions, multiple moving averages and moving average autoregressive models can also be converted into VAR models. The co-integration and Granger causality analysis are conducted as a formal way to investigate the causation direction between transportation and economic growth. Several studies have examined the relationship between transportation infrastructure and economic development. However, studies on different economic zones are limited. The analysis based on the economic zones in one country avoids the disturbance caused by the environmental variables, such as culture, the legal system, and stage of development.
3. Data and Methodology
The data of freight turnover and GDP were obtained from the national bureau of statistics in China [40]. The data show that the freight turnover of national transportation increased from 49,718 million tonkm in 2003 to 199035 million tonkm in 2018, an increase of about 3 times. In 2018, China’s GDP was 914707 billion yuan, up to 5.7 times from 136,576 billion yuan in 2003.
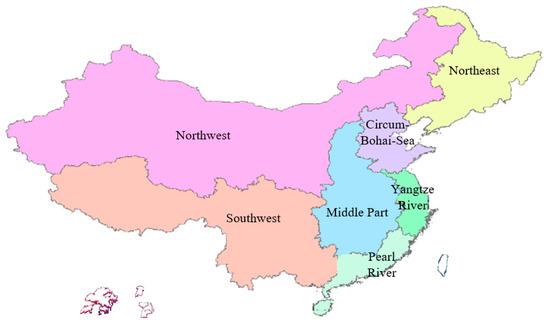
Figure 2.
Map of economic zones division.

Table 1.
Results of economic zone division.
The economic zones of China are divided into seven according to the division method of the China state council and considering the GDP data and growth trend of each province. Table 1 shows the specific division results and the value of GDP and freight turnover of each economic zone.
First, the traffic and economic characteristics of each economic zone are analyzed, and then the stationarity test is carried out for GDP and freight turnover. If it is stable, the VAR model can be established; if it is not stable, co-integration analysis can be carried out. If there is a co-integration relationship between GDP and freight turnover, the VECM model can be established. Finally, the Granger causality test is used to understand the relationship of causality direction between transportation and economic development for different zones. The method is shown below.
3.1. The Characteristic of the Research Area
Before using the data from 2003 to 2018, the correlation test should be conducted on the freight situation and the GDP in each zone of the whole country to eliminate the sequences that do not meet the requirements. Pearson correlation coefficient method is adopted in this study to test the correlation between zonal freight turnover and GDP. Table 2 shows the results.
Table 2.
Results of correlation between zonal GDP and freight turnover.
Table 2 shows that except for the low correlation between the GDP and the freight turnover of the Circum Bohai-Sea economic zone, a strong correlation exists between the freight turnover and GDP of each economic zone.
A possible interpretation of this result would be that the freight turnover does not always increase with the construction of transportation facilities due to a lack of efficient utilization of them. Moreover, other conditions such as the government’s policy environment, management, and control system might cause a difference in economic growth.
3.2. Test for Stationary
The unit root test is adopted to the test stationary of the sequence. It is conducted firstly to avoid pseudo regression caused by OLS. The augmented Dickey–Fuller test [41] is known for testing the stability of the variables and tests the following equation:
where yt is the time series to be tested, xt are optional exogenous repressors, which may contain a constant; a and b are parameters to be estimated, εt are white noise error terms, m is the maximum lag length and D is the difference operator.
Null hypothesis H0: d = 0 is tested against the alternative Ha: d < 0. If the null hypothesis is true, then the unit root is present, and the series is non-stationary. When the null hypothesis is rejected, the series is stationary. The critical values for the test statistic are given by MacKinnon [30].
If the sequence is stationary, the VAR model can be established. VAR modeling has a lag interval for time, in which the lag time is optimal and unknown. Therefore, we need to try to select different lag periods. AIC and SC are commonly used to compare the models. The model with the smallest Akaike Information Criterion (AIC) or Schwarz Criterion (SC) was selected so that the VAR model can be reliable. The AIC and AC can be obtained by the following formula
AIC= −2l/T + 2n/T
SC = −2l/T + nlnT/T
In the VAR model (4), is the total number of estimated parameters, k is the number of endogenous variables, T is the sample length, d is the number of exogenous variables, p is the lag order and l is determined by the following formula.
represents the estimation of the residual covariance matrix of the VAR model.
The basic mathematical expression of the VAR model is written as formula (5).
where is K dimensional endogenous variable vector; is D dimensional exogenous variable vectors; p is lag order; t is the number of the sample; A is k by d matrix; B is estimated coefficient matrix; is K dimensional perturbation vector.
These variables can be correlated from one another synchronously, but not with their lag value. Besides, the variables on the right-hand side of the equation, assuming that is the covariance matrix, are a k by k positive definite matrix. Formula (5) can be expressed as a matrix.
That is, the VAR model with k time series variables is composed of k equations.
3.3. Co-Integration Analysis
If the unit root test of a sequence is not stationary, co-integration analysis is performed after the first-order difference. Co-integration between variables stand for a long-run equilibrium relationship. If the variables are non-stationary and are integrals of the same order, then I (1) is called, but their linear combination is stationary, that is I (0). The Johansen test of co-integration approach tests is presented as follows:
where is a vector of k non-stationary I(1) variables, is a vector of deterministic variables, and are parameters to be estimated, is a vector of innovations and p is the order of VAR.
A VECM can be established if a co-integration relationship exists between sequences.
where is the error correction term, is the adjustment factor, is residual error sequence, and and are the coefficients.
In the explained variables in the short term, the change is relatively stable. In the long-term trend and short-term swings in the short term, the size of the system from the degree of equilibrium directly leads to the size of the wave amplitude. In the long run, a co-integration relationship has the effect of the gravity line and the unbalanced state back to equilibrium.
3.4. Granger Causality
Granger causality test is used to understand the relationship of causality direction between transportation and economic development in each economic zone. The Granger causality analysis tests whether it is possible to incorporate the lagged variables into the equations of other variables. A variable is considered to have Granger causality if the variable is affected by the hysteresis of other variables. In a binary p-order VAR model:
Only if all coefficients in the coefficient matrix are 0, then the variable cannot cause y by Granger, which is equivalent to the notion that the variable x is exited from the variable y. At this point, the direct method to determine the cause of Granger is to use the F test to test the following joint test:
: At least one q exists so that .
Its statistic is as follows:
Equation (10) follows an F distribution. If S is greater than the critical value, the null hypothesis is rejected. Others support the null hypothesis: x cannot cause y by Granger, where RSS is the sum of squared residuals of y equation in Equation (6).
is a lagging variable without x (, q = 1,2, …, p), such as the sum of the squared residuals of the following equation:
Under the assumption that the Gaussian distribution is satisfied, the test statistic Equation (10) has an accurate F distribution. If the regression t-shaped form is the VAR model of Equation (9), then an asymptotic equivalence test can be given by the following formula:
If S2 is greater than the threshold value of x, then the null hypothesis is rejected. Otherwise, the null hypothesis that x cannot be caused by Granger is accepted.
4. Results and Model Validation
4.1. Results
The box graph can be used to judge the skewness and tail weight of the data batch to identify the outliers in the data batch intuitively. Figure 3 depicts the box graph of zonal GDP and freight turnover.
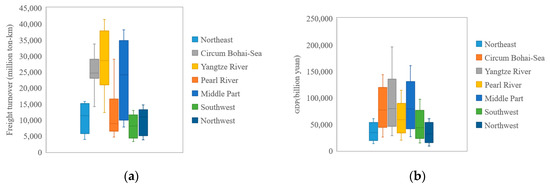
Figure 3.
Box diagram of basic data statistics: (a) freight turnover statistics in different zones and (b) GDP statistics in different zones.
Figure 3 shows that no outliers exist in the data sequences of different categories collected, and no data sequences need to be removed. A correlation exists between freight turnover and GDP in each economic zone. The relationship between freight turnover and GDP will be discussed in the following.
Table 3 shows the results of the unit root test. GDP represents the gross domestic product (billion yuan), noted for G, and ZZL represents the zonal freight turnover (million tonkm), noted for Z. DB represents the Northeast economic zone. HBH represents the Circum Bohai-Sea economic zone. CJ represents the Yangtze River economic zone, and ZJ represents the pearl River economic zone. ZB represents the Middle Part economic zone, and XN represents the Southwest economic zone. Moreover, XB represents the Northwest economic zone.
Table 3.
Results of unit root test.
The test statistics of HBH, CJ, ZJ, and XB are all less than the critical value of 1%, so the null hypothesis of ‘existence of unit root’ can be rejected at the 1% level, so the sequences are stationary. In the same way, the sequences of ZB and XN are stationary at the 5% level. The VAR model can be established. The co-integration analysis is required because the sequence of DB is not stationary.
The significance of co-integration indicates whether the causal relationship described by the model is a pseudo-regression. Whether a stable relationship exists between variables was tested. A co-integration test was conducted on GDP and freight turnover data of the Northeast economic zone after first-order difference using the Johansen test method. Table 4 shows the results.
Table 4.
Results of the co-integration test.
Results of the co-integration test show the co-integration relationship between GDP and freight turnover in the Northeast economic zone at the confidence level of 0.05. Therefore, the VECM can be established.
For both variables, the lag lengths have been selected. The AIC figures for each variable are given in Table 5. Consequently, we choose two lags for GDP and freight turnover. The lag period can determine the order of the model. Table 5 shows the judgment results of the lag order of each economic zone.
Table 5.
Judgment results of lag order in each economic zone.
From Table 5, in the LR, FPE, AIC, SC, and HQ five guidelines, a maximum lag means that the symbol ‘*’ is the most. Table 5 shows that the maximum number of lag periods in the Northeast, the Circum Bohai-Sea, the Yangtze River, and Southwest economic zones is 1. In addition, the maximum number of lag order in the Pearl River, the Middle Part, and the Northwest economic zones is 2.
Table 6 shows the Granger causal relationship between Freight turnover and GDP in seven economic zones.
Table 6.
Granger causality test of freight turnover and GDP in different zones.
Table 6 shows that except for the Yangtze River economic zone, granger causality exists between freight turnover and GDP data in other economic zones. The relationship between freight turnover and GDP in the Northeast economic zone is bidirectional. By contrast, the relationship in the Circum Bohai-Sea, the Pearl River, Middle Part, Southwest, and Northwest is unidirectional. The results show that the relationship between the zonal economy and freight transportation is not the same in each zone. The lack of a consistent pattern of causality in different economic zones suggests that there are many other factors influencing causality at the zonal level between GDP and freight turnover in the real world. For example, there is trade into and out of the economic zones. The closer the economic zone and the quality of the transport infrastructure, the more likely it would be that there would be an impact and greater trade.
4.2. Model Validation
The software of Eviews is used to conduct the impulse response analysis and variance decomposition of VAR and VECM for validation analysis. Impulse response analysis shows the impact of a standard deviation of zonal GDP on the change of freight turnover or the impact of a standard deviation of freight turnover on the change of zonal GDP. Figure 4 depicts the analysis results of the impulse response between GDP and freight turnover in each economic zone.
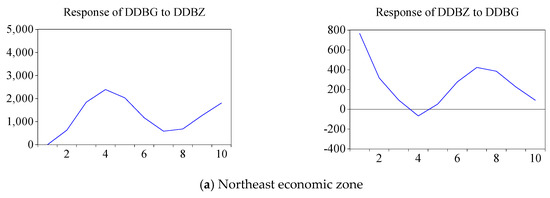
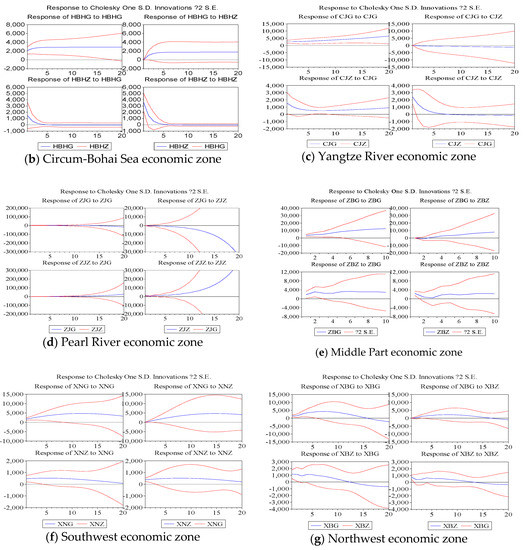
Figure 4.
Freight turnover and GDP impulse response in each economic zone.
Figure 4 shows that the effect of freight turnover on GDP in the Northeast economic zone first increases and then decreases. The effect of GDP on freight turnover first decreases and then increases once reaches the minimum value in the fourth period. The freight turnover in the Circum Bohai-Sea economic zone has a positive effect on GDP, and the GDP has a positive effect on freight turnover. The effect of freight turnover on GDP in the Yangtze River economic zone constantly increases, and the effect of GDP on freight turnover increases from large to small and changes to large. The interaction between freight turnover and GDP in the Pearl River economic zone is increasing. In addition, the interaction between freight turnover and GDP in the Middle Part economic zone tends to be stable. Moreover, the interaction between freight turnover and GDP in the Southwest economic zone first increases and then decreases. The promotion effect of freight turnover on GDP in the Northwest economic zone first increased and then leveled off. Lastly, the promotion effect of GDP on freight turnover first increased, then decreased and increased in the next cycle.
Variance decomposition assesses the significance of different structural impacts by analyzing the contribution of each structural impact on the change of endogenous variables (commonly measured by variance). Figure 5 depicts the variance decomposition results of GDP and freight turnover in each economic zone.
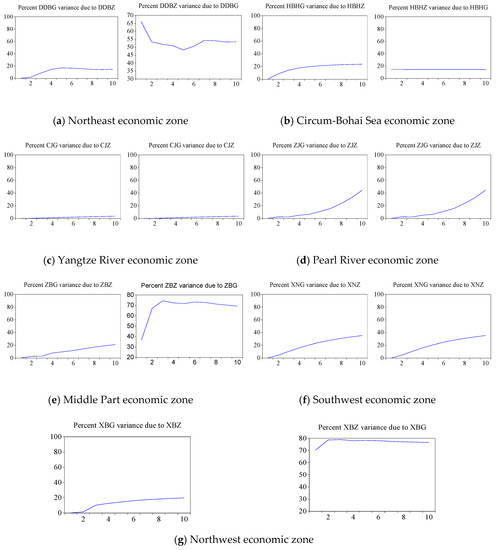
Figure 5.
Variance decomposition results of GDP and freight turnover in each economic zone.
Figure 5 indicates that the contribution rate of freight turnover to GDP in the Northeast economic zone is within 20%, and the contribution rate of GDP to freight turnover is between 45% and 70%. The mutual contribution rate of freight turnover and GDP in the Circum Bohai-Sea economic zone remains within 20%. The mutual contribution rate of freight turnover and GDP in the Yangtze River economic zone is almost zero. By contrast, the mutual contribution rate of freight turnover and GDP in the Pearl River economic zone keeps the same growth trend. In the Middle Part economic zone, the contribution rate of freight turnover to GDP increases within 20%, and the contribution rate of GDP to freight turnover continues to increase and then maintains by approximately 70%. The mutual contribution rate of freight turnover and GDP in the Southwest economic zone increases to 40%. The contribution rate of freight turnover to GDP in the Northwest economic zone increases within 20%. Moreover, the contribution rate of GDP to turnover rate increases continuously in the first three periods and then maintains by approximately 80%. The contribution rate results are consistent with the test results of Granger causality between freight turnover and GDP in different economic zones. The higher the contribution rate is, the more significant the causal relationship is between them.
5. Discussion and Policy Implications
This study investigates the dynamic and bidirectional correlation between freight volume and economic development considering the lagged effects, using the data of freight turnover and GDP from 31 provinces in China. VAR model is exploited to build the relationship between GDP and freight turnover in economic zones of stationary series, whereas VECM is established in the Northeast economic zone, which is proved to have a co-integration relationship. The impulse response analysis and variance decomposition are conducted to verify the effectiveness of the model. In addition, the Granger causality test is conducted. The main findings and discussions are as follows.
(1) The relationship between freight turnover and GDP in the Northeast economic zone is bidirectional. This result is consistent with several previous studies that found the interactive impact of transportation and economic growth. Meng et al. [21] found that the relationship between railway transportation and economic improvement was mutually promoting. This same finding is also supported by Pradhan et al. [7], which suggested that transportation infrastructure promoted economic growth and, economic growth had also boosted transport infrastructure in return.
(2) A unidirectional relationship exists between freight turnover and GDP in the Circum Bohai-Sea, the Pearl River, Middle Part, Southwest, and Northwest economic zone. The unidirectional relationship between freight transportation and GDP found in our analysis is consistent with Saidi et al. [9] who suggested that transportation contributes to economic growth. Moreover, our result is in line with several previous studies that found a significant impact of road infrastructure on economic growth [10,12].
(3) However, the Granger causality is not obvious in the Yangtze River economic zone. A plausible interpretation of this result would be that it is insufficient to create growth by merely enhancing accessibility. The freight turnover does not always increase with the construction of transportation facilities due to a lack of efficient utilization of them. Moreover, other conditions such as the political situation, management, and control system might cause a difference in economic growth. This result is supported by Park et al. [20], who examined the role of various types of transport infrastructure in economic growth. Results showed that air and land transport in developing countries were often independent of economic growth.
The results show that the relationship of causality direction between economy and freight transportation is not the same in each economic zone. The lack of a consistent pattern of causality suggests that there are many other factors influencing causality at the zonal level between GDP and freight turnover in the real world. For example, there is trade into and out of the economic zones. The closer the economic zone and the quality of the transport infrastructure, the more likely it would be that there would be an impact and greater trade. The relationship between freight and GDP is an important topic for both strategic transport planning and the demand estimates needed for feasibility studies that underly investments work hundreds of millions of dollars to improve China’s road, rail, port, and airport infrastructure. Besides, factors outside the zones affect freight transport and GDP within a zone. For example, there is trade between economic zones in China. Most imports and exports, in terms of volume, are handled by ports on the east coast. While some of that cargo is only transported in the respective zones, others are originated or destined to other economic zones.
Based on the above conclusions and discussions, the following policy recommendations have been put forward to further promote the sustainable development of freight transport and economic system.
(1) If the objective is to promote economic growth in the Northeast, Circum Bohai-Sea, Southwest and Northwest economic zone, then the investment in transport infrastructure would then be of great benefit, as a causal relationship from freight turnover to economic growth has been found. Focusing and investing directly in the promotion of economic development could be a better option for the transportation industry in the Pearl River and Middle Part economic zone.
(2) The transport infrastructure construction in the Middle Part and Northwest economic zone should be strengthened, and the cargo trade relationship with other zones should be increased. Economic policy should be emphasized to form a mutual promoting situation between GDP freight turnovers to promote their economic development. The Freight communication between the Northeast economic zone and other economically developed zones should be strengthened to maintain its economic growth. For the Pearl River economic zone with developed transportation, the transportation and economy can be maintained at the current development level.
(3) Several implications can be drawn from a broader sense, which can provide some references for coordinated development between transportation and economic systems for other economic zones. For the economic zones with a large share of the national GDP, the basic principle of freight development is to maintain the current level of transportation infrastructure and increase freight exchanges with other economic zones. Also, the various transport means should be through the government-led and market integration, efforts to build intensive operation, clear division of labor and complementary functions of the transport system, which will speed up the growth of the economy. For the less-developed economy, the development of freight transportation in these areas has a considerable impact on the GDP of the country. The traffic infrastructure construction and the historical problems of these areas should be given special attention to promoting economic development. For the already-built rural roads, the demand for daily maintenance and repair should be met for ensuring good conditions to realize the sustainable development of freight transportation and the economy.
China is in the new normal of medium to high-speed economic growth in the near future instead of high-speed economic growth in past decades. Transportation is a crucial area to expand domestic demand and serve steady economic growth. How to promote sustainable development between transportation and economy system effectively is a new test under the background of the strong transportation network in the new era. The examination of causality direction between them precisely is beneficial to provide sustainable development policies and promote the coordination of the zonal economy and transportation.
The economic indicator used in this paper is GDP, and the transportation indicator is freight turnover. In the future, other variables such as national GDP growth rate, the size of each zone, and some sort of factor to act as a proxy for developments in neighboring zones could be considered and expanded to examine the direction of causality more precisely.
Author Contributions
The authors confirm contribution to the paper as follows: study conception and design: Y.M.; data collection: G.G. and K.C; analysis and interpretation of results: J.Z.; All authors reviewed the results and approved the final version of the manuscript.
Funding
This research received no external funding.
Acknowledgments
This work has received support from the National Development and Reform Commission’s Economic Activity Adjustment Office. The authors had an appreciation to the Institute of Traffic Engineering reviewers and doctoral students for their helpful reviews.
Conflicts of Interest
We declare that we have no financial and personal relationships with other people or organizations that can inappropriately influence our work, there is no professional or other personal interest of any nature or kind in any product, service and/or company that could be construed as influencing the position presented in, or the review of, the manuscript entitled.
References
- He, D.; Yin, Q.; Zheng, M.; Gao, P. Transport and zonal economic integration: Evidence from the Chang–Zhu–Tan zone in China. Transp. Policy 2019, 79, 193–203. [Google Scholar] [CrossRef]
- Saidi, S.; Hammami, S. Modeling the causal linkages between transport, economic growth and environmental degradation for 75 countries. Transp. Res. Part D Transp. Environ. 2018, 53, 415–427. [Google Scholar] [CrossRef]
- Khadaroo, J.; Seetanah, B. Transport and economic performance: The case of Mauritius. J. Transp. Econ. Policy 2008, 42, 255–267. [Google Scholar]
- Beyzatlar, M.A.; Karacal, M.; Yetkiner, H. Granger-causality between transportation and GDP: A panel data approach. Transp. Res. Part A 2014, 63, 43–55. [Google Scholar] [CrossRef]
- Yu, N.; Jong, M.D.; Storm, S.; Mi, J. Transport infrastructure, spatial clusters and zonal economic growth in China. Transp. Rev. 2012, 32, 3–28. [Google Scholar] [CrossRef]
- Sahoo, P.; Dash, R.K. Economic growth in South Asia: Role of infrastructure. J. Int. Trade Econ. Dev. 2012, 21, 217–252. [Google Scholar] [CrossRef]
- Pradhan, R.P.; Bagchi, T.P. Effect of transportation infrastructure on economic growth in India: The VECM approach. Res. Transp. Econ. 2013, 38, 139–148. [Google Scholar] [CrossRef]
- Hurlin, C. Testing Granger Causality in Heterogeneous Panel Data Models with Fixed Coefficients; University of Orléans: Orleans, France, 2004. [Google Scholar]
- Saidi, S.; Shahbaz, M.; Akhtar, P. The long-run relationships between transport energy consumption, transport infrastructure, and economic growth in MENA countries. Transp. Res. Part A Policy Pract. 2018, 111, 78–95. [Google Scholar] [CrossRef]
- Achour, H.; Belloumi, M. Investigating the causal relationship between transport infrastructure, transport energy consumption and economic growth in Tunisia. Renew. Sustain. Energy Rev. 2016, 56, 988–998. [Google Scholar] [CrossRef]
- Han, C. Research on the relationship between railway network development and economic growth in central China. In Proceedings of the 18th International Conference on Parallel and Distributed Computing, Applications and Technologies (PDCAT), Taipei, Taiwan, 18–20 December 2017; pp. 238–242. [Google Scholar]
- Wetwitoo, J.; Kato, H. High-speed rail and regionzonal economic productivity through agglomeration and network externality: A case study of inter-regionzonal transportation in Japan. Case Stud. Transp. Policy 2017, 5, 549–559. [Google Scholar] [CrossRef]
- Halaszovich, T.; Kinra, A. The impact of distance, national transportation systems and logistics performance on FDI and international trade patterns: Results from Asian global value chains. Transp. Policy 2020, 98, 35–47. [Google Scholar] [CrossRef]
- Kuzu, S.; Önder, E. Research into the long-run relationship between logistics development and economic growth in Turkey. Soc. Sci. Electron. Publ. 2014, 3, 11–16. [Google Scholar]
- Gao, Y.; Zhang, Y.; Li, H.; Peng, T.; Hao, S. Study on the relationship between comprehensive transportation freight index and GDP in China. Procedia Eng. 2016, 137, 571–580. [Google Scholar] [CrossRef]
- Guo, J.; Xia, J. Econometrical investigation on infrastructure investment and economic development in China: A case study using vector autoregression approach. KSCE J. Civil Eng. 2011, 15, 561–567. [Google Scholar] [CrossRef]
- Chi, J.; Baek, J. Dynamic relationship between air transport demand and economic growth in the United States: A new look. Transp. Policy 2013, 29, 257–260. [Google Scholar] [CrossRef]
- Banister, D.; Berechman, Y. Transport investment and the promotion of economic growth. J. Transp. Geogr. 2001, 9, 209–218. [Google Scholar] [CrossRef]
- Deng, T.; Shao, S.; Yang, L.; Zhang, X. Has the transport led economic growth effect reached a peak in China? A panel threshold regression approach. Transportation 2014, 41, 567–587. [Google Scholar] [CrossRef]
- Park, J.S.; Seo, Y.; Ha, M. The role of maritime, land, and air transportation in economic growth: Panel evidence from OECD and non-OECD countries. Res. Transp. Econ. 2019, 78, 100765. [Google Scholar] [CrossRef]
- Meng, L.; Li, L.; Liu, S. Research on relationship between regional railway freight volume and GDP. In Proceedings of 4th International Conference on Logistics, Informatics and Service Science; Springer: Heidelberg, Germany, 2015; pp. 345–350. [Google Scholar]
- Lei, M.C.Q. Research prospect on the relationship between transportation and regional economy in the Hui nationality agglomeration of China. Mod. Transp. 2014, 3, 56–61. [Google Scholar]
- Muller, S.; Klauenberg, J.; Wolfermann, A. How to translate economic activity into freight transportation. Transp. Res. Procedia 2015, 8, 155–167. [Google Scholar] [CrossRef][Green Version]
- Zhu, F.; Wu, X.; Gao, Y.E. Decomposition analysis of decoupling freight transport from economic growth in China. Transp. Res. Part D Transp. Environ. 2020, 78, 102201. [Google Scholar] [CrossRef]
- Jiang, X.; He, X.; Zhang, L.; Qin, H.; Shao, F. Multimodal transportation infrastructure investment and regional economic development: A structural equation modeling empirical analysis in China from 1986 to 2011. Transp. Policy 2017, 54, 43–52. [Google Scholar] [CrossRef]
- Listiono, L. The relationship between transport, economic growth and environmental degradation for ninety countries. J. Environ. Sustain. 2018, 2, 1–64. [Google Scholar] [CrossRef]
- Tong, T.; Yu, T.E. Transportation and economic growth in China: A heterogeneous panel co-integration and causality analysis. J. Transp. Geogr. 2018, 73, 120–130. [Google Scholar] [CrossRef]
- Pradhan, R.P. Investigating the causal relationship between transportation infrastructure, financial penetration and economic growth in G-20 countries. Res. Transp. Econ. 2019, 78, 100766. [Google Scholar] [CrossRef]
- Klaassen, L.H. Regional science: Some dutch experiences. Pap. Reg. Sci. Assoc. 2010, 40, 7–15. [Google Scholar] [CrossRef]
- MacKinnon, J.G. Numerical distribution functions for unit root and co-integration tests. J. Appl. Econ. 1996, 11, 601–618. [Google Scholar] [CrossRef]
- Jian, Q.L.; Jing, H.E. Empirical analysis on the relationship between transportation industry and the national economy. Commun. Transp. Syst. Eng. Inf. 2002, 2, 1025–1032. [Google Scholar]
- Hall, A.R.; Inoue, A.; Jana, K.; Shin, C. Information in generalized method of moments estimation and entropy-based moment selection. J. Econ. 2007, 138, 488–512. [Google Scholar] [CrossRef]
- Jovanovic, B. Economic growth: Theory. Int. Encycl. Soc. Behav. Sci. 2001, 5, 4098–4101. [Google Scholar]
- Kourtellos, A.; Stengos, T.; Tan, C.M. Structural threshold regression. SSRN Electron. J. 2016, 1, 827–860. [Google Scholar] [CrossRef]
- Sharif, A.; Shahbaz, M.; Hille, E. The Transportation-growth nexus in USA: Fresh insights from pre-post global crisis period. Transp. Res. Part A Policy Pract. 2019, 121, 108–121. [Google Scholar] [CrossRef]
- Pesaran, M.H.; Baltagi, B.H. Heterogeneity and cross section dependence in panel data models: Theory and applications introduction. J. Appl. Econ. 2010, 22, 229–232. [Google Scholar]
- Dormady, N.; Roa-Henriquez, A.; Rose, A. Economic resilience of the firm: A production theory approach. Int. J. Prod. Econ. 2019, 208, 446–460. [Google Scholar] [CrossRef]
- Fisk, C.S. A conceptual framework for optimal transportation systems planning with integrated supply and demand models. Transp. Sci. 1986, 20, 37–47. [Google Scholar] [CrossRef]
- Hakim, M.M.; Merkert, R. The causal relationship between air transport and economic growth: Empirical evidence from South Asia. J. Transp. Geogr. 2016, 56, 120–127. [Google Scholar] [CrossRef]
- National Bureau of Statistics of China (NBS). 2018. Available online: http://data.stats.gov.cn/easyquery.htm?cn=E0103 (accessed on 6 December 2020).
- Dickey, D.A.; Fuller, W.A. Likelihood ratio statistics for autoregressive time series with a unit root. Econometrica 1981, 49, 1057–1072. [Google Scholar] [CrossRef]
Publisher’s Note: MDPI stays neutral with regard to jurisdictional claims in published maps and institutional affiliations. |
© 2020 by the authors. Licensee MDPI, Basel, Switzerland. This article is an open access article distributed under the terms and conditions of the Creative Commons Attribution (CC BY) license (http://creativecommons.org/licenses/by/4.0/).