Monitoring and Predicting Spatio-Temporal Land Use/Land Cover Changes in Zaria City, Nigeria, through an Integrated Cellular Automata and Markov Chain Model (CA-Markov)

 , ,
, , 
Abstract
1. Introduction
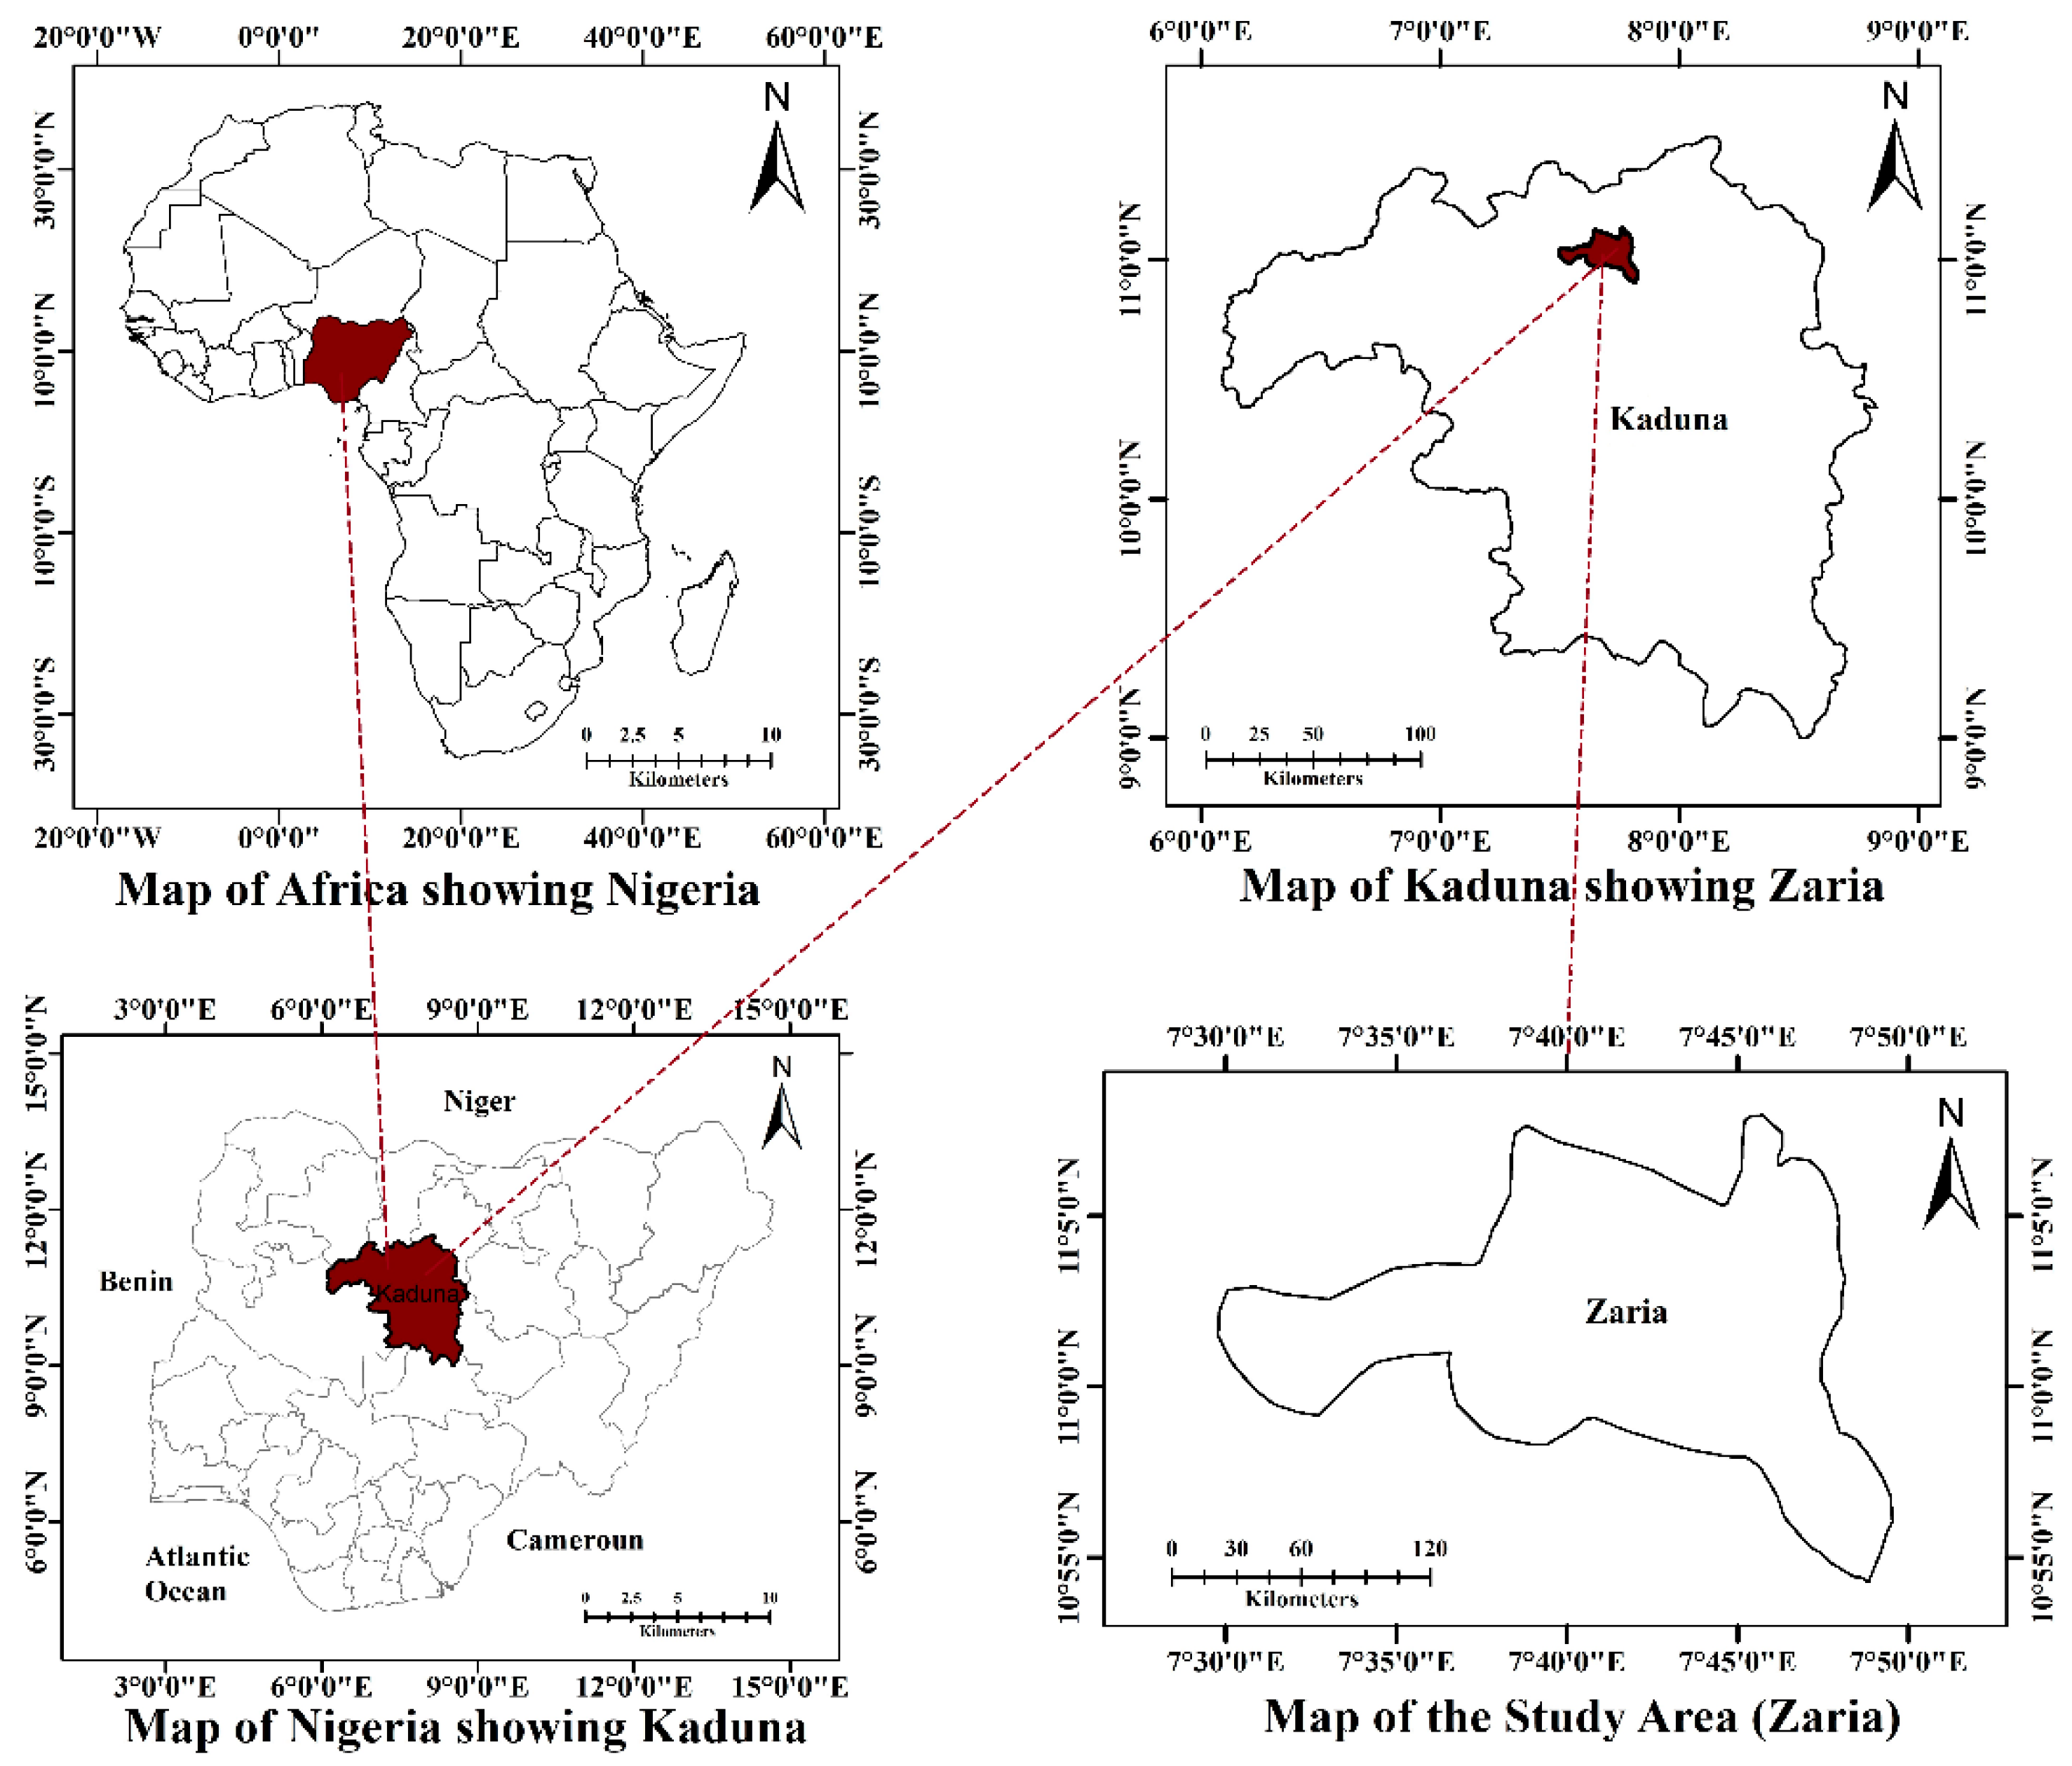
The Study Area
2. Materials and Methods
2.1. Materials
2.1.1. Remotely Sensed Satellite Data
2.1.2. Field Data
2.2. Method
2.2.1. Pre-Processing of Satellite Images
2.2.2. Image Classification
2.2.3. Accuracy Assessment
2.2.4. Land Use/Land Cover Change Detection
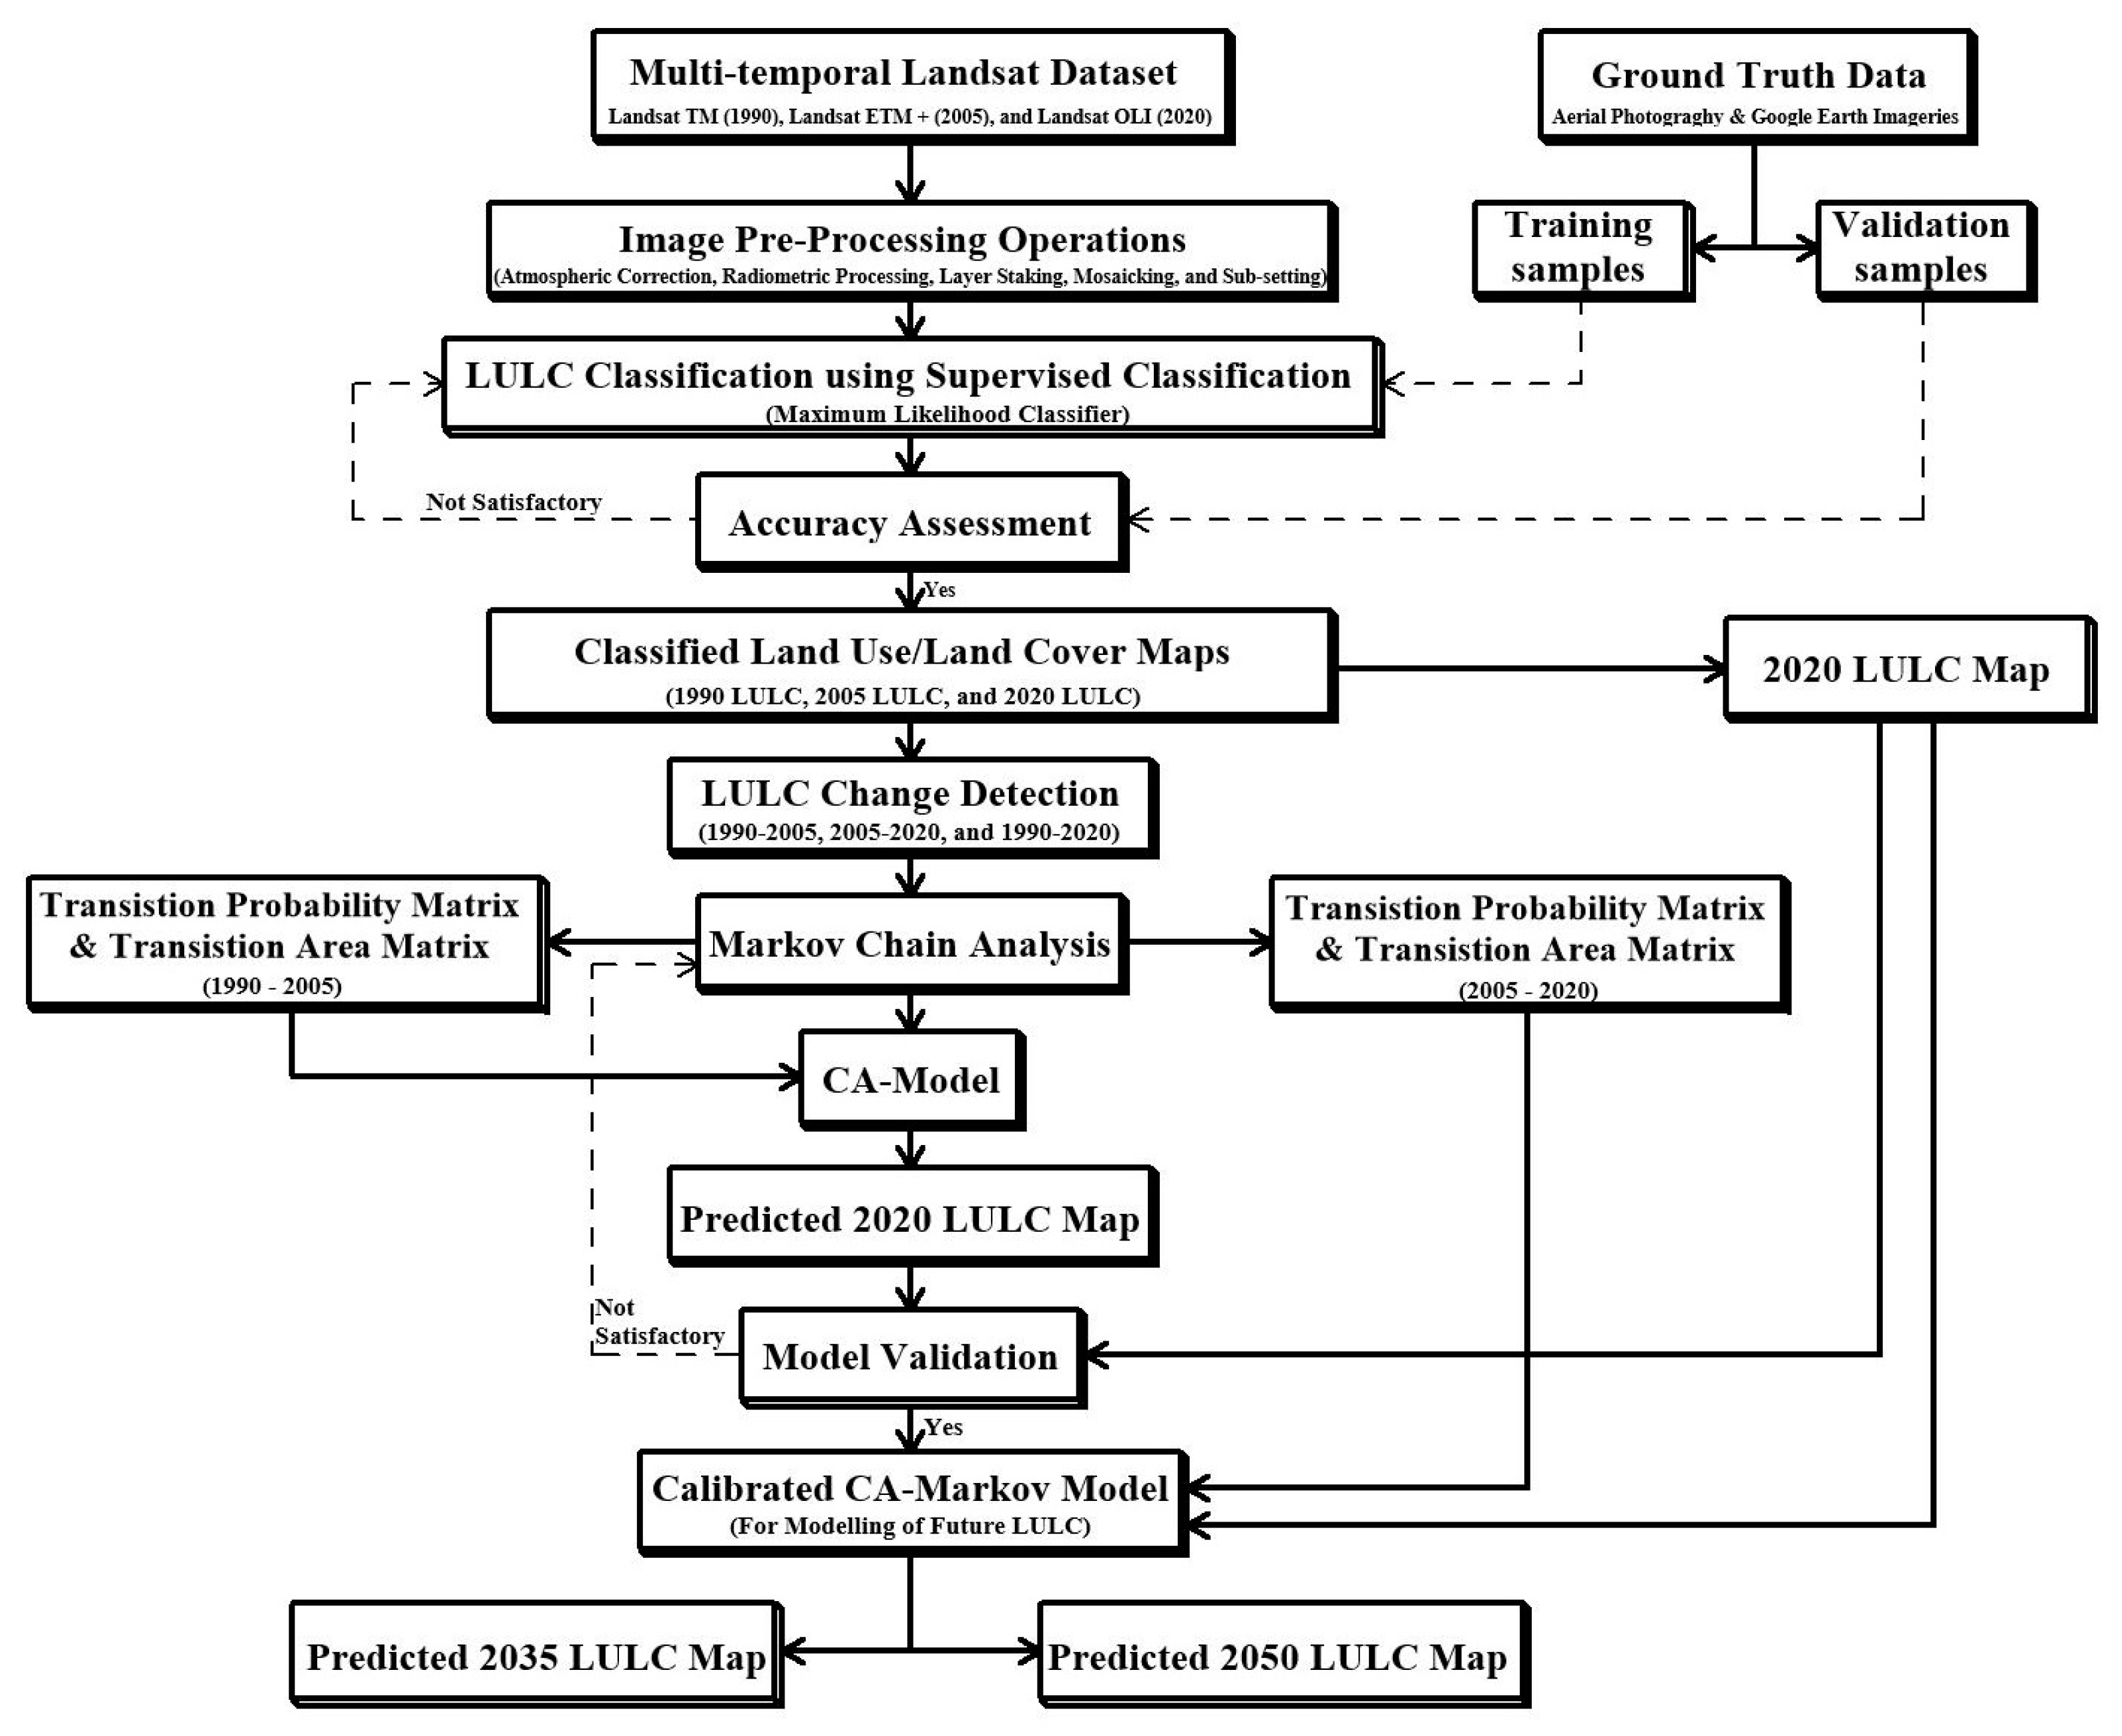
2.2.5. LULC Prediction Using the CA–Markov Model
3. Results and Discussion
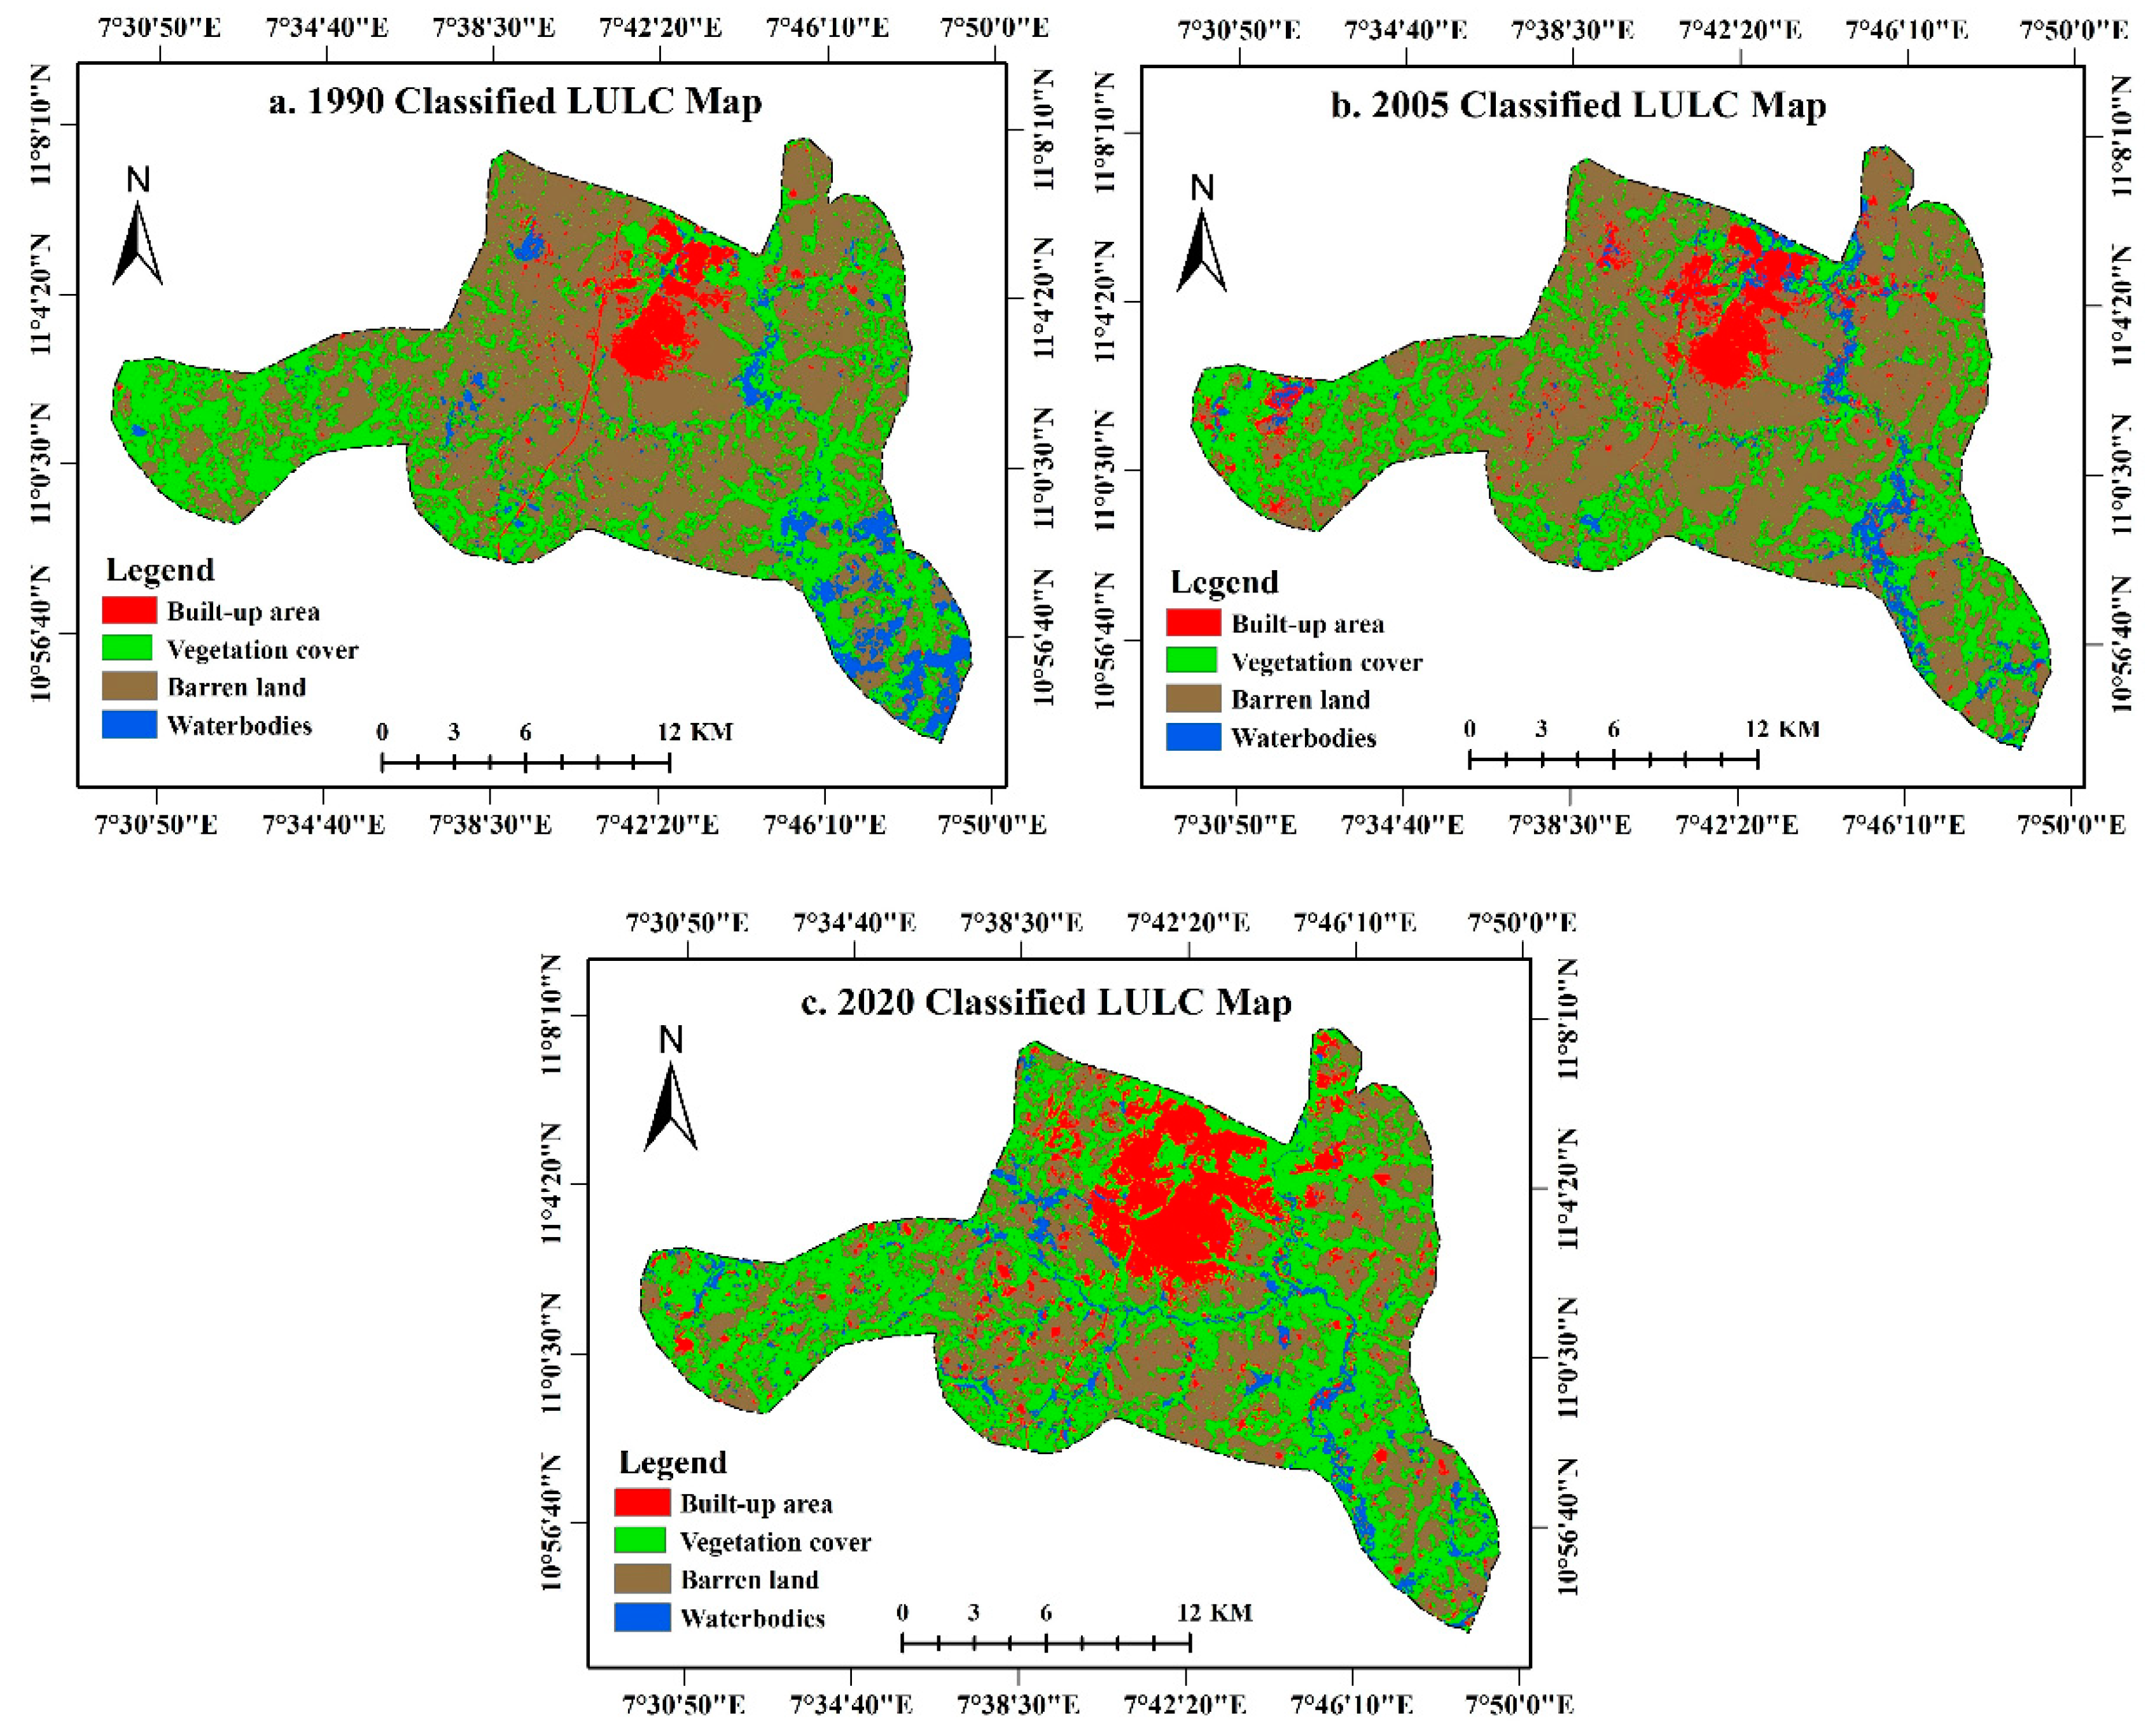
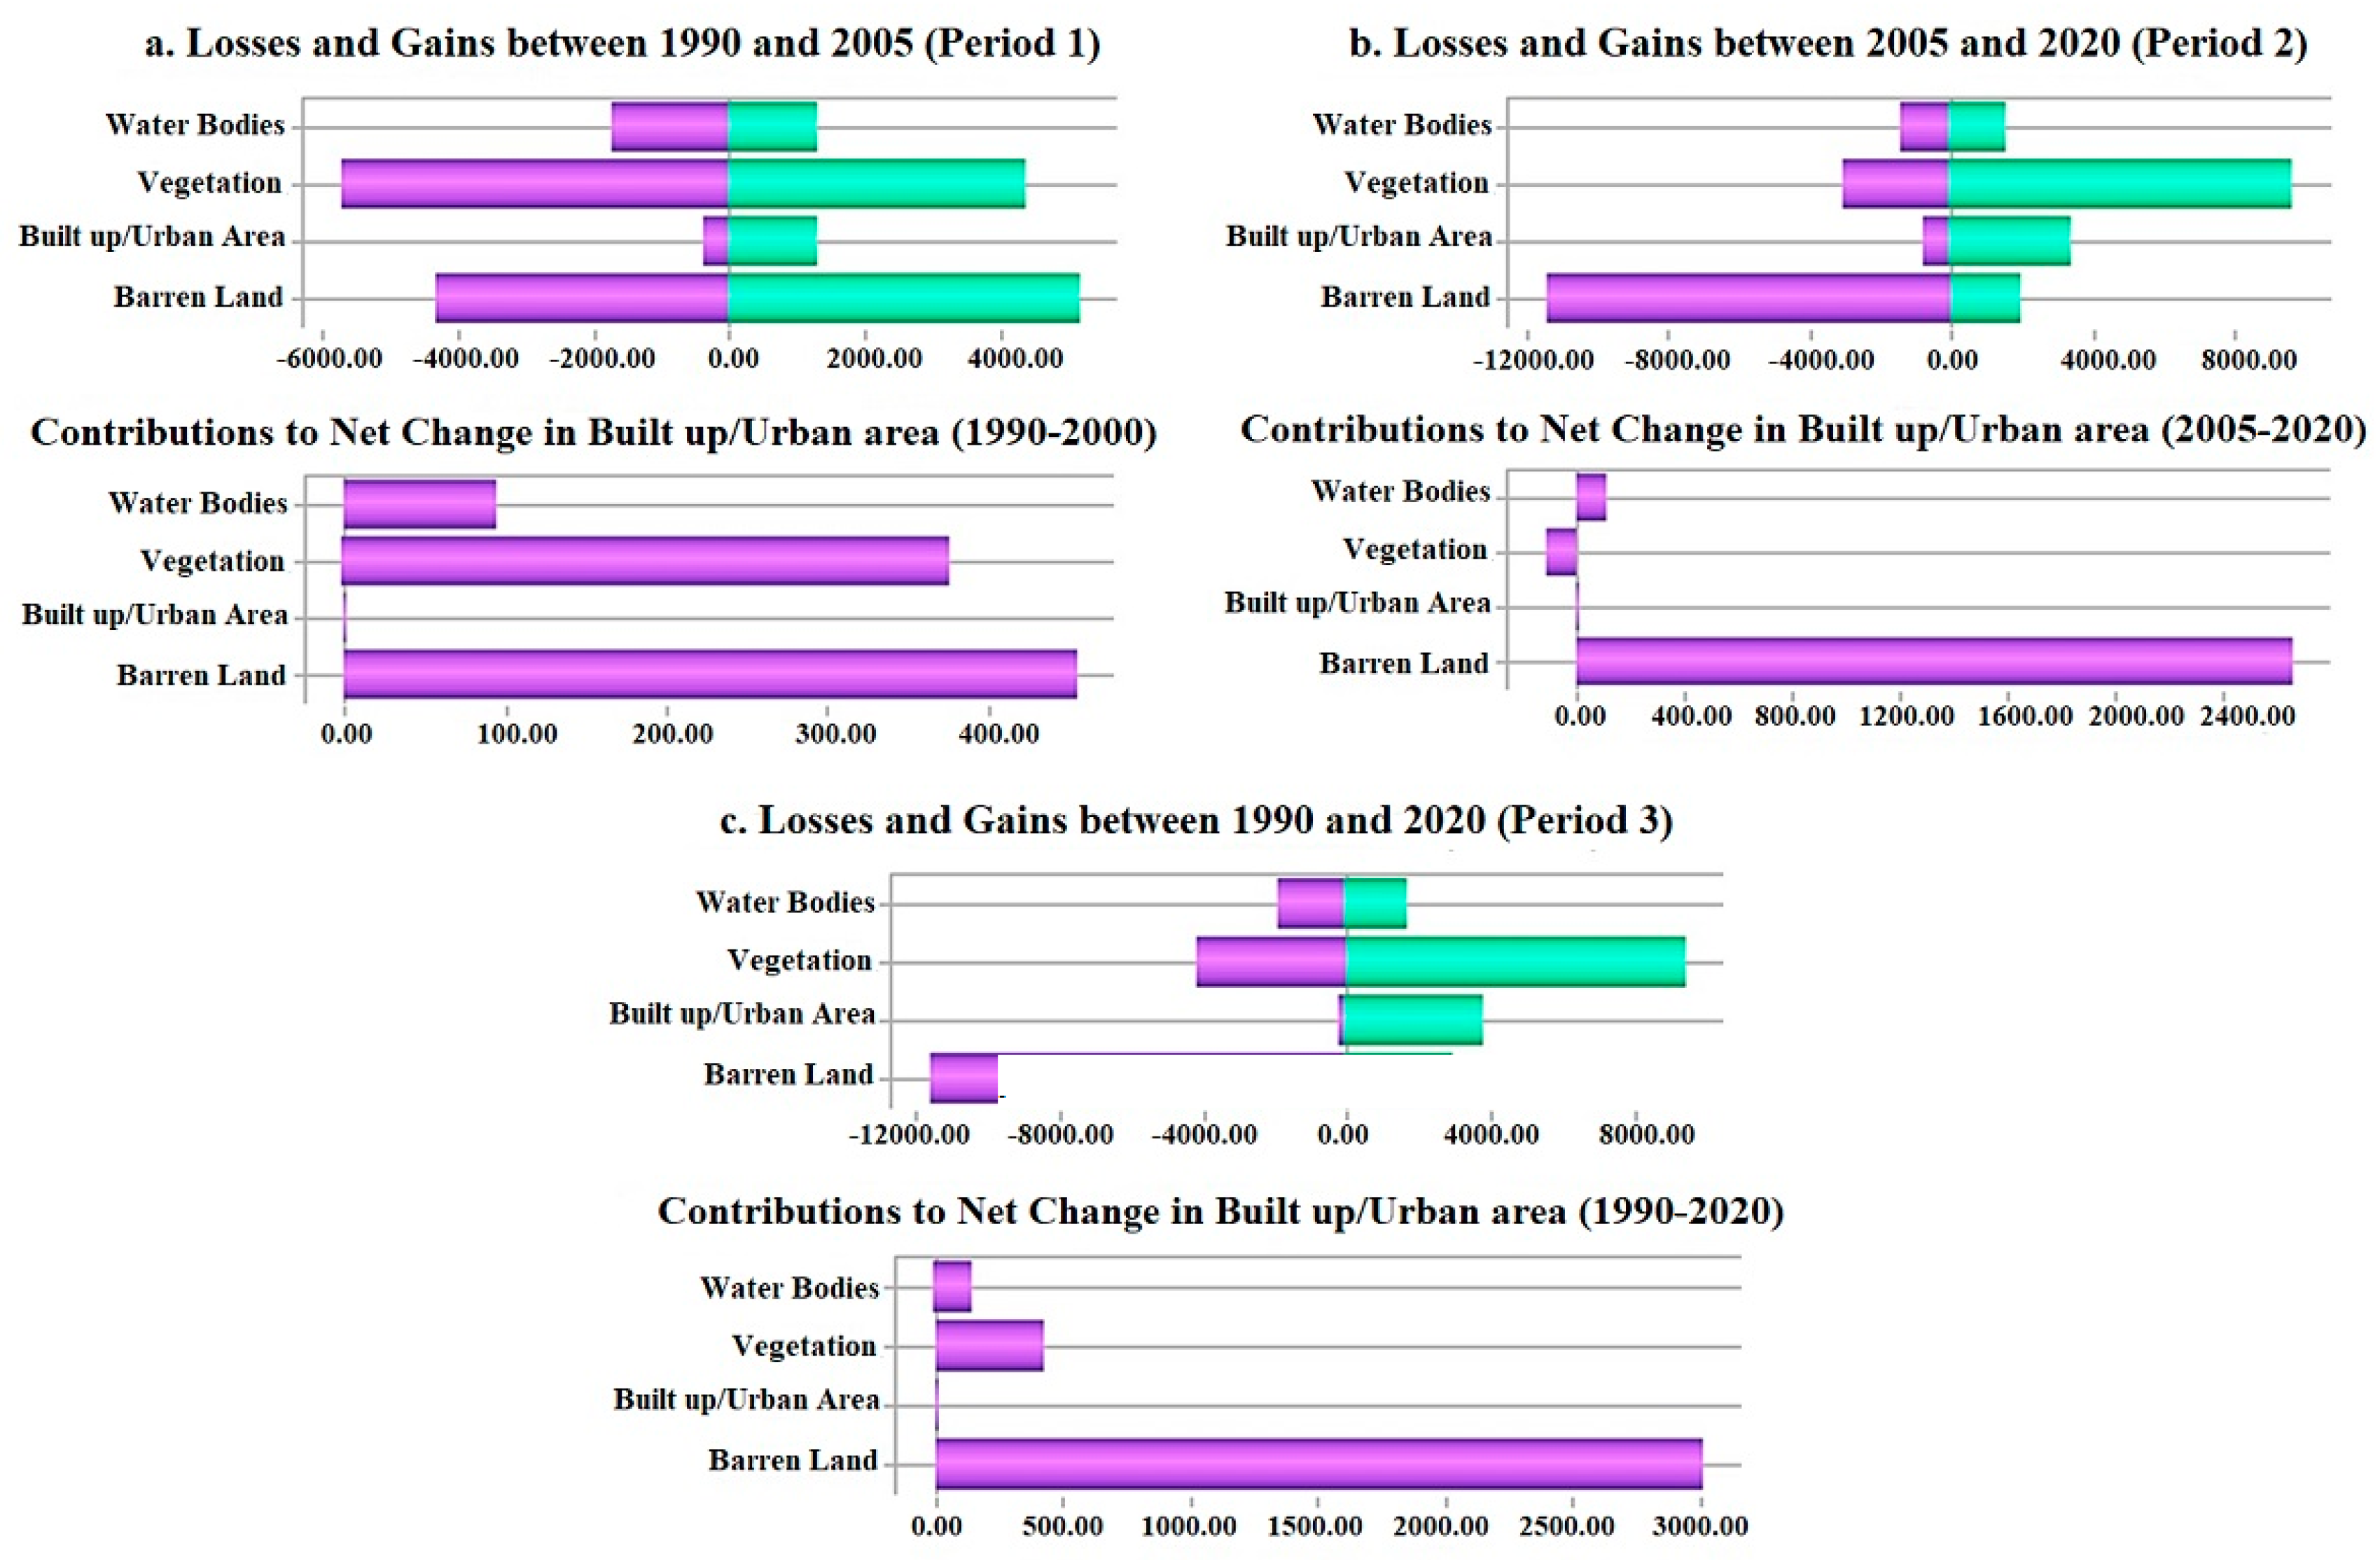
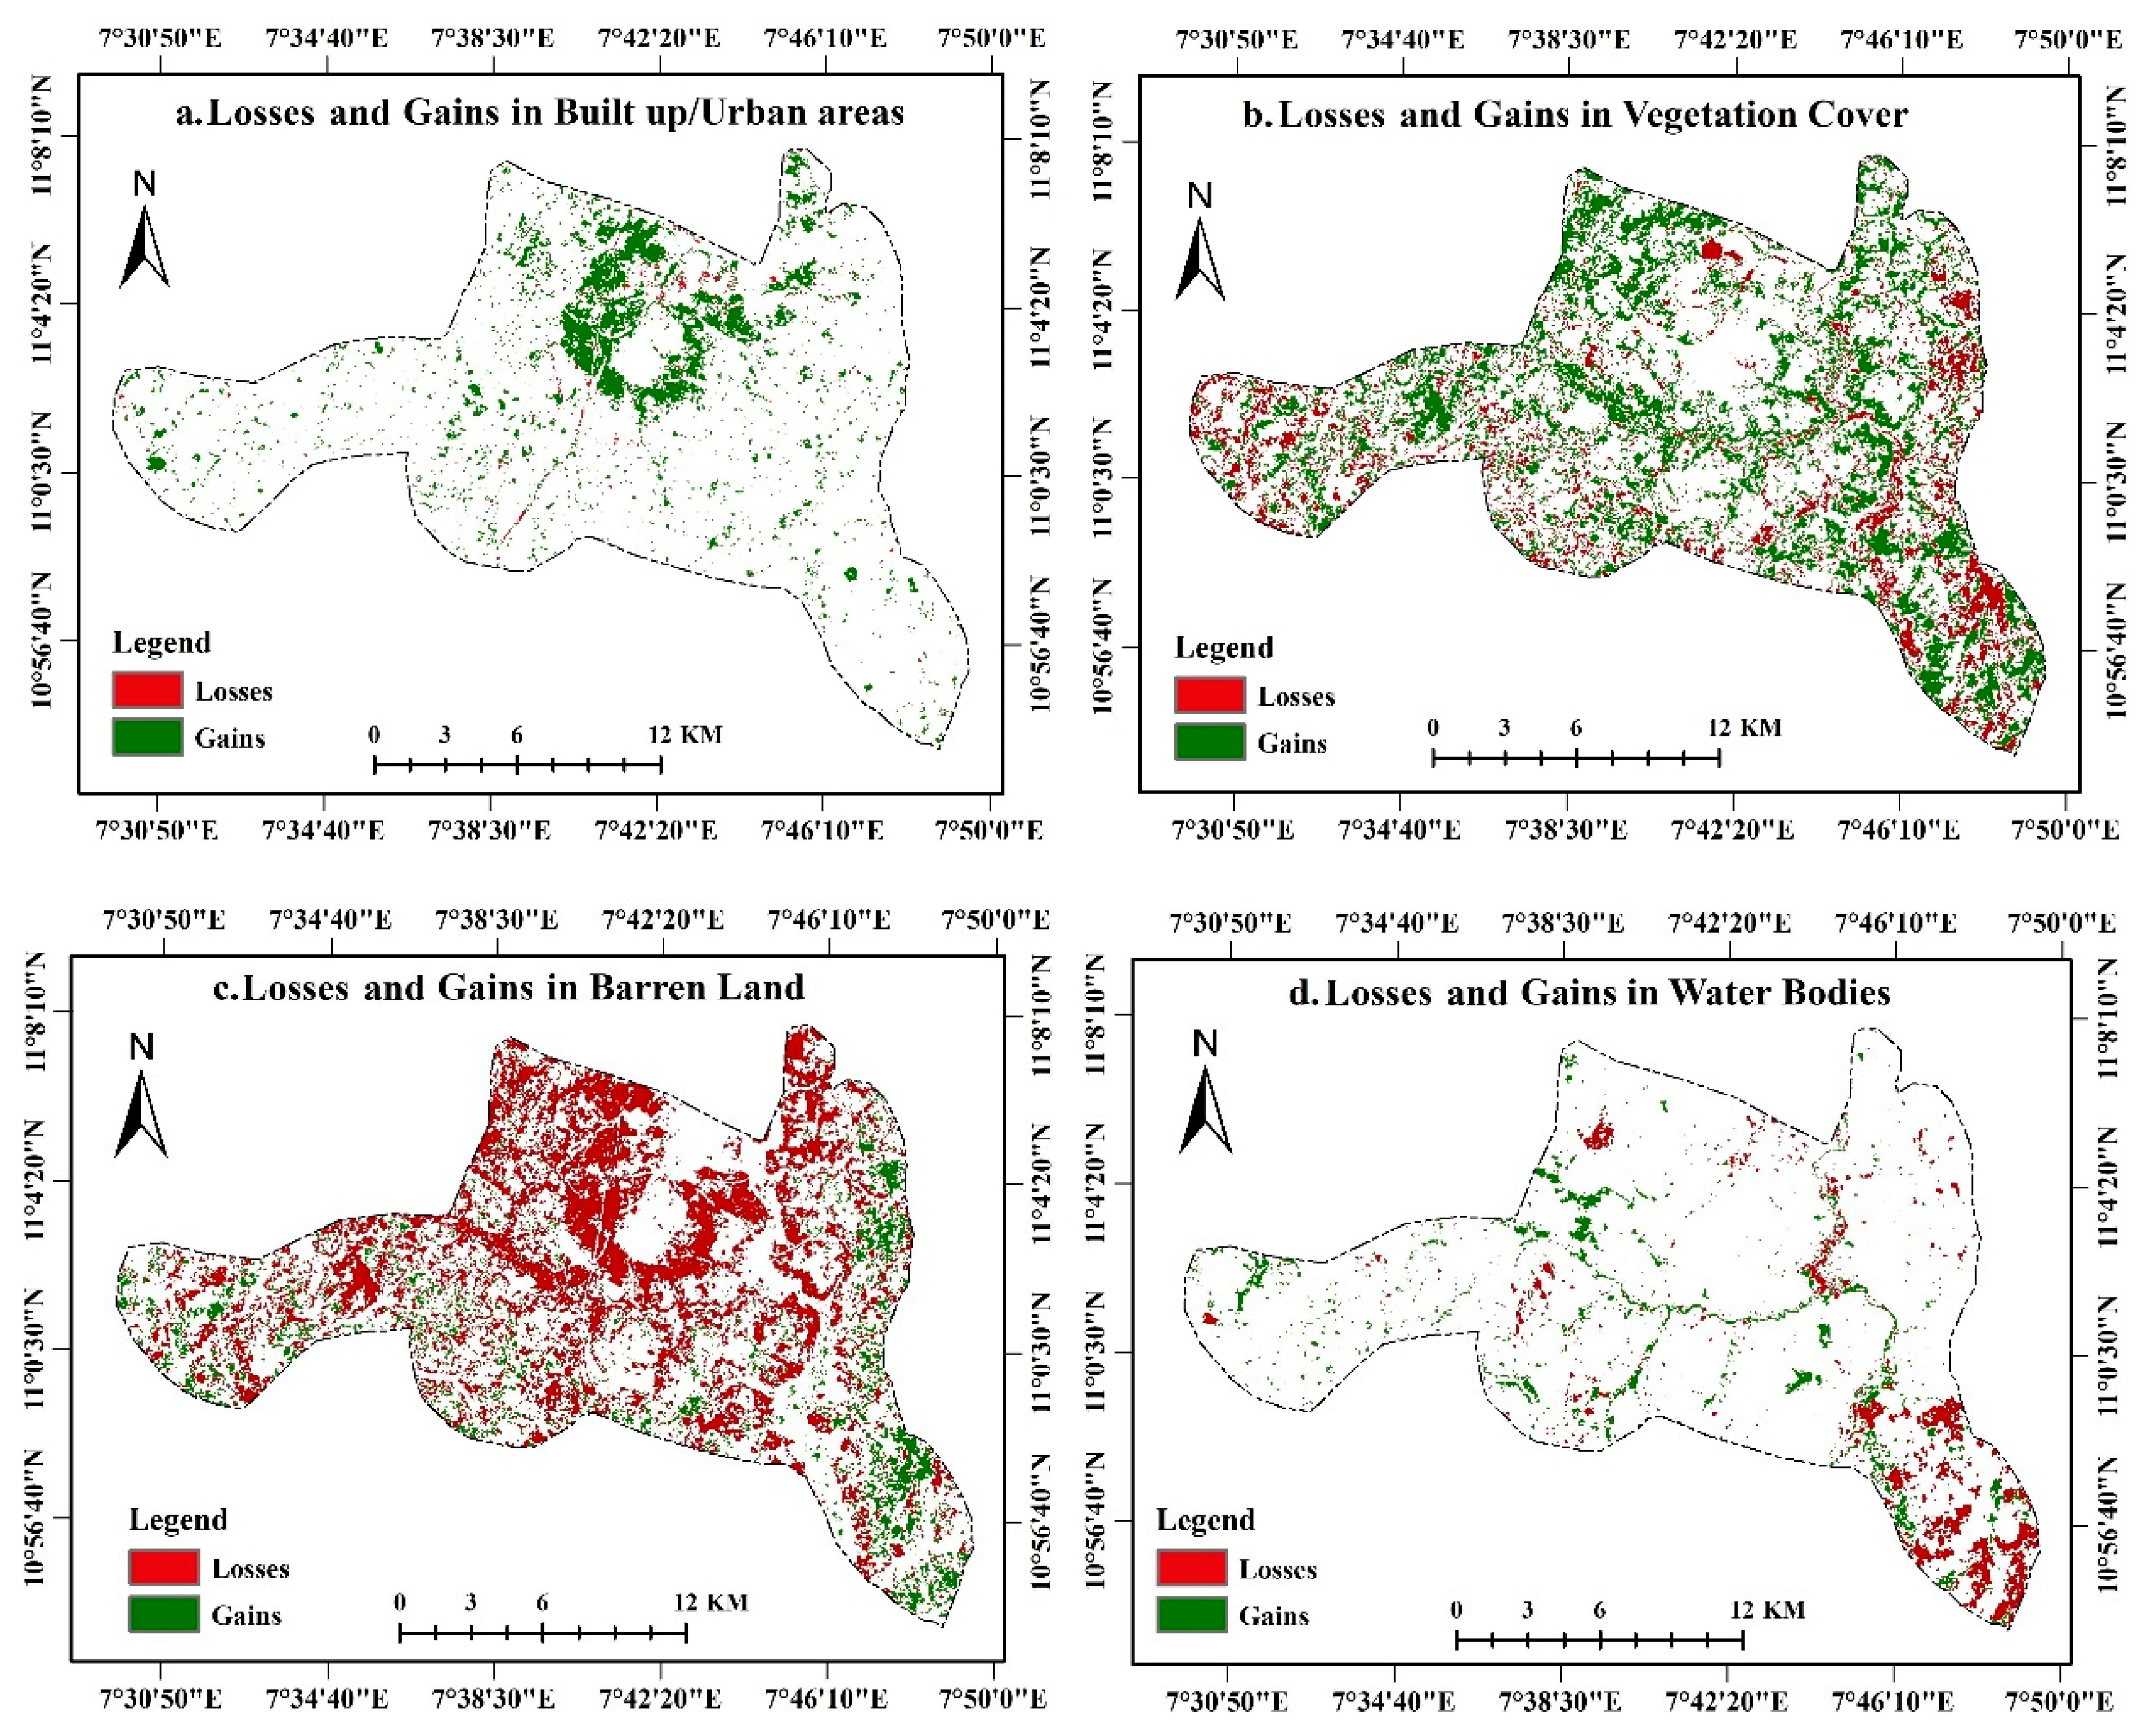
3.1. Land Use/Land Cover Change
3.2. Markov Transition Matrix Analysis
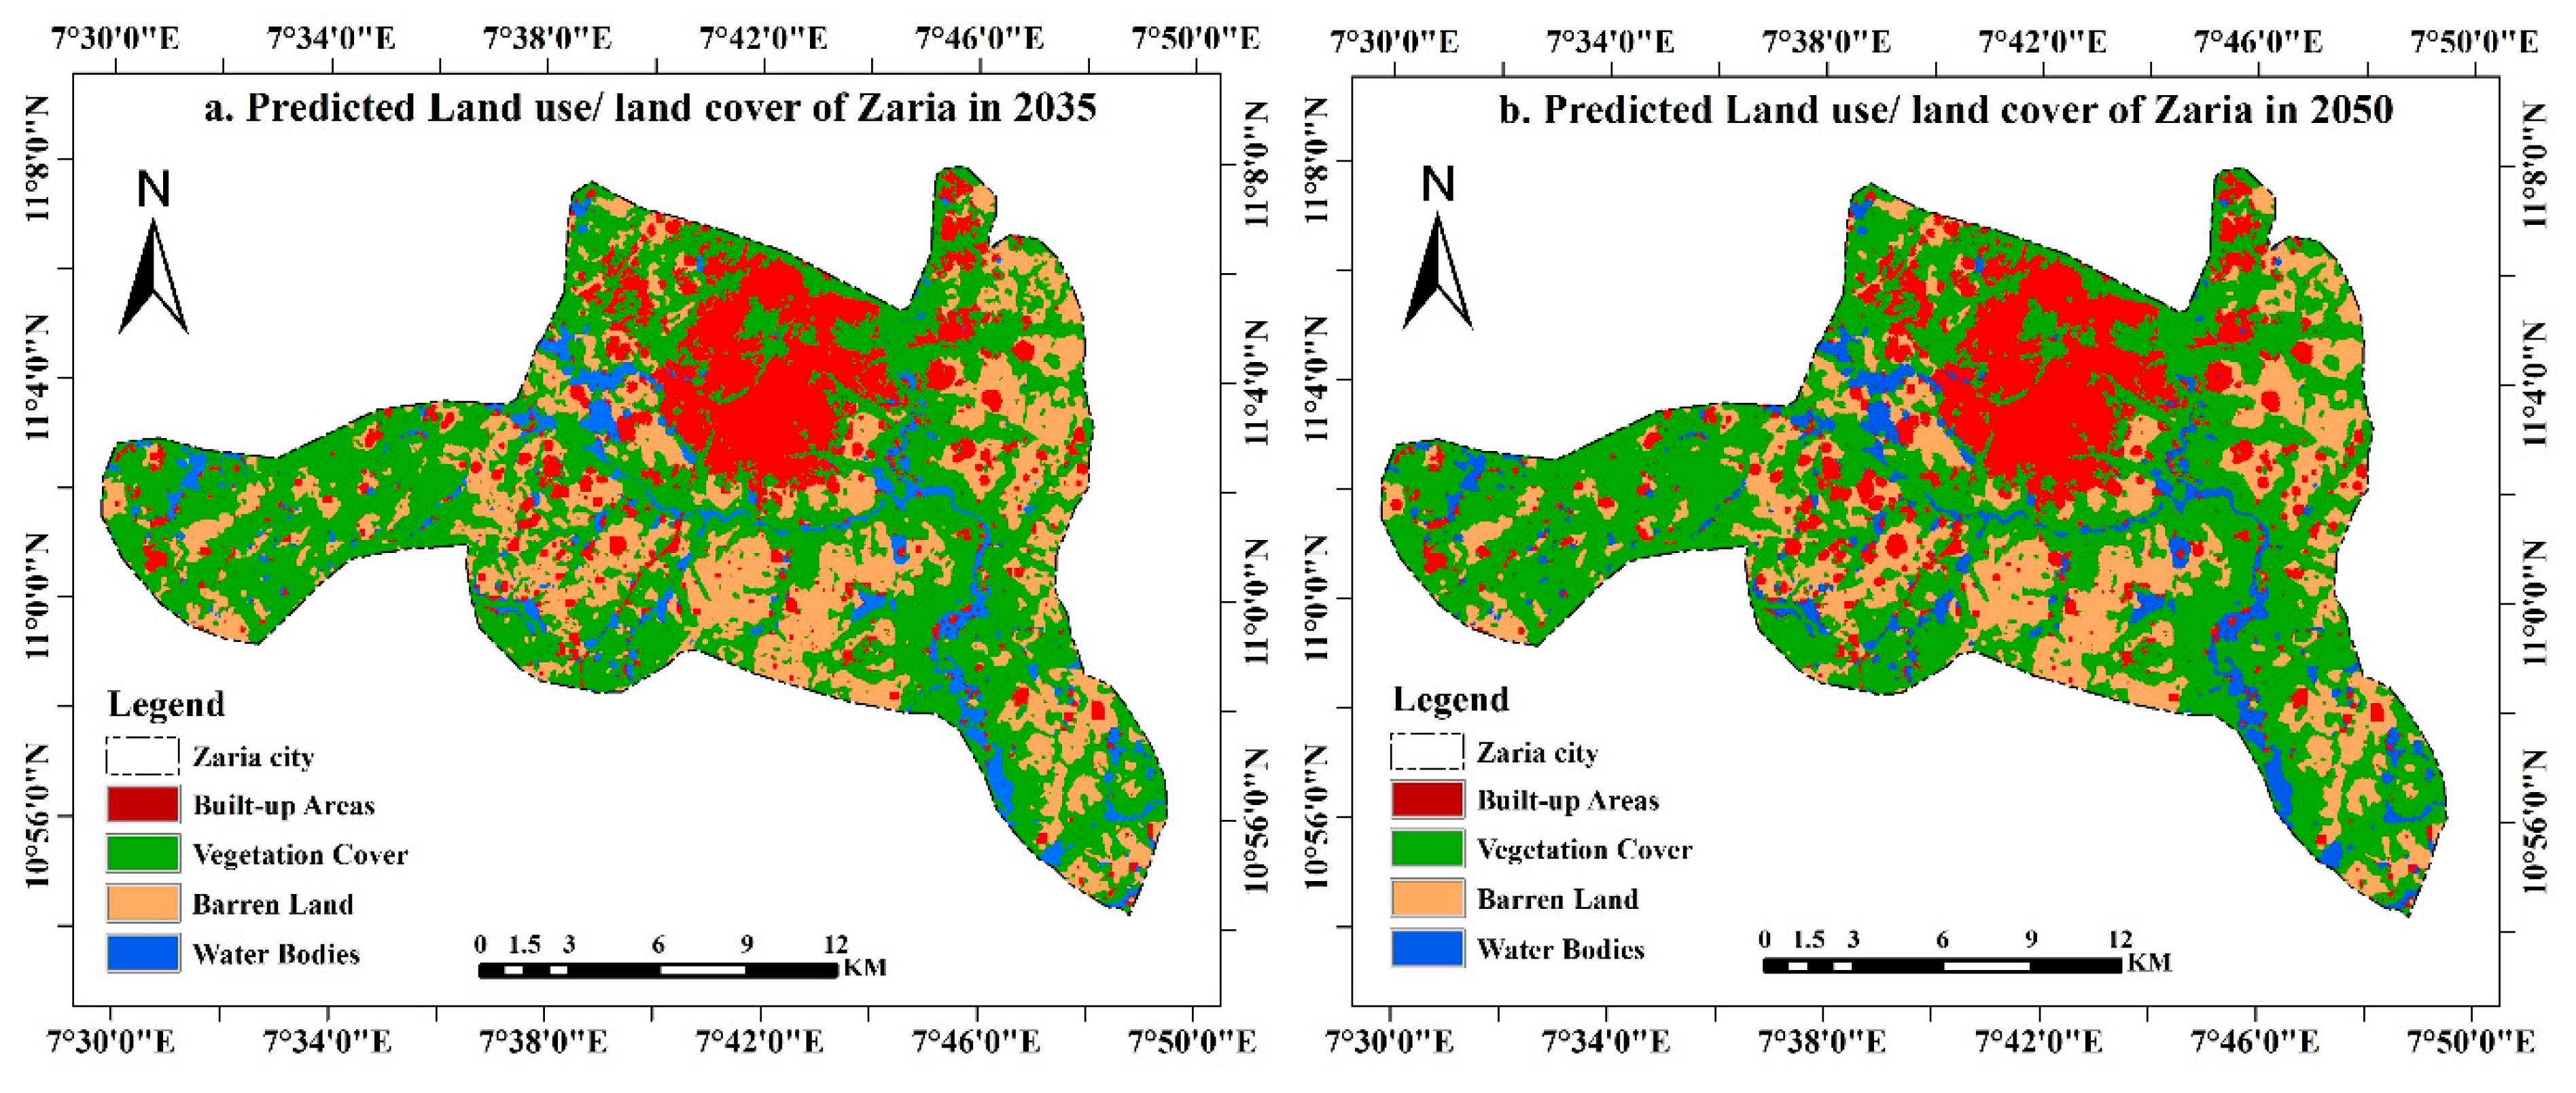
3.3. Modelling and Predicting Land Use/Land Cover Changes
4. Conclusions
Author Contributions
Funding
Conflicts of Interest
References
- An, Y.; Tsou, J.Y.; Wong, K.; Zhang, Y.; Liu, D.; Li, Y. Detecting Land Use Changes in a Rapidly Developing City during 1990–2017 Using Satellite Imagery: A Case Study in Hangzhou Urban Area, China. Sustainability 2018, 10, 3303. [Google Scholar] [CrossRef]
- Awotwi, A.; Anornu, G.K.; Quaye-Ballard, J.A.; Annor, T. Monitoring land use and land cover changes due to extensive gold mining, urban expansion, and agriculture in the Pra River Basin of Ghana, 1986–2025. Land Degrad. Dev. 2018, 29, 3331–3343. [Google Scholar] [CrossRef]
- Karimi, H.; Jafarnezhad, J.; Khaledi, J.; Ahmadi, P. Monitoring and prediction of land use/land cover changes using CA-Markov model: A case study of Ravansar County in Iran. Arab. J. Geosci. 2018, 11, 592. [Google Scholar] [CrossRef]
- Liping, C.; Yujun, S.; Saeed, S. Monitoring and predicting land use and land cover changes using remote sensing and GIS techniques—A case study of a hilly area, Jiangle, China. PLoS ONE 2018, 13, e0200493. [Google Scholar] [CrossRef]
- Li, S.H.; Jin, B.X.; Wei, X.Y.; Jiang, Y.Y.; Wang, J.L. Using Ca-Markov Model to Model the spatiotemporal change of land use/cover in Fuxian Lake for decision support. ISPRS Ann. Photogramm. Remote Sens. Spat. Inf. Sci. 2015, II-4/W2, 163–168. [Google Scholar] [CrossRef]
- Abd El-Hamid, H.T.; El-Alfy, M.A.; Elnaggar, A.A. Prediction of future situation of land use/cover change and modeling sensitivity to pollution in Edku Lake, Egypt based on geospatial analyses. GeoJournal 2020. [Google Scholar] [CrossRef]
- Palmate, S.S.; Pandey, A.; Mishra, S.K. Modelling spatiotemporal land dynamics for a trans-boundary river basin using integrated Cellular Automata and Markov Chain approach. Appl. Geogr. 2017, 82, 11–23. [Google Scholar] [CrossRef]
- Arnous, M.O. Geotechnical site investigations for possible urban extensions at Suez City, Egypt using GIS. Arab. J. Geosci. 2013, 6, 1349–1369. [Google Scholar] [CrossRef]
- Wang, Z.; Wang, Z.; Zhang, B.; Lu, C.; Ren, C. Impact of land use/land cover changes on ecosystem services in the Nenjiang River Basin, Northeast China. Ecol. Process. 2015, 4, 11. [Google Scholar] [CrossRef]
- Yeboah, F.; Awotwi, A.; Forkuo, E.K.; Kumi, M. Assessing the land use and land cover changes due to urban growth in Accra, Ghana. J. Basic Appl. Res. Int. 2017, 22, 43–50. [Google Scholar]
- Munoth, P.; Goyal, R. Impacts of land use land cover change on runoff and sediment yield of Upper Tapi River Sub-Basin, India. Int. J. River Basin Manag. 2020, 18, 177–189. [Google Scholar] [CrossRef]
- Sajikumar, N.; Remya, R.S. Impact of land cover and land use change on runoff characteristics. J. Environ. Manag. 2015, 161, 460–468. [Google Scholar] [CrossRef] [PubMed]
- Hua, A.K. Land Use Land Cover Changes in Detection of Water Quality: A Study Based on Remote Sensing and Multivariate Statistics. J. Environ. Public Health 2017, 2017, 7515130. [Google Scholar] [CrossRef] [PubMed]
- Li, X.; Wang, Y.; Li, J.; Lei, B. Physical and Socioeconomic Driving Forces of Land-Use and Land-Cover Changes: A Case Study of Wuhan City, China. Discret. Dyn. Nat. Soc. 2016, 2016, 8061069. [Google Scholar] [CrossRef]
- Giam, X. Global biodiversity loss from tropical deforestation. Proc. Natl. Acad. Sci. USA 2017, 114, 5775. [Google Scholar] [CrossRef]
- Bounoua, L.; DeFries, R.; Collatz, G.J.; Sellers, P.; Khan, H. Effects of Land Cover Conversion on Surface Climate. Clim. Chang. 2002, 52, 29–64. [Google Scholar] [CrossRef]
- Wang, J.; Maduako, I.N. Spatio-temporal urban growth dynamics of Lagos Metropolitan Region of Nigeria based on Hybrid methods for LULC modeling and prediction. Eur. J. Remote Sens. 2018, 51, 251–265. [Google Scholar] [CrossRef]
- Huang, Y.; Yang, B.; Wang, M.; Liu, B.; Yang, X. Analysis of the future land cover change in Beijing using CA–Markov chain model. Environ. Earth Sci. 2020, 79, 60. [Google Scholar] [CrossRef]
- Aneesha Satya, B.; Shashi, M.; Deva, P. Future land use land cover scenario simulation using open source GIS for the city of Warangal, Telangana, India. Appl. Geomat. 2020, 12, 281–290. [Google Scholar] [CrossRef]
- Wu, Q.; Li, H.Q.; Wang, R.S.; Paulussen, J.; He, Y.; Wang, M.; Wang, B.H.; Wang, Z. Monitoring and predicting land use change in Beijing using remote sensing and GIS. Landsc. Urban Plan. 2006, 78, 322–333. [Google Scholar] [CrossRef]
- Chen, X.; Yu, S.; Zhang, Y.-P. Evaluation of Spatiotemporal Dynamics of Simulated Land Use/Cover in China Using a Probabilistic Cellular Automata-Markov Model. Pedosphere 2013, 23, 243–255. [Google Scholar] [CrossRef]
- Mirkatouli, J.; Hosseini, A.; Neshat, A. Analysis of land use and land cover spatial pattern based on Markov chains modelling. City Territ. Archit. 2015, 2, 4. [Google Scholar] [CrossRef]
- Yang, C.; Wu, G.; Chen, J.; Li, Q.; Ding, K.; Wang, G.; Zhang, C. Simulating and forecasting spatio-temporal characteristic of land-use/cover change with numerical model and remote sensing: A case study in Fuxian Lake Basin, China. Eur. J. Remote Sens. 2019, 52, 374–384. [Google Scholar] [CrossRef]
- Pouliot, D.; Latifovic, R.; Zabcic, N.; Guindon, L.; Olthof, I. Development and assessment of a 250 m spatial resolution MODIS annual land cover time series (2000–2011) for the forest region of Canada derived from change-based updating. Remote Sens. Environ. 2014, 140, 731–743. [Google Scholar] [CrossRef]
- Shooshtari, S.J.; Gholamalifard, M. Scenario-based land cover change modeling and its implications for landscape pattern analysis in the Neka Watershed, Iran. Remote Sens. Appl. Soc. Environ. 2015, 1, 1–19. [Google Scholar] [CrossRef]
- Sun, H.; Forsythe, W.; Waters, N. Modeling Urban Land Use Change and Urban Sprawl: Calgary, Alberta, Canada. Netw. Spat. Econ. 2007, 7, 353–376. [Google Scholar] [CrossRef]
- Wehmann, A.; Liu, D. A spatial–temporal contextual Markovian kernel method for multi-temporal land cover mapping. ISPRS J. Photogramm. Remote Sens. 2015, 107, 77–89. [Google Scholar] [CrossRef]
- Nouri, H.; Faramarzi, M.; Sadeghi, S.H.; Nasseri, S. Effects of regional vegetation cover degradation and climate change on dusty weather types. Environ. Earth Sci. 2019, 78, 723. [Google Scholar] [CrossRef]
- Stefanov, W.; Ramsey, M.; Christensen, P. Monitoring urban land cover change: An expert system approach to land cover classification of semiarid to arid urban centers. Remote Sens. Environ. 2001, 77, 173–185. [Google Scholar] [CrossRef]
- Aitkenhead, M.J.; Aalders, I.H. Predicting land cover using GIS, Bayesian and evolutionary algorithm methods. J. Environ. Manag. 2009, 90, 236–250. [Google Scholar] [CrossRef]
- Shamsi, S.R. Integrating Linear Programming and Analytical Hierarchical Processing in Raster-GIS to Optimize Land Use Pattern at Watershed Level. J. Appl. Sci. Environ. Manag. 2010, 14, 81–85. [Google Scholar] [CrossRef]
- Ralha, C.; Abreu, C.; Coelho, C.; Zaghetto, A.; Macchiavello, B.; Machado, R. A Multi-Agent Model System for Land-Use Change Simulation. Environ. Model. Softw. 2013, 42, 30–46. [Google Scholar] [CrossRef]
- Hyandye, C. GIS and Logit Regression Model Applications in Land Use/Land Cover Change and Distribution in Usangu Catchment. Am. J. Remote Sens. 2015, 3, 6–16. [Google Scholar] [CrossRef]
- Yang, X.; Zheng, X.-Q.; Lv, L.-N. A spatiotemporal model of land use change based on ant colony optimization, Markov chain and cellular automata. Ecol. Model. 2012, 233, 11–19. [Google Scholar] [CrossRef]
- Singh, S.K.; Mustak, S.; Srivastava, P.K.; Szabó, S.; Islam, T. Predicting Spatial and Decadal LULC Changes Through Cellular Automata Markov Chain Models Using Earth Observation Datasets and Geo-information. Environ. Process. 2015, 2, 61–78. [Google Scholar] [CrossRef]
- Subedi, P.; Subedi, K.; Thapa, B. Application of a Hybrid Cellular Automaton—Markov (CA-Markov) Model in Land-Use Change Prediction: A Case Study of Saddle Creek Drainage Basin, Florida. Appl. Ecol. Environ. Sci. 2013, 1, 126–132. [Google Scholar] [CrossRef]
- Yang, X. Satellite Monitoring of Urban Spatial Growth in the Atlanta Metropolitan Area. Photogramm. Eng. Remote Sens. 2002, 68, 725–734. [Google Scholar]
- Guan, D.; Li, H.; Inohae, T.; Su, W.; Nagaie, T.; Hokao, K. Modeling urban land use change by the integration of cellular automaton and Markov model. Ecol. Model. 2011, 222, 3761–3772. [Google Scholar] [CrossRef]
- Al-sharif, A.A.A.; Pradhan, B. Monitoring and predicting land use change in Tripoli Metropolitan City using an integrated Markov chain and cellular automata models in GIS. Arab. J. Geosci. 2014, 7, 4291–4301. [Google Scholar] [CrossRef]
- Islam, K.; Rahman, M.F.; Jashimuddin, M. Modeling land use change using Cellular Automata and Artificial Neural Network: The case of Chunati Wildlife Sanctuary, Bangladesh. Ecol. Indic. 2018, 88, 439–453. [Google Scholar] [CrossRef]
- Sohl, T.; Claggett, P. Clarity versus complexity: Land-use modeling as a practical tool for decision-makers. J. Environ. Manag. 2013, 129, 235–243. [Google Scholar] [CrossRef] [PubMed]
- Zhao, L.; Peng, Z.-R. LandSys: An agent-based Cellular Automata model of land use change developed for transportation analysis. J. Transp. Geogr. 2012, 25, 35–49. [Google Scholar] [CrossRef]
- Clarke, K.C. Cellular Automata and Agent-Based Models. In Handbook of Regional Science; Fischer, M., Nijkamp, P., Eds.; Springer: Berlin/Heidelberg, Germany, 2018. [Google Scholar]
- Myint, S.W.; Wang, L. Multicriteria decision approach for land use land cover change using Markov chain analysis and a cellular automata approach. Can. J. Remote Sens. 2006, 32, 390–404. [Google Scholar] [CrossRef]
- Stevens, D.; Dragicevic, S.A. GIS-Based Irregular Cellular Automata Model of Land-Use Change. Environ. Plan. B Plan. Des. 2007, 34, 708–724. [Google Scholar] [CrossRef]
- Ahmad, F.; Goparaju, L.; Qayum, A. LULC analysis of urban spaces using Markov chain predictive model at Ranchi in India. Spat. Inf. Res. 2017, 25, 351–359. [Google Scholar] [CrossRef]
- Zheng, H.W.; Shen, G.Q.; Wang, H.; Hong, J. Simulating land-use change in urban renewal areas: A case study in Hong Kong. Habitat Int. 2015, 46, 23–34. [Google Scholar] [CrossRef]
- Bello, A.L. Kaduna State. In Nigeria: A People United, A Future Assured; Gabumo Press: Calabar, Nigeria, 2000; Volume 2. [Google Scholar]
- Shehu, A. Factors Influencing the Pattern of Residential Property Values in the Zaria Urban Area, Nigeria. Dutse J. Pure Appl. Sci. (Dujopas) 2018, 4, 169–177. [Google Scholar]
- National Population Commission. Federal Republic of Nigeria Official Gazette; Federal Government Printer: Abuja, Nigeria, 2009.
- Essien, E.; Samimi, C. Detection of Urban Development in Uyo (Nigeria) Using Remote Sensing. Land 2019, 8, 102. [Google Scholar] [CrossRef]
- Mahmoud, M.I.; Duker, A.; Conrad, C.; Thiel, M.; Ahmad, H.S. Analysis of Settlement Expansion and Urban Growth Modelling Using Geoinformation for Assessing Potential Impacts of Urbanization on Climate in Abuja City, Nigeria. Remote Sens. 2016, 8, 220. [Google Scholar] [CrossRef]
- Grace, U.M.; Sawa, B.A.; Jaiyeoba, I.A. Multi-temporal remote sensing of land-use dynamics in Zaria, Nigeria. J. Environ. Earth Sci. 2015, 5, 121–138. [Google Scholar]
- Abdulaziz, S.K. Urban Sprawl Pattern and Its Implications for Urban Management (Case Study: Zaria Urban Area, Nigeria). Int. J. Archit. Urban Dev. 2018, 8, 5–12. [Google Scholar]
- Norman, L.M.; Feller, M.; Phillip Guertin, D. Forecasting urban growth across the United States–Mexico border. Comput. Environ. Urban Syst. 2009, 33, 150–159. [Google Scholar] [CrossRef]
- Butler, R. Largest Cities in Nigeria. Available online: https://population.mongabay.com/population/nigeria/ (accessed on 16 July 2020).
- Thorp, M.B. Landforms. In Zaria and It’s Region: A Nigerian Savanna City and It’s Environs; Mortimore, M.J., Ed.; Dept. of Geography, Ahmadu Bello University: Zaria, Nigeria, 1970; pp. 13–32. [Google Scholar]
- Aminu, Z.; Jaiyeoba, I.A. An Assessment of Soil Degradation in Zaria Area, Kaduna State, Nigeria. Ife Res. Publ. Geogr. 2015, 13, 26–36. [Google Scholar]
- Ogunjobi, K.O.; Adamu, Y.; Akinsanola, A.A.; Orimoloye, I.R. Spatio-temporal analysis of land use dynamics and its potential indications on land surface temperature in Sokoto Metropolis, Nigeria. R. Soc. Open Sci. 2018, 5, 180661. [Google Scholar] [CrossRef] [PubMed]
- Mishra, S.; Shrivastava, P.; Dhurvey, P. Change Detection Techniques in Remote Sensing: A Review. Int. J. Wirel. Mob. Commun. Ind. Syst. 2017, 4, 1–8. [Google Scholar] [CrossRef]
- Srivastava, P.K.; Han, D.; Rico-Ramirez, M.A.; Bray, M.; Islam, T. Selection of classification techniques for land use/land cover change investigation. Adv. Space Res. 2012, 50, 1250–1265. [Google Scholar] [CrossRef]
- Kalra, K.; Goswami, A.K.; Gupta, R. A Comparative Study of Supervised Image Classification Algorithms for Satellite Images. Int. J. Electr. Electron. Data Commun. 2013, 1, 10–16. [Google Scholar]
- Weng, Q. Land use change analysis in the Zhujiang Delta of China using satellite remote sensing, GIS and stochastic modelling. J. Environ. Manag. 2002, 64, 273–284. [Google Scholar] [CrossRef]
- Jensen, J.R.; Cowen, D.C. Remote sensing of urban/suburban infrastructure and socio-economic attributes. Photogramm. Eng. Remote Sens. 1999, 65, 611–622. [Google Scholar]
- Huang, S.-L.; Wang, S.-H.; Budd, W.W. Sprawl in Taipei’s peri-urban zone: Responses to spatial planning and implications for adapting global environmental change. Landsc. Urban Plan. 2009, 90, 20–32. [Google Scholar] [CrossRef]
- Yulianto, F.; Prasasti, I.; Pasaribu, J.M.; Fitriana, H.L.; Haryani, N.S.; Sofan, P. The dynamics of land use/land cover change modeling and their implication for the flood damage assessment in the Tondano watershed, North Sulawesi, Indonesia. Model. Earth Syst. Environ. 2016, 2, 47. [Google Scholar] [CrossRef]
- Shivakumar, B.R.; Rajashekararadhya, S.V. Investigation on Land Cover Mapping Capability of Maximum Likelihood Classifier: A Case Study on North Canara, India. Procedia Comput. Sci. 2018, 143, 579–586. [Google Scholar] [CrossRef]
- Lu, D.; Weng, Q. A survey of image classification methods and techniques for improving classification performance. Int. J. Remote Sens. 2007, 28, 823–870. [Google Scholar] [CrossRef]
- Mohajane, M.; Essahlaoui, A.L.I.; Oudija, F.; El Hafyani, M.; El Hmaidi, A.; Ouali, A.; Randazzo, G.; Teodoro, A. Land Use/Land Cover (LULC) Using Landsat Data Series (MSS, TM, ETM+ and OLI) in Azrou Forest, in the Central Middle Atlas of Morocco. Environments 2018, 5, 131. [Google Scholar] [CrossRef]
- Koc, D.; Ikiel, C.; Atalay, A.; Ustaoglu, B. Land Use and Land Cover (LULC) Classification using Spot-5 Image in the Adapazari Plain and Its Surroundings, Turkey. Online J. Sci. Technol. 2012, 2, 37–42. [Google Scholar]
- Alrababah, M.; Alhamad, M. Land use/cover classification of east Mediterranean landscapes using Landsat ETM. Int. J. Remote Sens. 2006, 27, 2703–2718. [Google Scholar] [CrossRef]
- Foody, G.M. Status of land cover classification accuracy assessment. Remote Sens. Environ. 2002, 80, 185–201. [Google Scholar] [CrossRef]
- Manandhar, R.; Odeh, I.; Ancev, T. Improving the Accuracy of Land Use and Land Cover Classification of Landsat Data Using Post-Classification Enhancement. Remote Sens. 2009, 1, 330–344. [Google Scholar] [CrossRef]
- Congalton, R.G. A review of assessing the accuracy of classifications of remotely sensed data. Remote Sens. Environ. 1991, 37, 35–46. [Google Scholar] [CrossRef]
- Kohavi, R.; Provost, F. Guest Editors’ Introduction: On Applied Research in Machine Learning. Mach. Learn. 1998, 30, 127–132. [Google Scholar]
- Jensen, J.R. Introductory Digital Image Processing: A Remote Sensing Perspective, 3rd ed.; Pearson Prentice Hall: Upper Saddle River, NJ, USA, 2005. [Google Scholar]
- Smits, P.C.; Dellepiane, S.G.; Schowengerdt, R.A. Quality assessment of image classification algorithms for land-cover mapping: A review and a proposal for a cost-based approach. Int. J. Remote Sens. 1999, 20, 1461–1486. [Google Scholar] [CrossRef]
- Fung, T.; LeDrew, E. The determination of optimal threshold levels for change detection using various accuracy indices. Photogramm. Eng. Remote Sens. 1988, 54, 1449–1454. [Google Scholar]
- Campbell, J.B. Introduction to Remote Sensing, 4th ed.; The Guilford Press: New York, NY, USA, 2007. [Google Scholar]
- Fleiss, J.L.; Levin, B.; Paik, M.C. The Measurement of Interrater Agreement. In Statistical Methods for Rates and Proportions; Shewart, W.A., Wilks, S.S., Eds.; John Wiley and Sons Inc.: Hoboken, NJ, USA, 2003; pp. 598–626. [Google Scholar]
- Liu, C.; Frazier, P.; Kumar, L. Comparative assessment of the measures of thematic classification accuracy. Remote Sens. Environ. 2007, 107, 606–616. [Google Scholar] [CrossRef]
- Zanotta, D.C.; Zortea, M.; Ferreira, M.P. A supervised approach for simultaneous segmentation and classification of remote sensing images. ISPRS J. Photogramm. Remote Sens. 2018, 142, 162–173. [Google Scholar] [CrossRef]
- Hardin, P.J.; Jackson, M.W.; Otterstrom, S.M. Mapping, measuring, and modelling urban growth. In Geo-Spatial Technologies in Urban Environments: Policy, Practice, and Pixels; Jensen, R.R., Gatrell, J.G., McLean, D., Eds.; Springer: Berlin/Heidelberg, Germany, 2007; Volume 2, pp. 141–176. [Google Scholar]
- Wang, M.; Cai, L.; Xu, H.; Zhao, S. Predicting land use changes in northern China using logistic regression, cellular automata, and a Markov model. Arab. J. Geosci. 2019, 12, 790. [Google Scholar] [CrossRef]
- Gidey, E.; Dikinya, O.; Sebego, R.; Segosebe, E.; Zenebe, A. Cellular automata and Markov Chain (CA_Markov) model-based predictions of future land use and land cover scenarios (2015–2033) in Raya, northern Ethiopia. Model. Earth Syst. Environ. 2017, 3, 1245–1262. [Google Scholar] [CrossRef]
- Surabuddin Mondal, M.; Sharma, N.; Kappas, M.; Garg, P.K. Modeling of spatio-temporal dynamics of land use and land cover in a part of Brahmaputra River basin using Geoinformatic techniques. Geocarto Int. 2013, 28, 632–656. [Google Scholar] [CrossRef]
- Adhikari, S.; Southworth, J. Simulating forest cover changes of Bannerghatta National Park on a CA-Markov model. Remote Sens. 2012, 4, 3215–3243. [Google Scholar] [CrossRef]
- Coppedge, B.R.; Engle, D.M.; Fuhlendorf, S.D. Markov models of land cover dynamics in a southern Great Plains grassland region. Landsc. Ecol. 2007, 22, 1383–1393. [Google Scholar] [CrossRef]
- Halmy, M.W.A.; Gessler, P.E.; Hicke, J.A.; Salem, B.B. Land use/land cover change detection and prediction in the north-western coastal desert of Egypt using Markov-CA. Appl. Geogr. 2015, 63, 101–112. [Google Scholar] [CrossRef]
- Omar, N.Q.; Sanusi, S.A.M.; Hussin, W.M.W.; Samat, N.; Mohammed, K.S. Markov-CA model using analytical hierarchy process and multiregression technique. IOP Conf. Ser. Earth Environ. Sci. 2014, 20, 012008. [Google Scholar] [CrossRef]
- Ghosh, P.; Mukhopadhyay, A.; Chanda, A.; Mondal, P.; Akhand, A.; Mukherjee, S.; Nayak, S.K.; Ghosh, S.; Mitra, D.; Ghosh, T.; et al. Application of Cellular automata and Markov-chain model in geospatial environmental modeling—A review. Remote Sens. Appl. Soc. Environ. 2017, 5, 64–77. [Google Scholar] [CrossRef]
- Eastman, J.R. IDRISI Kilimanjaro: Guide to GIS and Image Processing; Clark Labs, Clark University: Worcester, MA, USA, 2003. [Google Scholar]
- Wang, S.Q.; Zheng, X.Q.; Zang, X.B. Accuracy assessments of land use change simulation based on Markov-cellular automata model. Procedia Environ. Sci. 2012, 13, 1238–1245. [Google Scholar] [CrossRef]
- Zomlot, Z.; Verbeiren, B.; Huysmans, M.; Batelaan, O. Trajectory analysis of land use and land cover maps to improve spatial–temporal patterns, and impact assessment on groundwater recharge. J. Hydrol. 2017, 554, 558–569. [Google Scholar] [CrossRef]
- Zhang, Q.; Ban, Y.; Liu, J.; Hu, Y. Simulation and analysis of urban growth scenarios for the Greater Shanghai Area, China. Comput. Environ. Urban Syst. 2011, 35, 126–139. [Google Scholar] [CrossRef]


| S/No. | Satellite Name | Acquisition | WRS Path/Row | Sensor Type | Cloud Cover (%) | LULC Name | UTM Zone | Spatial Resolution (Meters) | |
|---|---|---|---|---|---|---|---|---|---|
| Date | Time | ||||||||
| 1. | Landsat 4 | 1990/02/12 | 09:21:24 | 189/052 | TM | 1.8 | 1990 LULC | 32 N | 30 × 30 |
| 2. | Landsat 7 | 2005/02/05 | 09:38:40 | 189/052 | ETM+ | 18.0 | 2005 LULC | 32 N | 30 × 30 |
| 3. | Landsat 8 | 2020/01/22 | 09:49:15 | 189/052 | OLI | 0.0 | 2020 LULC | 32 N | 30 × 30 |
| S/No. | Land Use/Land Cover Types | Description |
|---|---|---|
| 1. | Built-up/urban areas | Areas that include residential, industrial, and commercial areas, mixed-use buildings, roads, and other transport facilities. |
| 2. | Vegetation | It comprises agricultural and vegetable areas, crop and fallow lands, forest areas, scrubs, conifers, and other plantation of different varieties. |
| 3. | Barren lands | Includes areas with exposed soils, un-vegetated lands, landfill sites, and active excavation lands. |
| 4. | Water bodies | Such areas cover the city’s permanent open water, rivers, streams, lakes, ponds, and various reservoirs. |
| S/No. | Land Use/Land Cover (LULC) Types | 1990 | 2005 | 2020 | |||
|---|---|---|---|---|---|---|---|
| Producer’s Accuracy | User’s Accuracy | Producer’s Accuracy | User’s Accuracy | Producer’s Accuracy | User’s Accuracy | ||
| 1. | Built-up area | 81.28 | 100.00 | 78.84 | 88.17 | 86.16 | 100.00 |
| 2. | Vegetation | 86.63 | 71.07 | 85.89 | 84.08 | 80.76 | 77.81 |
| 3. | Barren land | 86.50 | 86.77 | 95.40 | 86.64 | 96.02 | 86.13 |
| 4. | Water bodies | 81.69 | 91.98 | 69.41 | 90.77 | 94.44 | 100.00 |
| 5. | Overall accuracy | 84.39% | 86.48% | 88.50% | |||
| 6. | Overall kappa | 0.79 | 0.80 | 0.84 | |||
| Quantitative Distribution of LULC in 1990, 2005, and 2020 | |||||||
| 1990 | 2005 | 2020 | |||||
| S/No. | Land Use/Land Cover Types | Area (Hectares) | Area (%) | Area (Hectares) | Area (%) | Area (Hectares) | Area (%) |
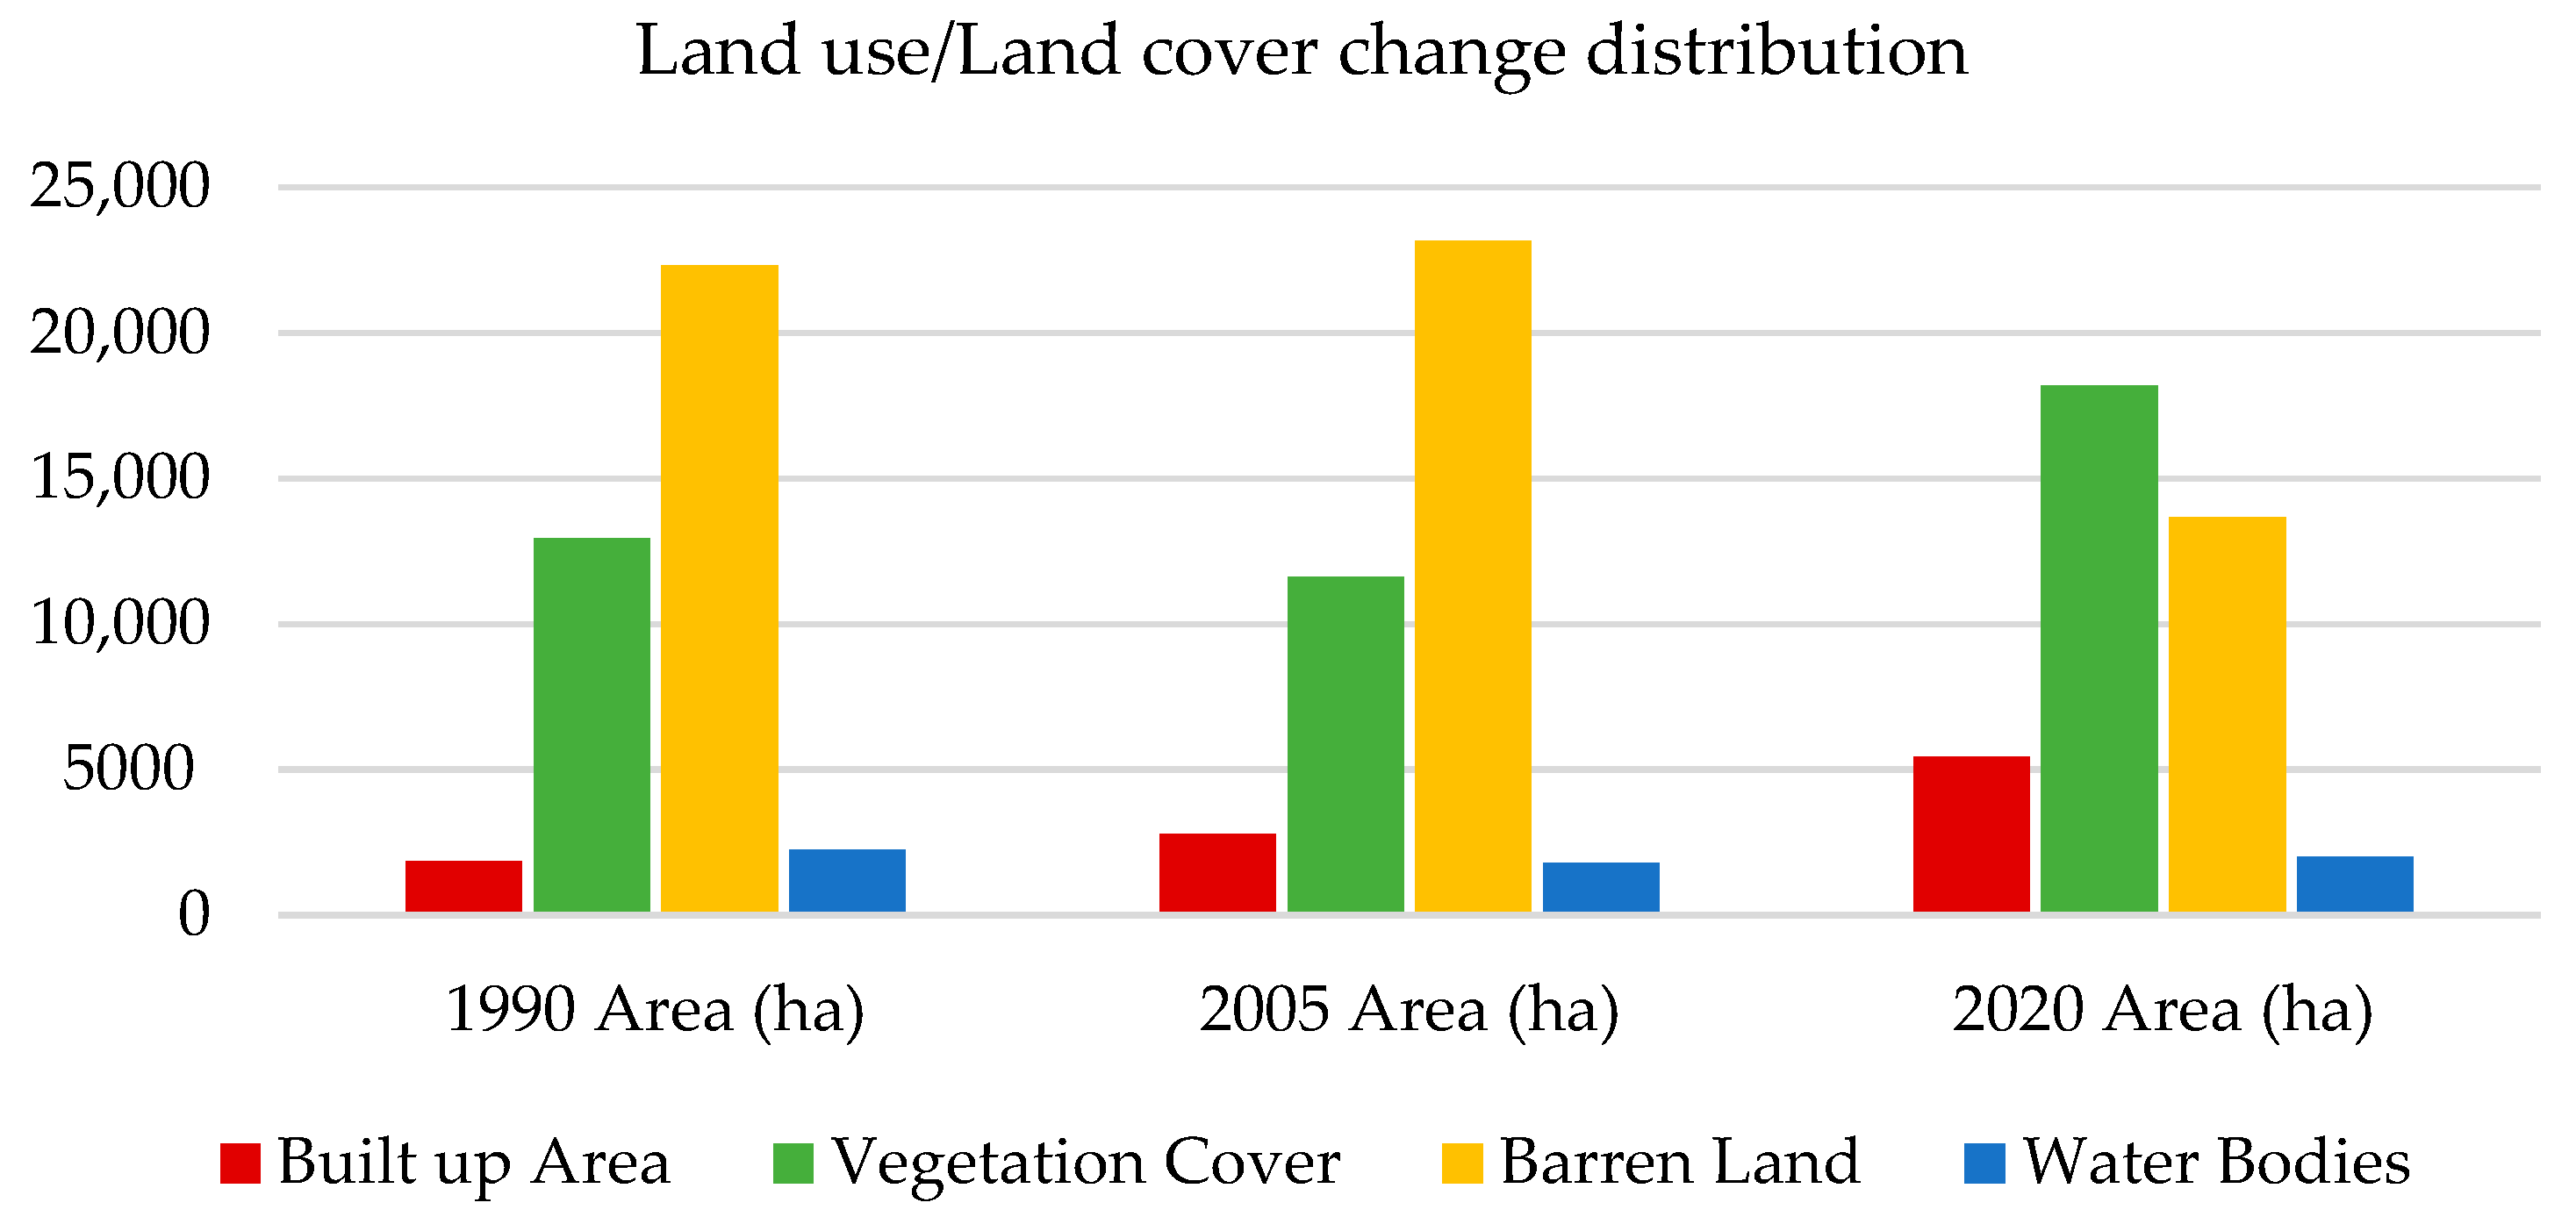
| 1. | Built up area | 1857.51 | 4.72 | 2784.24 | 7.08 | 5444.55 | 13.84 |
| 2. | Vegetation | 12,937.77 | 32.89 | 11,606.94 | 29.50 | 18,209.25 | 46.29 |
| 3. | Barren land | 22,298.13 | 56.68 | 23,152.77 | 58.85 | 13,674.87 | 34.76 |
| 4. | Water bodies | 2247.03 | 5.71 | 1796.49 | 4.57 | 2011.77 | 5.11 |
| 5. | Total | 39,340.44 | 100 | 39,340.44 | 100 | 39,340.44 | 100 |
| Dynamics of Land Use/Land Cover Change between 1990 and 2020 | |||||||
| S/No. | Land Use/Land Cover Types | LULC Change 1990–2005 | LULC Change 2005–2020 | LULC Change 1990–2020 | |||
| 1. | Built up area | 926.73 | 2.36 | 2660.31 | 6.76 | 3587.04 | 9.12 |
| 2. | Vegetation | −1330.83 | −3.39 | 6602.31 | 16.79 | 5271.48 | 13.4 |
| 3. | Barren land | 854.64 | 2.17 | −9477.9 | −24.09 | −8623.26 | −21.92 |
| 4. | Water bodies | −450.54 | −1.14 | 215.28 | 0.54 | −235.26 | −0.6 |
| S/N | Year/Period | 1990–2005/Period 1 | 2005–2020/Period 2 | 1990–2020/Period 3 | ||||||
|---|---|---|---|---|---|---|---|---|---|---|
| LULC Classes | Losses | Gains | Net Change | Losses | Gains | Net Change | Losses | Gains | Net Change | |
| 1. | Built-up area | −394.02 | 1320.75 | 926.73 | −822.87 | 3483.18 | 2660.31 | −254.34 | 3841.38 | 3587.04 |
| 2. | Vegetation | −5724.27 | 4393.44 | −1330.83 | −3087.27 | 9689.58 | 6602.31 | −4170.33 | 9441.81 | 5271.48 |
| 3. | Barren land | −4334.58 | 5189.22 | 854.64 | −11,417.76 | 1939.86 | −9477.90 | −11,616.75 | 2993.49 | −8623.26 |
| 4. | Water bodies | −1740.60 | 1290.06 | −450.54 | −1428.21 | 1643.49 | 215.18 | −1938.87 | 1703.61 | −235.26 |
| Year (Period) | LULC Classes | Built-Up Area | Vegetation | Barren Land | Water Bodies |
|---|---|---|---|---|---|
| 1990–2005 (Period 1) | Built-up area | 0.7879 | 0.0362 | 0.1304 | 0.0454 |
| Vegetation | 0.0344 | 0.5576 | 0.3245 | 0.0836 | |
| Barren land | 0.0313 | 0.1575 | 0.8056 | 0.0056 | |
| Water bodies | 0.0795 | 0.3618 | 0.3333 | 0.2254 | |
| 2005–2020 (Period 2) | Built-up area | 0.7045 | 0.2101 | 0.0516 | 0.0338 |
| Vegetation | 0.0408 | 0.7340 | 0.1487 | 0.0765 | |
| Barren land | 0.1210 | 0.3436 | 0.5069 | 0.0286 | |
| Water bodies | 0.1158 | 0.6402 | 0.0390 | 0.2050 |
| Year/Period | 2020 | 2035 | 2050 | LULC Change 2020–2035 | LULC Change 2020–2050 | |||||
|---|---|---|---|---|---|---|---|---|---|---|
| Land Use/Land Cover Classes | Area (Ha) | Area (%) | Area (Ha) | Area (%) | Area (Ha) | Area (%) | Area (Ha) | Area (%) | Area (Ha) | Area (%) |
| Built-up area | 5444.55 | 13.84 | 6466.05 | 16.44 | 6876.45 | 17.48 | 1021.5 | 2.6 | 1431.9 | 3.64 |
| Vegetation | 18,209.25 | 46.29 | 20,495.25 | 52.1 | 21,361.95 | 54.3 | 2286 | 5.81 | 3152.7 | 8.01 |
| Barren land | 13,674.87 | 34.76 | 9998.37 | 25.41 | 8542.17 | 21.71 | −3676.5 | 39.35 | −5132.7 | −13.05 |
| Water bodies | 2011.77 | 5.11 | 2380.77 | 6.05 | 2559.87 | 6.51 | 369 | 0.94 | 548.1 | 1.4 |
| Total | 39,340.44 | 100 | 39,340.44 | 100 | 39,340.44 | 100 | - | - | - | - |
Publisher’s Note: MDPI stays neutral with regard to jurisdictional claims in published maps and institutional affiliations. |
© 2020 by the authors. Licensee MDPI, Basel, Switzerland. This article is an open access article distributed under the terms and conditions of the Creative Commons Attribution (CC BY) license (http://creativecommons.org/licenses/by/4.0/).
Share and Cite
Koko, A.F.; Yue, W.; Abubakar, G.A.; Hamed, R.; Alabsi, A.A.N. Monitoring and Predicting Spatio-Temporal Land Use/Land Cover Changes in Zaria City, Nigeria, through an Integrated Cellular Automata and Markov Chain Model (CA-Markov). Sustainability 2020, 12, 10452. https://doi.org/10.3390/su122410452
Koko AF, Yue W, Abubakar GA, Hamed R, Alabsi AAN. Monitoring and Predicting Spatio-Temporal Land Use/Land Cover Changes in Zaria City, Nigeria, through an Integrated Cellular Automata and Markov Chain Model (CA-Markov). Sustainability. 2020; 12(24):10452. https://doi.org/10.3390/su122410452
Chicago/Turabian StyleKoko, Auwalu Faisal, Wu Yue, Ghali Abdullahi Abubakar, Roknisadeh Hamed, and Akram Ahmed Noman Alabsi. 2020. "Monitoring and Predicting Spatio-Temporal Land Use/Land Cover Changes in Zaria City, Nigeria, through an Integrated Cellular Automata and Markov Chain Model (CA-Markov)" Sustainability 12, no. 24: 10452. https://doi.org/10.3390/su122410452
APA StyleKoko, A. F., Yue, W., Abubakar, G. A., Hamed, R., & Alabsi, A. A. N. (2020). Monitoring and Predicting Spatio-Temporal Land Use/Land Cover Changes in Zaria City, Nigeria, through an Integrated Cellular Automata and Markov Chain Model (CA-Markov). Sustainability, 12(24), 10452. https://doi.org/10.3390/su122410452