Optimising Nutrient Cycles to Improve Food Security in Smallholder Farming Families—A Case Study from Banana-Coffee-Based Farming in the Kagera Region, NW Tanzania

 ,
,  ,
, 

Abstract
1. Introduction
2. Materials and Methods
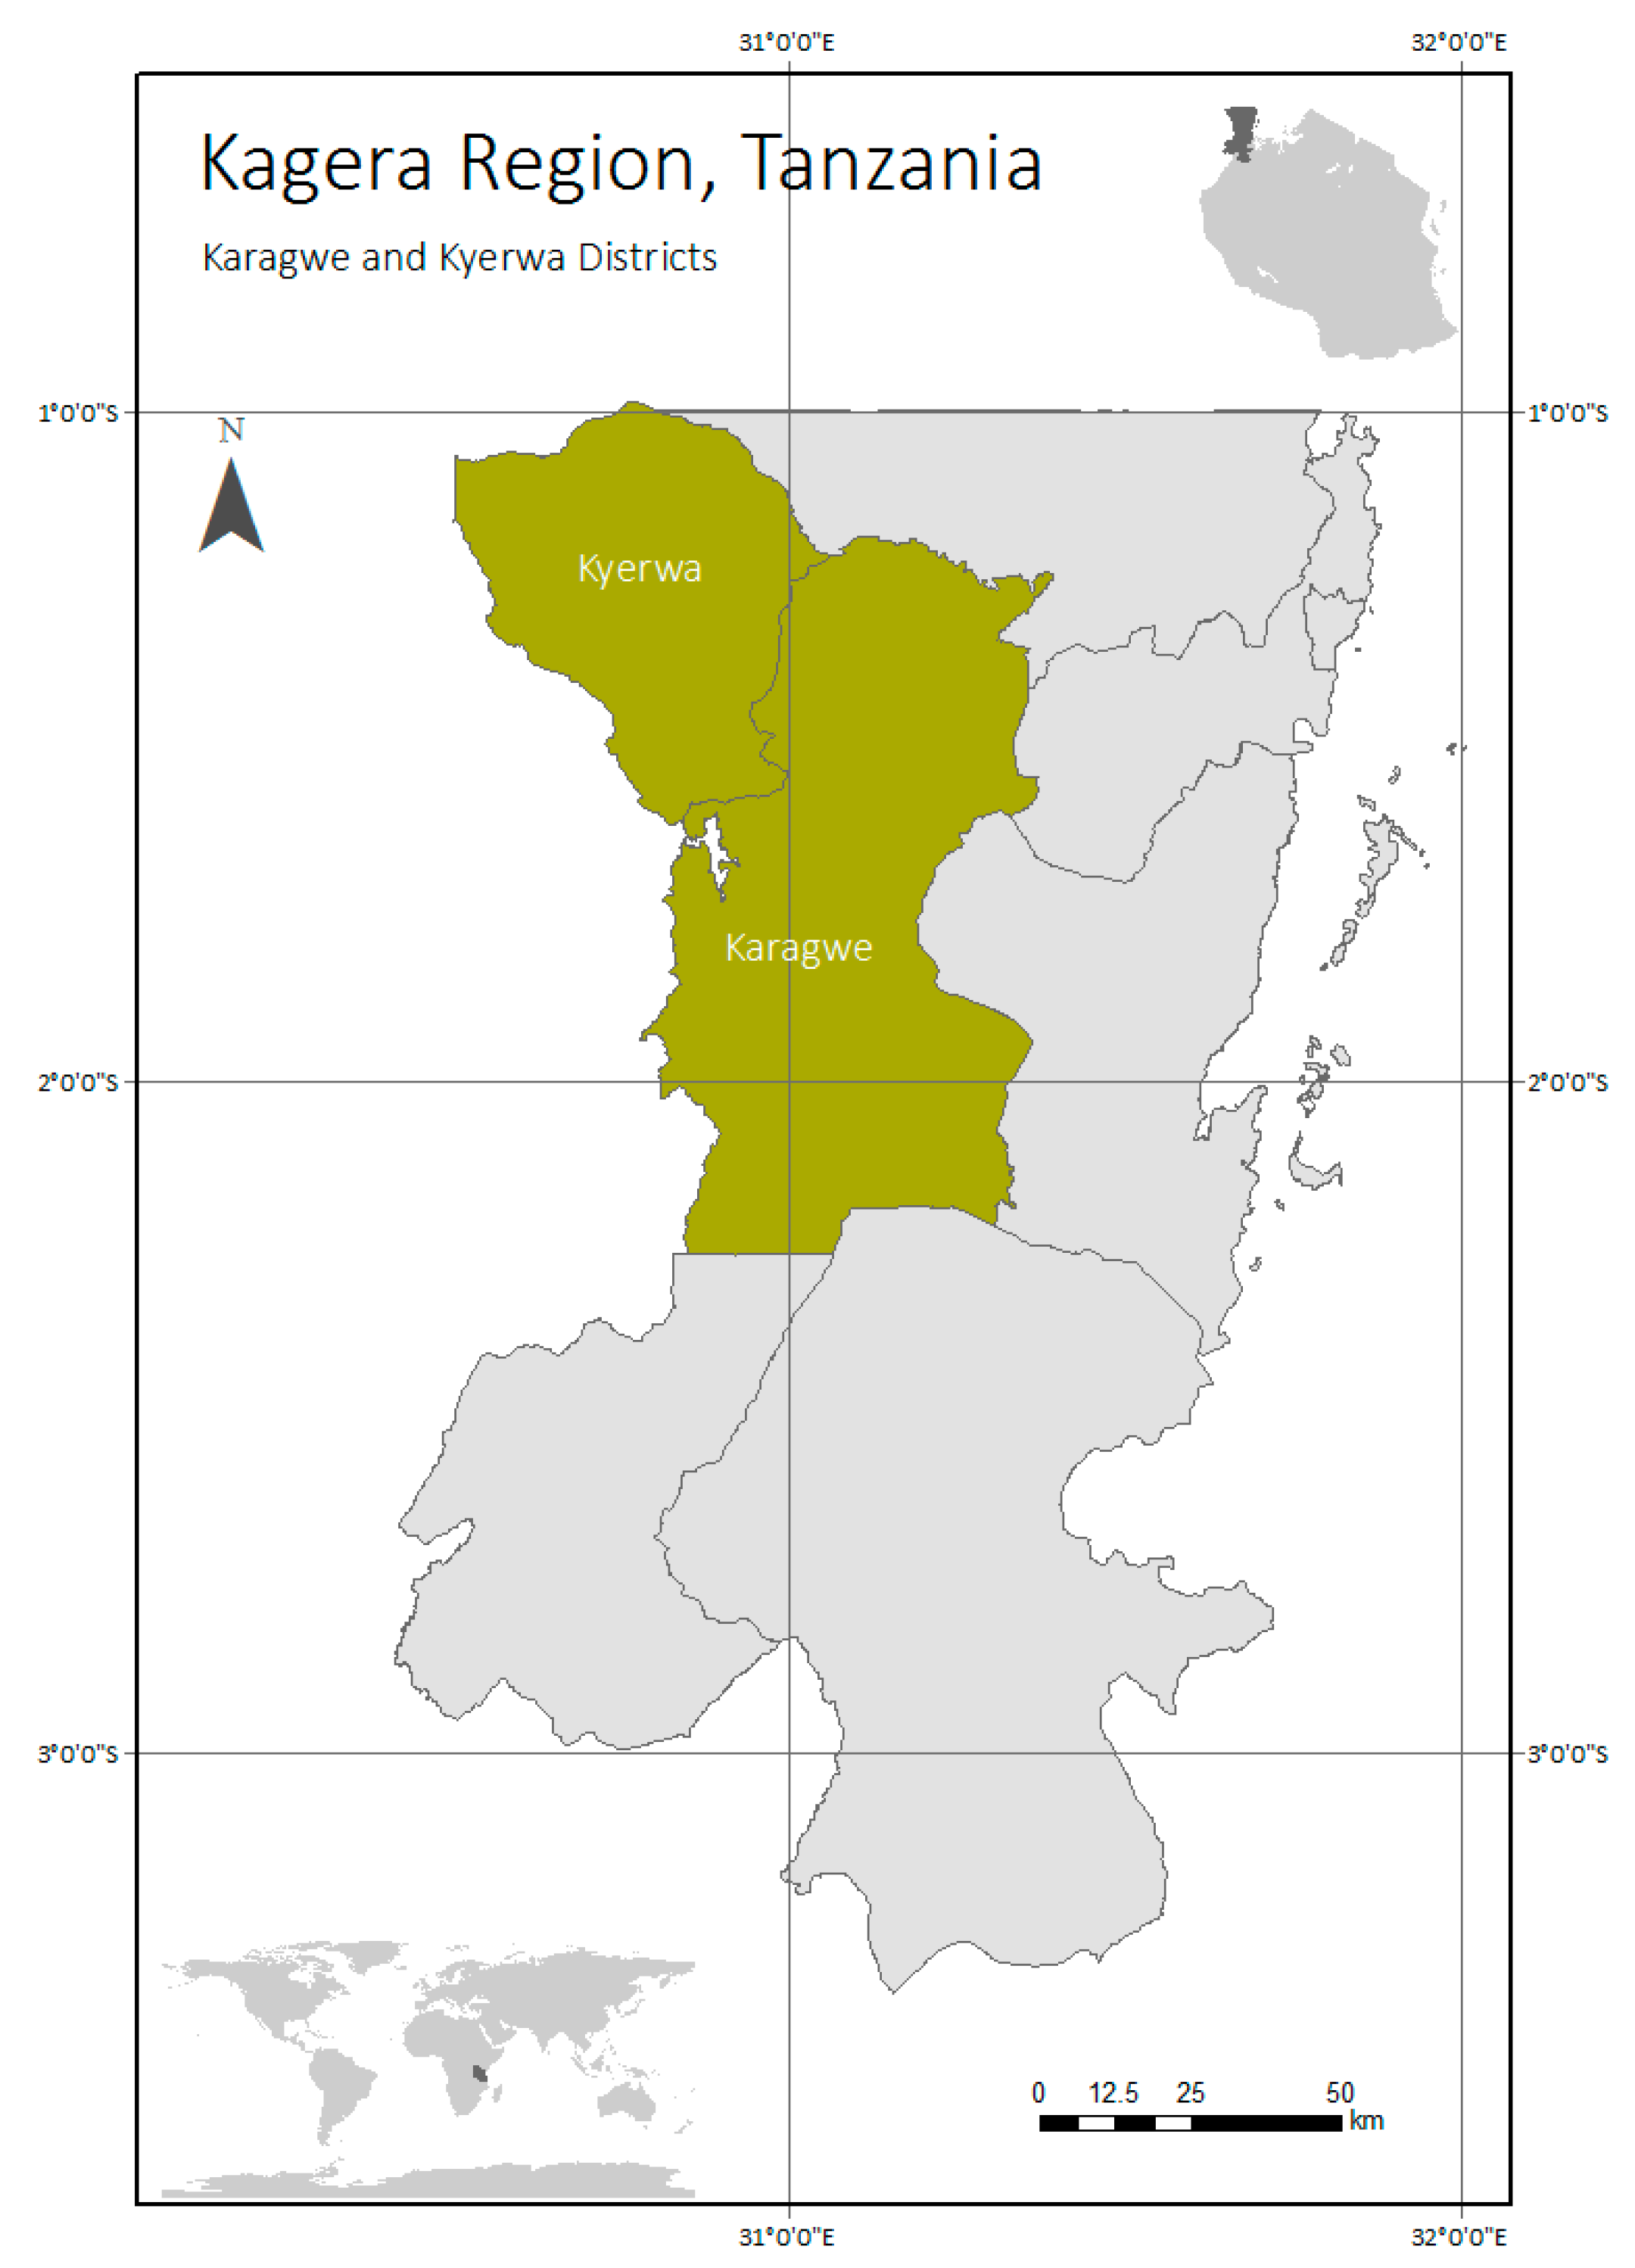
2.1. Study Area
2.2. Data
Background Information on the Data
2.3. Analysis
| INPUT | OUTPUT | STOCK |
| Atmospheric deposition (IN1) | Harvested crops (OUT1) | Human body (STOCK1) |
| Inputs by plants and trees (IN2) | ● Perennial crops (OUT1a) | Animal body (STOCK2) |
| ● Litterfall (IN2a) | ● Annual crops (OUT1b) | Pit latrine (STOCK3) |
| ● Deep capture (IN2b) | Fodder (OUT2) | Soil (STOCK4) |
| ● Biological fixation (IN2c) | Wood (OUT3) | |
| Organic fertiliser (IN3) | Market (OUT4) | |
| ● Crop residues (IN3a) | Sold crop residues (OUT5) | |
| ● Kitchen and food waste (IN3b) | Leaching from soil (OUT6) | |
| ● Cooking ash (IN3c) | Leaching from pit latrines (OUT7) | |
| ● Livestock manure and urine (IN3d) | River discharge (OUT8) | |
| ● Human excreta (IN3e) | Gaseous losses (OUT9) |
2.3.1. Variables
Deposition (IN1)
Above-Ground and Below-Ground Inputs by Plants and Trees (IN2)
Litterfall (IN2a) and Deep Capture (IN2b)
Biological Fixation (IN2c)
Organic Fertiliser (IN3)
Crop Residues (IN3a)
Kitchen and Food Waste (IN3b)
Cooking Ash (IN4c)
Livestock Manure and Urine (IN3d)
Human Excreta (IN3e)
Harvested Crops (OUT1)
Fodder (OUT2)
Wood (OUT3)
Market (OUT4)
Sold Crop Residues (OUT5)
Leaching (OUT6)
Leaching from Pit Latrines (OUT7)
River Discharge (OUT8)
Gaseous Losses (OUT9)
Human Body (STOCK1)
Animal Body (STOCK2)
Pit Latrine (STOCK3)
Soil (STOCK4)
Vegetation Density
2.3.2. Scenarios
- S1.
- Human Urine,
- S2.
- Legumes,
- S3.
- CaSa-compost, and
- S4.
- Combination of S1, S2, and S3.
3. Results
4. Discussion
4.1. Methodology
4.2. Results
5. Conclusions and Recommendations
Author Contributions
Funding
Acknowledgments
Conflicts of Interest
Appendix A

| Flow | Variable | Nutr. | Value | Unit | Source |
|---|---|---|---|---|---|
| IN1a | Atmospheric deposition in smallholder mixed farming in Africa | ||||
| N | 1.8 | kg ha−1 yr−1 | [48] | ||
| N | 4.3 | kg ha−1 yr−1 | [49] | ||
| N | 4.7 | kg ha−1 yr−1 | [68] | ||
| P | 0.2 | kg ha−1 yr−1 | [48] | ||
| P | 1.0 | kg ha−1 yr−1 | [49] | ||
| P | 0.8 | kg ha−1 yr−1 | [68] | ||
| K | 3.4 | kg ha−1 yr−1 | [48] | ||
| K | 3.9 | kg ha−1 yr−1 | [49] | ||
| K | 3.1 | kg ha−1 yr−1 | [68] | ||
| In montane tropical mixed forest, Congo | TDN | 21.2 | kg ha−1 yr−1 | [44] | |
| IN1b | Throughfall in montane tropical mixed forest | TDN | 42.1 ± 0.8 | kg ha−1 yr−1 | [44] |
| IN2a | Litterfall and deep capture | ||||
| In smallholder agroforestry with plantain and cacao | N | 66.4 | kg ha−1 yr−1 | [49] | |
| In smallholder agroforestry with plantain and cacao | P | 5.15 | kg ha−1 yr−1 | [49] | |
| In smallholder agroforestry with plantain and cacao | K | 26.2 | kg ha−1 yr−1 | [49] | |
| In montane tropical mixed forest | N | 250 ± 20 | kg ha−1 yr−1 | [44] | |
| IN2b | Deep capture from below the root zone | N | 16.6 | kg ha−1 yr−1 | [49] |
| Deep capture from below the root zone | P | 1.38 | kg ha−1 yr−1 | [49] | |
| Deep capture from below the root zone | K | 6.55 | kg ha−1 yr−1 | [49] | |
| IN2c | Biological fixation | ||||
| Beans (Phaseolus vulgaris) | N | 19.0 | kg ha−1 yr−1 | [48] | |
| Beans (Phaseolus vulgaris) | N | 17–57 | kg ha−1 yr−1 | [88] | |
| Beans (Phaseolus vulgaris) | N | 8–58 | kg ha−1 yr−1 | [51] | |
| Groundnut (Arachis hypogeae) | N | 6.93 | kg ha−1 yr−1 | [49] | |
| Permanent crops, cereals and oil crops | N | 4.0 | kg ha−1 yr−1 | [68] | |
| Pulses | N | 18.0 | kg ha−1 yr−1 | [68] | |
| Vegetables | N | 8.0 | kg ha−1 yr−1 | [68] | |
| IN4a | Crop residues of perennial crops after harvest | ||||
| Banana leaves (Musa AAA, Cavendish, cv. Robusta) | N | 1.3 | g plant−1 | [89] | |
| Banana leaves (Musa AAA, Cavendish, cv. Robusta) | P | 0.2 | g plant−1 | [89] | |
| Banana leaves (Musa AAA, Cavendish, cv. Robusta) | K | 2.8 | g plant−1 | [89] | |
| Banana leaves (Musa spp.) | N | 2.0–2.5 | % | [89] | |
| Banana leaves (Musa spp.) | N | 4.4 | % DM | [55] | |
| Banana leaves (Musa spp.) | P | 0.15 | % DM | [55] | |
| Banana leaves (Musa spp.) | K | 1.0 | % DM | [55] | |
| Banana leaves (Musa spp.) | N | 2.75 | % DM | [23] | |
| Banana leaves (Musa spp.) | P | 0.1 | % DM | [23] | |
| Banana leaves (Musa spp.) | K | 4.85 | % DM | [23] | |
| Banana leaves (Musa spp.) | N | 25 | kg ha−1 yr−1 | [23] | |
| Banana leaves (Musa spp.) | K | 43 | kg ha−1 yr−1 | [23] | |
| Banana leaves and stem (Musa spp.) | P | 2.6 | g kg−1 DM | [80] | |
| Plantain trunk (Musa spp.) | P | 0.9 | % DM | [80] | |
| Plantain trunk (Musa spp.) | K | 40.8 | % DM | [80] | |
| Banana pseudostems (Musa spp.) | N | 3.0 | kg ha−1 yr−1 | [23] | |
| Banana pseudostems (Musa spp.) | K | 26 | kg ha−1 yr−1 | [23] | |
| Banana pst. (Musa AAA, Cavendish, cv. Robusta) | N | 0.7 | g plant−1 | [89] | |
| Banana pst. (Musa AAA, Cavendish, cv. Robusta) | P | 0.07 | g plant−1 | [89] | |
| Banana pst. (Musa AAA, Cavendish, cv. Robusta) | K | 4.2 | g plant−1 | [89] | |
| Banana pseudostems (Musa spp.) | N | 1.01 | % DM | [23] | |
| Banana pseudostems (Musa spp.) | P | 0.07 | % DM | [23] | |
| Banana pseudostems (Musa spp.) | K | 7.70 | % DM | [23] | |
| Banana rhizome (Musa AAA, Cavendish cv. Rob.) | N | 0.8 | g plant−1 | [89] | |
| Banana rhizome (Musa AAA, Cavendish cv. Rob.) | P | 0.07 | g plant−1 | [89] | |
| Banana rhizome (Musa AAA, Cavendish cv. Rob.) | K | 3.6 | g plant−1 | [89] | |
| Coffee (Coffea arabica L.), leaves | P | 1.2 | g kg DM−1 | [80] | |
| Coffee (Coffea arabica L.), leaves | K | 4.6 | g kg DM−1 | [80] | |
| Coffee (Coffea arabica L.), hulls | N | 2.01 | % | [48] | |
| Coffee (Coffea arabica L.), hulls | P | 0.20 | % | [48] | |
| Coffee (Coffea arabica L.), hulls | K | 2.77 | % | [48] | |
| Coffee (Coffea arabica L.), hulls | P | 1.4 | g kg DM−1 | [80] | |
| Coffee (Coffea arabica L.), hulls | K | 22.6 | g kg DM−1 | [80] | |
| Mango (Mangifera indica L.), peels, dried | P | 2.8 | g kg DM−1 | [80] | |
| Mango (Mangifera indica L.), kernels, dried | P | 2.8 | g kg DM−1 | [80] | |
| Mango (Mangifera indica L.), kernels, dried | K | 0.6 | g kg DM−1 | [80] | |
| IN4b | Crop residues of annual crops | ||||
| Beans (Phaseolus vulgaris) | N | 4.24 | % DM | [48] | |
| Beans (Phaseolus vulgaris) | P | 0.58 | % DM | [48] | |
| Beans (Phaseolus vulgaris) | K | 1.71 | % DM | [48] | |
| Bean trash (Phaseolus vulgaris) | N | 2.53 | % DM | [23] | |
| Bean trash (Phaseolus vulgaris) | P | 0.16 | % DM | [23] | |
| Bean trash (Phaseolus vulgaris) | K | 1.85 | % DM | [23] | |
| Beans (Phaseolus vulgaris) | N | 29 | kg ha−1 yr−1 | [23] | |
| Beans (Phaseolus vulgaris) | K | 21 | kg ha−1 yr−1 | [23] | |
| Maize leaves, fresh (Zea mays L.) | P | 1.5 | g kg DM−1 | [80] | |
| Maize leaves, fresh (Zea mays L.) | K | 16.6 | g kg DM−1 | [80] | |
| Maize stover, fresh (Zea mays L.) | P | 1.6 | g kg DM−1 | [80] | |
| Maize stover, fresh (Zea mays L.) | K | 16.8 | g kg DM−1 | [80] | |
| Maize stover, dry (Zea mays L.) | N | 0.58 | % DM | [23] | |
| Maize stover, dry (Zea mays L.) | P | 0.03 | % DM | [23] | |
| Maize stover, dry (Zea mays L.) | K | 2.67 | % DM | [23] | |
| Maize stover, dry (Zea mays L.) | N | 12 | kg ha−1 yr−1 | [23] | |
| Maize stover, dry (Zea mays L.) | K | 57 | kg ha−1 yr−1 | [23] | |
| Maize stover, dry (Zea mays L.) | P | 0.8 | g kg DM−1 | [59] | |
| Maize stover, dry (Zea mays L.) | K | 14.0 | g kg DM−1 | [80] | |
| Cassava foliage, fresh (Manihot esculenta C.) | P | 3.7 | g kg DM−1 | [80] | |
| Cassava foliage, fresh (Manihot esculenta C.) | K | 12.5 | g kg DM−1 | [80] | |
| Cassava foliage, wilted (Manihot esculenta C.) | P | 3.0 | g kg DM−1 | [80] | |
| IN4b | Kitchen and food waste | ||||
| Banana peel (Musa, AAA-EAH) | N | 1.14 | % DM | [48] | |
| Banana peel (Musa, AAA-EAH) | P | 0.12 | % DM | [48] | |
| Banana peel (Musa, AAA-EAH) | K | 4.99 | % DM | [48] | |
| Banana peel (Musa spp.) | N | 1.16 | % DM | [23] | |
| Banana peel (Musa spp.) | P | 0.64 | % DM | [23] | |
| Banana peel (Musa spp.) | K | 4.63 | % DM | [23] | |
| Banana stalk (Musa, AAA-EAH) | N | 0.92 | % DM | [48] | |
| Banana stalk (Musa, AAA-EAH) | P | 0.17 | % DM | [48] | |
| Banana stalk (Musa, AAA-EAH) | K | 8.33 | % DM | [48] | |
| Banana stalk (Musa spp.) | P | 2.9 | g kg−1 DM−1 | [80] | |
| Banana stalk (Musa spp.) | K | 53.5 | g kg−1 DM−1 | [80] | |
| Cassava, peels, fresh (Manihot esculenta C.) | P | 2.1 | g kg DM−1 | [80] | |
| Cassava, peels, fresh (Manihot esculenta C.) | K | 6.4 | g kg DM−1 | [80] | |
| Cassava, peels, dry (Manihot esculenta C.) | P | 0.8 | g kg DM−1 | [80] | |
| Cassava, peels, dry (Manihot esculenta C.) | K | 7.1 | g kg DM−1 | [80] | |
| Maize cobs, without grain (Zea mays L.) | P | 0.7 | g kg DM−1 | [80] | |
| Maize cobs, without grain (Zea mays L.) | K | 4.8 | g kg DM−1 | [80] | |
| IN4c | Livestock manure | ||||
| Indigenous cattle, manure | N | 14.9 | g kg−1 | [48] | |
| Indigenous cattle, manure | P | 3.45 | g kg−1 | [48] | |
| Indigenous cattle, manure | K | 12.39 | g kg−1 | [48] | |
| Indigenous cattle, manure | N | 1.49 | % | [48] | |
| Indigenous cattle, manure | P | 0.35 | % | [48] | |
| Indigenous cattle, manure | K | 1.24 | % | [48] | |
| Improved cattle, manure | N | 16.69 | g kg−1 | [48] | |
| Improved cattle, manure | P | 5.07 | g kg−1 | [48] | |
| Improved cattle, manure | K | 26.35 | g kg−1 | [48] | |
| Improved cattle, manure | N | 1.67 | % | [48] | |
| Improved cattle, manure | P | 0.51 | % | [48] | |
| Improved cattle, manure | K | 2.64 | % | [48] | |
| Cattle manure | N | 1.2 | % | [58] | |
| Cattle manure | P | 0.3 | % | [58] | |
| Cattle manure | K | 2.1 | % | [58] | |
| Goat and sheep manure | N | 1.5 | % | [58] | |
| Goat and sheep manure | P | 0.2 | % | [58] | |
| Goat and sheep manure | K | 3.0 | % | [58] | |
| Goat manure | N | 3.8 | g kg−1 | [49] | |
| Goat manure | P | 0.67 | g kg−1 | [49] | |
| Goat manure | K | 0.50 | g kg−1 | [49] | |
| Sheep manure | N | 3.2 | g kg−1 | [49] | |
| Sheep manure | P | 0.32 | g kg−1 | [49] | |
| Sheep manure | K | 0.40 | g kg−1 | [49] | |
| Pig manure | N | 2.5 | g kg−1 | [49] | |
| Pig manure | P | 0.48 | g kg−1 | [49] | |
| Pig manure | K | 0.65 | g kg−1 | [49] | |
| Chicken manure | N | 3.2 | % | [58] | |
| Chicken manure | P | 0.4 | % | [58] | |
| Chicken manure | K | 2.2 | % | [58] | |
| Chicken manure | N | 2.2 | g kg−1 | [49] | |
| Chicken manure | P | 0.37 | g kg−1 | [49] | |
| Chicken manure | K | 0.65 | g kg−1 | [49] | |
| Bedding | N | 6.14 | g kg−1 | [48] | |
| Bedding | P | 0.89 | g kg−1 | [48] | |
| Bedding | K | 7.03 | g kg−1 | [48] | |
| Bedding | N | 0.61 | % | [48] | |
| Bedding | P | 09 | % | [48] | |
| Bedding | K | 0.70 | % | [48] | |
| OUT1a | Harvest of perennial crops | ||||
| Banana pulp (Musa, AAA-EAH) | N | 0.71 | % DW | [48] | |
| Banana pulp (Musa, AAA-EAH) | P | 0.11 | % DW | [48] | |
| Banana pulp (Musa, AAA-EAH) | K | 0.49 | % DW | [48] | |
| Coffee beans (Coffea robusta) | N | 2.28 | % FW | [48] | |
| Coffee beans (Coffea robusta) | P | 0.23 | % FW | [48] | |
| Coffee beans (Coffea robusta) | K | 2.26 | % FW | [48] | |
| Coffee (Coffea arabica L.), pulp, without seeds | P | 1.3 | g kg DM−1 | [80] | |
| Mango (Mangifera indica L.) fruits, fresh | P | 1.0 | g kg DM−1 | [80] | |
| Mango (Mangifera indica L.) fruits, fresh | K | 7.7 | g kg DM−1 | [80] | |
| Mango (Mangifera indica L.), pulp, fresh | P | 1.1 | g kg DM−1 | [80] | |
| Mango (Mangifera indica L.), pulp, fresh | K | 13.3 | g kg DM−1 | [80] | |
| OUT1b | Harvest of annual crops | ||||
| Beans (Phaseolus vulgaris) | N | 4.24 | % DW | [48] | |
| Beans (Phaseolus vulgaris) | P | 0.58 | % DW | [48] | |
| Beans (Phaseolus vulgaris) | K | 1.71 | % DW | [48] | |
| Maize grain (Zea mays L.) | N | 3.0 | g kg DM−1 | ||
| Maize grain (Zea mays L.) | P | 2.9 | g kg DM−1 | [80] | |
| Maize grain (Zea mays L.) | K | 3.6 | g kg DM−1 | [80] | |
| Cassava tubers, fresh (Manihot esculenta C.) | P | 1.2 | g kg DM−1 | [80] | |
| Cassava tubers, fresh (Manihot esculenta C.) | K | 7.7 | g kg DM−1 | [80] | |
| Cassava tubers, fresh, peeled (Manihot esculenta C.) | P | 0.4 | g kg DM−1 | [80] | |
| Cassava tubers, dehydrated (Manihot esculenta C.) | P | 1.1 | g kg DM- | [80] | |
| Cassava tubers, dehydrated (Manihot esculenta C.) | K | 9.9 | g kg DM−1 | [80] | |
| Tubers (cassava) | N | 0.56 | % FW | [48] | |
| Tubers (cassava) | P | 0.18 | % FW | [48] | |
| Tubers (cassava) | K | 1.22 | % FW | [48] | |
| OUT6 | Leaching | ||||
| Leaching below the root zone | N | 6.0 | kg ha−1 yr−1 | [48] | |
| Leaching below the root zone | P | 0 | kg ha−1 yr−1 | [48] | |
| Leaching below the root zone | K | 11.0 | kg ha−1 yr−1 | [48] | |
| Leaching below the root zone | N | 26.4 | kg ha−1 yr−1 | [49] | |
| Leaching below the root zone | K | 0.88 | kg ha−1 yr−1 | [49] | |
| Leaching at 20 cm depth | TDN | 27.7 ± 17.7 | kg ha−1 yr−1 | [44] | |
| Leaching at 40 cm depth | TDN | 17.3 ± 16.6 | kg ha−1 yr−1 | [44] | |
| Leaching at 80 cm depth | TDN | 15.5 ± 9.7 | kg ha−1 yr−1 | [44] | |
| OUT9 | Gaseous loss | ||||
| Emission from soil | N | 6.34 | kg ha−1 yr−1 | [49] | |
| Emission from soil | N2O | 3.45 | kg ha−1 yr−1 | [44] | |
| Emission from burning natural vegetation | N | 47.8 | kg ha−1 yr−1 | [49] | |
| Emission from burning natural vegetation | P | 1.8 | kg ha−1 yr−1 | [49] | |
| Emission from burning natural vegetation | K | 14.2 | kg ha−1 yr−1 | [49] | |
| Emission from denitrification | N | 20 | kg ha−1 yr−1 | [48] | |
| Release of NH3, NO, N2O, N2, cereals | N | 5.6 | kg ha−1 yr−1 | [68] | |
| Release of NH3, NO, N2O, N2, pulses | N | 3.3 | kg ha−1 yr−1 | [68] | |
| Release of NH3, NO, N2O, N2, banana, coffee | N | 15.2 | kg ha−1 yr−1 | [68] | |
| Release of NH3, NO, N2O, N2, vegetables | N | 21.3 | kg ha−1 yr−1 | [68] |
References
- Thornton, P.K.; Jones, P.G.; Alagarswamy, G.; Andresen, J. Spatial variation of crop yield response to climate change in East Africa. Glob. Environ. Chang. 2009, 19, 57–65. [Google Scholar] [CrossRef]
- Thornton, P.K.; Jones, P.G.; Alagarswamy, G.; Andresen, J.; Herrero, M. Adapting to climate change: Agricultural system and household impacts in East Africa. Agric. Syst. 2010, 103, 73–82. [Google Scholar] [CrossRef]
- Rosegrant, M.W.; Ringler, C.; Zhu, T. Water for agriculture: Maintaining food security under growing scarcity. Annu. Rev. Environ. Resour. 2009, 34, 205–222. [Google Scholar] [CrossRef]
- van Ittersum, M.K.; van Bussel, L.G.J.; Wolf, J.; Grassini, P.; van Wart, J.; Guilpart, N.; Claessens, L.; de Groot, H.; Wiebe, K.; Mason-D’Croz, D.; et al. Can sub-Saharan Africa feed itself? Proc. Natl. Acad. Sci. USA 2016, 113, 15364–15369. [Google Scholar] [CrossRef] [PubMed]
- Mkonda, M.Y.; He, X. Agricultural history nexus food security and policy framework in Tanzania. Agric. Food Secur. 2018, 7. [Google Scholar] [CrossRef]
- Ritchie, H.; Roser, M. Crop Yields. Available online: https://ourworldindata.org/crop-yields (accessed on 24 April 2020).
- Franke, A.C.; Baijukya, F.; Kantenga, S.; Reckling, M.; Vanlauwe, B.; Giller, K.E. Poor farmers—Poor yields: Socio-economic, soil fertility and crop management indicators affecting climbing bean productivity in northern Rwanda. Exp. Agric. 2019, 55, 14–34. [Google Scholar] [CrossRef]
- Tittonell, P.; Giller, K.E. When yield gaps are poverty traps: The paradigm of ecological intensification in African smallholder agriculture. Field Crop. Res. 2013, 143, 76–90. [Google Scholar] [CrossRef]
- Barbier, E.B. The economic linkages between rural poverty and land degradation: Some evidence from Africa. Agric. Ecosyst. Environ. 2000, 82, 355–370. [Google Scholar] [CrossRef]
- Deepak, K.R.; Ramankutty, N.; Mueller, N.D.; West, P.C.; Foley, J.A. Recent patterns of crop yield growth and stagnation. Nat. Commun. 2012, 3, 1293. [Google Scholar] [CrossRef]
- Mueller, N.D.; Gerber, J.S.; Johnston, M.; Ray, D.K.; Ramankutty, N.; Foley, J.A. Closing yield gaps through nutrient and water management. Nature 2012, 530, 254–257. [Google Scholar] [CrossRef]
- Hillocks, R.J. Addressing the yield gap in sub-Saharan Africa. Outlook Agric. 2014, 43, 85–90. [Google Scholar] [CrossRef]
- Gebrechorkos, S.H.; Hülsmann, S.; Bernhofer, C. Changes in temperature and precipitation extremes in Ethiopia, Kenya, and Tanzania. Int. J. Climatol. 2018, 4, 18–30. [Google Scholar] [CrossRef]
- Bunn, C.; Läderach, P.; Ovalle Rivera, O.; Kirschke, D. A bitter cup: Climate change profile of global production of Arabica and Robusta coffee. Clim. Chang. 2015, 129, 89–101. [Google Scholar] [CrossRef]
- Henao, J.; Baanante, C.A. Agricultural Production and Soil Nutrient Mining in Africa. Implications for Resource Conservation and Policy Development; International Center for Soil Fertility and Agricultural Development: Muscle Shoals, AL, USA, 2006; ISBN 0880901578. [Google Scholar]
- Vanlauwe, B.; Giller, K.E. Popular myths around soil fertility management in sub-Saharan Africa. Agric. Ecosyst. Environ. 2006, 116, 34–46. [Google Scholar] [CrossRef]
- Kiboi, M.N.; Ngetich, F.K.; Mugendi, D.N. Nitrogen budgets and flows in African smallholder farming systems. AIMS Agric. Food 2019, 4, 409–446. [Google Scholar] [CrossRef]
- Cobo, J.G.; Dercon, G.; Cadisch, G. Nutrient balances in African land use systems across different spatial scales: A review of approaches, challenges and progress. Agric. Ecosyst. Environ. 2010, 136, 1–15. [Google Scholar] [CrossRef]
- Winans, K.; Kendall, A.; Deng, H. The history and current applications of the circular economy concept. Renew. Sustain. Energy Rev. 2017, 68, 825–833. [Google Scholar] [CrossRef]
- Tyner, E.H.; Webb, J.R. Relation of corn yields to nutrient balance as revealed by leaf analysis. FAO AGRIS 1946, 38, 173–185. [Google Scholar] [CrossRef]
- Dumenil, L. Nitrogen and phosphorus composition of corn leaves and corn yields in relation to critical levels and nutrient balance. Soil Sci. Soc. Am. J. 1961, 25, 295–298. [Google Scholar] [CrossRef]
- Geraldson, C.M. Nutrient intensity and balance: Chapter 5. In Soil Testing: Correlating and Interpreting the Analytical Results; Peck, T.R., Cope, J.T., Whitney, D.A., Eds.; American Society of Agronomy: Madison, WI, USA, 1977. [Google Scholar]
- Lekasi, J.K.; Bekunda, M.A.; Woomer, P.L.; Tenywa, J.S. Decomposition of crop residues in banana-based cropping systems of Uganda. Biol. Agric. Hortic. 1999, 17, 1–10. [Google Scholar] [CrossRef]
- Reetsch, A.; Feger, K.-H.; Schwärzel, K.; Dornack, C.; Kapp, G. Organic farm waste management in degraded banana-coffee-based farming systems in north-west Tanzania. Agric. Syst. 2020, 185. [Google Scholar] [CrossRef]
- Reetsch, A.; Feger, K.-H.; Schwärzel, K.; Kapp, G. Transformation of degraded banana-coffee-based farming systems into multifunctional agroforestry systems—A mixed methods study from NW Tanzania. Agric. Syst. 2020. under review. [Google Scholar] [CrossRef]
- Baijukya, F.P. Adapting to Change in Banana-Based Farming Systems of Northwest Tanzania. The Potential Role of Herbaceous Legumes; Wageningen University: Wageningen, The Netherlands, 2004; ISBN 90-8574-094-9. [Google Scholar]
- Rugalema, G.H.; Okting’ati, A.; Johnsen, F.H. The homegarden agroforestry system of Bukoba district, North-Western Tanzania. 1. Farming system analysis. Agroforest. Syst. 1994, 26, 53–64. [Google Scholar] [CrossRef]
- Baijukya, F.P.; de Ridder, N.; Masuki, K.F.; Giller, K.E. Dynamics of banana-based farming systems in Bukoba district, Tanzania: Changes in land use, cropping and cattle keeping. Agric. Ecosyst. Environ. 2005, 106, 395–406. [Google Scholar] [CrossRef]
- Reetsch, A.; Kimaro, D.; Feger, K.-H.; Schwärzel, K. Traditional and adapted composting practices applied in smallholder banana-coffee-based farming systems: Case studies from Kagera and Morogoro regions, Tanzania. In Organic Waste Composting through Nexus Thinking Subtitle: Practices, Policies, and Trends; Hettiarachchi, H., Caucci, S., Schwärzel, K., Eds.; Springer: New York, NY, USA, 2020; ISBN 978-3-030-36283-6. [Google Scholar]
- Krause, A.; Nehls, T.; George, E.; Kaupenjohann, M. Organic wastes from bioenergy and ecological sanitation as a soil fertility improver: A field experiment in a tropical Andosol. Soil 2016, 2, 147–162. [Google Scholar] [CrossRef]
- Copeland Reining, P. The Haya: The Agrarian System of a Sedentary People. Ph.D. Thesis, The University of Chicago, Chicago, IL, USA, 1967. [Google Scholar]
- Katoke, I.K. The Making of the Karagwe Kingdom. Tanzanian History from Oral Tradition; The University College Dar es Salaam; East African Publishing House: Dar es Salaam, Tanzania, 1970. [Google Scholar]
- URT. Kagera Region. Basic Demographic and Socio-Economic Profile; 2012 Population and Housing Census; Kagera Profile, 2016; NO. 18. Available online: https://www.nbs.go.tz/index.php/en/regional-profiles (accessed on 21 February 2020).
- Touber, L.; Kanani, J.R. Landforms and Soils of Karagwe District; Karagwe District Council and Karagwe District Rural Development Programme: Karagwe, Tanzania, 1996. [Google Scholar]
- TMA. Data Collection from Kayanga Weather Station; Raw Data; Tanzanian Meteorological Agency (TMA): Dar es Salaam, Tanzania; Chicago, UL, USA, 2017.
- Reetsch, A.; Schwärzel, K.; Kapp, G.; Dornack, C.; Masisi, J.; Alichard, L.; Robert, H.; Byamungu, G.; Stepehene, S.; Feger, K.-H. Dataset: Survey of 157 smallholder farm households in banana-coffee-based farming systems containing data on farm households, agricultural production and use of farm waste. Pangaea 2020. dataset in review. [Google Scholar] [CrossRef]
- Reetsch, A.; Kapp, G.; Schwärzel, K.; Feger, K.-H. Data Brief: Survey of 157 smallholder farm households in banana-coffee-based farming systems containing data on farm households, agricultural production and use of farm waste. Agric. Syst. 2020. data brief in review. [Google Scholar]
- FAO. Family Farming Knowledge Platform. Available online: http://www.fao.org/family-farming/data-sources/dataportrait/livestock/en/ (accessed on 25 May 2019).
- Muchera-Muna, M.; Pypers, P.; Mugendi, D.; Kung’u, J.; Mugwe, J.; Merckx, R.; Vanlauwe, B. A staggered maize–legume intercrop arrangement robustly increases crop yields and economic returns in the highlands of Central Kenya. Field Crop. Res. 2010, 115, 132–139. [Google Scholar] [CrossRef]
- Mugwe, J.; Mugendi, D.; Kungu, J.; Mucheru-Muna, M. Effect of plant biomass, manure and inorganic fertilizer on maize yield in the Central Highlands of Kenya. Afr. Crop Sci. J. 2010, 15. [Google Scholar] [CrossRef]
- Ndabamenye, T.; van Asten, P.J.A.; Blomme, G.; Vanlauwe, B.; Uzayisenga, B.; Annandale, J.G.; Barnard, R.O. Nutrient imbalance and yield limiting factors of low input East African highland banana (Musa spp. AAA-EA) cropping systems. Field Crop. Res. 2013, 147, 68–78. [Google Scholar] [CrossRef]
- Smithson, P.C.; McIntyre, B.D.; Gold, C.S.; Ssali, H.; Kashaija, I.N. Nitrogen and potassium fertilizer vs. nematode and weevil effects on yield and foliar nutrient status of banana in Uganda. Nutr. Cycl. Agroecosyst. 2001, 59, 239–257. [Google Scholar] [CrossRef]
- Wang, N.; Jassogne, L.; van Asten, P.J.A.; Mukasa, D.; Wanyama, I.; Kagezi, G.; Giller, K.E. Evaluating coffee yield gaps and important biotic, abiotic, and management factors limiting coffee production in Uganda. Eur. J. Agron. 2015, 59, 1–11. [Google Scholar] [CrossRef]
- FAOSTAT. 2020. Available online: http://www.fao.org/faostat/en/#data (accessed on 29 March 2020).
- Baccini, P.; Brunner, P.H. Metabolism of the Anthroposphere. Analysis, Evaluation, Design, 2nd ed.; MIT Press: Cambridge, MA, USA, 2012; ISBN 9780262016657. [Google Scholar]
- Stoorvogel, J.; Smaling, E.M.A. Assessment of Soil Nutrient Depletion in Sub-Saharan Africa: 1983–2000. Volume II: Nutrient Balances per Crop and per Land Use Systems; Winand Staring Centre: Wageningen, The Netherlands, 1990. [Google Scholar]
- Fink, A. Conducting Research Literature Reviews. From the Internet to Paper; SAGE Publications: Los Angeles, CA, USA, 2014. [Google Scholar]
- Bauters, M.; Verbeeck, H.; Rütting, T.; Barthel, M.; Bazirake Mujinya, B.; Bamba, F.; Bodé, S.; Boyemba, F.; Bulonza, E.; Carlsson, E.; et al. Contrasting nitrogen fluxes in African tropical forests of the Congo Basin. Ecol. Monogr. 2019, 89, e01340. [Google Scholar] [CrossRef]
- Baijukya, F.P.; de Steenhuijsen Piters, B. Nutrient balances and their consequences in the banana-based land use systems of Bukoba district, northwest Tanzania. Agric. Ecosyst. Environ. 1998, 71, 147–158. [Google Scholar] [CrossRef]
- Kanmegne, J.; Smaling, E.M.A.; Brussaard, L.; Gansop-Kouomegne, A.; Boukong, A. Nutrient flows in smallholder production systems in the humid forest zone of southern Cameroon. Nutr. Cycl. Agroecosyst. 2007, 76, 233–252. [Google Scholar] [CrossRef]
- Szott, L.T. Nitrogen Fixing Trees for Acid Soils; Research Report NTFA and CATIE; AR (USA) NFTA/Taiwan Forestry Research Inst.: Morrilton, Costa Rica, 1995. [Google Scholar]
- Peoples, M.B.; Brockwell, J.; Herridge, D.F.; Rochester, I.J.; Alves, B.J.R.; Urquiaga, S.; Boddey, R.M.; Dakora, F.D.; Bhattarai, S.; Maskey, S.L.; et al. The contributions of nitrogen-fixing crop legumes to the productivity of agricultural systems. Symbiosis 2009, 52, 1–17. [Google Scholar] [CrossRef]
- Infonet Biovision. Banana. Available online: https://www.infonet-biovision.org/PlantHealth/Crops/Bananas (accessed on 18 April 2020).
- Heuzé, V.; Tran, G.; Archimède, H.; Régnier, C.; Bastianelli, D.; Lebas, F. Feedipedia. Animal Feed Resources Information System. 2016. Available online: https://www.feedipedia.org/node/526 (accessed on 3 April 2020).
- Jingura, R.M.; Matengaifa, R. The potential for energy production from crop residues in Zimbabwe. Biomass Bioenergy 2008, 32, 1287–1292. [Google Scholar] [CrossRef]
- Krause, A.; Rotter, V.S. Recycling improves soil fertility management in smallholdings in Tanzania. Agriculture 2018, 8, 31. [Google Scholar] [CrossRef]
- Krause, A.; Rotter, V.S. Linking energy-sanitation-agriculture: Intersectional resource management in smallholder households in Tanzania. Sci. Total Environ. 2017, 590–591, 514–530. [Google Scholar] [CrossRef]
- Teenstra, E.; de Buisonjé, F.; Ndambi, A.; Pelster, D. Manure Management in the (Sub-)Tropics. Training Manual for Extension Workers; Wageningen University Livestock Research Report 919; Wageningen University: Wageningen, The Netherland, 2015. [Google Scholar]
- Mukai, S.; Oyanagi, W. Decomposition characteristics of indigenous organic fertilisers and introduced quick compost and their short-term nitrogen availability in the semi-arid Ethiopian Rift Valley. Sci. Rep. 2019, 9, 16000. [Google Scholar] [CrossRef]
- Bristow, A.W.; Whitehead, D.C.; Cockburn, J.E. Nitrogenous constituents in the urine of cattle, sheep and goats. J. Sci. Food Agric. 1992, 59, 387–394. [Google Scholar] [CrossRef]
- Snijders, P.; Onduru, D.; Wouters, B.; Gachimbi, L.N.; Zake, J.; Ebanyat, P.; Ergano, K.; Abduke, M.; van Keulen, H. Cattle Manure Management in East Africa: Review of Manure Quality and Nutrient Losses and Scenarios for Cattle and Manure Management; Wageningen University Livestock Research Report 258; Wageningen University: Wageningen, The Netherland, 2009. [Google Scholar]
- Rose, C.; Parker, A.; Jefferson, B.; Cartmell, E. The characterization of feces and urine: A review of the literature to inform advanced treatment technology. Crit. Rev. Environ. Sci. Technol. 2015, 49, 1827–1879. [Google Scholar] [CrossRef] [PubMed]
- Timmer, L.; Visker, C. Possibilities and Impossibilities of the Use of Human Excreta as Fertilizer in Agriculture in Sub-Sahara Africa. A Literature Review; Royal Tropical Institute: Amsterdam, The Netherlands, 1998. [Google Scholar]
- Mnkeni, P.N.; Austin, L.M. Fertiliser value of human manure from pilot urine-diversion toilets. Water SA 2009, 35, 133–138. [Google Scholar] [CrossRef]
- Mariwah, S.; Drangert, J.-O. Community perceptions of human excreta as fertilizer in peri-urban agriculture in Ghana. Waste Manag. Res. 2011, 29, 815–822. [Google Scholar] [CrossRef] [PubMed]
- Simha, P.; Ganesapillai, M. Ecological Sanitation and nutrient recovery from human urine: How far have we come? A review. Sustain. Environ. Res. 2017, 27, 107–116. [Google Scholar] [CrossRef]
- Akpan-Idiok, A.U.; Udo, I.A.; Braide, E.I. The use of human urine as an organic fertilizer in the production of okra (Abelmoschus esculentus) in South Eastern Nigeria. Resour. Conserv. Recycl. 2012, 62, 14–20. [Google Scholar] [CrossRef]
- Pretzsch, H.; Block, J.; Dieler, J.; Gauer, J.; Göttlein, A.; Moshammer, R.; Schuck, J.; Weis, W.; Wunn, U. Nährstoffentzüge durch die holz- und biomassenutzung in wäldern. Teil 1: Schätzfunktionen für biomasse und nährelemente und ihre anwendung in szenariorechnungen. Allg. Forst Jagdztg. 2013, 185, 261–285. [Google Scholar]
- Haileslassie, A.; Priess, J.; Veldkamp, E.; Teketay, D.; Lesschen, J.P. Assessment of soil nutrient depletion and its spatial variability on smallholders’ mixed farming systems in Ethiopia using partial versus full nutrient balances. Agric. Ecosyst. Environ. 2005, 108, 1–16. [Google Scholar] [CrossRef]
- Andersson, E. Turning waste into value: Using human urine to enrich soils for sustainable food production in Uganda. J. Clean. Prod. 2015, 96, 290–298. [Google Scholar] [CrossRef]
- Richert, A.; Gensch, R.; Jönsson, H.; Stenström, T.-A.; Dagerskopg, L. Practical Guidance on the Use of Urine in Crop Production; Stockholm Environment Institute: Stockholm, Sweden, 2010; ISBN 978-91-86125-21-9. [Google Scholar]
- Baijukya, F.P.; de Ridder, N.; Giller, K.E. Managing Legume cover crops and their residues to enhance productivity of degraded soils in the humid tropics: A case study in Bukoba district, Tanzania. Nutr. Cycl. Agroecosyst. 2005, 73, 75–87. [Google Scholar] [CrossRef]
- Krause, A.; Kaupenjohann, M.; George, E.; Koeppel, J. Nutrient recycling from sanitation and energy systems to the agroecosystem: Ecological research on case studies in Karagwe, Tanzania. Afr. J. Agric. Res. 2015, 10, 4039–4052. [Google Scholar] [CrossRef]
- Kisoza, L.J.A. Impact of policy and legal reforms on a pastoral system in lower Kagera sub-basin, North Western Tanzania. Huria J. Open Univ. Tanzan. 2014, 16, 1–24. [Google Scholar]
- Wolka, K.; Mulder, J.; Biazin, B. Effects of soil and water conservation techniques on crop yield, runoff and soil loss in sub-Saharan Africa: A review. Agric. Water Manag. 2018, 207, 67–79. [Google Scholar] [CrossRef]
- Visser, S.M.; Sterk, G. Nutrient dynamics—Wind and water erosion at the village scale in the Sahel. Land Degrad. Dev. 2007, 18, 578–588. [Google Scholar] [CrossRef]
- Gebrechorkos, S.H.; Hülsmann, S.; Bernhofer, C. Evaluation of multiple climate data sources for managing environmental resources in East Africa. Hydrol. Earth Syst. Sci. 2018, 22, 4947–4964. [Google Scholar] [CrossRef]
- Gebrechorkos, S.H.; Hülsmann, S.; Bernhofer, C. Regional climate projections for impact assessment studies in East Africa. Environ. Res. Lett. 2019, 14, 44031. [Google Scholar] [CrossRef]
- Guzha, E.; Nhapi, I.; Rockstrom, J. An assessment of the effect of human faeces and urine on maize production and water productivity. Phys. Chem. Earth Parts A/B/C 2005, 30, 840–849. [Google Scholar] [CrossRef]
- Mahouachi, J. Changes in nutrient concentrations and leaf gas exchange parameters in banana plantlets under gradual soil moisture depletion. Sci. Hortic. 2009, 120, 460–466. [Google Scholar] [CrossRef]
- Mia, S.; Dijkstra, F.A.; Singh, B. Long-Term Aging of Biochar: A Molecular Understanding With Agricultural and Environmental Implications. Adv. Agron. 2016, 141, 1–51. [Google Scholar] [CrossRef]
- Lychuk, T.E.; Izaurralde, R.C.; Hill, R.L.; McGill, W.B.; Williams, J.R. Biochar as a global change adaptation: Predicting biochar impacts on crop productivity and soil quality for a tropical soil with the Environmental Policy Integrated Climate (EPIC) model. Mitig. Adapt. Strateg. Glob. Chang. 2015, 20, 1437–1458. [Google Scholar] [CrossRef]
- Ngo, P.T.; Rumpel, C.; Janeau, J.-L.; Dang, D.-K.; Doan, T.T.; Jouquet, P. Mixing of biochar with organic amendments reduces carbon removal after field exposure under tropical conditions. Ecol. Eng. 2016, 91, 378–380. [Google Scholar] [CrossRef]
- Klimkowicz-Pawlas, A.; Siebielec, G.; Suszek-Lopatka, B. The impact of soil degradation on human health. Presented at the TERRAENVISION Conference in Workshop on “SOILS4EU: Impacts of Soil Degradation on Human Health”, Barcelona, Spain, 2–7 September 2019. [Google Scholar]
- Hafner, H.; George, E.; Batino, A.; Marschner, H. Effect of crop residues on root growth and phosphorus acquisition of pearl millet in an acid sandy soil in Niger. Plant Soil 1993, 157, 117–127. [Google Scholar] [CrossRef]
- Esilaba, A.O.; Nyende, P.; Nalukenge, G.; Byalebeka, J.B.; Delve, R.J.; Ssali, H. Resource flows and nutrient balances for crop and animal production in smallholder farming systems in eastern Uganda. Agric. Ecosyst. Environ. 2005, 109, 192–201. [Google Scholar] [CrossRef][Green Version]
- Ndabamenye, T.; Vanlauwe, B.; van Asten, P.J.A.; Blomme, G.; Swennen, R.; Uzayisenga, B.; Annandale, J.G.; Barnard, R.O. Influence of plant density on variability of soil fertility and nutrient budgets in low input East African highland banana (Musa spp. AAA-EA) cropping systems. Nutr. Cycl. Agroecosyst. 2013, 95, 187–202. [Google Scholar] [CrossRef]
- Dakora, F.D.; Keya, S.O. Contribution of legume nitrogen fixation to sustainable agriculture in sub-Saharan Africa. Soil Biol. Biochem. 1997, 29, 809–817. [Google Scholar] [CrossRef]
- Hegde, D.M.; Srinivas, K. Irrigation and nitrogen fertility influences on plant water relations, biomass, and nutrient accumulation and distribution in banana cv. Robusta. J. Hortic. Sci. 1989, 64, 91–98. [Google Scholar] [CrossRef]
- Prasomsook, S. Banana Yields in Relation to Nitrogen and Potassium Composition of Leaves. Master’s Thesis, University of Hawaii, Honolulu, HI, USA, 1973. [Google Scholar]


| Household Characteristics | Untrained Households I | Trained Farm Households II | ||||||
|---|---|---|---|---|---|---|---|---|
| Unit | AU | BU | CU | Mean | AT | BT | CT | |
| Households Group−1 | 58 | 52 | 44 | 296 | 262 | 198 | ||
| Homegarden size | ||||||||
| Homegarden | ha (average) | 2.8 | 1.8 | 0.6 | 1.8 | 0.6–2.8 (1.4) | 0.4–1.0 (0.7) | 0.2–0.8 (0.5) |
| Transformed homegarden | ha (average) | 0.0 | 0.0 | 0.0 | 0.0 | 0.4–0.8 (0.6) | 0.1–0.4 (0.2) | ≤ 0.1 |
| Household characteristics | ||||||||
| Household size | p household−1 | 10.2 | 9.7 | 5.7 | 8.5 | 5.3 | 5.1 | 5.1 |
| Female-headed | % of households | 16 | 35 | 43 | 31 | 30 | 29 | 33 |
| Labour | hours adult−1 day−1 | 5.6 | 5.0 | 3.6 | n.a. | 7.6 | 6.7 | 5.1 |
| Available food III | months yr−1 | 6.6 | 3.2 | 1.7 | 4.2 | n.a. | n.a. | n.a. |
| Meals | meals day−1 | n.a. | n.a. | n.a. | n.a. | 3.0 | 2.2 | 1.7 |
| Crop yields | ||||||||
| Banana (Musa spp.) | t homegarden−1 yr−1 | 4.2 | 1.8 | 0.2 | 2.1 | 11–57 | 2.8–18 | 0.7–1.2 |
| Coffee (Coffea canephora) | t homegarden−1 yr−1 | 0.5 | 0.1 | 0.1 | 0.2 | ≤0.7 | ≤0.1 | ≤0.1 |
| Beans (Phaseolus vulgaris spp.) | t homegarden−1 yr−1 | 1.5 | 0.7 | 0.2 | 0.8 | 0.4–0.8 | 0.1–0.4 | 0.1–0.2 |
| Maize (Zea mays spp.) | t homegarden−1 yr−1 | 0.6 | 0.7 | 0.1 | 0.5 | 0.3–1.0 | 0.1–0.5 | 0.1–0.2 |
| Cassava (Manihot esculenta spp.) | t homegarden−1 yr−1 | 0.4 | 0.4 | 0.2 | 0.3 | 0.8 | 0.5 | 0.2 |
| Banana (Musa spp.) | t ha−1 yr−1 IV | 1.5 | 1.0 | 0.3 | 1.2 | 7.9–36 | 4.0–25.7 | 1.4–2.4 |
| Coffee (Coffea canephora) | t ha−1 yr−1 IV | 0.2 | 0.1 | 0.1 | 0.1 | ≤0.5 | ≤0.2 | ≤0.1 |
| Beans (Phaseolus vulgaris spp.) | t ha−1 yr−1 IV | 0.5 | 0.4 | 0.3 | 0.4 | 0.3–0.6 | 0.1–0.6 | 0.2–0.4 |
| Maize (Zea mays spp.) | t ha−1 yr−1 IV | 0.2 | 0.4 | 0.2 | 0.3 | 0.2–0.7 | 0.1–0.7 | 0.2–0.4 |
| Cassava (Manihot esculenta spp.) | t ha−1 yr−1 IV | 0.1 | 0.2 | 0.3 | 0.2 | 0.6 | 0.4 | 0.1 |
| Livestock | ||||||||
| Improved cattle (Friesian) (homegarden) | TLU V | 0.2 VI | 0.3 VI | 0.0 VI | 0.1 VI | 2.0 | 0.6 | 0.0 |
| Indigenous cattle (grassland) | TLU | 6.6 VI | 3.1 VI | 0.0 VI | 3.4 VI | ≤26 | <10 | 0.0 |
| Goats, sheep, pigs (homegarden) | TLU | 1.1 VI | 0.9 VI | 0.4 VI | 0.8 VI | ≤2.0 | <1.2 | ≤0.3 |
| Chickens, rabbits (homegarden) | TLU | 0.1 VI | 0.0 VI | 0.0 VI | 0.0 VI | ≤1.0 | ≤0.4 | ≤0.2 |
| Bees (homegarden) | beehives | 0.0 VI | 0.0 VI | 0.0 VI | 0.0 VI | ≤3 | ≤1 | 0.0 |
| Annual Crop Residues | Household Groups | ||||||||||||
|---|---|---|---|---|---|---|---|---|---|---|---|---|---|
| Unit | AU | BU | CU | AT | BT | CT | |||||||
| av. | min. | max. | av. | min. | max. | av. | min. | max. | |||||
| Banana | |||||||||||||
| Plants | ha−1 | 60 | 60 | 52 | 585 | 377 | 1200 | 446 | 168 | 617 | 57 | 56 | 72 |
| Leaves | kg ha−1 | 494 | 300 | 90 | 6585 | 3300 | 15,000 | 4495 | 840 | 5400 | 285 | 210 | 360 |
| Leaves, dry | kg DM ha−1 | 68 | 49 | 14 | 988 | 535 | 2257 | 468 | 126 | 810 | 43 | 32 | 57 |
| Pseudostems | kg ha−1 | 225 | 157 | 49 | 3293 | 1657 | 7570 | 2228 | 400 | 2700 | 143 | 105 | 180 |
| Peel, fresh | kg ha−1 | 357 | 233 | 70 | 5114 | 2563 | 11,657 | 2403 | 652 | 4194 | 221 | 163 | 280 |
| Peel, dry | kg DM ha−1 | 57 | 36 | 11 | 788 | 395 | 1794 | 373 | 100 | 646 | 34 | 25 | 43 |
| Stalk | kg ha−1 | 35 | 23 | 6.9 | 579 | 253 | 1157 | 239 | 64 | 414 | 22 | 16 | 28 |
| Coffee | |||||||||||||
| Husks | kg ha−1 | 90 | 49 | 49 | 135 | 49 | 225 | 68 | 49 | 90 | 23 | 14 | 49 |
| Leaves | kg ha−1 | 20 | 10 | 10 | 30 | 10 | 57 | 15 | 10 | 20 | 5 | 3 | 10 |
| Leaves, dry | kg DM ha−1 | 19 | 9.2 | 9.2 | 28 | 9.2 | 46 | 14 | 9.2 | 19 | 4.6 | 2.8 | 9.2 |
| Beans | |||||||||||||
| Foliage | kg ha−1 | 1071 | 861 | 655 | 949 | 630 | 1260 | 735 | 210 | 1260 | 630 | 400 | 840 |
| Straw | kg DM ha−1 | 940 | 758 | 573 | 832 | 557 | 1109 | 647 | 185 | 1109 | 557 | 370 | 739 |
| Maize | |||||||||||||
| Foliage | kg ha−1 | 280 | 560 | 280 | 630 | 280 | 980 | 560 | 140 | 980 | 400 | 280 | 560 |
| Stover | kg DM ha−1 | 83 | 166 | 83 | 186 | 83 | 290 | 166 | 41 | 290 | 124 | 83 | 166 |
| Cobs | kg ha−1 | 36 | 72 | 36 | 81 | 36 | 126 | 72 | 18 | 126 | 57 | 36 | 72 |
| Cobs, dry | kg DM ha−1 | 33 | 66 | 33 | 74 | 33 | 115 | 66 | 16 | 115 | 53 | 33 | 66 |
| Cassava | |||||||||||||
| Foliage | kg ha−1 | 120 | 240 | 360 | 720 | n.a. | n.a. | 520 | n.a. | n.a. | 120 | n.a. | n.a. |
| Foliage, dry | kg DM ha−1 | 27 | 57 | 81 | 162 | n.a. | n.a. | 108 | n.a. | n.a. | 27 | n.a. | n.a. |
| Peel, fresh | kg ha−1 | 12 | 23 | 35 | 69 | n.a. | n.a. | 46 | n.a. | n.a. | 12 | n.a. | n.a. |
| Peel, dry | kg DM ha−1 | 10 | 20 | 30 | 60 | n.a. | n.a. | 40 | n.a. | n.a. | 10 | n.a. | n.a. |
| Manure | Urine | ||||||||
|---|---|---|---|---|---|---|---|---|---|
| Solid dung I | Fresh dung I | N | P | K | Amount III | N | P | K | |
| kg animal−1 d−1 | in solid dung | L animal−1 d−1 | g L−1 | g L−1 | g L−1 | ||||
| Cattle | 16.3 | 15–20 | 1.2 II | 0.3 II | 2.1 II | 13.0–16.0 | 6.8 IV | n.d. | n.d. |
| Goat, sheep | 1.5 | 0.9–3.0 | 1.5 II | 0.2 II | 3.0 II | 0.5–2.0 | 3.0 | n.d. | n.d. |
| Pig | 1.0 | 1.2–4.0 | 2.5 III | 0.5 III | 0.7 III | 2.0–6.0 | n.d. | n.d. | n.d. |
| Chicken | 0.1 | 0.02–0.2 | 1.4 II | 0.3 II | 1.8 II | n.r. | n.d. | n.d. | n.d. |
| Average Nutrient Losses in % | |||||
|---|---|---|---|---|---|
| Collection and Storage System | Dung N | Dung P | Urine N | Urine K | Practised by Household Groups |
| Open kraal/boma I | 30 | 15 | 70 | 49 | AU, AT, BU, BT |
| Manure in compost heap | 20 | 10 | 60 | 40 | not practised |
| Manure in compost pit | 15 | 10 | 57 | 20 | AU, AT, BU, BT |
| Deep litter compost (in situ compost) | 15 | 10 | 55 | 25 | all groups |
| Compact manure pit/heap and urine pit | 10 | 5 | 40 | 10 | AU, AT |
| Slurry pit (watertight, covered) | 7 | 5 | 30 | 10 | not practised |
| Amounts and Nutrients in Human Excreta | Household Groups | ||||||
|---|---|---|---|---|---|---|---|
| Unit | AU | BU | CU | AT | BT | CT | |
| Households | hh group−1 | 58 | 52 | 44 | 296 | 262 | 198 |
| Household size | p hh−1 | 10.2 | 9.7 | 5.7 | 5.3 | 5.1 | 5.1 |
| Human faeces | |||||||
| Percentage of food intake I | % of AT | 79 | 38 | 22 | 100 | 66 | 55 |
| Amount II | g p−1 d−1 | 101 | 53 | 28 | 128 | 85 | 65 |
| Amount II | kg p−1 yr−1 | 37 | 18 | 10 | 47 | 31 | 24 |
| N II | kg hh−1 yr−1 | 6.8 | 3.1 | 1.1 | 4.5 | 2.8 | 2.2 |
| P II | kg hh−1 yr−1 | 1.1 | 0.5 | 0.2 | 0.7 | 0.5 | 0.4 |
| K II | kg hh−1 yr−1 | 16 | 7.6 | 2.6 | 11 | 6.9 | 5.3 |
| Human urine | |||||||
| Amount II | L p−1 d−1 | 1.4 | 1.4 | 1.4 | 1.4 | 1.4 | 1.4 |
| N II | kg hh−1 yr−1 | 62 | 59 | 35 | 32 | 31 | 31 |
| P II | kg hh−1 yr−1 | 3.5 | 3.3 | 1.9 | 1.8 | 1.7 | 1.7 |
| K II | kg hh−1 yr−1 | 11 | 10 | 6.2 | 5.7 | 5.5 | 5.5 |
| Annual Harvest | Household Groups | ||||||||||||
|---|---|---|---|---|---|---|---|---|---|---|---|---|---|
| AU | BU | CU | AT | BT | CT | ||||||||
| Unit | av. | min. | max. | av. | min. | max. | av. | min. | max. | ||||
| Banana | |||||||||||||
| Bunches | ha−1 | 57 | 57 | 40 | 528 | 314 | 1000 | 260 | 140 | 557 | 52 | 47 | 60 |
| Bunch weight | kg | 35 | 20 | 5.0 | 49 | 35 | 57 | 40 | 20 | 35 | 20 | 15 | 20 |
| Pulp | kg ha−1 | 1116 | 744 | 223 | 16,331 | 8184 | 37,200 | 7738 | 2083 | 13,392 | 707 | 521 | 893 |
| Pulp, dry | kg DM ha−1 | 240 | 160 | 52 | 3552 | 1760 | 8000 | 1664 | 492 | 2880 | 152 | 112 | 192 |
| Coffee, green | kg ha−1 | 110 | 55 | 55 | 165 | 55 | 275 | 83 | 55 | 110 | 28 | 17 | 55 |
| Beans (seeds) | kg DM ha−1 | 494 | 365 | 276 | 401 | 267 | 535 | 312 | 89 | 535 | 267 | 178 | 356 |
| Maize | |||||||||||||
| Grains | kg ha−1 | 164 | 328 | 164 | 369 | 164 | 574 | 328 | 82 | 574 | 246 | 164 | 328 |
| Grains, dry | kg DM ha−1 | 152 | 26 | 3.9 | 17 | 120 | 10 | 14 | 15 | 2.3 | 7.1 | 5.9 | 1.6 |
| Cassava | |||||||||||||
| Tuber, peeled | kg ha−1 | 89 | 177 | 266 | 531 | NA | NA | 357 | NA | NA | 89 | NA | NA |
| Tuber, peeled, dry | kg DM ha−1 | 25 | 57 | 76 | 155 | NA | NA | 101 | NA | NA | 25 | NA | NA |
| Soil Horizon | Depth | Munsell Colour Code | Clay % | Silt % | Sand % | pH KCl | TOC | Ntot | C/N | ρB | CECeff | BS |
|---|---|---|---|---|---|---|---|---|---|---|---|---|
| Ap | 20 | 2.5 YR 3/2 | 3.2 | 16 | 81 | 3.8 | 3.5 | 0.3 | 13 | 0.9 | 17 | 100 |
| Ah | 37 | 2.5 YR 3/2 | 3.6 | 13 | 83 | 3.8 | 2.7 | 0.2 | 13 | 0.9 | 11 | 97 |
| B1 | 53 | 2.5 YR 2.5/3 | 2.2 | 16 | 82 | n.a. | 2.0 | 0.2 | 13 | 1.1 | 8.0 | 95 |
| B2 | 74 | 2.5 YR 3/3 | 2.2 | 20 | 78 | n.a. | n.a. | n.a. | n.a. | n.a. | n.a. | n.a. |
| C | 100+ | n.a. | n.a. | n.a. | n.a. | n.a. | n.a. | n.a. | n.a. | n.a. | n.a. | n.a. |
| Agroforestry System Stage | Density | % | Household Group |
|---|---|---|---|
| Biodiverse, dense, well-managed farming system grown over several years/decades with old trees and sufficient nutrient input, soils covered with mulch throughout the year | maximum | 100 | Not reached by any group |
| Biodiverse, well-managed farming system with few older trees, integrated sustainable land use management, soils covered with grass throughout the year | high | 80 | AT |
| Well managed but with lower density and traditional farming; soils are often covered with crop residues (in situ composting) | moderate | 60 | AU |
| Moderately well managed, soils covered for some months of the year, lower yields, partial food insecurity | low | 40 | BT, BU |
| Poorly managed with very few crops and trees, frequent labour shortages, very low yields, food insecurity | very low | 20 | CT, CU |
| Inflows, Outflows, and Nutrient Budgets in Farm Household Groups | ||||||||||||||||||
|---|---|---|---|---|---|---|---|---|---|---|---|---|---|---|---|---|---|---|
| Flow | AU | BU | CU | AT | BT | CT | ||||||||||||
| Nutrient (kg ha−1 yr−1) | N | P | K | N | P | K | N | P | K | N | P | K | N | P | K | N | P | K |
| IN1 Atmospheric deposition | 4.4 | 0.7 | 2.9 | 4.4 | 0.7 | 2.9 | 4.4 | 0.7 | 2.9 | 4.4 | 0.7 | 2.9 | 4.4 | 0.7 | 2.9 | 4.4 | 0.7 | 2.9 |
| IN2 Input by plants and trees | 30 | 1.1 | 5.3 | 20 | 0.6 | 2.6 | 12 | 0.1 | 0.7 | 36 | 1.4 | 6.6 | 30 | 0.8 | 4.0 | 18 | 0.4 | 2.0 |
| IN3 Organic fertiliser | 102 | 15 | 153 | 86 | 15 | 142 | 41 | 9.6 | 64 | 373 | 64 | 565 | 169 | 29 | 267 | 54 | 8.1 | 65 |
| Crop residues | 4.4 | 1.1 | 10 | 4.9 | 2.1 | 14 | 4.6 | 3.1 | 13 | 39 | 7.3 | 94 | 20 | 4.7 | 50 | 3.3 | 1.1 | 9.7 |
| Banana leaves | 1.9 | 0.1 | 3.3 | 1.2 | 0 | 2.2 | 0.4 | 0 | 0.7 | 27.2 | 1.0 | 48 | 12.9 | 0.5 | 23 | 1.2 | 0 | 2.1 |
| Banana pseudostems | 0.2 | 0 | 1.4 | 0.1 | 0 | 0.9 | 0.0 | 0 | 0.3 | 2.7 | 0.3 | 20 | 1.3 | 0.1 | 9.6 | 0.1 | 0 | 0.9 |
| Coffee leaves | 0.7 | 0 | 0.0 | 0.4 | 0 | 0.0 | 0.4 | 0 | 0.0 | 1.1 | 0 | 0.1 | 0.6 | 0 | 0.1 | 0.2 | 0 | 0.0 |
| Maize stover | 0.5 | 0 | 2.2 | 1.0 | 0 | 4.4 | 0.5 | 0 | 2.2 | 1.1 | 0.1 | 5.0 | 1.0 | 0 | 4.4 | 0.7 | 0 | 3.3 |
| Cassava foliage | 1.1 | 1.0 | 3.4 | 2.2 | 2.0 | 6.8 | 3.3 | 3.0 | 10 | 6.7 | 6.0 | 20 | 4.5 | 4.0 | 14 | 1.1 | 1.0 | 3.4 |
| Kitchen waste | 25 | 1.8 | 20 | 20 | 1.9 | 18 | 16 | 1.7 | 14 | 26 | 2.9 | 35 | 20 | 2.5 | 29 | 15 | 1.4 | 14 |
| Cooking ash I | 0 | 1.0 | n.d. | 0 | 1.0 | n.d. | 0 | 1.0 | n.d. | 0 | 1.0 | n.d. | 0 | 1.0 | n.d. | 0 | 1 | n.d. |
| Livestock manure | 68 | 10 | 118 | 53 | 9.0 | 103 | 16 | 2.2 | 33 | 309 | 53 | 437 | 129 | 21 | 188 | 36 | 4.6 | 41 |
| Livestock manure, grassland II | 540 | 91 | 634 | 262 | 43 | 298 | 3.3 | 0 | 0 | 2139 | 357 | 2499 | 822 | 137 | 961 | 2.5 | 0 | 0 |
| Human urine | 4.8 | 0.9 | 5.2 | 7.4 | 1.4 | 6.4 | 4.3 | 1.7 | 3.2 | 0 III | 0 | 0 | 0 | 0 | 0 | 0 | 0 | 0 |
| Total nutrient inflow | 144 | 17 | 161 | 125 | 17 | 147 | 66 | 10 | 67 | 414 | 66 | 575 | 204 | 30 | 274 | 77 | 8 | 71 |
| OUT1 Harvest | 52 | 6.0 | 36 | 42 | 5.9 | 32 | 32 | 4.6 | 25 | 90 | 14 | 115 | 56 | 9.0 | 65 | 30 | 4.2 | 23 |
| Banana pulp | 2.0 | 0.4 | 1.6 | 1.3 | 0.2 | 1.1 | 0.4 | 0.1 | 0.3 | 29 | 5.3 | 24 | 14 | 2.5 | 11 | 1.3 | 0.2 | 1.0 |
| Banana peel | 0.6 | 0.1 | 2.7 | 0.4 | 0.0 | 1.8 | 0.1 | 0.0 | 0.5 | 9.0 | 0.9 | 39.3 | 4.3 | 0.4 | 18.6 | 0.4 | 0.0 | 1.7 |
| Banana stalk | 0.1 | 0.0 | 0.6 | 0.0 | 0.0 | 0.4 | 0.0 | 0.0 | 0.1 | 1.0 | 0.2 | 9.1 | 0.5 | 0.1 | 4.3 | 0.0 | 0.0 | 0.4 |
| Coffee beans | 2.5 | 0.3 | 2.5 | 1.3 | 0.1 | 1.2 | 1.3 | 0.1 | 1.2 | 3.8 | 0.4 | 3.7 | 1.9 | 0.2 | 1.9 | 0.6 | 0.1 | 0.6 |
| Coffee husks | 1.8 | 0.2 | 2.5 | 0.9 | 0.1 | 1.2 | 0.9 | 0.1 | 1.2 | 2.7 | 0.3 | 3.7 | 1.4 | 0.1 | 1.9 | 0.5 | 0.0 | 0.6 |
| Common beans | 19 | 2.6 | 5.3 | 15 | 2.1 | 4.3 | 12 | 1.6 | 3.2 | 17 | 2.3 | 4.7 | 13 | 1.8 | 3.6 | 11 | 1.6 | 3.1 |
| Bean waste | 24 | 1.5 | 17 | 19 | 1.2 | 14 | 14 | 0.9 | 11 | 21 | 1.3 | 15 | 16 | 1.0 | 12 | 14 | 0.9 | 10 |
| Maize grains | 0.4 | 0.4 | 0.5 | 0.9 | 0.9 | 1.1 | 0.4 | 0.4 | 0.5 | 1.0 | 1.0 | 1.2 | 0.9 | 0.9 | 1.1 | 0.7 | 0.6 | 0.8 |
| Maize cobs | 0.5 | 0.2 | 1.6 | 1.0 | 0.5 | 3.2 | 0.5 | 0.2 | 1.6 | 1.2 | 0.5 | 3.6 | 1.0 | 0.5 | 3.2 | 0.8 | 0.3 | 2.4 |
| Cassava tubers | 0.5 | 0.2 | 1.1 | 1.0 | 0.3 | 2.2 | 1.5 | 0.5 | 3.2 | 3.0 | 1.0 | 6.5 | 2.0 | 0.6 | 4.3 | 0.5 | 0.2 | 1.1 |
| Cassava peel | 0.2 | 0.2 | 0.6 | 0.4 | 0.4 | 1.3 | 0.6 | 0.6 | 1.9 | 1.3 | 1.3 | 3.9 | 0.8 | 0.8 | 2.6 | 0.2 | 0.2 | 0.6 |
| Food (part of OUT1) | 11 | 1.9 | 4.6 | 10 | 2.1 | 5.1 | 11 | 2.1 | 6.2 | 20 | 4.1 | 15 | 16 | 3.2 | 11 | 11 | 2.1 | 4.9 |
| Banana pulp | 1.0 | 0.2 | 0.8 | 0.9 | 0.2 | 0.8 | 0.3 | 0.1 | 0.2 | 8.8 | 1.6 | 7.1 | 7.0 | 1.3 | 5.6 | 0.9 | 0.2 | 0.7 |
| Common beans | 9.6 | 1.3 | 2.7 | 7.7 | 1.1 | 2.1 | 9.4 | 1.3 | 2.6 | 8.5 | 1.2 | 2.3 | 6.6 | 0.9 | 1.8 | 9.1 | 1.2 | 2.5 |
| Maize grains | 0.3 | 0.3 | 0.4 | 0.6 | 0.6 | 0.7 | 0.4 | 0.4 | 0.5 | 0.7 | 0.7 | 0.8 | 0.6 | 0.6 | 0.7 | 0.6 | 0.6 | 0.7 |
| Cassava tubers | 0.3 | 0.1 | 0.8 | 0.7 | 0.2 | 1.5 | 1.3 | 0.4 | 2.9 | 2.1 | 0.7 | 4.5 | 1.4 | 0.4 | 3.0 | 0.4 | 0.1 | 1.0 |
| OUT2 Fodder | 17 | 2.6 | 29 | 13 | 2.3 | 26 | 4.1 | 0.5 | 8.2 | 116 | 20 | 164 | 32 | 5.2 | 47 | 8.9 | 1.1 | 10 |
| OUT3 Wood | 27 | 5.3 | 9.0 | 23 | 4.4 | 7.5 | 14 | 2.7 | 4.5 | 27 | 5.3 | 9.0 | 23 | 4.4 | 7.5 | 14 | 2.7 | 4.5 |
| Firewood | 9.1 | 1.8 | 3.0 | 9.1 | 1.8 | 3.0 | 9.1 | 1.8 | 3.0 | 9.1 | 1.8 | 3.0 | 9.1 | 1.8 | 3.0 | 9.1 | 1.8 | 3.0 |
| Timber | 9.1 | 1.8 | 3.0 | 9.1 | 1.8 | 3.0 | 4.5 | 0.9 | 1.5 | 9.1 | 1.8 | 3.0 | 9.1 | 1.8 | 3.0 | 4.5 | 0.9 | 1.5 |
| For sale | 9.1 | 1.8 | 3.0 | 4.5 | 0.9 | 1.5 | 0.0 | 0.0 | 0.0 | 9.1 | 1.8 | 3.0 | 4.5 | 0.9 | 1.5 | 0.0 | 0.0 | 0.0 |
| Nutrients withdrawn by plants | 105 | 16 | 78 | 82 | 13 | 66 | 50 | 7.8 | 37 | 242 | 41 | 291 | 116 | 20 | 121 | 53 | 8.0 | 37 |
| OUT4 Sold on the market | 25 | 4.1 | 14 | 11 | 1.8 | 6.6 | 5.0 | 0.7 | 4.2 | 54 | 9.2 | 68 | 25 | 4.5 | 27 | 4.1 | 0.6 | 3.3 |
| Banana | 1.3 | 0.2 | 2.5 | 0.5 | 0.1 | 1.0 | 0.2 | 0.0 | 0.3 | 28 | 4.5 | 50 | 9.3 | 1.5 | 17 | 0.5 | 0.1 | 0.9 |
| Coffee | 4.3 | 0.4 | 5.0 | 2.2 | 0.2 | 2.5 | 2.2 | 0.2 | 2.5 | 6.5 | 0.6 | 7.5 | 3.2 | 0.3 | 3.7 | 1.1 | 0.1 | 1.2 |
| Beans | 9.6 | 1.3 | 2.7 | 3.1 | 0.4 | 0.9 | 2.3 | 0.3 | 0.6 | 8.5 | 1.2 | 2.3 | 6.6 | 0.9 | 1.8 | 2.3 | 0.3 | 0.6 |
| Maize | 0.3 | 0.2 | 0.6 | 0.2 | 0.1 | 0.4 | 0.1 | 0.1 | 0.2 | 0.7 | 0.4 | 1.4 | 0.6 | 0.4 | 1.3 | 0.1 | 0.1 | 0.3 |
| Cassava | 0.2 | 0.1 | 0.5 | 0.1 | 0.1 | 0.3 | 0.2 | 0.1 | 0.5 | 1.3 | 0.7 | 3.1 | 0.8 | 0.4 | 2.1 | 0 | 0 | 0.2 |
| Wood | 9.1 | 1.8 | 3.0 | 4.5 | 0.9 | 1.5 | 0.0 | 0.0 | 0.0 | 9.1 | 1.8 | 3.0 | 4.5 | 0.9 | 1.5 | 0 | 0 | 0 |
| OUT5 Residues given away | 0 | 0 | 0 | 0 | 0 | 0 | 1.4 | 0.9 | 4.0 | 0 | 0 | 0 | 0 | 0 | 0 | 1.0 | 0.3 | 2.9 |
| OUT6 Leaching from soil/runoff | 21 | n.d. | 11 | 21 | n.d. | 11 | 21 | n.d. | 11 | 21 | n.d. | 11 | 21 | n.d. | 11.0 | 21 | n.d. | 11 |
| OUT7 Human excreta | 24 | 4.6 | 28 | 20 | 3.8 | 18 | 11.2 | 2.1 | 8.7 | 13 | 2.5 | 17 | 11.6 | 2.2 | 12 | 11 | 2.1 | 11 |
| Faeces | 5.4 | 1.1 | 17 | 2.5 | 0.5 | 7.6 | 0.8 | 0.2 | 2.6 | 3.6 | 0.7 | 11 | 2.3 | 0.5 | 6.9 | 1.7 | 0.4 | 5.3 |
| Urine | 19 | 3.5 | 11 | 18 | 3.3 | 11 | 10 | 1.9 | 6.2 | 9.7 | 1.8 | 5.7 | 9.3 | 1.7 | 5.5 | 9.3 | 1.7 | 5.5 |
| OUT8 Discharge | 6.0 | n.d. | n.d. | 6.0 | n.d. | n.d. | 6.0 | n.d. | n.d. | 6.0 | n.d. | n.d. | 6.0 | n.d. | n.d. | 6.0 | n.d. | n.d. |
| OUT9 Gaseous losses, soil | 20 | 0 | 0 | 20 | 0 | 0 | 20 | 0 | 0 | 20 | 0 | 0 | 20 | 0 | 0 | 20 | 0 | 0 |
| OUT10 Leaching from pit latrine | 7.2 | 1.4 | 8.3 | 6.0 | 1.1 | 5.4 | 3.4 | 0.6 | 2.6 | 4.0 | 0.8 | 5.0 | 3.5 | 0.7 | 3.7 | 3.3 | 0.6 | 3.3 |
| STOCK1 Human | 2.3 | 0.4 | 0.9 | 2.0 | 0.4 | 1.0 | 2.3 | 0.4 | 1.2 | 4.0 | 0.8 | 3.0 | 3.1 | 0.6 | 2.2 | 2.2 | 0.4 | 1.0 |
| STOCK2 Animal | 3.4 | 0.5 | 5.9 | 2.7 | 0.5 | 5.1 | 0.8 | 0.1 | 1.6 | 23 | 4.0 | 33 | 6.4 | 1.0 | 9.4 | 1.8 | 0.2 | 2.0 |
| STOCK3 Pit latrine | 90 | 12 | 102 | 72 | 10 | 80 | 45 | 7.3 | 43.7 | 9.3 | 1.8 | 11.6 | 110 | 17 | 146 | 85 | 11 | 77 |
| S0. Business as usual | ||||||||||||||||||
| Inflow | 137 | 17 | 161 | 111 | 17 | 147 | 57 | 10.4 | 67 | 414 | 66 | 575 | 204 | 30 | 274 | 77 | 9.2 | 70 |
| Total, outflow | −213 | −19 | −119 | −191 | −17 | −100 | −139 | −15 | −62 | −317 | −42 | −315 | −192 | −21 | −143 | −133 | −10.1 | −59 |
| Nutrient balance | −76 | −2 | 43 | −81 | −1 | 47 | −82 | −5 | 5 | 97 | 24 | 260 | 12 | 9 | 131 | −56 | −1 | 11 |
| S1. Human urine used | ||||||||||||||||||
| Inflow | 152 | 17 | 161 | 125 | 17 | 147 | 66 | 10 | 67 | 422 | 66 | 575 | 211 | 30 | 274 | 84 | 9 | 70 |
| Outflow | −197 | −15 | −102 | −173 | −13 | −84 | −125 | −9 | −55 | −309 | −40 | −309 | −185 | −19 | −137 | −127 | −9 | −57 |
| Nutrient balance | −44 | 2 | 59 | −48 | 4 | 64 | −60 | 2 | 12 | 112 | 26 | 265 | 27 | 11 | 137 | −42 | 1 | 13 |
| S2. Legumes planted | ||||||||||||||||||
| Inflow | 169 | 17 | 161 | 142 | 17 | 147 | 83 | 10 | 67 | 439 | 66 | 575 | 228 | 30 | 274 | 101 | 9 | 70 |
| Outflow | −213 | −19 | −119 | −191 | −17 | −100 | −139 | −15 | −62 | −317 | −42 | −315 | −192 | −21 | −143 | −133 | −10 | −59 |
| Nutrient balance | −44 | −2 | 43 | −49 | −1 | 47 | −57 | −5 | 5 | 122 | 24 | 260 | 36 | 9 | 131 | −31 | −1 | 11 |
| S3. CaSa-compost used IV | ||||||||||||||||||
| Inflow | 144 | 21 | 178 | 117 | 20 | 164 | 64 | 14 | 84 | 421 | 70 | 592 | 211 | 34 | 291 | 84 | 13 | 86 |
| Outflow | −195 | −14 | −94 | −172 | −13 | −80 | −125 | −9 | −54 | −308 | −40 | −304 | −184 | −19 | −134 | −126 | −8 | −54 |
| Nutrient balance | −50 | 6 | 84 | −54 | 7 | 84 | −61 | 5 | 30 | 113 | 30 | 288 | 27 | 15 | 157 | −42 | 4 | 33 |
| S4. Combination of S1 + S2 + S3 | ||||||||||||||||||
| Inflow | 176 | 21 | 178 | 149 | 20 | 164 | 89 | 14 | 84 | 446 | 70 | 592 | 235 | 34 | 291 | 108 | 13 | 86 |
| Outflow | −195 | −14 | −94 | −172 | −13 | −80 | −125 | −9 | −54 | −308 | −40 | −304 | −184 | −19 | −134 | −126 | −8 | −54 |
| Nutrient balance | −19 | 6 | 84 | −23 | 7 | 84 | −36 | 5 | 30 | 138 | 30 | 288 | 51 | 15 | 157 | −17 | 4 | 33 |
| Annual Manure Production and Nutrient Concentrations | Household Groups | ||||||
|---|---|---|---|---|---|---|---|
| Unit | AU | AT | BU | BT | CU | CT | |
| Cattle, homegarden | |||||||
| Dung | kg yr−1 | 915 | 9153 | 1373 | 2746 | 0 | 0 |
| N | kg yr−1 | 11 | 110 | 16 | 33 | 0 | 0 |
| P | kg yr−1 | 2.7 | 27 | 4.1 | 8.2 | 0 | 0 |
| K | kg yr−1 | 19 | 192 | 29 | 58 | 0 | 0 |
| Urine | m3 yr−1 | 0.7 | 7.3 | 1.1 | 2.2 | 0 | 0 |
| N | kg yr−1 | 5.0 | 57 | 7.4 | 15 | 0 | 0 |
| Cattle, grassland | |||||||
| Dung | kg yr−1 | 30,205 | 118,990 | 14,187 | 45,765 | 0 | 0 |
| N | kg yr−1 | 362 | 1408 | 170 | 553 | 0 | 0 |
| P | kg yr−1 | 91 | 357 | 43 | 137 | 0 | 0 |
| K | kg yr−1 | 634 | 2539 | 298 | 961 | 0 | 0 |
| Urine | m3 yr−1 | 24 | 95 | 11 | 37 | 0 | 0 |
| N | kg yr−1 | 164 | 649 | 77 | 252 | 0 | 0 |
| Goats, sheep, pigs | |||||||
| Dung | kg yr−1 | 3011 | 5475 | 2464 | 3285 | 1095 | 821 |
| N | kg yr−1 | 49 | 82 | 37 | 53 | 16 | 12 |
| P | kg yr−1 | 6.0 | 11 | 4.9 | 6.6 | 2.2 | 1.6 |
| K | kg yr−1 | 90 | 164 | 74 | 99 | 33 | 25 |
| Urine | m3 yr−1 | 3.0 | 5.5 | 2.5 | 3.3 | 1.1 | 0.8 |
| N | kg yr−1 | 9.0 | 16 | 7.4 | 10 | 3.3 | 2.5 |
| Chickens | |||||||
| Dung | kg yr−1 | 365 | 3650 | 0 | 1460 | 0 | 730 |
| N | kg yr−1 | 12 | 117 | 0 | 47 | 0 | 23 |
| P | kg yr−1 | 1.5 | 15 | 0 | 5.8 | 0 | 2.9 |
| K | kg yr−1 | 8.0 | 80 | 0 | 32 | 0 | 16 |
| Human Excreta | Household Groups | ||||||
|---|---|---|---|---|---|---|---|
| Unit | AU | BU | CU | AT | BT | CT | |
| Number of farm households | hh group−1 | 58 | 52 | 44 | 296 | 262 | 198 |
| Homegarden size (average) | ha | 2.8 | 1.8 | 0.6 | 1.4 | 0.7 | 0.5 |
| Household size | p hh−1 | 10.2 | 9.7 | 5.7 | 5.3 | 5.1 | 5.1 |
| Amount of faeces | kg hh−1 yr−1 | 376 | 172 | 59 | 248 | 157 | 122 |
| N | kg hh−1 yr−1 | 6.8 | 3.1 | 1.1 | 4.5 | 2.8 | 2.2 |
| P | kg hh−1 yr−1 | 1.1 | 0.5 | 0.2 | 0.7 | 0.5 | 0.4 |
| K | kg hh−1 yr−1 | 17 | 7.6 | 2.6 | 11 | 6.9 | 5.3 |
| Amount of urine | L hh−1 yr−1 | 5212 | 4957 | 2913 | 2708 | 2606 | 2606 |
| N | kg hh−1 yr−1 | 69 | 62 | 36 | 37 | 34 | 33 |
| P | kg hh−1 yr−1 | 4.6 | 3.8 | 2.1 | 2.5 | 2.2 | 2.1 |
| K | kg hh−1 yr−1 | 28 | 18 | 9 | 17 | 12 | 11 |
| Total amounts of nutrients in human excreta … | |||||||
| … after 70% ammonia losses in urine | |||||||
| N | kg hh−1 yr−1 | 25 | 21 | 11 | 14 | 12 | 11 |
| … used in composting | |||||||
| N | kg hh−1 yr−1 | 4.8 | 7.4 | 4.3 | 0.0 | 0.0 | 0.0 |
| P | kg hh−1 yr−1 | 0.9 | 1.4 | 1.7 | 0.0 | 0.0 | 0.0 |
| K | kg hh−1 yr−1 | 5.2 | 6.4 | 3.2 | 0.0 | 0.0 | 0.0 |
| N | kg hh−1 ha−1 yr−1 | 1.7 | 4.1 | 7.1 | 0.0 | 0.0 | 0.0 |
| P | kg hh−1 ha−1 yr−1 | 0.3 | 0.8 | 2.8 | 0.0 | 0.0 | 0.0 |
| K | kg hh−1 ha−1 yr−1 | 1.9 | 3.6 | 5.4 | 0.0 | 0.0 | 0.0 |
| … not used (pit latrine) | |||||||
| N | kg hh−1 yr−1 | 21 | 13 | 7.2 | 21 | 13 | 10 |
| P | kg hh−1 yr−1 | 3.7 | 2.5 | 1.4 | 3.1 | 2.0 | 1.5 |
| K | kg hh−1 yr−1 | 22 | 12 | 5.5 | 8 | 5 | 4 |
Publisher’s Note: MDPI stays neutral with regard to jurisdictional claims in published maps and institutional affiliations. |
© 2020 by the authors. Licensee MDPI, Basel, Switzerland. This article is an open access article distributed under the terms and conditions of the Creative Commons Attribution (CC BY) license (http://creativecommons.org/licenses/by/4.0/).
Share and Cite
Reetsch, A.; Schwärzel, K.; Dornack, C.; Stephene, S.; Feger, K.-H. Optimising Nutrient Cycles to Improve Food Security in Smallholder Farming Families—A Case Study from Banana-Coffee-Based Farming in the Kagera Region, NW Tanzania. Sustainability 2020, 12, 9105. https://doi.org/10.3390/su12219105
Reetsch A, Schwärzel K, Dornack C, Stephene S, Feger K-H. Optimising Nutrient Cycles to Improve Food Security in Smallholder Farming Families—A Case Study from Banana-Coffee-Based Farming in the Kagera Region, NW Tanzania. Sustainability. 2020; 12(21):9105. https://doi.org/10.3390/su12219105
Chicago/Turabian StyleReetsch, Anika, Kai Schwärzel, Christina Dornack, Shadrack Stephene, and Karl-Heinz Feger. 2020. "Optimising Nutrient Cycles to Improve Food Security in Smallholder Farming Families—A Case Study from Banana-Coffee-Based Farming in the Kagera Region, NW Tanzania" Sustainability 12, no. 21: 9105. https://doi.org/10.3390/su12219105
APA StyleReetsch, A., Schwärzel, K., Dornack, C., Stephene, S., & Feger, K.-H. (2020). Optimising Nutrient Cycles to Improve Food Security in Smallholder Farming Families—A Case Study from Banana-Coffee-Based Farming in the Kagera Region, NW Tanzania. Sustainability, 12(21), 9105. https://doi.org/10.3390/su12219105