Abstract
In this work, we consider the problem of surveying a population of young Indigenous, Montubios and Afro-Ecuadorians to study their living conditions and socioeconomic issues. We conducted a Respondent-driven sampling (RDS) survey in the canton of Riobamba, Ecuador. RDS is a network-based sampling method intended to survey hidden or hard-to-reach populations. We have obtained RDS estimates and confidence intervals of these characteristics. We have illustrated and discussed some of the assumptions of the method using some available diagnostic tools. Our results suggest that RDS is an effective methodology for studying social and economic issues of this ethnic minority in Ecuador. This technique is relatively easy to implement and has the potential to be applied to survey other hidden populations in other settings.
1. Introduction
Like any other South American country, Ecuador is ethnically diverse [1,2,3]. Most of their population is identified as mestizo (71.93%), which comprises a mixed Amerindian and Spanish heritage and the following minorities: Montubio (7.39%), Afro-ecuadorians (7.19%), Indigenous (7.03%), Whites (6.09%), and other (0.37%) [4]. Poverty and unsatisfied basic needs affects more Indigenous and Afro-Ecuadorian households, than those with mixed origins [5]. Furthermore, the incidence of extreme poverty in Indigenous and in Afro-Ecuadorian households is even higher than in mestizo families, which results in less access to education and difficulties to getting decent housing [5]. Several studies have highlighted that housing is one of the most important components in a person’s subjective well-being and overall satisfaction [6,7,8]. Chica et al. [9] recently studied the quality of life of households in Colombia, and Chica and Cano [10] studied the prices of houses using a regression-kriging method. There is evidence that issues with housing and the living standard of some groups in the population and their social exclusion can lead to health issues [11,12].
Some studies and data collected from official statistical agencies highlight the higher rate of unemployment and poor access to health, education and housing of Indigenous people and other ethnic minorities compared to those with mixed origins. [13,14,15,16,17]. Nevertheless, most ot these studies are based on sources of data and information on the living conditions of ethnic minorities in Ecuador as the Census of population and housing (CPV) 2010, the Survey on living conditions (ECV) 2014, or the National survey of employment, unemployment, and underemployment (ENEMDU) 2018, but they are not representative at the canton level and are outdated or do not take into account specific subgroups of the indigenous population (i.e., minority youth at the province or canton level). Recently, Rotondi et al. [18] showed in a Respondent-driven sampling (RDS) study held in Canada, that the Indigenous population in Toronto is also underrepresented, as the census of Statistics Canada (Canada’s National Statistical Agency) undercounts this population. More information on this group and its health issues are given in Reference [19,20]. Generally, obtaining reliable information about minority groups and ethnic minorities, in particular, is challenging for survey research professionals [21]. These groups usually represent a small size of the overall population, making it difficult to access them and typically obtaining lower response rates [22]. Furthermore, there are signs that Indigenous people may be underrepresented in the Ecuadorian National Statistics Agency. According to FENOCIN (National Confederation of Farmers, Indigenous and Black People Organizations) up to 70% of the Ecuadorian population belong to these social groups [23], but they are reluctant to be identified as members of these groups because of social prejudice and stigma [23,24,25,26]. Therefore, they are difficult to reach, they are often underestimated in surveys of official statistics [27] and using using traditional sampling to survey them can become utterly expensive.
There are some non-probabilistic methods available that account for small groups within a population and address some of these issues, like snowball sampling or Respondent-driven sampling (RDS). RDS is a snowball-type sampling method used to survey hidden populations. Those are populations that lack a reliable sampling frame and therefore are difficult to reach. RDS was first introduced by Heckathorn [28] and was developed afterwards by Salganik and Heckathorn [29] and Volz and Heckathorn [30]. RDS make use of community members’ social networks. The selection process start with a set of initial members of the target population, selected by convenience, called seeds. These respondents are given recruitment coupons (typically three), so that they recruit the next wave of participants among their known contacts within the hidden group, usually with incentives [28]. When these respondents return their coupons, they recruit the next wave of participants. This process continues until the desired sample size is reached [29]. Some popular examples of RDS are HIV at risk people, LGBTI community and injection drug users [31,32,33]. A homeless population is surveyed in Reference [34], and examples of application of RDS to migrant populations are given in Reference [35,36,37,38]. RDS is useful for overcoming limitations of traditional sampling, as it reduces privacy concerns among the participants. RDS does not require an ordinary sampling frame, and it reduces the costs involved compared to traditional sampling.
We address the problem of surveying a population of Indigenous and other ethnic minorities conducting a RDS survey in the Canton of Riobamba, Ecuador. This work may fill a gap as no such an approach has been done to study this ethnic group in Ecuador. We study their living conditions focusing on variables, such as work, income, housing, social exclusion, poverty, perception of standard of living, etc. We obtained accurate estimates on social and living conditions of these groups using the most relevant estimators in RDS. We illustrate and discuss some important characteristics of a RDS survey, such as the homophily scores and the convergence and bottleneck plots, typically used to assess that some the assumptions of this methodology are met.
2. Materials and Methods
The present study is a cross-sectional survey conducted by the University of Granada and the Superior Technical College of Chimborazo, Ecuador in collaboration with the National Confederation of Farmers, Indigenous and Black People Organizations (FENOCIN). Inclusion criteria for participants in the survey were: self-identification as Indigenous, Montubio, or Afro-ecuadorian, being 18 to 29 years old; living in city of Riobamba, having a valid ID number and giving their consent to participate in the study. First of all, the authors evaluated the suitability of RDS for surveying this group of people. The non-random selection of initial respondents, called seeds, is critical as they must have a large social network. They were selected using face to face and telephone interviews among 40 youth leaders who work on issues of interculturality, justice and solidarity for FENOCIN. They were interviewed several times to ensure their suitability. Ten seeds were selected, diverse in terms of sex, age, marital status, ethnicity, and instruction (see Table 1). The selection was based on two criteria: personal characteristics and number of connections within their social group.

Table 1.
Initial sample (seeds) for the Respondent-driven sampling (RDS) survey according to sociodemographic characteristics.
RDS methodology requires that the group of interest is a hidden population and that they form a well-connected social network. Indigenous, Montubio, and Afro-Ecuadorian populations have been studied so far in the CPV, ECV, and ENEMDU surveys, but there is no available survey focused on excluded young ethnic populations in Ecuador. More importantly, young Indigenous, Montubio, and Afro-Ecuadorians find it difficult to self-identify [23,24,25,26]. Therefore, we lack a reliable sampling frame for this group, which makes traditional sampling difficult to implement. As RDS reduces privacy concerns, it can be a convenient method for surveying such populations [28].
The Riobamba canton is home to the highest proportion of Indigenous youth in Ecuador and has the presence of young Montubios and Afro-Ecuadorians [39]. Evidence from different studies show that the Indigenous population in the canton of Chimborazo and particularly in the city of Riobamba, concentrates the vast majority of the poorest Indigenous population in the country, with essential living conditions being far from ideal [15,16,17]. The city of Riobamba has approximately 39,000 students in universities, technological institutes, etc. Most of the Montubios and Afro-Ecuadorians living in Riobamba are students that have migrated from rural areas (from the Ecuadorian coast mostly) to the city of Riobamba seeking education and better life conditions. This has led to a fusion of different social groups, that have merged into a single social network [26]. Therefore, Indigenous, Montubio, and Afro-Ecuadorian youngsters are a hidden population, and they are an interesting socio-economic group and form a social network, so that we aim to to survey this young ethnic group using RDS.
The questionnaire included eight different sections covering the following information: contact and eligibility data, informed consent, socio-demographics, housing and home, health, habits, practices and use of time, poverty, discrimination, and general satisfaction with life (see Table A1 of Appendix A). Once it was completed, respondents became recruiters and could access a different form to recruit new respondents. Both the questionnaire and the recruitment forms were hosted on the website (www.ugremina.com). After collecting the contact information on new participants at each wave, the computer system sent an email with instructions on how to use the website for filling out the survey and how to recruit up to three new participants. The computer system awaited their response in the two following weeks with up to four texts reminding them to complete the questionnaire and to invite new peers. Each recruit received a username and password by email for logging in the website. The identifiers of both the recruit and its recruiter were stored in a database, which allowed tracking the chains created from each seed. We followed the recruitment process, making sure that the RDS sample is large enough to overcome the potential bias introduced with the initial selection of seeds. We used the convergence and bottleneck plots (Figure 1 and Figure 2) to check the evolution of the RDS estimated chains. The final RDS sample is consistent with the CPV 2010 and the ENEMDU 2018 surveys. A dual system of incentives was used for promoting recruitment, as it is usually done with RDS surveys [28]. The incentive was the right to participate in a lottery where the prize was a holiday trip to Galapagos. Participants received one raffle ticket immediately after filling out the web survey and another for each (up to three) successfully recruited peer.
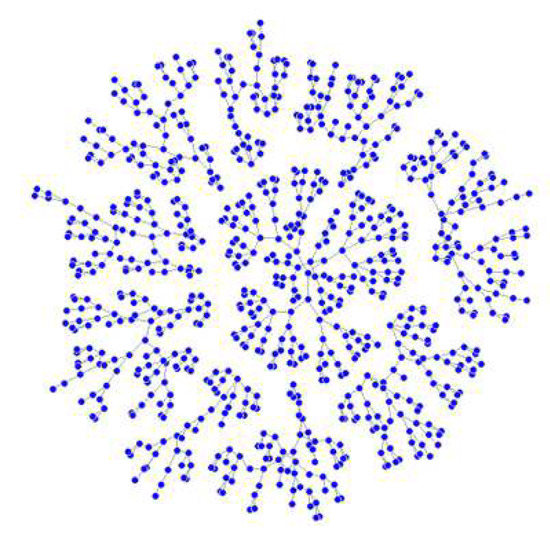
Figure 1.
Representation of the network recruitment chains for the RDS of ethnic minority urban youth in the canton of Riobamba, Ecuador.
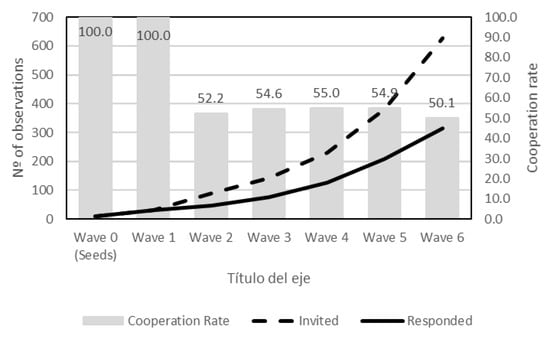
Figure 2.
Number of invitations, number of participants, and cooperation rates per RDS fieldwork wave.
To account for the RDS assumptions, we considered the convergence and bottleneck plots and the homophily ratio of variables. Homophily is the tendency to associate with those with similar characteristics. The RDS survey homophily scores are shown on Table 2 and interpreted in the next section. Convergence plots show the true population parameter with the number of recruits on the horizontal axis. This plot can help assess whether the sample is biased by the initial set of seeds. Bottleneck plots can show differences between seeds. Illustration of these two plots for the RDS ethnic survey data are given and interpreted in the next section.
Table 2.
Recruitment homophily estimates for respondents in the ethnic urban youth RDS survey.
We used the most usual estimators in RDS, which are the RDS-I ratio estimator, the RDS-II estimator [30], and the Gile and Hanckock [40] version for sampling with replacement. The RDS-I estimator for estimating proportions with binary response and groups A and B is defined as
with , is the number of people of recruiting in the sample, the number of people of recruiting in the sample,
The RDS-SS [40] estimator for estimating proportions:
with the estimated population distribution of degrees through successive sampling.
The RDS-II estimator takes the form of the Hajek estimator as follows:
with the degree reported by respondent i.
Estimators RDS-SS and RDS-II have desirable statistical properties as they are consistent and asymptotically unbiased. We used the software environment R, in particular, the RDS library (Handcock et al. 2017) and the igraph library for drawing social networks.
3. Results
As mentioned before, ten initial seeds were selected to participate and recruit up to three more respondents. Every new respondent was given the opportunity to recruit another three new participants in the study. Thirty-two of the recruits used the three coupons to recruit, 300 just two of them, 108 one, and 60 did not recruit anybody. Three of the seeds were very successful (86 or more recruited within their chains), four had a moderate success (from 66 to 85 recruited within their chains), and three a lower performance (65 or less recruited). The survey reached six waves for the 10 seeds (see Figure 1 and Figure 2).
A total of 1510 invitations were sent to potential eligible participants, and 814 completed the questionnaire, which gives a 53.9% overall cooperation rate. Valid cases and cooperation rates are distributed from the first wave to the sixth as shown in Figure 2.
3.1. Living Conditions of the Ethnic Group
We studied the living conditions of this ethnic group and compared the RDS estimates with the values obtained with official surveys CPV 2010 and ENEMDU 2018 for the regular Ecuadorian (blue color values) and those belonging to ethnic minorities (green color values). RDS estimates and confidence intervals are reported in Table 3. We computed the three usual RDS estimators (given in Section 2) for every characteristic under study and obtained similar results, which are reported in the Table A2 of Appendix A.
Table 3.
RDS estimates and 95% confidence intervals for Indigenous, Montubio, and Afro-Ecuadorian urban youth in the canton of Riobamba (n = 814) and official data for this ethnic group and for the regular Ecuadorian in Riobamba according to ENEMDU 2018.
RDS allows recruiting participants who would not normally be part of a probabilistic sample in the context of studying hidden populations. Age, marital status, and salary characteristics (for ENEMDU survey of ethnic minorities) fall outside the 95% RDS confidence interval, indicating that people who are relunctant to be identified as part of those ethnic minorities (who were captured by RDS) tend to be younger (21.81 years) than those who have no problem with their ethnic self-identification (23.25 years). Similarly, they tend to be single (81.31% compared to 55.09%) and with lower median income ($295.50 compared to $379.64). In contrast, the characteristics sex, instruction, language, work, social security, and extreme poverty fall within the interval, showing that there is no difference for these variables between those who self-identify as part of the ethnic minority and those who do not.
We compare the estimates of the total ENEMDU survey with the 95% RDS confidence intervals with the intention of identifying gaps. Table 3 shows large differences in socio-economic characteristics, such as the total ENEMDU salary and the RDS estimate ($523.58 compared to $295.496), falling the former well outside the 95% RDS confidence interval. There are also differences in instruction and social security coverage between these two groups, with the total ENEMDU values outside the confidence intervals. Moreover, 90.63% of the ethnic youngsters claim to have occasionally been victims of discrimination. Following the same arguments, there are differences in most of the housing characteristics considered in the survey (number of people living in a house, water, and energy service). Despite the important effort being done by the Ecuadorian administrations to avoid social exclusion and discrimination of these ethnic groups, there is evidence of socio-economic differences.
3.2. Assessment of the RDS Survey
We computed the homophily ratios of the characteristics under study, as shown in Table 2. Homophily is computed as the ratio of the number of recruits with the same characteristic as their recruiter to the number expected by chance [41]. A value of 1 means that there is not preferential recruitment, while values over 1 indicate homophily and values under 1 heterophily (i.e., a value a bit over 1 indicate modest homophily).
In order to assess the recruitment, we computed the homophily scores for every variable under study. Nevertheless, there are socio-economic variables that are more connected with what homophily represent, the tendency to associate with those with similar characteristics. The occupation group they work at, appear to have modest homophily. For other socio-economic characteristics, such as clothing or social security, there is very small homophily. Generally, most of the values are close to 1, indicating modest homophily or modest heterophily and therefore a satisfactory recruitment.
Convergence plots in Figure 3 show the sample values converging to the true population parameter for variables sex, instruction level, working status and income. It indicates the stabilization of values as recruitment continues, suggesting that the resulting sample is not biased by the initial selection of seeds. Similar plots and similar results have been obtained for all the other characteristics under study and for RDS-I and RDS-II estimators, but they are not reported here for ease of presentation.
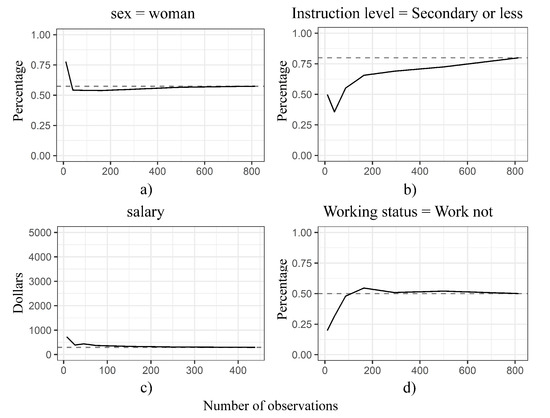
Figure 3.
Convergence plots showing the sample observations with the selected trait: (a) women, (b) lower than secondary, (c) salary and (d) not working. The dashed line shows the estimate based on the complete sample.
Figure 4 shows the bottleneck plots, which appear to converge on one point estimate for each variable, suggesting estable estimates (instead of converging on two or three, which would indicate unstable estimates and important differences between the data from different seeds). Examples of bottleneck plots are available in Reference [42]. We computed RDS-II and RDS-SS estimates for every variable in the survey. Differences between the RDSII and RDS-SS estimators are very small (under 0.01) for all variables in the survey (see Table A2 of Appendix A), indicating that the size of the population is not inducing bias in our estimates [42].
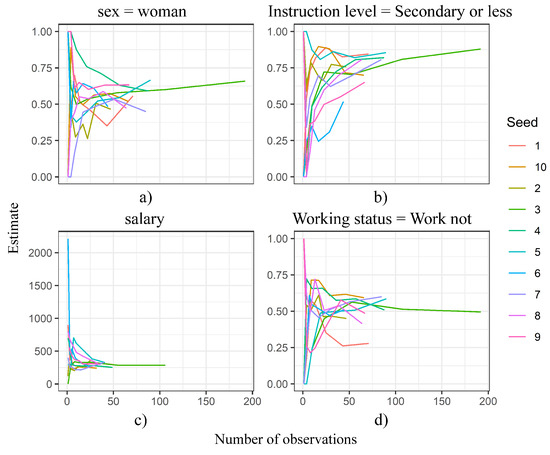
Figure 4.
Bottleneck plots showing the observations on each seed chain with the selected trait: (a) women, (b) lower than secondary, (c) salary and (d) not working.
4. Discussion
RDS has been widely used in public health studies, particularly for studying the prevalence of a desease, but there are very few examples of application to survey ethnic minorities.
We carried out a RDS survey to study the socioeconomic and living conditions of the youngest segments of Indigenous, Montubio, and Afro-Ecuadorian population in the cities of the Riobamba canton in Ecuador. We considered dimensions, such as housing, social welfare, income, poverty, social exclusion, and perception of life. We compared the RDS estimates of these characteristics for the ethnic population in Riobamba with the average Ecuadorian to check for potential gaps and differences on such dimensions.
We showed that RDS can collect information on participants who would not be recruited using traditional sampling. We showed there are differences in some socio-economic characteristics between those who self-identify as part of the ethnic group and those who are relunctant to do it. These differences suggest that RDS is an effective method for studying social and economic issues of ethnic minority urban youth in Ecuador. Furthermore, we used the RDS-II and the RDS-SS estimators, the two most important estimators in RDS, well-known among RDS practitioners for their good theoretical and practical properties.
We recruited a sample of 814 Indigenous, Montubio, and Afro-descendant urban youth over five months of fieldwork in the Riobamba canton in Ecuador. 93% of participants in the study (including the 10 initial seeds) successfully recruited at least one peer. The resulting sample is ethnically, demographically, and socioeconomically diverse and was large enough to produce estimates on the population.
A well-documented social problem is the under-registration of ethnic minorities in surveys and censuses in Ecuador. These populations can be better represented with the RDS methodology. RDS also has the potential to be useful to study sensitive issues in hidden populations, like having been victim of discrimination. With further information about a sensitive issue of interest in hidden populations, we can have a better understanding of the actual state of that issue and use it to design knowledgeable policies to address that problem, like, for instance, eradicating all forms of discrimination.
There are some limitations to this study. Its results deals with an urban young ethnic population in the Riobamba canton and cannot be generalized to other areas in Ecuador or to the rural youth in the canton (due to poor internet access). Nevertherless, RDS has the potential to be applied at the national level by studying it separately at the 24 capital cities of provinces in Ecuador. The survey is subjected to coverage bias as approximately 20% of this social group in Ecuador does not use the internet regularly. Finally, it is not clear how the network responding process could be affected by social-desirable responding in surveys using RDS sampling methods. Future research is needed on this issue as most studies using RDS deal with topics that are deemed sensitive.
RDS is an useful methodology that can be applied to a wide range of populations and contexts that are difficult to address with probability-based sampling techniques. Social researchers may consider using these techniques other hidden and/or difficult-to-reach populations.
Author Contributions
H.M. was the main contributor to the paper. He designed and carried out the RDS survey and provided useful insight on the ethnic comunities in Ecuador. I.S.-B. provided guidance, comments and help with the RDS coding. S.P.-d.-A. contributed with useful comments and guidance. All authors have read and agreed to the published version of the manuscript.
Funding
The work was supported by the Ministerio de Economia, Industria y Competitividad, Spain, under Grant MTM2015-63609-R.
Conflicts of Interest
The authors declare no conflict of interest.
Abbreviations
The following abbreviations are used in this manuscript:
| RDS | Respondent-driven sampling |
| FENOCIN | National Confederation of Farmers, Indigenous and Black People Organizations |
Appendix A
Table A1.
Variables and question wording of the RDS survey among Indigenous, Montubio and Afro-Ecuadorian urban youth in the Riobamba canton of Ecuador.
Table A1.
Variables and question wording of the RDS survey among Indigenous, Montubio and Afro-Ecuadorian urban youth in the Riobamba canton of Ecuador.
| Components | Characteristic | Question |
|---|---|---|
| Sociodemographic characteristics | Sex * | Gender |
| Age | How old are you? | |
| Marital status | What is your marital status? | |
| Ethnic self-identification | How do you identify according to your culture and customs? | |
| Canton * | In what canton were you born? | |
| Clothing * | Do you use the traditional wear of your ethnic group? | |
| Instruction * | What is the highest level of education you have successfully completed? | |
| Mother instruction | What is the highest level of education your mother successfully completed? | |
| Father instruction | What is the highest level of education your father successfully completed? | |
| Housing and home | Number quarters | How many bedrooms are in your house or apartment? |
| Number people | How many people live in your household? | |
| Water service | What is the main source of water in your household? | |
| Energy service | What is the main source of lighting for your household | |
| Health | Disability | Does any member of your household have any permanent physical, sensory or mental disability? |
| Visited | Was he/she visited by the Manuela Espejo Mission? | |
| Habits, practices and use of time | Language * | What language or languages do you commonly speak? |
| Parents language | What language or languages do your parents use with you? | |
| Enrollment | This school year, were you enrolled in…? | |
| Reason for not enrolling | If you did not enroll, what was your main reason? | |
| Class language | What is the main language of the classes in the establishment where you are enrolled? | |
| School type | What type is the establishment where you enrolled or registered? | |
| Poverty | Work * | What did you do the last week? |
| Social security | If worked, what kind of social security do you have? | |
| Occupation | If worked, in which of the following occupation groups did you work? | |
| Employment relation | If worked, in which of the following occupation categories did you work? | |
| Salary | If worked, what was the salary or total monthly wage (in dollars and before discounts) that you received for working last month? | |
| Land | Do you or any other member of your household have lands intended for agricultural uses (lots, parcels or farms)? | |
| Harvest | During the last 12 months, did you harvest or receive any agricultural product from this land? | |
| Animals | During the last 12 months, did you or any other member in your household raised animals, such as chickens, turkeys, guinea pigs, rabbits, pigs, sheep, cattle, etc., on this farm or land? | |
| Poverty * | How do you consider your household according to its economic condition? | |
| Discrimination perception | Victim * | Have you been a victim of episodes of discrimination? |
| General satisfaction | On a scale of 1 to 10 where 1 means totally unhappy and 10 means totally happy, how is your overall satisfaction considering all aspects of your life? |
An estimate of N = 11,920 (according to CPV 2010 survey) has been used. It is required for computing RDS-SS estimator. * Binary responses not conditioned to responses to other survey questions.
Table A2.
RDS-I, RDS-II and RDS-SS estimates for all the variables in the survey.
Table A2.
RDS-I, RDS-II and RDS-SS estimates for all the variables in the survey.
| Variable | Category | RDS Estimate | 95% Confidence Interval | Design Effect | SD | n | ||
|---|---|---|---|---|---|---|---|---|
| Sex | Man | RDS-I | 0.4268 | 0.3896 | 0.4640 | 1.2865 | 0.0190 | |
| RDS-II | 0.4254 | 0.3460 | 0.5048 | 5.8653 | 0.0405 | 364 | ||
| RDS-SS | 0.4261 | 0.3470 | 0.5051 | 5.8066 | 0.0403 | |||
| Woman | RDS-I | 0.5732 | 0.5360 | 0.6104 | 1.2865 | 0.0190 | ||
| RDS-II | 0.5746 | 0.4952 | 0.6540 | 5.8653 | 0.0405 | 450 | ||
| RDS-SS | 0.5739 | 0.4949 | 0.6530 | 5.8066 | 0.0403 | |||
| Age | RDS-I | 21.7910 | 21.5480 | 22.0340 | 1.3243 | 0.1241 | ||
| RDS-II | 21.8060 | 21.2930 | 22.3180 | 5.7834 | 0.2615 | 814 | ||
| RDS-SS | 21.8130 | 21.3020 | 22.3240 | 5.7469 | 0.2607 | |||
| Marital status | Married-free union | RDS-I | 0.1783 | 0.1523 | 0.2043 | 1.0471 | 0.0133 | |
| RDS-II | 0.1820 | 0.1321 | 0.2319 | 3.7991 | 0.0254 | 163 | ||
| RDS-SS | 0.1827 | 0.1330 | 0.2323 | 3.7594 | 0.0253 | |||
| Divorced-separated | RDS-I | 0.0040 | 0.0008 | 0.0072 | 0.5995 | 0.0017 | ||
| RDS-II | 0.0036 | 0.0015 | 0.0057 | 0.2821 | 0.0011 | 4 | ||
| RDS-SS | 0.0037 | 0.0015 | 0.0058 | 0.2806 | 0.0011 | |||
| Single | RDS-I | 0.8170 | 0.7908 | 0.8432 | 1.0439 | 0.0134 | ||
| RDS-II | 0.8138 | 0.7638 | 0.8639 | 3.7616 | 0.0255 | 646 | ||
| RDS-SS | 0.8131 | 0.7632 | 0.8630 | 3.7236 | 0.0254 | |||
| Widower | RDS-I | 0.0007 | 0.0000 | 0.0016 | 0.2444 | 0.0004 | ||
| RDS-II | 0.0005 | 0.0003 | 0.0008 | 0.0271 | 0.0001 | 1 | ||
| RDS-SS | 0.0006 | 0.0003 | 0.0008 | 0.0316 | 0.0001 | |||
| Ethnic self-identification | Afro-Ecuadorian | RDS-I | 0.0456 | 0.0349 | 0.0564 | 0.6019 | 0.0055 | |
| RDS-II | 0.0502 | 0.0322 | 0.0682 | 1.5400 | 0.0092 | 44 | ||
| RDS-SS | 0.0504 | 0.0324 | 0.0683 | 1.5320 | 0.0092 | |||
| Indigenous | RDS-I | 0.9250 | 0.9073 | 0.9428 | 1.0331 | 0.0091 | ||
| RDS-II | 0.9197 | 0.8798 | 0.9596 | 4.8974 | 0.0203 | 749 | ||
| RDS-SS | 0.9197 | 0.8804 | 0.9590 | 4.7620 | 0.0201 | |||
| Montubio | RDS-I | 0.0294 | 0.0148 | 0.0439 | 1.6982 | 0.0074 | ||
| RDS-II | 0.0301 | 0.0000 | 0.0665 | 10.3560 | 0.0186 | 21 | ||
| RDS-SS | 0.0299 | 0.0000 | 0.0658 | 10.0820 | 0.0183 | |||
| Canton | Other | RDS-I | 0.5549 | 0.5151 | 0.5947 | 1.4589 | 0.0203 | |
| RDS-II | 0.5502 | 0.4690 | 0.6314 | 6.0572 | 0.0414 | 475 | ||
| RDS-SS | 0.5514 | 0.4699 | 0.6328 | 6.0943 | 0.0415 | |||
| Riobamba | RDS-I | 0.4451 | 0.4053 | 0.4849 | 1.4589 | 0.0203 | ||
| RDS-II | 0.4498 | 0.3686 | 0.5310 | 6.0572 | 0.0414 | 339 | ||
| RDS-SS | 0.4486 | 0.3672 | 0.5301 | 6.0943 | 0.0415 | |||
| Clothing | No | RDS-I | 0.4417 | 0.4025 | 0.4809 | 1.4188 | 0.0200 | |
| RDS-II | 0.4407 | 0.3587 | 0.5227 | 6.2000 | 0.0418 | 340 | ||
| RDS-SS | 0.4401 | 0.3583 | 0.5219 | 6.1688 | 0.0417 | |||
| Yes | RDS-I | 0.5583 | 0.5191 | 0.5975 | 1.4188 | 0.0200 | ||
| RDS-II | 0.5593 | 0.4773 | 0.6413 | 6.2000 | 0.0418 | 474 | ||
| RDS-SS | 0.5599 | 0.4781 | 0.6417 | 6.1688 | 0.0417 | |||
| Instruction | Secondary or less | RDS-I | 0.8040 | 0.7795 | 0.8284 | 0.8639 | 0.0125 | |
| RDS-II | 0.7999 | 0.7559 | 0.8438 | 2.7416 | 0.0224 | 624 | ||
| RDS-SS | 0.7985 | 0.7546 | 0.8424 | 2.7214 | 0.0224 | |||
| At least university | RDS-I | 0.1960 | 0.1716 | 0.2205 | 0.8639 | 0.0125 | ||
| RDS-II | 0.2001 | 0.1562 | 0.2441 | 2.7416 | 0.0224 | 190 | ||
| RDS-SS | 0.2015 | 0.1576 | 0.2454 | 2.7214 | 0.0224 | |||
| Mother instruction | Secondary or less | RDS-I | 0.8937 | 0.8772 | 0.9102 | 0.6537 | 0.0084 | |
| RDS-II | 0.8897 | 0.8367 | 0.9428 | 6.5288 | 0.0271 | 712 | ||
| RDS-SS | 0.8893 | 0.8375 | 0.9411 | 6.2066 | 0.0264 | |||
| At least university | RDS-I | 0.1063 | 0.0898 | 0.1228 | 0.6537 | 0.0084 | ||
| RDS-II | 0.1103 | 0.0572 | 0.1633 | 6.5288 | 0.0271 | 102 | ||
| RDS-SS | 0.1107 | 0.0589 | 0.1625 | 6.2066 | 0.0264 | |||
| Father instruction | Secondary or less | RDS-I | 0.9426 | 0.9325 | 0.9527 | 0.4280 | 0.0051 | |
| RDS-II | 0.9417 | 0.9270 | 0.9564 | 0.8974 | 0.0075 | 754 | ||
| RDS-SS | 0.9412 | 0.9264 | 0.9560 | 0.8955 | 0.0075 | |||
| At least university | RDS-I | 0.0574 | 0.0473 | 0.0675 | 0.4280 | 0.0051 | ||
| RDS-II | 0.0583 | 0.0436 | 0.0730 | 0.8974 | 0.0075 | 60 | ||
| RDS-SS | 0.0588 | 0.0440 | 0.0736 | 0.8955 | 0.0075 | |||
| Number quarters | RDS-I | 2.7550 | 2.6792 | 2.8308 | 1.0495 | 0.0387 | ||
| RDS-II | 2.8098 | 2.6223 | 2.9974 | 5.9969 | 0.0957 | 814 | ||
| RDS-SS | 2.8083 | 2.6214 | 2.9952 | 5.9538 | 0.0954 | |||
| Number people | RDS-I | 4.9082 | 4.7044 | 5.1121 | 1.9424 | 0.1040 | ||
| RDS-II | 4.6912 | 4.4334 | 4.9490 | 3.8184 | 0.1315 | 814 | ||
| RDS-SS | 4.6901 | 4.4354 | 4.9448 | 3.7184 | 0.1300 | |||
| Water service | Bulk water or other | RDS-I | 0.0802 | 0.0600 | 0.1004 | 1.2623 | 0.0103 | |
| RDS-II | 0.0793 | 0.0538 | 0.1049 | 2.0368 | 0.0131 | 66 | ||
| RDS-SS | 0.0793 | 0.0539 | 0.1047 | 2.0048 | 0.0129 | |||
| Pipeline | RDS-I | 0.9198 | 0.8996 | 0.9400 | 1.2623 | 0.0103 | ||
| RDS-II | 0.9207 | 0.8951 | 0.9462 | 2.0368 | 0.0131 | 748 | ||
| RDS-SS | 0.9207 | 0.8953 | 0.9461 | 2.0048 | 0.0129 | |||
| Energy service | Public company | RDS-I | 0.9531 | 0.9381 | 0.9681 | 1.1484 | 0.0077 | |
| RDS-II | 0.9525 | 0.9345 | 0.9705 | 1.6318 | 0.0092 | 774 | ||
| RDS-SS | 0.9524 | 0.9345 | 0.9704 | 1.6166 | 0.0092 | |||
| Generator. candle or other | RDS-I | 0.0469 | 0.0319 | 0.0619 | 1.1484 | 0.0077 | ||
| RDS-II | 0.0475 | 0.0295 | 0.0655 | 1.6318 | 0.0092 | 40 | ||
| RDS-SS | 0.0476 | 0.0296 | 0.0655 | 1.6166 | 0.0092 | |||
| Disability | No | RDS-I | 0.8809 | 0.8514 | 0.9105 | 1.8925 | 0.0151 | |
| RDS-II | 0.8823 | 0.8243 | 0.9403 | 7.3672 | 0.0296 | 728 | ||
| RDS-SS | 0.8827 | 0.8250 | 0.9405 | 7.3228 | 0.0295 | |||
| Yes | RDS-I | 0.1191 | 0.0895 | 0.1486 | 1.8925 | 0.0151 | ||
| RDS-II | 0.1177 | 0.0597 | 0.1757 | 7.3672 | 0.0296 | 86 | ||
| RDS-SS | 0.1173 | 0.0595 | 0.1750 | 7.3228 | 0.0295 | |||
| Visited | No | RDS-I | 1.0000 | - | - | - | - | |
| RDS-II | 0.6520 | 0.4504 | 0.8535 | 4.0361 | 0.1028 | 56 | ||
| RDS-SS | 0.6520 | 0.4507 | 0.8533 | 4.0270 | 0.1027 | |||
| Yes | RDS-I | 0.0000 | - | - | - | - | ||
| RDS-II | 0.3480 | 0.1465 | 0.5496 | 4.0361 | 0.1028 | 30 | ||
| RDS-SS | 0.3480 | 0.1467 | 0.5493 | 4.0270 | 0.1027 | |||
| Language | Spanish | RDS-I | 0.7578 | 0.7266 | 0.7890 | 1.2048 | 0.0159 | |
| RDS-II | 0.7589 | 0.6914 | 0.8264 | 5.6623 | 0.0344 | 608 | ||
| RDS-SS | 0.7585 | 0.6918 | 0.8253 | 5.5309 | 0.0341 | |||
| Language | Indigenous | RDS-I | 0.2422 | 0.2110 | 0.2734 | 1.2048 | 0.0159 | |
| RDS-II | 0.2411 | 0.1736 | 0.3086 | 5.6623 | 0.0344 | 206 | ||
| RDS-SS | 0.2415 | 0.1747 | 0.3082 | 5.5309 | 0.0341 | |||
| Parents language | Spanish | RDS-I | 0.2100 | 0.1766 | 0.2433 | 1.5252 | 0.0170 | |
| RDS-II | 0.2079 | 0.1455 | 0.2703 | 5.3802 | 0.0318 | 156 | ||
| RDS-SS | 0.2074 | 0.1457 | 0.2690 | 5.2522 | 0.0314 | |||
| Foreign | RDS-I | 0.0023 | 0.0000 | 0.0079 | 3.1621 | 0.0029 | ||
| RDS-II | 0.0018 | 0.0003 | 0.0032 | 0.2714 | 0.0007 | 1 | ||
| RDS-SS | 0.0018 | 0.0003 | 0.0032 | 0.2834 | 0.0008 | |||
| Foreign-Spanish | RDS-I | 0.0020 | 0.0000 | 0.0118 | 10.7650 | 0.0050 | ||
| RDS-II | 0.0018 | 0.0000 | 0.0057 | 2.0257 | 0.0020 | 1 | ||
| RDS-SS | 0.0018 | 0.0000 | 0.0058 | 2.0728 | 0.0020 | |||
| Indigenous | RDS-I | 0.1034 | 0.0788 | 0.1281 | 1.4900 | 0.0126 | ||
| RDS-II | 0.1031 | 0.0605 | 0.1457 | 4.4593 | 0.0217 | 81 | ||
| RDS-SS | 0.1031 | 0.0611 | 0.1450 | 4.3376 | 0.0214 | |||
| Indigenous-Spanish | RDS-I | 0.6823 | 0.6442 | 0.7205 | 1.5268 | 0.0195 | ||
| RDS-II | 0.6855 | 0.6150 | 0.7560 | 5.2381 | 0.0360 | 575 | ||
| RDS-SS | 0.6861 | 0.6165 | 0.7557 | 5.1144 | 0.0355 | |||
| Enrollment | Yes | RDS-I | 0.5480 | 0.5092 | 0.5868 | 1.3825 | 0.0198 | |
| RDS-II | 0.5398 | 0.4593 | 0.6203 | 5.9341 | 0.0411 | 452 | ||
| RDS-SS | 0.5405 | 0.4609 | 0.6201 | 5.8004 | 0.0406 | |||
| No | RDS-I | 0.4520 | 0.4132 | 0.4908 | 1.3825 | 0.0198 | ||
| RDS-II | 0.4602 | 0.3797 | 0.5407 | 5.9341 | 0.0411 | 362 | ||
| RDS-SS | 0.4595 | 0.3799 | 0.5391 | 5.8004 | 0.0406 | |||
| Reason not to enroll | Other | RDS-I | 0.7702 | 0.6904 | 0.8500 | 3.5045 | 0.0407 | |
| RDS-II | 0.8079 | 0.6800 | 0.9359 | 10.2810 | 0.0653 | 306 | ||
| RDS-SS | 0.8088 | 0.6803 | 0.9373 | 10.4040 | 0.0656 | |||
| Finalisation of Studies | RDS-I | 0.2298 | 0.1500 | 0.3096 | 3.5045 | 0.0407 | ||
| RDS-II | 0.1921 | 0.0641 | 0.3200 | 10.2810 | 0.0653 | 57 | ||
| RDS-SS | 0.1912 | 0.0627 | 0.3197 | 10.4040 | 0.0656 | |||
| School type | State | RDS-I | 0.8921 | 0.8627 | 0.9216 | 1.1049 | 0.0150 | |
| RDS-II | 0.8981 | 0.8539 | 0.9423 | 2.6084 | 0.0225 | 401 | ||
| RDS-SS | 0.8977 | 0.8538 | 0.9417 | 2.5703 | 0.0224 | |||
| Private | RDS-I | 0.1079 | 0.0784 | 0.1373 | 1.1049 | 0.0150 | ||
| RDS-II | 0.1019 | 0.0577 | 0.1461 | 2.6084 | 0.0225 | 51 | ||
| RDS-SS | 0.1023 | 0.0583 | 0.1462 | 2.5703 | 0.0224 | |||
| Salary | RDS-I | 301.81 | 281.49 | 322.13 | 0.4440 | 10.367 | ||
| RDS-II | 294.60 | 258.43 | 330.77 | 1.7861 | 18.453 | 439 | ||
| RDS-SS | 295.50 | 259.60 | 331.39 | 1.7204 | 18.315 | |||
| Class language | Spanish | RDS-I | 0.8972 | 0.8768 | 0.9177 | 0.5552 | 0.0104 | |
| RDS-II | 0.8740 | 0.8403 | 0.9078 | 1.2645 | 0.0172 | 386 | ||
| RDS-SS | 0.8733 | 0.8393 | 0.9072 | 1.2735 | 0.0173 | |||
| Foreign | RDS-I | 0.0118 | 0.0040 | 0.0195 | 0.6357 | 0.0040 | ||
| RDS-II | 0.0125 | 0.0013 | 0.0237 | 1.2494 | 0.0057 | 7 | ||
| RDS-SS | 0.0126 | 0.0013 | 0.0239 | 1.2486 | 0.0057 | |||
| Foreign and spanish | RDS-I | 0.0616 | 0.0468 | 0.0765 | 0.4672 | 0.0076 | ||
| RDS-II | 0.0742 | 0.0503 | 0.0982 | 1.0181 | 0.0122 | 39 | ||
| RDS-SS | 0.0747 | 0.0507 | 0.0986 | 1.0184 | 0.0122 | |||
| Foreign, spanish and indigenous | RDS-I | 0.0146 | 0.0079 | 0.0213 | 0.3825 | 0.0034 | ||
| RDS-II | 0.0173 | 0.0092 | 0.0254 | 0.4697 | 0.0041 | 10 | ||
| RDS-SS | 0.0175 | 0.0093 | 0.0257 | 0.4823 | 0.0042 | |||
| Indigenous | RDS-I | 0.0036 | 0.0000 | 0.0076 | 0.5446 | 0.0020 | ||
| RDS-II | 0.0043 | 0.0000 | 0.0098 | 0.8708 | 0.0028 | 2 | ||
| RDS-SS | 0.0043 | 0.0000 | 0.0098 | 0.8739 | 0.0028 | |||
| Indigenous and spanish | RDS-I | 0.0112 | 0.0073 | 0.0151 | 0.1696 | 0.0020 | ||
| RDS-II | 0.0177 | 0.0110 | 0.0245 | 0.3205 | 0.0034 | 8 | ||
| RDS-SS | 0.0177 | 0.0109 | 0.0246 | 0.3277 | 0.0035 | |||
| Work | No | RDS-I | 0.5046 | 0.4648 | 0.5444 | 1.4400 | 0.0203 | |
| RDS-II | 0.5021 | 0.4224 | 0.5818 | 5.7754 | 0.0407 | 375 | ||
| RDS-SS | 0.5009 | 0.4216 | 0.5801 | 5.7114 | 0.0404 | |||
| Yes | RDS-I | 0.4954 | 0.4556 | 0.5352 | 1.4400 | 0.0203 | ||
| RDS-II | 0.4979 | 0.4182 | 0.5776 | 5.7754 | 0.0407 | 439 | ||
| RDS-SS | 0.4991 | 0.4199 | 0.5784 | 5.7114 | 0.0404 | |||
| Social security | Insured | RDS-I | 0.1487 | 0.1194 | 0.1781 | 0.8064 | 0.0150 | |
| RDS-II | 0.1500 | 0.0973 | 0.2027 | 2.5840 | 0.0269 | 71 | ||
| RDS-SS | 0.1505 | 0.0983 | 0.2026 | 2.5221 | 0.0266 | |||
| Uninsured | RDS-I | 0.8513 | 0.8219 | 0.8806 | 0.8064 | 0.0150 | ||
| RDS-II | 0.8500 | 0.7973 | 0.9027 | 2.5840 | 0.0269 | 368 | ||
| RDS-SS | 0.8495 | 0.7974 | 0.9017 | 2.5221 | 0.0266 | |||
| Occupation | Directors of administration | RDS-I | 0.0190 | 0.0127 | 0.0253 | 0.2513 | 0.0032 | |
| RDS-II | 0.0399 | 0.0000 | 0.0838 | 5.9572 | 0.0224 | 15 | ||
| RDS-SS | 0.0397 | 0.0000 | 0.0826 | 5.7393 | 0.0219 | |||
| Administrative employees | RDS-I | 0.0628 | 0.0457 | 0.0798 | 0.5866 | 0.0087 | ||
| RDS-II | 0.0678 | 0.0353 | 0.1003 | 1.9862 | 0.0166 | 33 | ||
| RDS-SS | 0.0680 | 0.0359 | 0.1002 | 1.9356 | 0.0164 | |||
| Facility and machinery operators | RDS-I | 0.0250 | 0.0098 | 0.0401 | 1.1213 | 0.0077 | ||
| RDS-II | 0.0171 | 0.0071 | 0.0270 | 0.7012 | 0.0051 | 8 | ||
| RDS-SS | 0.0171 | 0.0073 | 0.0269 | 0.6763 | 0.0050 | |||
| Operators and craftsmen | RDS-I | 0.1116 | 0.0722 | 0.1510 | 1.8564 | 0.0201 | ||
| Operators and craftsmen | RDS-II | 0.0890 | 0.0394 | 0.1387 | 3.6012 | 0.0253 | 40 | |
| RDS-SS | 0.0891 | 0.0404 | 0.1379 | 3.4739 | 0.0249 | |||
| Scientists and intellectuals | RDS-I | 0.0417 | 0.0220 | 0.0613 | 1.1491 | 0.0100 | ||
| RDS-II | 0.0397 | 0.0084 | 0.0710 | 3.0509 | 0.0160 | 15 | ||
| RDS-SS | 0.0395 | 0.0088 | 0.0702 | 2.9523 | 0.0157 | |||
| Mid level technicians | RDS-I | 0.0342 | 0.0120 | 0.0564 | 1.7716 | 0.0113 | ||
| RDS-II | 0.0298 | 0.0136 | 0.0460 | 1.0788 | 0.0083 | 12 | ||
| RDS-SS | 0.0296 | 0.0135 | 0.0457 | 1.0716 | 0.0082 | |||
| Agricultural and fisheries | RDS-I | 0.0141 | 0.0102 | 0.0179 | 0.1260 | 0.0020 | ||
| RDS-II | 0.0166 | 0.0108 | 0.0223 | 0.2389 | 0.0029 | 13 | ||
| RDS-SS | 0.0171 | 0.0112 | 0.0229 | 0.2449 | 0.0030 | |||
| Occupation | Service and commerce workers | RDS-I | 0.1896 | 0.1498 | 0.2295 | 1.2255 | 0.0203 | |
| RDS-II | 0.1961 | 0.1257 | 0.2666 | 3.7358 | 0.0359 | 98 | ||
| RDS-SS | 0.1971 | 0.1273 | 0.2669 | 3.6485 | 0.0356 | |||
| Unskilled workers | RDS-I | 0.5020 | 0.4481 | 0.5560 | 1.3822 | 0.0275 | ||
| RDS-II | 0.5040 | 0.4005 | 0.6075 | 5.0865 | 0.0528 | 205 | ||
| RDS-SS | 0.5027 | 0.3996 | 0.6059 | 5.0480 | 0.0526 | |||
| Land | No | RDS-I | 0.6374 | 0.6001 | 0.6747 | 1.3689 | 0.0190 | |
| RDS-II | 0.6414 | 0.5675 | 0.7153 | 5.4001 | 0.0377 | 512 | ||
| RDS-SS | 0.6408 | 0.5681 | 0.7135 | 5.2201 | 0.0371 | |||
| Yes | RDS-I | 0.3626 | 0.3253 | 0.3999 | 1.3689 | 0.0190 | ||
| RDS-II | 0.3586 | 0.2847 | 0.4325 | 5.4001 | 0.0377 | 302 | ||
| RDS-SS | 0.3592 | 0.2865 | 0.4319 | 5.2201 | 0.0371 | |||
| Harvest | No | RDS-I | 0.2524 | 0.1989 | 0.3060 | 1.2255 | 0.0273 | |
| RDS-II | 0.2504 | 0.1139 | 0.3868 | 8.0024 | 0.0696 | 76 | ||
| RDS-SS | 0.2505 | 0.1154 | 0.3855 | 7.8356 | 0.0689 | |||
| Yes | RDS-I | 0.7476 | 0.6940 | 0.8011 | 1.2255 | 0.0273 | ||
| RDS-II | 0.7496 | 0.6132 | 0.8861 | 8.0024 | 0.0696 | 226 | ||
| RDS-SS | 0.7495 | 0.6145 | 0.8846 | 7.8356 | 0.0689 | |||
| Employment relation | Salaried | RDS-I | 0.3594 | 0.3021 | 0.4167 | 1.6911 | 0.0292 | |
| RDS-II | 0.3420 | 0.2357 | 0.4483 | 5.9597 | 0.0542 | 138 | ||
| RDS-SS | 0.3411 | 0.2364 | 0.4458 | 5.7840 | 0.0534 | |||
| Own account | RDS-I | 0.3754 | 0.3256 | 0.4252 | 1.2555 | 0.0254 | ||
| RDS-II | 0.3925 | 0.2918 | 0.4933 | 5.0492 | 0.0514 | 183 | ||
| RDS-SS | 0.3935 | 0.2945 | 0.4925 | 4.8738 | 0.0505 | |||
| Domestic employee | RDS-I | 0.1275 | 0.0894 | 0.1657 | 1.5496 | 0.0195 | ||
| RDS-II | 0.1237 | 0.0681 | 0.1794 | 3.3866 | 0.0284 | 51 | ||
| RDS-SS | 0.1234 | 0.0683 | 0.1784 | 3.3275 | 0.0281 | |||
| Employer or active partner | RDS-I | 0.0351 | 0.0189 | 0.0513 | 0.9242 | 0.0083 | ||
| RDS-II | 0.0331 | 0.0162 | 0.0500 | 1.0615 | 0.0086 | 16 | ||
| RDS-SS | 0.0332 | 0.0163 | 0.0501 | 1.0588 | 0.0086 | |||
| Unpaid family worker | RDS-I | 0.1025 | 0.0758 | 0.1293 | 0.9216 | 0.0136 | ||
| RDS-II | 0.1086 | 0.0639 | 0.1534 | 2.4549 | 0.0228 | 51 | ||
| RDS-SS | 0.1089 | 0.0644 | 0.1533 | 2.4155 | 0.0227 | |||
| Animals | No | RDS-I | 0.2879 | 0.2190 | 0.3567 | 1.8633 | 0.0351 | |
| RDS-II | 0.2569 | 0.1231 | 0.3907 | 7.5658 | 0.0683 | 73 | ||
| RDS-SS | 0.2566 | 0.1234 | 0.3897 | 7.4986 | 0.0679 | |||
| Yes | RDS-I | 0.7121 | 0.6433 | 0.7810 | 1.8633 | 0.0351 | ||
| RDS-II | 0.7431 | 0.6093 | 0.8769 | 7.5658 | 0.0683 | 229 | ||
| RDS-SS | 0.7434 | 0.6103 | 0.8766 | 7.4986 | 0.0679 | |||
| Poverty | Extreme poverty | RDS-I | 0.0902 | 0.0677 | 0.1126 | 1.3843 | 0.0114 | |
| RDS-II | 0.0938 | 0.0509 | 0.1366 | 4.8772 | 0.0219 | 71 | ||
| RDS-SS | 0.0935 | 0.0506 | 0.1364 | 4.8907 | 0.0219 | |||
| No extreme poverty | RDS-I | 0.9098 | 0.8874 | 0.9323 | 1.3843 | 0.0114 | ||
| RDS-II | 0.9062 | 0.8634 | 0.9491 | 4.8772 | 0.0219 | 737 | ||
| RDS-SS | 0.9065 | 0.8636 | 0.9494 | 4.8907 | 0.0219 | |||
| Victim | Frequently | RDS-I | 0.0925 | 0.0748 | 0.1102 | 0.8476 | 0.0090 | |
| RDS-II | 0.0932 | 0.0502 | 0.1362 | 4.9735 | 0.0219 | 87 | ||
| RDS-SS | 0.0937 | 0.0507 | 0.1367 | 4.9493 | 0.0219 | |||
| Occasionally | RDS-I | 0.9075 | 0.8898 | 0.9252 | 0.8476 | 0.0090 | ||
| RDS-II | 0.9068 | 0.8638 | 0.9498 | 4.9735 | 0.0219 | 727 | ||
| RDS-SS | 0.9063 | 0.8633 | 0.9493 | 4.9493 | 0.0219 | |||
| General satisfaction | RDS-I | 8.5455 | 8.4242 | 8.6669 | 1.6210 | 0.0619 | ||
| RDS-II | 8.5468 | 8.2907 | 8.8028 | 6.9519 | 0.1306 | 814 | ||
| RDS-SS | 8.5506 | 8.2982 | 8.8029 | 6.7684 | 0.1288 | |||
References
- Zambrano, A.K.; Gaviria, A.; Cobos-Navarrete, S.; Gruezo, C.; Rodríguez-Pollit, C.; Armendáriz-Castillo, I.; García-Cárdenas, J.M.; Guerrero, S.; López-Cortés, A.; Leone, P.E.; et al. The three-hybrid genetic composition of an Ecuadorian population using AIMs-InDels compared with autosomes, mitochondrial DNA and Y chromosome data. Sci. Rep. 2019, 9. [Google Scholar] [CrossRef] [PubMed]
- Moya, J. Migration and the historical formation of Latin America in a global perspective. Sociologias 2018, 20. [Google Scholar] [CrossRef]
- Wade, P. Race and Ethnicity in Latin America, 2nd ed.; Pluto Press: London, NY, USA, 2010. [Google Scholar]
- Instituto Nacional de Estadística y Censos. El Censo Informa: Educación. 2010. Available online: http://www.ecuadorencifras.gob.ec/wp-content/descargas/Presentaciones/capitulo_educacion_censo_poblacion_vivienda.pdf (accessed on 2 September 2020).
- Secretaría Nacional de Planificación y Desarrollo. Plan Nacional de Desarrollo 2017–2021. 2017. Available online: http://www.planificacion.gob.ec/wp-content/uploads/downloads/2017/10/PNBV-26-OCT-FINAL_0K.compressed1.pdf (accessed on 1 August 2020).
- Fraze, T.K.; Brewster, A.L.; Lewis, V.A.; Beidler, L.B.; Murray, G.F.; Colla, C.H. Prevalence of Screening for Food Insecurity, Housing Instability, Utility Needs, Transportation Needs, and Interpersonal Violence by US Physician Practices and Hospitals. JAMA Netw. Open 2019, 2, e1911514. [Google Scholar] [CrossRef] [PubMed]
- Clapham, D.; Foye, C.; Christian, J. The Concept of Subjective Well-being in Housing Research. Hous. Theory Soc. 2018, 35, 261–280. [Google Scholar] [CrossRef]
- Ruiz, C.; Hernández-Fernaud, E.; Rolo-González, G.; Hernández, B. Neighborhoods’ Evaluation: Influence on Well-Being Variables. Front. Psychol. 2019, 10, 1736. [Google Scholar] [CrossRef] [PubMed]
- Chica-Olmo, J.; Sánchez, A.; Sepúlveda-Murillo, F.H. Assessing Colombia’s policy of socio-economic stratification: An intra-city study of self-reported quality of life. Cities 2020, 97, 102560. [Google Scholar] [CrossRef]
- Chica-Olmo, J.; Cano-Guervos, R. Does my house have a premium or discount in relation to my neighbors? A regression-kriging approach. Socio-Econ. Plan. Sci. 2020, 100914. [Google Scholar] [CrossRef]
- Boch, S.J.; Taylor, D.M.; Danielson, M.L.; Chisolm, D.J.; Kelleher, K.J. ‘Home is where the health is’: Housing quality and adult health outcomes in the Survey of Income and Program Participation. Prev. Med. 2020, 132, 105990. [Google Scholar] [CrossRef]
- Ledesma, E.; Ford, C.L. Health Implications of Housing Assignments for Incarcerated Transgender Women. Am. J. Public Health 2020, 110, 650–654. [Google Scholar] [CrossRef]
- Ramírez-Luzuriaga, M.; Belmont, P.; Waters, W.; Freire, W. Malnutrition inequalities in Ecuador: Differences by wealth, education level and ethnicity. Public Health Nutr. 2019, 1–9. [Google Scholar] [CrossRef]
- Pablo, Q.S.; Paloma, T.L.P.; Francisco, J.T. Energy Poverty in Ecuador. Sustainability 2019, 11, 6320. [Google Scholar] [CrossRef]
- Vásquez Egas, R. Compañías Incluyentes: ¿una Nueva Receta Para Doblegar a la Pobreza en el Ecuador? Master’s Thesis, Universidad Andina Simón Bolívar, Quito, Ecuador, 2009. [Google Scholar]
- Martínez Valle, L. Desarrollo Rural y Pueblos IndíGenas: Las Limitaciones de la Praxis Estatal y de las ONG en el Caso Ecuatoriano. Master’s Thesis, FLACSO, Quito, Ecuador, 2002. [Google Scholar]
- Jones, P. Quichua-Castilian bilingualism in the Ecuadorian Sierra. Early Child Dev. Care 1994, 102, 115–138. [Google Scholar] [CrossRef]
- Rotondi, M.A.; O’Campo, P.; O’Brien, K. Our Health Counts Toronto: Using respondent-driven sampling to unmask census undercounts of an urban indigenous population in Toronto, Canada. BMJ Open 2017, 7, e018936. [Google Scholar] [CrossRef]
- Beckett, M.; Firestone, M.A.; McKnight, C.D. A cross-sectional analysis of the relationship between diabetes and health access barriers in an urban First Nations population in Canada. BMJ Open 2018, 8, e018272. [Google Scholar] [CrossRef]
- Firestone, M.; Smylie, J.; Maracle, S.; McKnight, C.; Spiller, M.; O’Campo, P. Mental health and substance use in an urban First Nations population in Hamilton, Ontario. Can. J. Public Health 2015, 106, e375–e381. [Google Scholar] [CrossRef]
- Font, J.; Méndez, M. (Eds.) Surveying Ethnic Minorities and Immigrant Populations: Methodological Challenges and Research Strategies; Amsterdam University Press: Amsterdam, Holland, 2013. [Google Scholar]
- Feskens, R.; Hox, J.; Lensvelt-Mulders, G.; Schmeets, H. Collecting Data among Ethnic Minorities in an International Perspective. Field Methods 2006, 18, 284–304. [Google Scholar] [CrossRef]
- Chisaguano, S. La Población Indígena del Ecuador (Análisis de Estadísticas Socio-Demográficas). 2006. Available online: https://www.acnur.org/fileadmin/Documentos/Publicaciones/2009/7015.pdf (accessed on 10 August 2020).
- Larrea, C.; Torres, F.; López, N.; Rueda, M. Pueblos Indígenas, Desarrollo Humano y Discriminación en el Ecuador; Abya Yala: Quito, Ecuador, 2007. [Google Scholar]
- Araki, H. Movimientos étnicos y Multiculturalismo en el Ecuador: Pueblos Indígenas, Afrodescendientes y Montubios. Master’s Thesis, University of Kanagawa, Kanagawa, Japan, 2012. [Google Scholar]
- Uquillas, J.; Carrasco, T.; Rees, M. Exclusión Social y Estrategias de Vida de los IndíGenas Urbanos en Perú, México y Ecuador. Available online: http://repositorio.minedu.gob.pe/handle/123456789/524 (accessed on 10 August 2020).
- Erens, B. Designing high-quality surveys of ethnic minority groupsin the United Kingdom. In Surveying Ethnic Minorities and Immigrant Populations: Methodological Challenges and Research Strategies; Font, J., Méndez, M., Eds.; Amsterdam University Press: Amsterdam, Holland, 2003; pp. 45–68. [Google Scholar]
- Heckathorn, D. Respondent-driven sampling: A new approach to the study of hidden populations. Soc. Probl. 1997, 44, 174–199. [Google Scholar] [CrossRef]
- Salganik, M.J.; Heckathorn, D.D. Sampling and Estimation in Hidden Populations Using Respondent-Driven Sampling. Sociol. Methodol. 2004, 34, 193–240. [Google Scholar] [CrossRef]
- Volz, E.; Heckathorn, D. Probability based estimation theory for respondent driven sampling. J. Off. Stat. 2008, 14, 79–97. [Google Scholar]
- Kan, M.; Garfinkel, D.; Samoylova, O.; Gray, R.; Little, K. Social network methods for HIV case-finding among people who inject drugs in Tajikistan. J. Int. Aids. Soc. 2018, 21, 57–64. [Google Scholar] [CrossRef] [PubMed]
- Sypsa, V.; Psichogiou, M.; Paraskevis, D. Rapid decline in HIV incidence among persons who inject drugs during a fast-track combination prevention program after an HIV outbreak in Athens. J. Infect. Dis. 2017, 215, 1496–1505. [Google Scholar] [CrossRef] [PubMed]
- Card, K.G.; Lachowsky, N.J.; Cui, Z. Exploring the role of sex-seeking apps and websites in the social and sexual lives of gay, bisexual and other men who have sex with men: A cross-sectional study. Sex Health 2017, 14, 229–237. [Google Scholar] [CrossRef] [PubMed]
- Bernard, J.; Daňková, H.; Vašát, P. Ties, sites and irregularities: Pitfalls and benefits in using respondent-driven sampling for surveying a homeless population. Int. J. Soc. Res. Method. 2018, 21, 603–618. [Google Scholar] [CrossRef]
- Hipp, L.; Kohler, U.; Leumann, S. How to Implement Respondent-Driven Sampling in Practice: Insights from Surveying 24-Hour Migrant Home Care Workers. Surv. Methods Insights Field 2019. [Google Scholar] [CrossRef]
- Tyldum, G. Surveying migrant populations with respondent-driven sampling. Experiences from surveys of east-west migration in Europe. Int. J. Soc. Res. Method 2020. [Google Scholar] [CrossRef]
- Lattoff, S.R. Collecting data from migrants in Ghana: Lessons learned using respondent-driven sampling. Demogr. Res. 2018, 38, 1017–1058. [Google Scholar] [CrossRef]
- Tyldum, G.; Johnston, L. Applying Respondent Driven Sampling to Migrant Populations. Lessons from the Field; Palgrave Macmillan UK: London, UK, 2014; pp. 1–126. [Google Scholar]
- Guzmán, M.L. Etnicidad y exclusión en Ecuador: Una mirada a partir del censo de población de 2001. Íconos Rev. Cienc. Soc. 2003, 17, 116–132. [Google Scholar] [CrossRef]
- Gile, K.; Handcock, M. Respondent-driven sampling: An assessment of current methodology. Sociol. Methodol. 2010, 40, 285–327. [Google Scholar] [CrossRef]
- Jonsson, J.; Stein, M.; Johansson, G.; Bodin, T.; Strömdahl, S. A performance assessment of web-based respondent driven sampling among workers with precarious employment in Sweden. PLoS ONE 2019, 14, e0210183. [Google Scholar] [CrossRef]
- Gile, K.J.; Johnston, L.G.; Salganik, M.J. Diagnostics for Respondent-driven Sampling. J. R. Stat. Soc. A Stat. 2015, 178, 241–269. [Google Scholar] [CrossRef] [PubMed]


Publisher’s Note: MDPI stays neutral with regard to jurisdictional claims in published maps and institutional affiliations. |
© 2020 by the authors. Licensee MDPI, Basel, Switzerland. This article is an open access article distributed under the terms and conditions of the Creative Commons Attribution (CC BY) license (http://creativecommons.org/licenses/by/4.0/).