Abstract
Despite efforts to estimate the demand for weather services, demand surveys that target only a few consumers with different interests have limitations in providing information about the market gap. This study proposes a method for reversing estimated demand trends by considering new value creation requirements such as national economic power or major industry types. Since no direct surveys of the actual status of services supplied through platforms for the weather service market exist, we investigated the web service status of both public (n = 193) and private (n = 144) sectors and established a weather service supply classification system. To analyze the global weather service demand environment, members of the World Meteorological Organization were classified according to their characteristics and compared with the supply status. The trend direction was suggested so that suppliers could provide services suitable for demand trends, and the corresponding significance was discussed.
1. Introduction
Due to increase of abnormal weather phenomena caused by climate change, damage from natural disasters has been expanding and its scale greatly increasing [1,2]. A recent Global Risk Report by the World Economic Forum warns that if our society fails to cope with these weather risks, it will be one of the worst tragedies of this era [3,4,5]. In fact, climate change poses several risks to businesses, investors, and overall financial stability [6,7,8]. Since weather risk can directly lead to social and economic losses, an efficient response from the industrial sector is urgently necessary.
According to the National Oceanic and Atmospheric Administration (NOAA), about 80% of global economic activity is directly or indirectly affected by the weather, and about 10% of global Gross Domestic Product (GDP) is directly affected by the weather [9]. Moreover, Dutton [10] conducted a qualitative analysis and concluded that in the United States, climate-sensitive areas account for 39.1% of US GDP. Lazo [11] provided an empirical methodology for estimating industrial activities and found that those directly affected by the climate accounted for 3.4% of US GDP and that the impact on the household sector was $31 billion. Therefore, if weather and climate information is used properly, our society will be able to maintain socioeconomic value beyond mere disaster prevention. Furthermore, if this information is used more actively, high added value may be generated. However, analyses have shown that even though 90% of businesses are affected by weather and climate events, only 30% of them respond to such threats [12].
Accordingly, the global society is attempting to strengthen weather services in the public sector [13,14] and is discovering various customized weather services through linkages with the private sector [15,16,17]. Thus, the market for weather services is becoming increasingly active [18,19,20], and various types of weather services and weather service companies are being established [21,22].
As such, with the availability of weather and climate information, the risks for corporations can be minimized and the scale of profit generation can be accelerated [23]. Indeed, in the global market, weather and climate information are being used as essential business decision-making tools in the industry with the application of weather risk management concepts. Countries and companies are generating profits or reducing losses by developing various solutions that analyze both weather and industrial big data [24,25,26]. Moreover, the fields of application are comprehensive, the forms are highly diverse, and the weather service sector is expected to continue to grow.
However, weather services have complex characteristics in that the application method is very sensitive and depends on the conditions of use [27] and analyzing the market gap between supply and demand is difficult. Although research regarding potential markets through surveys has recently been attempted to identify the issues, this has limitations [28]. Indeed, market gaps between users and providers of weather services exist, as the services provided often do not match the needs of the users [29,30,31,32]. There are distinct differences in values for weather service users. They perceive climate change as a business threat to be concerned about, whereas suppliers view it as a potential business opportunity. While users need weather services to address threats in their areas and industries of interest, suppliers set up strategies to provide specific weather services that they can perform competently. Demand surveys limit clear understanding of the position of all consumers; thus, gaps in such research are inevitable. Addressing this from a new perspective that considers the characteristics of users, different from a question-and-answer demand survey, would be meaningful. In this regard, Georgeson et al. [26] proved that the demand for weather services is closely correlated with national wealth and industrial patterns. Based on the World Bank income group data, spending on weather service is much higher in countries with high national wealth. Therefore, we propose a method for estimating demand trends with a reverse approach by considering other value creation requirements such as national economic power or major industry type.
In this study, we investigate the weather services currently provided in the market and create a classification system. Moreover, after categorizing the countries that provide weather services according to social and environmental characteristics, we analyze the demand for weather services and suggest strategies to enable suppliers to provide services that are suitable to the expected future demand.
2. Concepts and Definitions
Weather services concern past, present, and future weather and climate information that is useful for decision-making and, thus, help a variety of industries and economic sectors [33]. In some studies, climate services are referred to separately from weather services [27,34,35]; however, in principle, climate services are considered part of weather services, as is applied in this study [36].
To understand the distribution system of these weather services, organizing the concepts through a service triad is necessary. Service triads involve a tripartite relationship between a provider, a client, and a customer (i.e., end user firm or individual consumer) [37,38,39]. In service triads, while a service contract is established between a client and a customer, and an agency contract between a client and a provider, there is no contract between the provider and the customer [40]. Figure 1 illustrates the application of this relationship to the weather service sector.
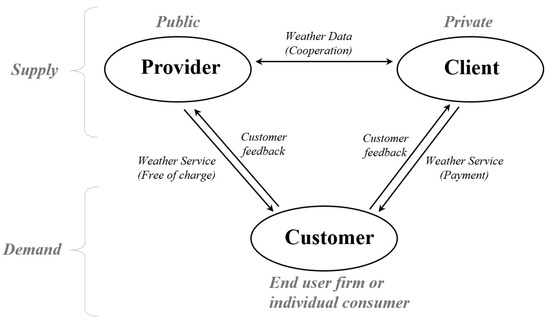
Figure 1.
Weather service triad.
Providers, such as governments and international organizations, invest significantly in the infrastructure and research necessary to provide weather services and in return, obtain data and services from a range of noncommercial bodies with in-house value-adding expertise. Many of these services are freely shared with other public and private sector organizations and provide direct benefits to customers for free [20]. The client part can be regarded as the role of private weather companies. It is not financially viable for a private sector company to produce and collect such massive amounts of weather information, as the return on investment would be insufficient. Thus, these functions have traditionally been executed by government agencies on a large scale. Instead, through customer contracts, private weather companies can provide customized weather services, which the government cannot.
This study approaches supply and demand from a new perspective, in that we exclude the cooperative relationship between the provider and the client. Only from the customer’s perspective can a classification system be created by examining the weather services available from providers and clients, and a supply strategy is presented by diagnosing the market gap between supply and demand, considering social and environmental factors by country.
3. Materials and Methods
3.1. Fact-Finding Survey
In the past, the private sector has been overlooked because the public sector has been driving the development and use of weather services. Nevertheless, the private sector serves as a mediator between the provider and the customer, and with its gradually strengthening capabilities, has become indispensable for market growth. Therefore, investigating the supply status of weather services separately in consideration of public and private sector characteristics is necessary.
This study does not classify weather services that can, theoretically be implemented with current technology; rather, it investigates the status of the actual services being provided. Therefore, relevant data were collected based on actual services displayed on the web that are accessible to consumers. Public sector services provide weather information that is universally necessary to protect the lives and property of all citizens of every country from dangerous weather and natural disasters such as floods. Countries with sufficient technology and capital directly produce and provide weather and climate information. Otherwise, indirect services are provided through the websites of neighboring countries or public trust organizations. Since providing weather and forecast information involves astronomical costs, overall production and provision of weather information for a country, in general, are promoted as a public service through cooperation between the government and international organizations. Therefore, when investigating public sector weather services, for accuracy, it is reasonable to examine the service status of the World Meteorological Organization (WMO) member countries that are officially in a global partnership for the service. As of 2020, 193 countries were registered as members of the WMO [41], and all representative websites were surveyed (Table A1).
The private sector focuses on service areas that the public sector does not provide to consumers directly. Thus, weather companies in the private sector upgrade the basic weather information shared by the public sector to provide detailed and customized weather services directly to consumers. Therefore, the reliability of the weather service provided by private meteorological companies depends upon the reliability of the original data provided by the public sector. Although many global weather service companies exist, some sampling criteria have been prepared to ensure service reliability and representativeness. The World Information System (WIS) [42] authorizes Global Information System Centres (GISC), which are countries that have the capacity to collect and manage meteorological data through the WIS. There are 15 such countries in total, namely, Australia, Brazil, China, France, Germany, India, Iran, Japan, South Korea, Morocco, Russia, Saudi Arabia, South Africa, Britain, and the United States [43]. Three of them (the United States, Europe, and Japan) have their own weather forecast models, and they reanalyze data production technologies that enable independent weather services [44,45,46]. Weather companies officially affiliated with these three countries were selected for the survey. Thus, among the 351 weather companies registered with the National Weather Service [47], 106 were targeted for providing weather services (NWS), 22 were registered with the Japan Meteorological Agency (JMA), and 16 were registered with the Association at Private Meteorological Services (PRIMET). Thus, a total of 144 private weather service companies were selected, and all their websites were surveyed (Table A2).
3.2. Literature Review
A social environment survey was conducted on a range of WMO member countries to consider the demand groups that reside in countries that are officially aware of the concept of weather services, and the industrial and economic sectors were analyzed and classified. Because there are many major industries in the classification of industries by country, up to three types were prioritized for selection. The national industrial status has been promoted through more than 200 literature surveys, including each national government website and management report. According to the International Classification of Standards (ISIC), industry groups can be divided into 21 types [48]. Based on this, industries that use weather services and have similar characteristics were integrated into 13 industries (Table 1). The classification of economic status by country was determined by examining the WB Official Development Assistance (ODA) Business Policy Report [49] and the Development Assistance Committee (DAC) List [50]. For economic classification, countries were divided into four categories, which was in accordance with the Gross National Income (GNI) per capita in the previous year (Table 2). Thus, the surveyed countries were divided into 52 areas based on both industrial (13 types) and economic sector (four types).

Table 1.
Classification of industrial groups for weather services.
Table 2.
Classification of economic groups for weather services.
4. Results
4.1. Public Service Status
The actual types of weather services offered through government websites were largely classified as weather condition, precipitation, precipitation form, rainfall probability, snowfall, temperature, wind, humidity, wave height, lightning, cyclone and storm, earthquake and volcano, and dust (Table 3). In addition, cross-classification was possible by categories of warning, nowcasting, very short, short, medium, extended, long, and climate, according to the definitions of meteorological forecasting ranges [36,51] (Table 4). The total number of public weather service cases was 1877.
Table 3.
Definitions of the actual types of public weather services.
Table 4.
Definitions of meteorological forecasting ranges.
The ratio of general weather services for weather conditions, including weather icons and weather descriptions, was the highest at 25.4% (476 cases), followed by 17.3% (324 cases) and 11.9% (224 cases) for temperature and wind information, respectively. In addition, although precipitation information was at 10.2%, the ratio of precipitation-related information in the precipitation form (7.7%), rainfall probability (4.0%), and snowfall (3.8%) categories was significantly higher at 25.7%. Considering forecast time range, the ratio of short-range weather forecasting service was the highest at 25.6% (481 cases), followed by warning service at 23.2% (435 cases). These statistical results allow us to see which services were prioritized by the government in the provision of public weather services (Figure 2).
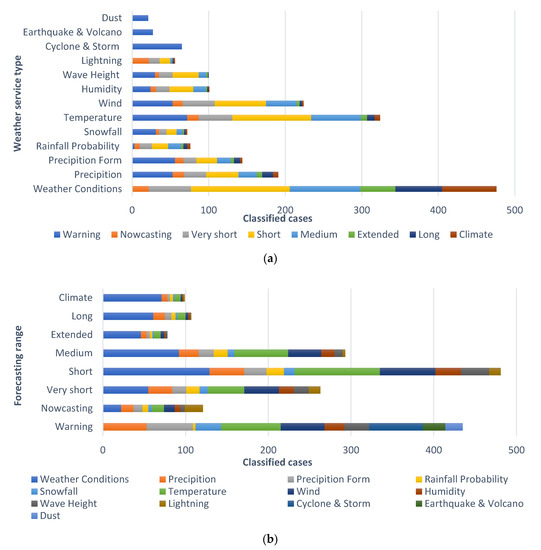
Figure 2.
Analysis of public weather service status by (a) weather service type and (b) forecasting ranges.
According to the data, as of 2019, there were 61 high-income, 56 upper-middle-income, 46 lower-middle-income, and 31 low-income countries worldwide. The number of service cases in high-income countries was 1072, in upper-middle-income, 470; in lower-middle-income, 274; and in low-income countries, 61 (Figure 3a). The average number of national services per economic group has been increasing in high-income countries and was at 17.8 in 2016, about 9.3 times higher than that in low-income countries (i.e., 1.9; Figure 3b). In addition, as income increased to higher national units, the proportion of nowcasting and very short categories of forecasting services increased by about 68% (Figure 4a). This is a result of national investment in areas that require capital and technology for driving a country’s own numerical weather forecasting models. By contrast, the diversity of weather services in low-income countries decreased, while the proportion of simple services at the level of weather delivery increased. Weather condition services in low-income countries accounted for 57.4% of all offered services (Figure 4b).
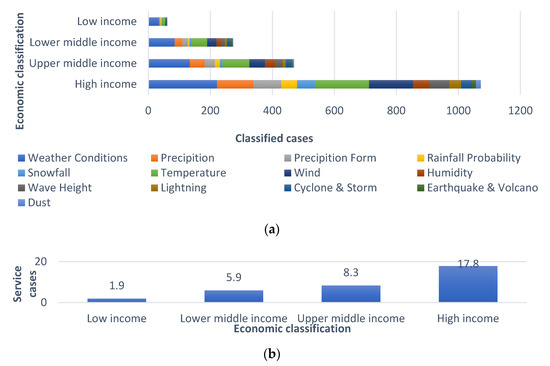
Figure 3.
Public weather service status by national economic classification: (a) by total number of service cases and (b) by average number of service cases per country.
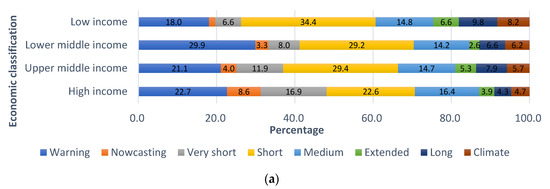
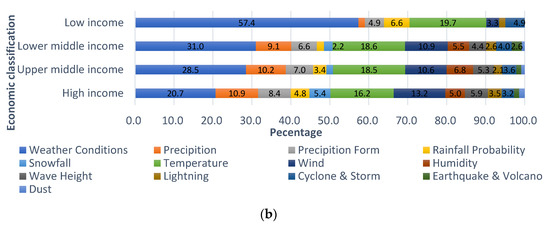
Figure 4.
Distribution chart of public weather services by national economic classification by (a) meteorological forecasting ranges and (b) type of weather services.
4.2. Private Service Status
There were 13 categories in the classification of services by related industries to facilitate social environment classification and correlation (as analyzed later in Chapter 3), namely, agriculture, forestry, and fisheries; manufacturing; energy; facility management; construction; wholesale and retail; transportation and storage; hotels and restaurants; information and communication; financial and insurance; science and technology; health and society; and recreation and service activities. Following certain classification criteria, the total number of private weather services supplied was 2400. The analysis of the status of private weather services provided by related industries showed that health and society services, which provided raw data of 400 cases (16.7%), had the highest volume of services. This was followed by transportation and storage (11.9 %), financial and insurance (10.0%), energy (9.7%), recreation and service activities (8.7%), science and technology (7.5%), information and communication (7.3%), construction (6.2%), facility management (4.5%), wholesale and retail (3.8%), manufacturing (3.4%), and hotels and restaurants (1.8%; Figure 5a). In most industrial categories, the concentration of the health and society service sector was strong (Figure 5b).
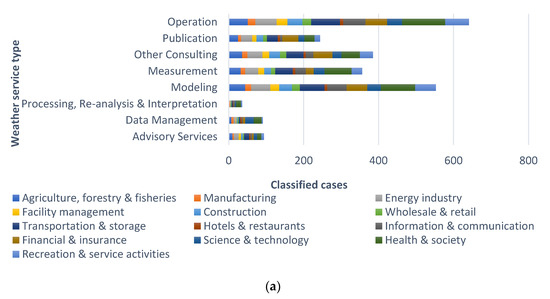
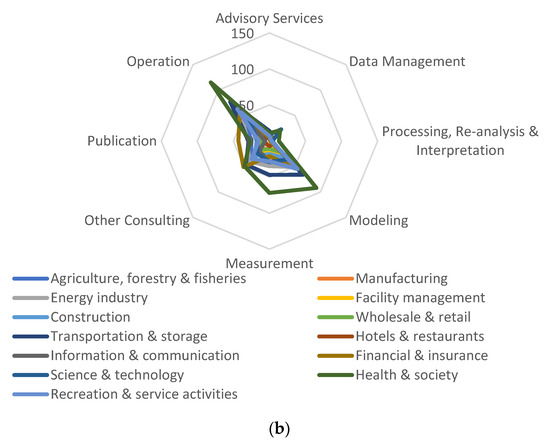
Figure 5.
Analysis of (a) the private weather service status and (b) the concentration of that service by weather service type.
In addition, the types of private weather services actually offered at the website of private weather companies were largely classified as advisory, data management, measurement, modeling, operation, other consulting, and processing reanalysis and interoperability publication (Table 5). This was based on the classification of services defined in the study of the Market Research for a Climate Services Observatory (MARCO) [20]. The analysis of the status of supply cases of private weather services by weather service type showed that operation services, which provided raw data of 641 cases (26.7%) had the highest volume of services, followed by modeling service (23.0%), other consulting (16%), measurement (14.8%), publication (10.2%), advisory (3.9%), data management (3.8%), and processing reanalysis and interpretation (1.5%; Figure 6a). In most industrial categories, the concentration of the operation service sector was strong (Figure 6b). According to the MARCO report, in terms of transactions, advisory ranked the highest at 890,400 (25%), followed by other consulting (21%), processing reanalysis and interpretation (12%), modeling (12%), measurement (10%), publication (8%), operation (7%), and data management (6%; Figure 7).
Table 5.
Definitions of the actual types of private weather services.

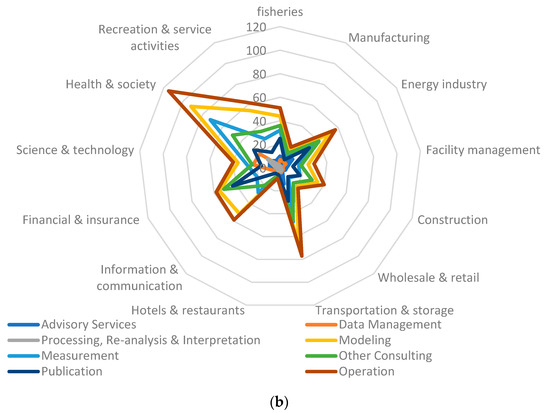
Figure 6.
Analysis of (a) private weather service status and (b) the concentration of that service by related industries.

Figure 7.
Volume of weather service transactions by service type.
Both the supply and transaction volumes of these quantitatively investigated weather services show differences in patterns among them. For example, the operation service had the highest supply volume but the lowest transaction volume. High supply means that the unit cost tends to be low because of many competitors. A high supply and low unit cost but low transaction volume mainly indicates that demand has risen from services with low willingness to pay (WTP). By contrast, low supply means that there is high tendency toward a high unit cost due to fewer competitors. Low supply with high unit cost but high transaction volume results from rising demand for services with high WTP. By contrast, low supply means that high unit cost is quite likely due to fewer competitors. Low supply with high unit cost but high transaction volume mainly indicates that demand has risen for services with high WTP. The trend was analyzed by calculating the ratio of supply to transaction volume for each weather service type and converting the maximum value to 1 (Figure 8a). The average of expenditures for meteorological services per capita (in dollars) for countries classified by development status based on the World Bank Income Group were 0.89 (for low-income countries), 2.35 (low-middle), 5.65 (high-middle), and 19.83 (high-income). Figure 8b shows the trend by converting the maximum value to 1 so that a comparison can be made with Figure 8a. Based on this figure, operation services is likely to be in demand for the low-income countries. The WTP trend value for the lower-middle-income countries is 0.12, which is a likely range of demand for operation to publication services. Similarly, for upper-middle-income countries, data management service is likely to be in demand, and for high-income countries, all services are within the range of demand (Figure 8c). Based on these results, the taxonomy table is presented for diagnosing the types of weather services likely to be in demand in accordance with the national social environment (i.e., national income and industrial characteristics; Table 6). The taxonomy lists the industry (I) classifications on the vertical axis and the economy (E) classifications on the horizontal axis. An IE code was assigned to each cell and configured to allow estimation of the range of weather service types that are likely to be suitable for each code. This table can serve to diagnose which type of service the supplier should be more interested in, mainly considering the industry characteristics and economic conditions of the supplier’s target demand.
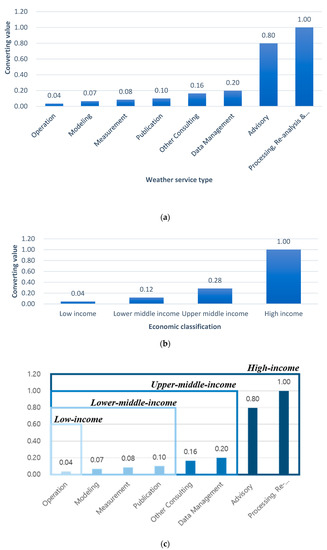
Figure 8.
(a) Ratio trend of the supply volume to the transaction volume by type of weather service, (b) willingness to pay (WTP) trend according to national economic level classification, and (c) estimation of the range of major weather services that are likely to be in demand based on the national economic level.
Table 6.
Taxonomy table for diagnosing the types of weather services that are likely to be in demand according to the national social environment (i.e., national income and industrial characteristics).
4.3. Social Environment Classification
In the national social environmental analysis, the number of cases, at 1029, was derived according to the classification criteria. According to the industry analysis, manufacturing ranked highest for the largest number of industries, with 295 cases (28.7%), followed by agriculture, forestry, and fisheries (22.1%), hotels and restaurants (10.3%), health and society (7.7%), energy (6.7%), construction (5.4%), transportation and storage (5.3%), and availability management (1.0%). According to the analysis by economic level, 303 cases (29.4%) were included in the category of upper-middle-income countries, which was the largest group, followed by high-income (28.3%), lower-middle-income (24.5%), and low-income (17.8%) countries. For the recreation and service activities and science and technology categories, high-income countries accounted for more than three quarters. Thus, these industries are likely to have sufficient demand in high-income countries. The lower the income level, the greater is the proportion of agriculture, forestry, and fisheries, and health sectors in major projects. This implies that these industries are likely to have sufficient demand in low-income countries. However, the proportion of the hotels and restaurants and recreation and service industries tended to decrease, which is likely because countries with lower income levels have more difficulty in activating weather services.
5. Discussion
From the suppliers’ perspective, the supply of weather services to the public sector focused on providing simple information on weather factors and weather conditions according to weather forecasting time. Meanwhile, the supply of weather services in the private sector was divided by industry, where various service types were provided. This results from the mutually complementary relationship between the public and private sectors, as previously defined in the weather service triad. We compared the actual supply status directly surveyed and the transaction status investigated in the prior study to confirm that the gap between demand and supply occurs for each type of weather service. We were able to derive new supply strategies based on the characteristics of the demand source and the research result that social environment affects the demand for weather service.
According to the classification by national economic level, the case of the group of high-income countries accounted for 28.3%, whereas the size of weather services accounted for 57.1%, of the total service. From the customer’s perspective, the higher the national economic level, the higher are the benefits from public weather services. Therefore, consumers in high-income countries have little incentive to pay for private weather services. However, it is likely that there will be demand for specific weather services such as advisory on processing and reanalysis, and interpretations, which have high WTP, for corporate decision-making in the high-income market. According to the classification by national economic level, the case of low-income countries accounted for 17.8%, whereas the size of weather services accounted for 3.2%, of the total service. Because the weather services that consumers can receive from the public sector are limited, customers who need weather services must obtain their desired services from the private sector. Since low-income countries have low WTP, it is expected that in these countries, private service demand for operational weather services that mainly focus on raw data will increase. Similarly, the data analyzed in this study between public and private sector services point to the future direction of commercialization of weather services. From the analysis of the status of private weather service supply, we found that weather services in the health and society sector are intensively serviced regardless of type. Amid the recent spread of coronavirus disease (COVID-19) pandemic, the health sector is expected to become even more critical [52], such that weather considerations would be essential to determining the rate of COVID-19 outbreaks. Meanwhile, in the analysis of social environment by country, health and society industries are expected to grow in underdeveloped countries. Thus, it is reasonable to consider actively expanding health services that apply weather services as required by underdeveloped countries.
The results of the social environment analysis conducted on WMO-member countries shows that I2E2 has the highest rate, with 83 cases (Figure 9). Thus, weather services such as other consulting, data management, which corresponds to the manufacturing sector of upper-middle-income countries are most likely to generate demand. By contrast, since services were found to be relatively low in concentration, efforts to secure a market for these services are likely to create demand. Referencing the classification table in this way can help develop a response plan for weather service businesses, based on IE characteristics by country. This is of great significance because it presents a new perspective on the supply and demand of meteorological services, as it breaks away from the existing method of preparing a supply plan by identifying demand based on a consumer survey.
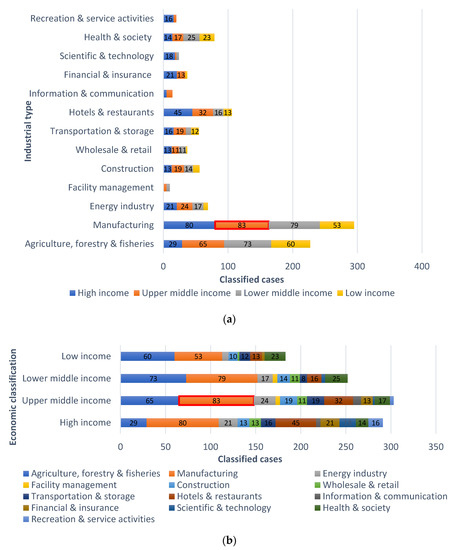
Figure 9.
Analysis of (a) the characteristics of national income groups by major industry classification and (b) major industry classification by national income group.
This study is designed to estimate the real demand by comparing the actual supply status of weather services surveyed by the author with the transaction status surveyed in previous studies, to identify the gap between supply and demand, find trends, and estimate real demand. To derive the actual supply status of weather services, we conduct a thorough survey of web sites that have been sampled and adopt a methodology to derive statistical data of meteorological service, by standardizing vast amounts of unstructured information. For this reason, there are limitations in the statistics creation and analysis, and uncertainties arising from this issue need to be partially improved. In addition, the proposed measures also need to be flexibly applied according to the volatility of each country’s industrial structure and economic growth over time.
In the future, studies that apply a methodology similar to this one, or organically combine other improved methodologies to interview surveys and/or research cases, will yield better results in resolving the supply and demand gap. In addition, adding climatic conditions not considered in this study to the analysis of social environment would be a good attempt to find an improved method. We are confident that if we continue to secure various perspectives to reduce the gap between supply and demand of meteorological services, we will ultimately be able to expect positive effects in expanding the weather service market.
Author Contributions
C.H.B. contributed to the following: the conception and design of the study, acquisition of data, analysis and interpretation of data, drafting of the article, and approval of the submitted version. C.S.L. provided assistance regarding the methodology. All authors have read and agreed to the published version of the manuscript.
Funding
This research received no external funding.
Conflicts of Interest
The authors declare no conflict of interest.
Appendix A
Table A1.
Weather service supply channel of the public sector.
Table A1.
Weather service supply channel of the public sector.
| Nation | Government Meteorological Authority | Website |
|---|---|---|
| Afghanistan | Afghan Meteorological Authority | no website provided |
| Albania | The Hydrometeorological Institute | no website provided |
| Algeria | Office National de la Météorologie | http://www.meteo.dz/ |
| Andorra | Environment Minister Goberne DeNierto | no website provided |
| Angola | Instituto Nacional de Hidrometeorología e Geofísica | http://www.inamet.gov.ao/ |
| Antigua and Barbuda | Meteorological Services | http://www.antiguamet.com/ |
| Argentina | Servicio Meteorológico Nacional | https://www.smn.gob.ar/ |
| Armenia | Armenian State Hydro and Monitoring Service | http://www.meteo.am/ |
| Australia | Bureau of Meteorology | http://www.bom.gov.au/ |
| Austria | Central Institute for Meteorology and Geodynamics | http://www.zamg.ac.at/ |
| Azerbaijan | National Hydrometeorological Department | http://www.eco.gov.az/ |
| Bahamas | Department of Meteorology | no website provided |
| Bahrain | Bahrain Meteorological Service | http://www.bahrainweather.com/ |
| Bangladesh | Bangladesh Meteorological Department | http://www.bmd.gov.bd/ |
| Barbados | Meteorological Services | http://www.barbadosweather.org/ |
| Belarus | Department of Hydrometeorology | http://www.pogoda.by/ |
| Belgium | Institut Royal Météorologique | http://www.meteo.be/ |
| Belize | National Meteorological Service | http://www.hydromet.gov.bz/ |
| Benin | Service Météorologique National | http://www.meteo-benin.net/ |
| Bhutan | Council for Renewable Natural Resources Research | no website provided |
| Bolivia | Servicio Nacional de Meteorología e Hidrología | no website provided |
| Bosnia and Herzegovina | Meteorological Institute | http://fhmzbih.gov.ba/ |
| Botswana | Botswana Meteorological Services | http://www.weather.info.bw/ |
| Brazil | Instituto Nacional de Meteorologia | http://www.inmet.gov.br/ |
| British Caribbean Territories | Caribbean Meteorological Organization | http://www.cmo.org.tt/ |
| Brunei Darussalam | The Brunei Meteorological Service | http://www.bruneiweather.com.bn/ |
| Bulgaria | National Institute of Meteorology and Hydrology | http://www.meteo.bg/ |
| Burkina Faso | Direction de la Météorologie | http://www.meteo-burkina.net/ |
| Burundi | Institut Géographique du Burundi | no website provided |
| Cabo Verde | Instituto Nacional de Meteorologia e Geophísica | http://www.meteo.cv/ |
| Cambodia | Department of Meteorology | http://www.cambodiameteo.com/ |
| Cameroon | Direction de la Météorologie Nationale | no website provided |
| Canada | Meteorological Service of Canada | http://www.ec.gc.ca/meteo-weather/ |
| Central African Rep. | Direction Générale de l’Aviation Civile et de la Météorologie | no website provided |
| Chad | Direction des Ressources en Eau et de la Météorologie | no website provided |
| Chile | Dirección Meteorológica de Chile | http://www.meteochile.cl/ |
| China | China Meteorological Administration | http://www.cma.gov.cn/ |
| Colombia | Instituto de Hidrología, Meteorología y Estudios Ambientales | http://www.ideam.gov.co/ |
| Comoros | Direction de la Météorologie Nationale | no website provided |
| Congo, Dem. Rep. | Agence Nationale de Météorologie et de Télédétection par Satellite | http://www.meteo-congo-kinshasa.net/ |
| Congo, Rep. | Direction de la Météorologie Nationale | http://www.meteo-congo-brazza.net/ |
| Cook Islands | Cook Islands Meteorological Service | http://www.cookislands.pacificweather.org/ |
| Costa Rica | Instituto Meteorológico Nacional | http://www.imn.ac.cr/ |
| Côte d’Ivoire | Direction de la Météorologie Nationale | no website provided |
| Croatia | Meteorological and Hydrological Service | http://meteo.hr/ |
| Cuba | Instituto de Meteorología | http://www.insmet.cu/ |
| Curaçao and Sint Maarten | Meteorological Service | http://www.meteo.cw/ |
| Cyprus | Meteorological Service | http://www.moa.gov.cy/ms |
| Czech Republic | Czech Hydrometeorological Institute | http://www.chmi.cz/ |
| Denmark | Danish Meteorological Institute | http://www.dmi.dk/ |
| Djibouti | Service de la Météorologie | no website provided |
| Dominica | Dominica Meteorological Services | http://www.weather.gov.dm/ |
| Dominican Rep. | Oficina Nacional de Meteorolog iá | http://www.indrhi.gob.do/ |
| Ecuador | Instituto Nacional de Meteorología e Hidrología (INAMHI) | http://www.serviciometeorologico.gob.ec/ |
| Egypt | The Egyptian Meteorological Authority | http://www.nwp.gov.eg/ |
| El Salvador | Servicio Nacional de Estudios Territoriales | http://www.snet.gob.sv/ |
| Eritrea | Civil Aviation Authority | no website provided |
| Estonia | Estonian Meteorological and Hydrological Institute | http://www.emhi.ee/ |
| Ethiopia | National Meteorological Services Agency | http://www.ethiomet.gov.et/ |
| Fiji | Fiji Meteorological Service | http://www.met.gov.fj/ |
| Finland | Finnish Meteorological Institute | http://www.fmi.fi/ |
| France | Météo-France | http://www.meteo.fr/ |
| French Polynesia | Météo-France Polynesie Francaise | http://www.meteo.pf/ |
| Gabon | Direction de la Météorologie Nationale | no website provided |
| Gambia | Department of Water Resources | no website provided |
| Georgia | Department of Hydrometeorology | http://www.hydromet.ge/ |
| Germany | Deutscher Wetterdienst | http://www.dwd.de/ |
| Ghana | Ghana Meteorological Services Department | http://www.meteo.gov.gh/ |
| Greece | Hellenic National Meteorological Service | http://www.hnms.gr/ |
| Guatemala | Instituto Nacional de Sismología, Vulcanología, Meteorologiá e Hidrología | http://www.insivumeh.gob.gt/ |
| Guinea | Direction Nationale de la Météorologie | http://www.meteo-guinee-conakry.net/ |
| Guinea-Bissau | Météorologie de Guinée Bissau | http://www.meteo-guinee-bissau.net/ |
| Guyana | Hydrometeorological Service | no website provided |
| Haiti | Centre national de météorologie | http://www.meteo-haiti.gouv.ht/ |
| Honduras | Servicio Meteorológico Nacional | http://www.smn.gob.hn/ |
| Hong Kong, China | Hong Kong Observatory | http://www.hko.gov.hk/ |
| Hungary | Meteorological Service of Hungary | http://www.met.hu/omsz.php |
| Iceland | Icelandic Meteorological Office | http://www.vedur.is/ |
| India | India Meteorological Department | http://www.imd.gov.in/ |
| Indonesia | Meteorological and Geophysical Agency | http://www.bmkg.go.id/ |
| Iran, Islamic Rep. | Islamic Republic of Iran Meteorological Organization | http://www.irimo.ir/ |
| Iraq | Iraqi Meteorological Organization | no website provided |
| Ireland | The Irish Meteorological Service | http://www.met.ie/ |
| Israel | Israel Meteorological Service | http://www.ims.gov.il/ |
| Italy | Servizio Meteorologico | http://www.meteoam.it/ |
| Jamaica | Meteorological Service | http://www.metservice.gov.jm/ |
| Japan | Japan Meteorological Agency | http://www.jma.go.jp/jma/ |
| Jordan | Jordan Meteorological Department | http://www.jometeo.gov.jo/ |
| Kazakhstan | Kazhydromet | http://www.kazhydromet.kz/ |
| Kenya | Kenya Meteorological Department | http://www.meteo.go.ke/ |
| Kiribati | Kiribati Meteorological Service | no website provided |
| Korea, Dem. People’s Rep. | State Hydrometeorological Administration | no website provided |
| Korea, Rep. | Korea Meteorological Administration | http://www.kma.go.kr/ |
| Kuwait | Department of Meteorology | http://www.met.gov.kw/ |
| Kyrgyzstan | Main Hydrometeorological Administration | http://www.meteo.ktnet.kg/ |
| Lao People’s Democratic Rep. | Department of Meteorology and Hydrology | http://dmhlao.etllao.com/ |
| Latvia | Latvian Environment, Geology and Meteorology Agency | http://www.meteo.lv/ |
| Lebanon | Service Météorologique | no website provided |
| Lesotho | Lesotho Meteorological Services | http://www.lesmet.org.ls/ |
| Liberia | Ministry of Transport | no website provided |
| Libya, State of | Libyan National Meteorological Centre | no website provided |
| Lithuania | Lithuanian Hydrometeorological Service | http://www.meteo.lt/ |
| Luxembourg | Administration de l’Aéroport de Luxembourg | http://www.meteolux.lu/ |
| Macao, China | Meteorological and Geophysical Bureau | http://www.smg.gov.mo/ |
| Macedonia, FYR | Republic Hydrometeorological Institute | http://www.meteo.gov.mk/ |
| Madagascar | Direction Générale de la Météorologie | http://www.meteomadagascar.mg/ |
| Malawi | Malawi Meteorological Services | http://www.metmalawi.com/ |
| Malaysia | Malaysian Meteorological Department | http://www.met.gov.my/ |
| Maldives | Department of Meteorology | http://www.meteorology.gov.mv/ |
| Mali | Direction Nationale de la Météorologie du Mali | no website provided |
| Malta | Meteorological Office | http://www.maltairport.com/weather/ |
| Mauritania | Office National de Météorologie | http://www.onm.mr/ |
| Mauritius | Mauritius Meteorological Services | http://metservice.intnet.mu/ |
| Mexico | Servicio Meteorológico Nacional | http://smn.cna.gob.mx/ |
| Micronesia, Federated States of | FSM Weather Station | http://weather.noaa.gov/weather/ |
| Moldova | Serviciul Hidrometeorologic de Stat Moldova | http://www.meteo.md/ |
| Monaco | Mission Permanente de la Principauté de Monaco | http://www.monaco-un.org/ |
| Mongolia | National Agency for Meteorology, Hydrology and Environment Monitoring | no website provided |
| Montenegro | Hydrometeorological Institute of Montenegro | http://www.meteo.co.me/ |
| Morocco | Direction de la Météorologie Nationale | http://www.marocmeteo.ma/ |
| Mozambique | Instituto Nacional de Meteorologia | http://www.inam.gov.mz/ |
| Myanmar | Department of Meteorology and Hydrology | http://www.dmh.gov.mm/ |
| Namibia | Namibia Meteorological Service | http://www.meteona.com/ |
| Nauru | Department of National Emergency Services | no website provided |
| Nepal | Department of Hydrology and Meteorology | http://www.dhm.gov.np/ |
| Netherlands | Royal Netherlands Meteorological Institute | http://www.knmi.nl/ |
| New Caledonia | Météo-France Nouvelle Calédonie | http://www.meteo.nc/ |
| New Zealand | New Zealand National Meteorological Service | http://www.metservice.co.nz/ |
| Nicaragua | Dirección General de Meteorología | http://www.ineter.gob.ni/ |
| Niger | Direction de la Météorologie Nationale | http://www.meteo-niger.net/ |
| Nigeria | Nigerian Meteorological Agency | http://nimet.gov.ng/ |
| Niue | Niue Meteorological Service | http://informet.net/niuemet |
| Norway | Norwegian Meteorological Institute | http://www.met.no/ |
| Oman | Department of Meteorology | http://www.met.gov.om/ |
| Pakistan | Pakistan Meteorological Department | http://pmd.gov.pk/ |
| Panama | Hidrometeorología | http://www.hidromet.com.pa/ |
| Papua New Guinea | Papua New Guinea Meteorological Service | http://www.pi-gcos.org/ |
| Paraguay | Dirección de Meteorología e Hidrología | http://www.meteorologia.gov.py/ |
| Peru | Servicio Nacional de Meteorología e Hidrología | http://www.senamhi.gob.pe/ |
| Philippines | Philippine Atmospheric Geophysical and Astronomical Services Administration | http://www.pagasa.dost.gov.ph/ |
| Poland | Institute of Meteorology and Water Management | http://www.imgw.pl/ |
| Portugal | Instituto de Meteorologia | http://www.meteo.pt/ |
| Qatar | Civil Aviation Authority | http://qweather.gov.qa/ |
| Romania | National Meteorological Administration | http://www.inmh.ro/ |
| Russian Federation | Russian Federal Service for Hydrometeorology and Environmental Monitoring | http://www.meteorf.ru/ |
| Rwanda | Rwanda Meteorological Agency | http://www.meteorwanda.gov.rw/ |
| Saint Lucia | Meteorological Services | http://www.cdera.org/weather/ |
| Samoa | Samoa Meteorology Division | http://www.mnre.gov.ws/ |
| Sao Tome and Principle | Institut National de Météorologie | no website provided |
| Saudi Arabia | Presidency of Meteorology and Environment | http://www.pme.gov.sa/ |
| Senegal | Direction de la Météorologie Nationale | http://www.meteo-senegal.net/ |
| Serbia | Republic Hydrometeorological Service of Serbia | http://www.meteo.rs/ |
| Seychelles | National Meteorological Services | http://www.meteo.gov.sc/ |
| Sierra Leone | Meteorological Department | no website provided |
| Singapore | Meteorological Services Division | http://www.weather.gov.sg/ |
| Slovakia | Slovak Hydrometeorological Institute | http://www.shmu.sk/ |
| Slovenia | Meteorological Office | http://www.rzs-hm.si/ |
| Solomon Islands | Solomon Islands Meteorological Service | http://www.met.gov.sb/ |
| Somalia | Permanent Mission of Somalia | no website provided |
| South Africa | South African Weather Service | http://www.weathersa.co.za/ |
| South Sudan | South Sudan Weather Service | no website provided |
| Spain | Agencia Estatal de Meteorología | http://www.aemet.es/ |
| Sri Lanka | Department of Meteorology | http://www.meteo.slt.lk/ |
| Sudan | Sudan Meteorological Authority | http://www.ersad.gov.sd/ |
| Suriname | Meteorological Service | http://www.meteosur.sr/ |
| Swaziland | Swaziland Meteorological Service | http://www.swazimet.gov.sz/ |
| Sweden | Swedish Meteorological and Hydrological Institute | http://www.smhi.se/ |
| Switzerland | MeteoSwiss | http://www.meteoswiss.ch/ |
| Syrian Arab Rep. | Ministry of Defence Meteorological Department | no website provided |
| Tajikistan | Main Administration of Hydrometeorology and Monitoring of the Environment | http://www.meteo.tj/ |
| Tanzania | Tanzania Meteorological Agency | http://www.meteo.go.tz/ |
| Thailand | Thai Meteorological Department | http://www.tmd.go.th/ |
| Timor-Leste | Dirrecão Nacional Meteorologia e Geofisica | http://www.dnmg.gov.tl/ |
| Togo | Direction de la Météorologie Nationale | no website provided |
| Tonga | Tonga Meteorological Service | http://www.met.gov.to/ |
| Trinidad and Tobago | Meteorological Service | http://www.metoffice.gov.tt/ |
| Tunisia | National Institute of Meteorology | http://www.meteo.tn/ |
| Turkey | Turkish State Meteorological Service | http://www.mgm.gov.tr/ |
| Turkmenistan | Administration of Hydrometeorology | no website provided |
| Tuvalu | Tuvalu Met Service | http://informet.net/tuvmet/ |
| Uganda | Department of Meteorology | http://www.meteo-uganda.net/ |
| Ukraine | Ukrainian Hydrometeorological Center | http://www.meteo.gov.ua/ |
| United Arab Emirates | National Center for Meteorology and Seismology | http://www.ncms.ae/english/ |
| United Kingdom | Met Office | http://www.metoffice.gov.uk/ |
| United States of America | National Oceanic and Atmospheric Administration | http://www.weather.gov/ |
| Uruguay | Dirección Nacional de Meteorología | http://www.meteorologia.com.uy/ |
| Uzbekistan | Uzhydromet | http://www.meteo.uz/ |
| Vanuatu | Vanuatu Meteorological Services | http://www.meteo.gov.vu/ |
| Venezuela, Bolivarian Rep. | Instituto Nacional de Meteorología e Hidrología | http://www.inameh.gob.ve/ |
| Viet Nam | Hydrometeorological Service | http://www.nchmf.gov.vn/ |
| Yemen | Yemen Meteorological Service | http://www.yms.gov.ye/ |
| Zambia | Zambia Meteorological Department | http://www.zmd.gov.zm/ |
| Zimbabwe | Zimbabwe Meteorological Services Department | http://www.weather.co.zw/ |
Table A2.
Weather service supply channel of the private sector.
Table A2.
Weather service supply channel of the private sector.
References
- Daniell, J.; Wenzel, F.; McLennan, A.; Daniell, K.; Kunz-Plapp, T.; Khazai, B.; Schaefer, A.; Kunz, M.; Girard, T. The global role of natural disaster fatalities in decision-making: Statistics, trends, and analysis from 116 years of disaster data compared to fatality rates from other causes. In Proceedings of the European Geosciences Union General Assembly Conference, Vienna, Austria, 17–22 April 2016; Volume 18. [Google Scholar]
- Daniell, J.; Wenzel, F.; Schaefer, A. The economic costs of natural disasters globally from 1900–2015: Historical and normalised floods, storms, earthquakes, volcanoes, bushfires, drought and other disasters. In Proceedings of the European Geosciences Union General Assembly Conference, Vienna, Austria, 17–22 April 2016; Volume 18. [Google Scholar]
- World Economic Forum. Global Risks Report 2017, 12th ed.; World Economic Forum: Geneva, Switzerland; Available online: www.weforum.org/docs/GRR17_Report_web.pdf (accessed on 11 January 2017).
- World Economic Forum. Global Risks Report 2018, 13th ed.; World Economic Forum: Geneva, Switzerland; Available online: www.weforum.org/docs/WEF_GRR18_Report.pdf (accessed on 17 January 2018).
- World Economic Forum. Global Risks Report 2019, 14th ed.; World Economic Forum: Geneva, Switzerland; Available online: www.weforum.org/docs/WEF_Global_Risks_Report_2019.pdf (accessed on 15 January 2019).
- Battiston, S. A climate stress-test of the financial system. Nat. Clim. Chang. 2016, 7, 283–288. [Google Scholar] [CrossRef]
- Carney, M. Breaking the Tragedy of the Horizon—Climate Change and FINANCIAL stability. Speech at Lloyd’s of London, England. 2015. Available online: https://www.bis.org/review/r151009a.pdf (accessed on 29 September 2015).
- Sakhel, A. Corporate climate risk management: Are European companies prepared? J. Clean. Prod. 2017, 165, 103–118. [Google Scholar] [CrossRef]
- Armstrong, J.A. Fair Weather: Effective Partnerships in Weather and Climate Services; National Research Council, The National Academies Press: Washington, DC, USA, 2003. [Google Scholar]
- Dutton, J.A. Opportunities and priorities in a new era for weather and climate services. Bull. Am. Meteorol. Soc. 2002, 83, 1303–1311. [Google Scholar] [CrossRef]
- Lazo, J.K.; Lawson, M.; Larsen, P.H.; Waldman, D.M. U.S. economic sensitivity to weather variability. Bull. Am. Meteorol. Soc. 2011, 92, 1077–1098. [Google Scholar] [CrossRef]
- Amado, J.C.; Adams, P. Value Chain Climate Resilience: A Guide to Managing Climate Impacts in Companies and Communities. 2012. Partnership for Resilience and Environmental Preparedness. Available online: http://www.oxfamamerica.org/static/oa4/valuechainclimateresilience.pdf (accessed on 27 February 2014).
- Kunkel, K.E.; Pielke, R.A.; Changnon, S.A. Temporal fluctuations in weather and climate extremes that cause economic and human impacts: A review. Bull. Am. Meteorol. Soc. 1999, 80, 709–720. [Google Scholar] [CrossRef]
- Vaughan, C.; Dessai, S. Climate services for society: Origins, institutional arrangements, and design elements for an evaluation framework. WIREs Clim. Chang. 2014, 5, 587–603. [Google Scholar] [CrossRef]
- Diaz, J.; Joseph, M.B. Predicting property damage from tornadoes with zero-inflated neural networks. Weather Clim. Extrem. 2019, 25, 100216. [Google Scholar] [CrossRef]
- Jhong, B.C.; Huang, J.; Tung, C.P. Spatial assessment of climate risk for investigating climate adaptation strategies by evaluating spatial-temporal variability of extreme precipitation. Water Resour. Manag. 2019, 33, 3377–3400. [Google Scholar] [CrossRef]
- Newman, J.P.; Maier, H.R.; Riddell, G.A.; Zecchin, A.C.; Daniell, J.E.; Schaefer, A.M.; Delden, H.; Khazai, B.; O’Flaherty, M.J.; Newland, C.P. Review of literature on decision support systems for natural hazard risk reduction: Current status and future research directions. Environ. Model. Softw. 2017, 96, 378–409. [Google Scholar] [CrossRef]
- Cavelier, R.; Borel, C.; Le Cozannet, G.; Ritti, D.; Morin, D.; Chaussade, M.; Charreyron, V. Climate Services for Adaptation to Climate Change; Poster; CVT National Research Alliance for Environment [AllEnvi]: Paris, France, 2016. [Google Scholar]
- Howard, S. Analysis of Market Transactions for Climate Services. Deliverable 4.2. MARCO. Available online: http://marco-h2020.eu/wp-content/uploads/2020/01/MARCO_D4_2_Analysis_of_market_transactions_for_climate_services.pdf (accessed on 9 January 2018).
- Howard, S.; Sarah, H.; Simon, H. Quantitative market analysis of the European Climate Services sector–The application of the kMatrix big data market analytical tool to provide robust market intelligence. Clim. Serv. 2020, 17, 100108. [Google Scholar] [CrossRef]
- Cortekar, J.; Themessl, M. Report on Mapping of ERA4CS Member State’s National Activities for Climate Services. Available online: http://www.jpi-climate.eu/media/default.aspx/emma/org/10890172/Deliverable+7+2+-+Mapping+of+national+activities+PUBLIC.pdf (accessed on 7 August 2018).
- Manez, M.; Zölch, T.; Cortekar, J. Mapping of Climate Service Providers within Europe: Theoretical Foundation and Empirical Results; JPI Climate, Working Group 2 “Research for Climate Service Development and Deployment”: Hamburg, Germany, 2013. [Google Scholar]
- Pettifer, R.E.W. The development of the commercial weather services market in Europe: 1970–2012. Meteorol. Appl. 2015, 22, 419–424. [Google Scholar] [CrossRef]
- Freebairn, J.W.; Zillman, J.W. Economic benefits of meteorological services. Meteorol. Appl. 2002, 9, 33–44. [Google Scholar] [CrossRef]
- Freebairn, J.W.; Zillman, J.W. Funding meteorological services. Meteorol. Appl. 2002, 9, 45–54. [Google Scholar] [CrossRef]
- Georgeson, L.; Maslin, M.; Poessinouw, M. Global disparity in the supply of commercial weather and climate information services. Sci. Adv. 2017, 3, e1602632. [Google Scholar] [CrossRef]
- Troccoli, A. Achieving valuable weather and climate services. Weather Clim. Serv. Energy Ind. 2018, 13–25. [Google Scholar] [CrossRef]
- Tart, S.; Groth, M.; Seipold, P. Market demand for climate services: An assessment of users’ needs. Clim. Serv. 2019, 17, 100109. [Google Scholar] [CrossRef]
- Brasseur, G.P.; Gallardo, L. Climate services: Lessons learned and future prospects. Earth Future 2016, 4, 79–89. [Google Scholar] [CrossRef]
- Giannini, V.; Bellucci, A.; Torresan, S. Sharing skills and needs between providers and users of climate information to create climate services: Lessons from the Northern Adriatic case study. Earth Perspect. 2016, 3, 236240. [Google Scholar] [CrossRef]
- Hoa, E.; Perrels, A.; Le, T.T. From generating to using climate services: How the EU-MACS and MARCO projects help to unlock the market potential. Clim. Serv. 2018, 11, 86–88. [Google Scholar]
- Street, R.; Jacob, D.; Parry, M.; Runge, T.; Scott, J. A European Research and Innovation Roadmap for Climate Services; European Commission: Luxembourg, 2015. [Google Scholar]
- Li, Y.; Giuliani, M.; Castelletti, A. A coupled human–natural system to assess the operational value of weather and climate services for agriculture. Hydrol. Earth Syst. Sci. 2017, 21, 4693–4709. [Google Scholar] [CrossRef]
- Anderson, G. The Value of Climate Services Across Economic and Public Sectors: A Review of Relevant Literature. The United States Agency for International Development (USAID). Available online: https://www.climatelinks.org/sites/default/files/asset/document/CCRD-Climate-Services-Value-Report_FINAL_0.pdf (accessed on 10 December 2013).
- Visscher, K.; Stegmaiera, P.; Damm, A.; Hamaker-Taylor, A.; Harjanne, A.; Giordano, R. Matching supply and demand: A typology of climate services. Clim. Serv. 2019, 17, 100136. [Google Scholar] [CrossRef]
- WMO. Manual on the Global Data-processing and Forecasting System, Volume I—Global Aspects; WMO-No. 485; WMO: Geneva, Switzerland, 2010. [Google Scholar]
- Karatzas, A.; Johnson, M.; Bastl, M. Relationship determinants of performance in service triads: A configurational approach. J. Supply Chain Manag. 2016, 52, 28–47. [Google Scholar] [CrossRef]
- Niranjan, T.T.; Metri, B.A. Provider-vendor-end user triad: A service quality model for IS/ITES outsourcing. J. Serv. Res. 2008, 8, 123–138. [Google Scholar]
- Sengupta, S.; Niranjan, T.T.; Krishnamoorthy, M. Trends and directions in service triads research. Int. J. Phys. Distrib. Logist. Manag. 2018, 48, 333–360. [Google Scholar] [CrossRef]
- Wynstra, F.; Spring, M.; Schoenherr, T. Service triads: A research agenda for buyer–supplier–customer triads in business services. J. Oper. Manag. 2015, 35, 1–20. [Google Scholar] [CrossRef]
- WMO Members. World Meteorological Organization Members. 2020. WMO-No. 1069. Available online: https://public.wmo.int/en/about-us/members (accessed on 30 October 2020).
- WMO. Guide to the WMO Information System; WMO: Geneva, Switzerland, 2015. [Google Scholar]
- WMO GISC. (n.d.). WMO Global Information System Centres. 2020. Available online: https://www.wmo.int/pages/prog/www/WIS/GISCs_en.html (accessed on 10 September 2020).
- Park, N.E.; Lee, K.J. Trends and Implications of Weather Observation and Forecasting Technology. Korea Institute of Science & Technology Evaluation and Planning. Available online: http://www.kistep.re.kr/getFileDown.jsp?fileIdx=2657&contentIdx=1450&tbIdx=BRD_BOARD (accessed on 30 November 2011).
- Park, C.S.; Kim, S.H.; Choi, L.J.; Kim, J.W. Time-Space Integrated Numerical Forecasting Technology Development Project Focused on Preliminary Preparation for Meteorological Disasters. Science & Technology Policy Institute. Available online: https://www.kistep.re.kr/getFileDown.jsp?fileIdx=10733&contentIdx=13147&tbIdx=BRD_BOARD (accessed on 30 August 2019).
- BAI. Status of Development Project for Numerical Forecasting Model. Board of Audit and Inspection of Korea. 2020. Available online: http://www.bai.go.kr/bai/cop/bbs/detailBoardArticle.do?mdex=bai20&bbsId=BBSMSTR_100000000009&nttId=126146 (accessed on 30 July 2020).
- NWS. National Weather Service: NWS Directory of Private Weather Service Providers. 2020. Available online: https://www.weather.gov/im/metdir (accessed on 10 September 2020).
- ISIC. International Standard Industrial Classification of All Economic Activities Revision 4; Series M: Miscellaneous Statistical Papers, No. 4 Rev. 4; United Nations: New York, NY, USA, 2008. [Google Scholar]
- WB. World Bank Country and Lending Groups: World Bank List of Economy. 2019. Available online: https://datahelpdesk.worldbank.org/knowledgebase/articles/906519-world-bank-country-and-lending-groups (accessed on 10 September 2020).
- OECD. DAC List of ODA Recipients. Available online: https://www.oecd.org/dac/financing-sustainable-development/development-finance-standards/daclist.htm (accessed on 11 September 2020).
- WMO. WMO Strategic Plan (2012–2015). 2011. Available online: https://library.wmo.int/?lvl=notice_display&id=6479#.X2SM-GgzaUk (accessed on 30 October 2020).
- Sharma, P.; Singh, A.K.; Agrawal, B.; Sharma, A. Correlation between weather and COVID-19 pandemic in India: An empirical investigation. J. Public Aff. 2020, e2222. [Google Scholar] [CrossRef]


Publisher’s Note: MDPI stays neutral with regard to jurisdictional claims in published maps and institutional affiliations. |
© 2020 by the authors. Licensee MDPI, Basel, Switzerland. This article is an open access article distributed under the terms and conditions of the Creative Commons Attribution (CC BY) license (http://creativecommons.org/licenses/by/4.0/).