Article

Enhancing Preservice Teachers’ Key Competencies for Promoting Sustainability in a University Statistics Course

Department of Mathematics Education, Sungkyunkwan University, Seoul 03063, Korea
*
Author to whom correspondence should be addressed.
Sustainability 2020, 12(21), 9051; https://doi.org/10.3390/su12219051
Submission received: 13 October 2020 / Revised: 27 October 2020 / Accepted: 28 October 2020 / Published: 30 October 2020

Abstract

:
In this rapidly changing world, universities have an increased responsibility to prepare professionals for a sustainable future, and teacher education is not an exception to this. In this study, we observed a group of preservice teachers engaging in a statistical investigation project. Specifically, we examined their degree of statistical knowledge; how effective the project was in enhancing their statistical knowledge and thinking; and how they participated in the project to make and share data-driven decisions. To this end, both qualitative and quantitative investigations were used. With the help of pre- and posttests, we found that the degree of knowledge differed between self-perceived and measured knowledge. Moreover, the results demonstrated the project’s effectiveness in enhancing the participating teachers’ statistical knowledge and thinking, specifically estimating the population mean and its interpretation. In making and sharing their decisions, the participating teachers applied multiple key competencies, crucial for promoting sustainability. Thus, the statistical investigation project was effective for enhancing preservice teachers’ statistical knowledge, thinking skills, and ability to promote sustainability.

1. Introduction

As the world experiences rapid environmental, social, and economic transformations, sustainability is becoming increasingly important. The fourth industrial revolution and use of big data are examples of such changes. To prepare for the uncertain future, the United Nations (UN) published the 2030 Agenda for sustainable development [1]. In this report, the UN declared its aim of ending poverty and of promoting global social justice, announcing 17 Sustainable Development Goals (SDG) that contribute to promoting sustainability. Some of these goals address the quality of education and a reduction of inequalities. Taking a step further, the United Nations Educational Scientific and Cultural Organization (UNESCO) suggested the key competencies that are important for attaining sustainable development and the necessity of teaching. The key competencies include systems thinking (“analyse complex systems” and “deal with uncertainty”), anticipatory (“understand and evaluate multiple futures”), collaboration (“facilitate collaborative and participatory problem solving”), and critical thinking (“reflect on one’s own values, perceptions, and actions”) [2]. A university statistics course is one possible place where these key competencies can be addressed. Statistics is a powerful tool to improve such competencies because it anticipates future possibilities, allowing people to make informed action plans and to promote sustainability [3,4]. This is clearly emphasized in the fourth component of statistical problem solving [4]. Statistical problem solving typically consists of the following components: formulate questions, collect data, analyze data, and interpret results [4]. When interpreting results, accepting variability is central. By accepting variability, one “looks beyond the sample… and must allow for the possibility of variability of results among different samples” [4]. That is, statistical process requires the competency of systems thinking when anticipating future. Therefore, courses in statistics can enhance students’ ability to deal with uncertainties (i.e., systems thinking) and to consider various futures (i.e., anticipatory). Acutely aware of this recent trend, researchers and policy makers have emphasized the need for statistics education [5,6].
However, not all statistics courses support students’ development of the key competencies. Most traditional statistics classrooms tend to focus on delivering statistical formulas to students while neglecting the need to enhance students’ conceptual understanding. For this reason, such courses have been evaluated as incapable of improving students’ key competencies, such as interpreting and anticipating future situations using statistics [7,8,9,10,11,12]. Reflecting on this limitation, current researchers choose an alternative approach to teach statistics. This provides an opportunity to engage in statistical investigation across the entire process, including data collection, analysis, and interpretation [13,14,15]. The courses incorporating statistical investigation allow students to consider real-time data. Moreover, by understanding, analyzing, and interpreting the data, students can experience the process of predicting an uncertain future [11,16,17]. The Literature Review section includes a detailed analysis of this issue.
For widescale application of the previously mentioned alternative approach, teacher education programs play a central role because instructions are heavily influenced by the learning opportunities that teachers are capable of generating in a classroom [18,19]. That said, teachers need to experience statistical investigation to teach their students accordingly [20]. Although scarce, the literature on teachers’ statistical literacy claims that a vast number of teachers consider statistics to be difficult, besides holding a few misconceptions. Moreover, they did not feel confident about teaching statistics [7,21,22,23]. Therefore, it is contextually relevant to discuss what teacher education courses could offer toward enhancing preservice teachers’ capacity for teaching statistics and enhancing their key competencies. Universities and colleges offering teacher education programs have received attention due to their central role in preparing next-generation professionals in promoting sustainability [24].
This study contributes to the previously mentioned literature by focusing on designing and implementing a project-based statistics lesson for statistical investigation. To this end, we designed a project for a course offered by a college of education in a prestigious university in the Republic of Korea. In particular, the project aimed at enhancing preservice teachers’ key competencies, as suggested by UNESCO, to promote sustainability. In addition to the two competencies (i.e., systems thinking and anticipation) drawn from the nature of the statistical process, we address two more competencies, namely collaboration and critical thinking. We asked students to work in groups of 3–4 to enhance their collaboration competency. Critical thinking competency was introduced in the context of the project. The project used the data on shadow education from the government’s MicroData Integrated Service [25]. In East Asian countries, including the Republic of Korea, shadow education has been a concern for educational researchers due to the possibility of affecting social justice and of accelerating educational stratification. Therefore, this study’s activity had the potential to stimulate university students’ opinions on reducing inequality and to develop their critical thinking competency. Moreover, the results of the study show a growth in preservice teachers’ key competencies consequential to their participation in the project. Specifically, we investigated the following research questions:
  • What statistical knowledge do preservice teachers have?
    • What is the self-perceived degree of statistical knowledge?
    • What is the measured degree of statistical knowledge?
    • What is the relationship between the self-perceived, premeasured, and post-measured degrees of statistical knowledge?
  • How effective is the project with statistical investigation in terms of enhancing preservice teachers’ statistical knowledge?
    • What is the degree of increase in statistical knowledge consequential to the statistical investigation project?
    • How did the increase in statistical knowledge occur?
  • How did the project support preservice teachers’ development of statistical thinking?
    • How were preservice teachers engaged in groupwork presentations?
    • How did the project support preservice teachers in making data-driven decisions?
These research questions reflects our hypothesis. The first research question assumes that preservice teachers with high self-perceived degree knowledge show a high measured degree of knowledge from the posttest at least. By examining the second question, we expected to see at least some increase in statistical knowledge. Among various statistical topics, we hypothesized that statistical inference would be the topic of most increase because it was the main focus of the investigation project. The last research question reflects our expectation that the participating preservice teachers enact various key competencies for the promotion of sustainability.

2. Literature Review

2.1. Statistical Knowledge and Statistical Thinking

Before we elaborate on the importance of learning statistics for promoting sustainability, we first review the literature examining the meaning of statistical knowledge and statistical thinking. Statistics education researchers have suggested that traditional statistics teaching and learning methods overemphasize memorization of statistical facts [26]. They posit that statistics education should focus on improving students’ statistical literacy, reasoning, and thinking. According to Ben-Zvi and Garfield [26], statistical literacy includes “basic and important skills that may be used in understanding statistical information or research results.” Statistical reasoning refers to “the way people reason with statistical ideas and make sense of statistical information” [26]. Both statistical literacy and reasoning involve the ability to understand the given statistical information. Statistical thinking “involves an understanding of why and how statistical investigations are conducted and the ‘big ideas’ that underlie statistical investigations” [26]. Statistical thinking allows one to take an appropriate approach to dealing with the given data. Moreover, it also allows one to critically examine results from each statistical investigation. That is, a statistical thinker is more of a producer than a consumer of statistical information. In this study, we focused on preservice teachers’ statistical knowledge and statistical thinking ability. Statistics education researchers’ concerns with statistical knowledge are related to an overemphasis on statistical knowledge. They suggest that, first, statistical knowledge should be developed, followed by a subsequent focus on statistical investigation rather than totally rejecting the former [26]. As discussed above, statistical knowledge involves systems thinking and anticipatory competencies. To address concerns from prior research, we also discuss statistical thinking to observe preservice teachers’ growth as statistical thinkers who can collaborate and think critically.
As previously stated, statistical thinking is perceived as a compulsory future social competence that students must possess. To achieve the goal of attaining statistical thinking competence, statistical knowledge must exist as a basis. Nevertheless, research on preservice and in-service teachers indicates a lack of statistical knowledge competence. For example, they had misconceptions about sample, sampling, and sampling distribution. Particularly, teachers were not aware that a small sample size has more variability than a large sample size [23,27]. Further, when determining a sample’s degree of representativeness, they often erroneously drew on the sample size rather than the sampling procedure [28,29,30]. Teachers also struggled to understand the graphical representation of sampling distribution, according to the sample size [31]. Statistical inference (e.g., estimating the mean and proportion) was the knowledge that teachers felt uncertain about and had misconceptions on, more than sample, sampling, and sampling distribution [7,32,33]. According to Choi et al.’s study [32] of in-service teachers who taught statistical inference, their knowledge on the degree of confidence did not go beyond that of the high school level. In addition, only a small number of teachers demonstrated clarity in understanding the meaning of a confidence interval. Thus far, the research reviewed indicates that, when it comes to statistics and teachers’ education, statistical knowledge should be seriously considered because teachers mostly struggle in this area.
While sufficient statistical knowledge is important, simply having knowledge does not suffice for applying statistics in the real world to interpret situations and problems that we may face in our daily lives. Students’ statistical knowledge needs to be developed to statistical thinking, which is how a professional statistician thinks [34]. That is, statistical thinking includes knowing when to use a particular statistical approach, understanding the limitations of that approach, working on contextualized problems, and reaching proper conclusions from statistical investigations and contextual information [35].
Unfortunately, because statistical education has focused on statistical knowledge rather than on statistical thinking, it is unrealistic to expect that teachers would have sufficient statistical thinking abilities [27,36]. In fact, teachers had difficulty performing at an expected level of such an ability [37,38,39,40]. In Lovett’s study [41], of the 236 prospective teachers, she revealed that they not only had an insufficient amount of statistical knowledge but also showed weakness in interpreting statistical results. Watson and Moritz [42] reported similar results where prospective teachers collected samples that did not properly represent the population. Altogether, despite the importance of statistical thinking, teachers are not prepared to properly guide students because they lack sufficient ability to cover the subject. Indeed, this does not devalue statistical knowledge. Rather, it emphasizes the importance of acquisition and application of statistical knowledge.
Based on literature indicating the limitation of the current statistics education system, we proposed a project-based lesson covering data analysis and targeted students’ statistical thinking competence alongside their statistical knowledge. While exploring the project developed in the current study, we found that students needed to apply this statistical knowledge in real-world situations rather than to simply know it. Moreover, before incorporating the lesson into the university’s course—which was opened in the department of mathematics education—students’ statistical knowledge was evaluated to gauge its sufficiency for investigating the entire process of data collection, analysis, and interpretation. We assumed that if project lessons focusing on statistical thinking are provided to preservice mathematics teachers, they would be able to practice it in their future teaching endeavors. In the following, we present how learning statistics contributes to enhancing key competencies for promoting sustainability, after discussing the literature on teacher education and statistical investigation.

2.2. Teacher Education with Statistical Investigation Projects and Sustainability

Building statistical thinking ability requires experience with statistical investigations grounded in real-world contexts [43]. Therefore, it is important for prospective teachers to become engaged in projects with statistical investigation in teacher education programs [13,14,15,41,44]. To be competent in statistical thinking goes well beyond procedural mathematical knowledge. Experience with real data and a thorough consideration of real-world contexts are known to be effective for enhancing statistical thinking ability, even though it is often muddled and leads to no single correct answer [45,46]. Several researchers, from their qualitative examination, suggested the importance of real-world-based activities for prospective teachers [14,15]. Francis et al. [13] reaffirmed this point with their quantitative investigation showing prospective teachers’ growth in statistical thinking after engaging in project-based learning experiences incorporating statistical investigation. They showed that the preservice teachers who engaged in technology-aided complex problem-solving tasks showed improvement at the posttests. Thus, for prospective teachers, such an engagement proves to be effective in learning statistics.
Teachers with statistical investigation experience not only gain better statistical knowledge but also are more likely to effectively teach their students. This is primarily because teachers and students can better learn statistics when they gather experience in related investigation. Recent research on statistics education have suggested that a project-based approach to statistical investigation is more effective than traditional ways of teaching, which rely heavily on mathematical procedures [43,45,47,48]. Moreover, teachers learning statistics with investigative approaches are better prepared to apply a similar teaching method in their classrooms. In general, teachers, particularly at the initial teaching stage, drew on practices of the teachers they met as students [35,49,50,51]. Hence, it is reasonable to expect that teachers who learned statistics close to real-world contexts are likely to incorporate that learning experience into their teaching methods [40].
Further, teachers with experience in statistical investigation can expand on it to enhance their teaching with data-driven decisions. There is an increasing global demand on schools and teachers to use data to improve teaching [52,53,54]. Although results are mixed regarding the impact of training programs on data use at school [54], some studies found teachers’ collaborative use of real data helpful [52,55,56]. From such an experience, teachers not only learn statistics but also practice the habit of using statistics to understand their situation. In Green et al. [56], teachers who are engaged in such an activity developed a much deeper understanding of their students: these teachers addressed limitations of their investigation and, at times, attempted to understand the data by suggesting an alternative storylines, which is probably impossible without having played with real data.
Researchers in statistics education have been asserting the importance of technology for performing authentic statistical investigations [57]. There are at least three different ways to use technology in statistics classrooms. First, one can use technology to acquire data-rich project-based learning [45,58,59]. While data collection is an important aspect of the statistical process, collecting a rich dataset is time consuming and requires careful design that novices often find difficult. However, some statistical investigations are almost impossible to perform with a small dataset. Using published data can resolve this issue. With Internet access, students and teachers can visit data repositories and can download quality datasets, which enables them to practice their preferred statistical investigation method [59,60]. Another way to incorporate technology is to use such software as those specifically developed for the purpose of statistical investigation or for the teaching of it. Fathom, TinkerPlots, R, and spreadsheets are examples of such software [61,62,63]. Finally, teachers can use technology to facilitate communication among students [64,65]. Dynamic documentation tools (e.g., wiki) were also found to be effective in supporting students’ development of communication skills when learning statistics [66,67].
As discussed earlier, investigation-based instruction—a pedagogical approach for enhancing statistical thinking—has been found to work better for acquiring statistical knowledge than the traditional approach. Therefore, we suggest that such a pedagogical approach also contributes to the improvement of key competencies for sustainable development [2]. For example, UNESCO defined systems thinking as the ability to recognize and understand relationships; to analyze complex systems; to consider how systems are embedded within different domains and scales; and to deal with uncertainty and anticipatory as “the abilities to understand and evaluate multiple futures—possible, probable, and desirable—to create one’s own visions for the future; to apply the precautionary principle; to assess the consequences of actions; and to deal with risks and changes” [2]. These key competencies are closely connected to the application of statistics. At the very heart of statistics lies the requirement to deal with uncertain situations and to make best guesses from the available information. For a more accurate guess, one must consider relationships between various factors and must embrace their complexity. Hence, statistical knowledge and thinking address systems thinking. In addition, because statistics deal with making forecasts, it involves creating visions for possible and probable futures. Statistical thinking also involves reaching proper conclusions. Thus, to some degree, it involves the ability to make data-driven decisions based on one’s assessment of possible consequences of actions. Because of these characteristics, statistical knowledge and thinking contribute to one’s development of the anticipatory competency. The third key competency relevant to the current study is collaboration. UNESCO defines collaboration as quoted below [2]:
  • the abilities to learn from others; to understand and respect the needs, perspectives, and actions of others (empathy); to understand, relate to, and be sensitive to others (empathic leadership); to deal with conflicts in a group; and to facilitate collaborative and participatory problem solving.
The collaboration competency may seem to be less involved with statistics, but this is not the case. When statistics is taught via group investigation, learners are naturally given multiple opportunities to practice empathy and to work in harmony with others. That is, the pedagogical approach with proven effectiveness in teaching statistics works equally well for improving this key competency. Finally, critical thinking can also be addressed. According to UNESCO, critical thinking competency is “the ability to question norms, practices, and opinions; to reflect on own one’s values, perceptions, and actions; and to take a position in the sustainability discourse” [2]. In this study, as discussed in the following section, participants were given opportunities to present their insights from statistical investigations with their classmates. This made them critically evaluate others’ work and to reflect on the statistical process employed. Another opportunity for developing the critical thinking competency was provided from the data used in this study that was about shadow education. This is closely related to social justice and the sustainability of equitable society. Therefore, we suggest that a statistical investigation project could be designed for enhancing at least four key competencies which could drive our society to a more sustainable direction.

3. Materials and Methods

3.1. Participants

This study was held in the college of education of a prestigious university in Korea. A total of 28 preservice teachers, enrolled in a mathematics course, participated in this study. The participants were all Korean, including 20 men and 8 women. All but two participants majored in mathematics education. Of the 28 participants, all but three were first-year students. In addition, three students were in their fifth-year, fourth-year, and second-year, respectively. All participants learned statistics in high school and therefore had some level of familiarity with the statistical contents.

3.2. The Statistical Investigation Project

We provided a project for statistical investigation for six consecutive sessions. Each session took 75 min, and we met twice a week (see Table 1). At the first session, the participants took the pretest. During the first and the second sessions, a graduate student delivered a mini lecture covering most of the contents regarding a population mean. The participants began their investigation in the third session. For their investigation, we provided them spreadsheets with actual data collected in 2018 from more than 7500 students. The data contained information about students’ participation in shadow education, with additional information about their grade level, region, parents’ educational level, etc. [25]. Three to four participants worked as a group to carefully observe the information available from the given spreadsheet. Based on their observations, they nominated research questions and organized the dataset so that they could work with only the necessary amount of information to answer their research question. The statistics computer software, R, was introduced during the fourth session. Because most of the participants had no experience in R, we allocated time for learning its usage. At least one participant from each group brought their own laptop. We prepared five extra ones in case the software did not work on the participants’ computer as originally intended. The participants practiced basic skills necessary for understanding R and for continuing the investigation project. During the second half of the fourth session, the participants applied their recently learnt R skills to the dataset which they organized according to their own research question. The fifth session was allocated for finalizing their investigation and for preparing a slide to present their work to classmates. In the slide, we asked participants to include their research question, their investigation process, the results of the investigation, and the decision they made as a future teacher based on the investigation results. The posttest was conducted toward the end of the fifth session. During the final session, we let the participants choose a random number and present their work accordingly. We chose to do so because of insufficient time for everyone to present their work. We gave the participants a link to a Padlet page so that they could leave comments as they listened to the presentations. Thereafter, the presenting group reviewed the Padlet to answer the comments. The final requirement of the project was to submit an individual reflection paper. Individual reflection papers asked the participants (1) to discuss, as future teachers, possible treatments derived from data; (2) to indicate with a six-point Likert scale their statistical knowledge confidence and the degree to which the project helped them acquire the confidence level (this part consisted of seven topics; hence, there were 14 questions across knowledge acquisition and effectiveness of the project); (3) to choose topics (from the seven topics) that they were least and most confident with and to explain the reason; and (4) to indicate the most challenging topic from the project and new knowledge acquisitions.

3.3. The Pre- and Posttest Sheet

The test sheet was developed to assess the participants’ statistical knowledge and thinking. To develop the test sheet, we first examined six high school textbooks and identified four topics that are important for teaching high school statistics: the meaning of population and sample (topic 1), sampling (topic 2), population means and sample means (topic 3), and estimation of the population mean and its interpretation (topic 4). Next, we reviewed the literature related to preservice and in-service teachers’ statistical knowledge. Consequently, the 27 items in the test sheet came from Locus [68], Choi et al. [32], and Han et al. [33], in addition to two high school textbooks [69,70]. All Locus items were translated into Korean, and some were modified to reflect Korean educational contexts.
For qualitative research, participants were asked to describe the reason for choosing answers to all questions on their test paper. We excluded data from participants who failed to submit any of the pretest, posttest, or individual reflection papers. Therefore, six participants were excluded and 23 participants were included.
To ensure the reliability of statistical knowledge test items, inter-item reliability was carried out, and as the Kuder–Richardson formula 20 (KR-20) value was 0.707 (>0.6), an acceptable level of reliability was secured. The statistical knowledge test was coded “1” if it matched each question item and “0” if it was incorrect because it was a mixture of various types of question items (descriptive short-answer, selection). Therefore, the analysis was carried out with KR-20 applicable to binary data from among various methods for determining the degree of consistency within an item. To ensure validity, we conducted a content validity test to determine whether the core content of each topic is included in the statistical curriculum. Thus, we excluded one item that could be controversial and used 26 items that ensure validity of this study.

3.4. Data Analyses for Each Research Question

For the current study, we employed a mixed methods analysis focusing more on qualitative analyses. The main goal of the study was to qualitatively examine the mathematical thinking of preservice mathematics teachers. Although the quantitative analysis was performed with a small sample size, the aim was to explore the approximate attributes of preservice mathematics teachers’ statistical knowledge before viewing the qualitative research results in detail.

3.4.1. Research Question 1

To answer the first research question, we analyzed the scores from pre- and posttests and the items asking about self-perceived degree of statistical knowledge from the individual reflection paper. The items were from the national guideline for assessing students with the recent mathematics curriculum. For each of those items, we asked how the preservice teachers evaluated their statistical knowledge. They were asked to self-report the survey items (e.g., ”I can explain the relationship between the sample mean and the population mean”) using a six-point Likert scale. SPSS 23 was used to analyze the descriptive statistics from the following entries: the self-perceived and the measured degrees of statistical knowledge from the pre- and posttests. In addition, we adjusted the mean value with a six-point scale and named it the “modified mean.” We also calculated correlation coefficients among the three variables of self-perceived, premeasured, and post-measured scores to disclose the relationships between self-perceived and measured scores of statistical knowledge.

3.4.2. Research Question 2

Pre- and posttest scores were analyzed with SPSS 23. A paired t-test was used to examine if the differences between the scores from pre- and posttests were statistically significant. Before running the paired t-tests, Shapiro–Wilk tests were implemented to verify that the collected data was of normal distribution. Following the verification process, the paired t-test was applied. However, if the Shapiro–Wilk test indicated that the variable was not of normal distribution, paired Wilcoxon signed rank tests were used. In addition, we reviewed responses of the test items that affected their test scores. Such an analysis was conducted to provide an in-depth understanding of participants’ learning and the potential of the project. In the case of the last item, which is a true–false question, the majority of participants did not describe the reason for their answers. Therefore, we excluded it from the qualitative examination.

3.4.3. Research Question 3

To answer this research question, we drew on participants’ group presentations, their comments to each presenter on Padlet, and their individual reflection papers. All groups submitted their presentation slides, and all participants left at least one comment; 23 submitted the individual reflection paper. The study asked the participants to describe the treatments they came up with based on the data. Particularly, they were asked to answer the following question: Do you see any difference between the treatments you stated before and after seeing the results of your statistical investigation? What might be the reason for such similarity and/or difference? We drew on thematic analysis [71,72] to classify participants’ engagement types. First, we reviewed the data to familiarize ourselves with it and to make initial observations to identify findings worth reporting in this paper. For the group presentation and comments, we focused on evidence showing their practice of key competencies while engaging in data-driven decision making, either in their own group or when listening to other groups. With the individual reflection paper, we generated an initial coding frame for further analysis. These coding frames consisted of thematic categories [72], including the descriptive types of participant reflections. Revisiting data with the initial coding frame, we revised and finalized it. The five categories in the coding frame are (1) maintaining treatment because the statistical investigation showed expected results; (2) revising the initial treatment after statistical investigation; (3) recognizing limitations of the statistical investigation, and (4) others (consisting of two participant responses: one that maintained the same treatment, though the statistical investigation showed unexpected results, and the other that stated ”don’t know.”). In the Results section, we focus our discussion on the first three categories.

4. Results

4.1. What Statistical Knowledge do Preservice Teachers Have?

4.1.1. What Is the Self-Perceived Degree of Statistical Knowledge?

For all four topics, the means of the self-perceived degree of statistical knowledge were higher than five points (i.e., I am confident in general) (see Table 2). The minimum and the standard deviation varied to some extent across the four topics. Topics 2 and 4 had a minimum of four, while Topics 1 and 3 had five. In addition, the standard deviation was larger for topics 2 and 4 than the other two. This indicates that the participants were less confident for topics 2 and 4 than topics 1 and 3.

4.1.2. What Is the Measured Degree of Statistical Knowledge?

In Table 2, the mean for topics 1–4 measured by the test is given as “Mean of Topics 1–4.” As in Table 2 below, the “Mean of Topics 1–4” was 4.321 at the beginning (i.e., pretest) and 4.69 at the end (i.e., posttest) of the investigation project. In addition, the standard scores of the measured degrees of statistical knowledge for each topic were not the same, so the modified score of 6 was presented as “M. Mean” (modified mean) in Table 2. Specifically, at the pretest, modified means for each topic (1–4) were 4.87, 5.22, 3.49, and 3.70, respectively. At the posttest, modified means for each topic (1–4) were 5.22, 5.48, 3.65, and 4.41, respectively. The mean for topic 3 was the smallest in both the pre- and posttests.

4.1.3. What Is the Relationship between the Self-Perceived, Premeasured, and Post-Measured Degrees of Statistical Knowledge?

We calculated the correlation coefficients between the self-perceived degree of statistical knowledge and the pre- and post-measured degrees (see Table 3). The analysis of the correlation between the self-perceived and the measured degrees of statistical knowledge showed no significant correlation in most cases. The only statistically significant correlation coefficient was between the self-perceived and premeasured degrees of statistical knowledge in Topic 3, even though the self-perceived degree of statistical knowledge was measured at the end of the investigation project. Meanwhile, the correlation coefficients between the pre- and post-measurements in topics 2–4 were 0.519, 0.450, and 0.561, respectively, with a significant positive correlation.
This finding suggests that the participants’ self-perceived degree of knowledge should not be interpreted as reflective of the actual degree of knowledge. Rather, it is likely that there is a discrepancy between the two.

4.2. How Effective Is the Project with Statistical Investigation in Terms of Enhancing Preservice Teachers’ Statistical Knowledge?

4.2.1. What Is the Degree of Increase in Statistical Knowledge Because of the Statistical Investigation Project?

Before conducting t-tests to examine if the measured degrees of statistical knowledge had changed between pre- and posttests scores, Shapiro–Wilk tests were run. For the results, the variables Mean of Topics 1–4 and topic 4 were analyzed with t-test and the variables topics 1–3 were analyzed with Wilcoxon signed rank tests. From the results of question 1, we presented a comparison of the means from the pre- and posttests. Here, we conducted a t-test to see if the difference in means is statistically significant (see Table 4).
As shown in Table 4 above, the mean of the measured degree of statistical knowledge was 4.32 at the beginning and increased by 0.37 at the end of the investigation project. This increase is statistically significant because the probability of significance of the paired t-test is less than 0.05.
The post-score for topic 1 (6 points maximum) was 0.35 points higher than the prescore (4.87 → 5.22), but the Wilcoxon signed rank test showed a significant probability of being greater than 0.05; therefore, this result is not statistically significant. The Wilcoxon signed rank test in topic 2 (5 points maximum) showed an increase in postscore over prescore (4.35 → 4.57), but this was not statistically significant. The postscore for topic 3 (5 points maximum) was up 0.13 points from the prescore (2.91 → 3.04), but the Wilcoxon signed rank test showed a significant probability of being greater than 0.05; therefore, this result is not statistically significant. The increase of 1.18 points (6.17 → 7.35) for topic 4 (10 points maximum) is statistically significant (d = −0.49) because the significance probability is less than 0.05 in the paired t-test. As for each topic, the increase of mean from each topic was not significant, except for topic 4. Therefore, the investigation project is likely to be effective for the participants’ learning of topic 4: “statistical inference and its interpretation.” The effect sizes for each topic are negative numbers (see Table 4), which means that the mean of the results of the pretest is smaller than the mean of the results of the posttest [73]. Based on Cohen’s (1988) criteria for effect size, which suggests that d = 0.2 is considered a small effect size, 0.5 represents a medium effect size and 0.8 represents a large effect size [74]; topics 1, 2, and 4 were found to have a medium effect size because they were greater than 0.2 and less than 0.5, but topic 3 was found to have a small effect size because it was smaller than 0.2.

4.2.2. How Did the Increase of Statistical Knowledge Occur?

Although the difference between pre- and posttests was found to be significant for only one topic, this does not imply that the investigation project had no effect on participants’ learning of the other three topics. Here, we explore the test responses to understand the project’s potential for enhancing statistical knowledge by focusing on the most predominant approach observed from the responses.

Topic 1: Meaning of Population and Sample

The participants showed improvement in the items in topic 1, which asked them to identify why a certain data collection process is improper. A particular item gave a short passage on two students collecting data. In that passage, both students wanted to collect data for their schoolmates’ preferred music. They asked students from a specific classroom and those they met in the hallway. The participants need to answer if they could understand school students’ preferred music. To properly address this item, participants need to understand the definitions of population and sample as well as that of random sampling. In the pretest, some participants answered that the data collection process is flawed because either the size of the sample is not large enough or the survey should provide several lists of genres to avoid collecting varied answers. However, in the posttest, they were able to provide the right explanation: the data overrepresents the preferences of a certain group of students.

Topic 2. Sampling

The participants showed improvement on several items related to topic 2. An item closer to the examination asks: “Determine whether it is proper to ask all Korean high school students to understand Korean teenagers’ sleeping time.” In the pretest, participants answered that it is proper because it is asking all students in the nation, as opposed to from a certain region, and because high school students are teenagers. In the posttest, the participants were able to properly answer the item, stating that it is improper because high school students do not represent teenagers.

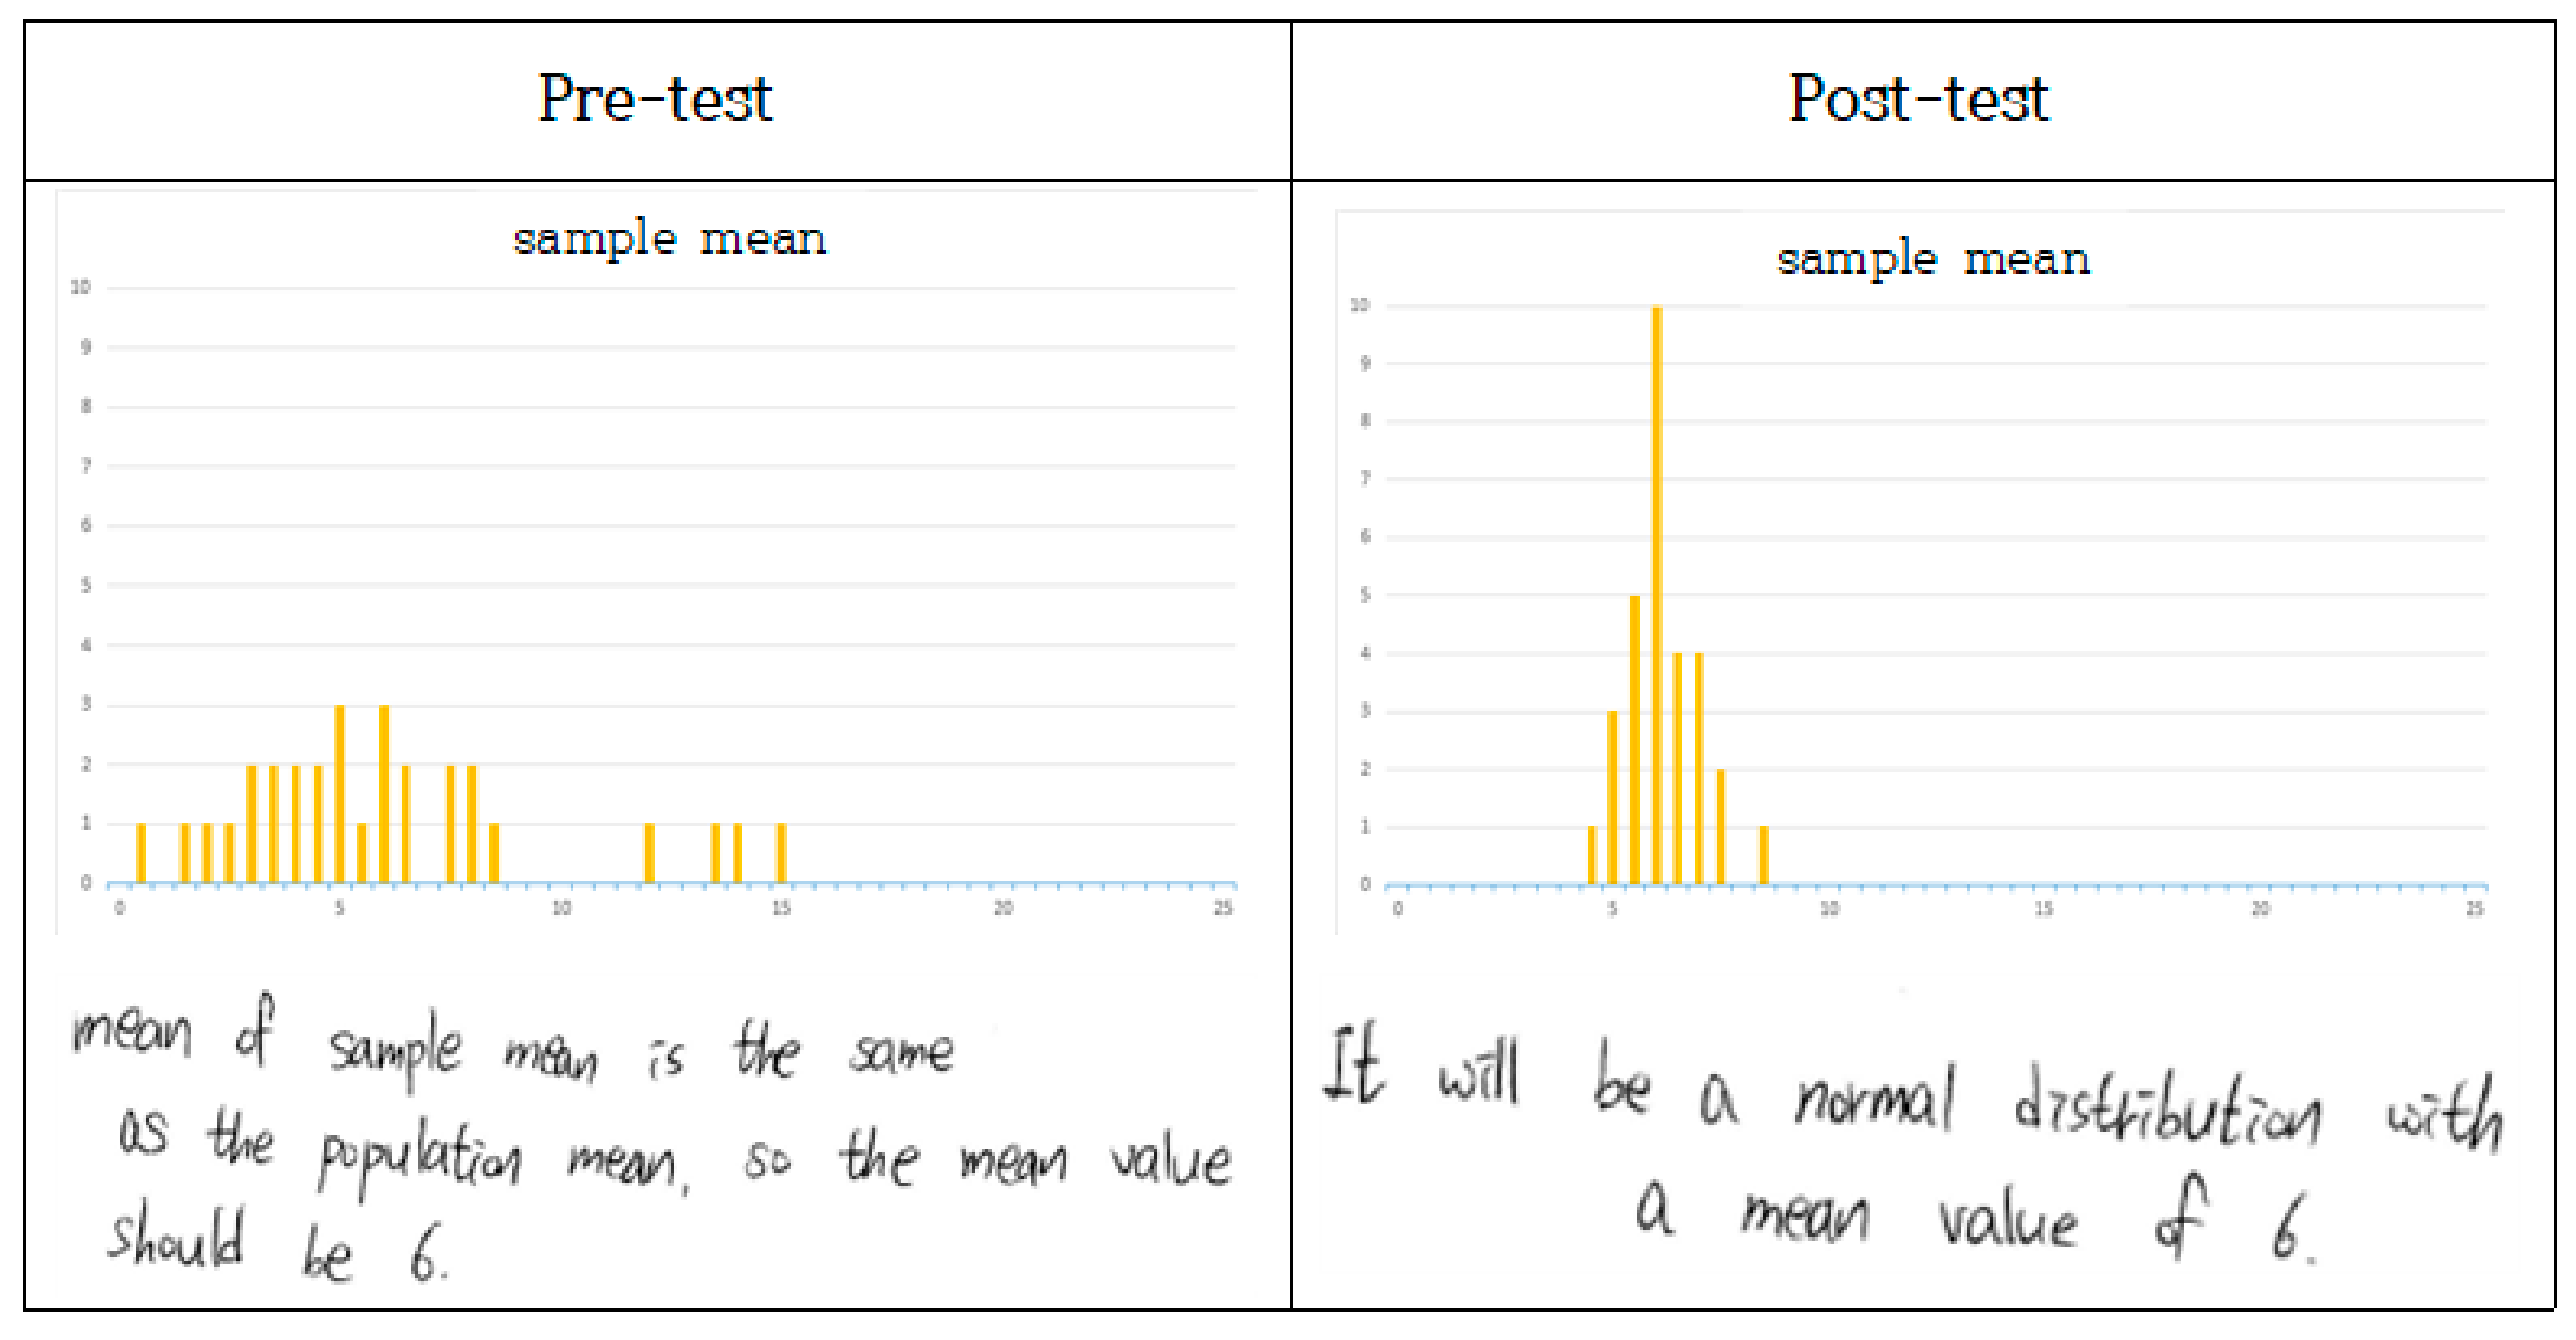
Topic 3. Population Means and Sample Means

Numerous participants showed improvement in the item concerning choosing a bar graph of sample means. To correctly answer this item, one should choose the bar graph with a mean of six, approximately following a normal distribution. We found lots of pretest sheets that did not answer this item or focused on only the mean. In the posttest, the participants found the correct bar graph with precise reasoning (see Figure 1).
Another item from topic 3 asked if the preservice teachers understand that the variability of sample means is smaller than that of the population. The participants either did not answer the item or gave a wrong answer. They were able to choose the correct answer after the investigation project.
We found an interesting item in which one participant initially answered correctly in the pretest but not in the posttest. The item asked if it is true or false that the standard deviation of sample means will increase as the sample size increases, which is a false statement. The participant answered correctly in the pretest saying that: “The standard deviation of the sample means is the value that divides population standard deviation by the square root of the size of the sample. Therefore, the sample means’ standard deviation decreases as the sample size increases.” However, in the posttest, this participant said that the statement is correct “because it is 1 over square root of n times the standard deviation of the population.” This response is puzzling because the reasoning is similar between the pre- and posttest, but the answer is the other way around.

Topic 4. Estimating the Population Mean and its Interpretation

We found an interesting item for identifying the probability using standard normal distribution. When estimating probability, the participants could not provide a proper estimation because they forgot the formula for the estimation. A participant responded “I don’t remember it. This is the limitation of memorization-based learning of stat.” However, in the posttest, this participant not only found the correct answer using the formula but also provided a visual representation of the formula, indicating some level of conceptual understanding of statistical inference.

4.3. How Did the Project Support Preservice Teachers’ Development of Statistical Thinking?

4.3.1. How Were Preservice Teachers Engaged in Groupwork Presentations?

In the presentation, the participants were asked to provide the context of their study, questions under investigation, the results and interpretations, and their approach toward the issue if they were schoolteachers. The topics explored included, “reason for participating in shadow education”, “time spent in shadow education according to academic achievement”, “expense per purpose of shadow education”, “difference of the expense of shadow education according to order of birth”, etc. In their suggested treatment, most were centered around providing equal educational opportunities. For example, the birth order question may seem to be less concerned with educational equity. Through data analysis, the participants found that parents tend to spend less on a child born later; parents spent about four million won (the Korean currency) on the first-born child and one million won on the fifth child. This investigation showed that unjust distribution of educational opportunities exists among households with diverse socioeconomic statuses and within each household. The treatment suggested by this group included finding ways to support students with elder siblings. This group’s work shows that participants proactively and collaboratively explored their actions as professional teachers to bring equity and justice to their schools and to society at large. In addition, they had an opportunity to practice persuasively presenting their analytical process and claimed treatment by using proper representation of data. The left side of Figure 2 is an example of a group explaining why they used statistical inference rather than simply using the mean value of a sample. On the right is a slide from a different group that drew a graph to visually represent their findings.
Participants were given a link to a Padlet page where they could submit their feedback and comments while attending others’ presentations. This practice was effective for participants to simultaneously practice critical thinking and collaboration competency, which was evidenced by their comments about the investigation process and their interpretations. The depth of comments varied from simple ones such as, “What is the size of the sample?” to more complex ones: “What exactly do you mean by expense spent on shadow education for socializing?”, “Insecurity was found to be at a higher rank than you had originally expected. What do you think about it?”, and “Students with a higher level of academic achievement participate in afterschool programs to enhance their school record. This may take time away from shadow education. What do you think about this? And, what do you think about those students who are required to sign up for afterschool programs?” This shows that both presenters listeners of the presentations engaged in critical thinking for making precise data driven decisions. Another set of comments were encouraging messages to the presenting group. Numerous participants left positive comments such as, “The idea to use a graph for organizing all the findings is great.”, “Your interpretation of the results and treatments are impressive.”, “Nice work!”, etc. When the presenting group reviewed the comments, these positive messages contributed to building an atmosphere of trust for open discussions about their data-driven decisions. Moreover, it built a sense of collegiality in the group of professional teachers working toward making the world a better, more sustainable place.

4.3.2. How Did the Project Support Preservice Teachers in Making Data-Driven Decisions?

While going through the individual reflection papers, we observed some participants reporting that their treatment remained the same after the statistical investigation. This occurred when their initial expectation was supported by their analysis of the data. A participant who examined the household income and time spent on shadow education said that it was a rather straightforward anticipation based on reality. Indeed, the participant had repeatedly observed that, compared with students from high income families, those from low income families have less opportunities to participate in shadow education. Similarly, other participants indicated that, when the data analysis results resembled their initial anticipation, they did not modify the treatment.
Furthermore, participants revised their initial treatment after the statistical investigation when the results countered their anticipation prior to the data analysis. When the data analysis presented unanticipated results, the participants reoriented their thoughts to accommodate the data. For example, participant 3 stated that:
  • Before getting the results, I had originally anticipated that the number one purpose (of shadow education) would be supplementing and deepening lessons at school. Indeed, it was entrance preparations to the next level of the schooling system. I am certain that, for this purpose, shadow education includes consultation of the statement of purpose, training for on-site interview, etc. Such services are expensive and yet occur for a short period. During the project, I did not consider time as a variable, which might be the reason (for the discrepancy between my anticipation and the results from the data analysis).
In the excerpt above, the participant accepted the results from her data analysis and suggested a possible reason for the divergence from her original anticipation. Based on the data, she modified her treatment to thoroughly address entrance preparation at school, for example, finding ways to systematically provide interview practice opportunities at school. This demonstrates that, when the data presents a narrative that is opposed to their interpretation of the world, participants were quick to accept the data and to change their perspectives. That said, participants were aware of the data’s power as a window to reality. Thus, to accommodate the reality derived from the data, they were given an opportunity to practice critical thinking competencies by reflecting on their own perceptions.
Some participants went even further and accepted the results from their data investigations while noting that they still recognize limitations in the investigative process. However, these participants accepted the results with caution. For example, participant 27, who was in the same group as participant 3, indicated that they did not distinguish among data from elementary, middle, and high school. Participant 27 hypothesized that entrance preparation is more likely applicable for high school students while elementary students might draw on shadow education for the purpose of socializing and childcare. She explicitly emphasized that not separating students according to the school level is a limitation of their investigation. Another participant reported that their group tried to add another variable to better analyze the data but was not successful due to errors from R. A participant also mentioned that she wanted to separate school levels in her shadow education data analysis for nonacademic content (e.g., arts and gyms). However, she did not conduct such analysis because the size of the data set shrinks to the extent where further analysis may be less persuasive. Participants’ recognition of the limitations of their statistical investigations indicate that the project provided participants with a space not only to practice data-driven decision making but also to critically reflect on the data analysis process and to consider ways to conduct a more sophisticated analysis.

5. Discussion

Universities play a central part in preparing future professionals with the ability to promote sustainability. Drawing on UNESCO’s suggested key competencies necessary for advancing sustainability, we examined preservice teachers’ learning statistics by engaging in a statistical investigation project. Based on the results of this study, we provided implications for future competency education, such as decision making through data analysis.
The results of the study indicate that there are differences in the degrees of perceived and measured statistical knowledge. That is, we found that the participants exhibited high confidence regarding their degree of statistical knowledge, even though such confidence was not necessarily correlated to their statistical knowledge which was measured using pre- and posttests. This confirms findings from prior literature that the self-perceived degree of statistical knowledge may not align with one’s measured level of it [75].
For preservice mathematics teachers, the difference between the degree of self-perceived and measured statistical knowledge may not lead to a problem. However, if they overestimate their own statistical knowledge, they might not be fully aware of its vulnerability. We need to focus on this possibility because student learning is greatly influenced by the level of the teacher’s content knowledge, and in the case of misconceptions—particularly those of the teacher—they can become the student’s misconceptions [19]. Moreover, this might indicate the necessity of studying the impact of teachers’ perceived degree of statistical knowledge. Such research will help us better utilize teachers’ self-reports. Most importantly, statistical knowledge is closely connected to statistical thinking, and it addresses the key competencies of systems thinking and anticipatory. Thus, inaccurate self-portrait could prevent teachers from pursuing necessary competencies for promoting sustainable development goals.
The findings of this study show that preservice mathematics teachers possessed different levels of knowledge depending on the subareas of statistics. It should be noted that the scores related to the relationship between the sample mean and the population mean were the lowest in both the pre- and posttests. This can be interpreted as preservice mathematics teachers having insufficient knowledge regarding “the relationship between the sample mean and the population mean.” In addition, we cannot entirely rule out the possibility that participants were vulnerable to application problems, which led to the lowest score in this area. Because of the nature of the content, the items on the relationship between the sample mean and the population mean might be an application-level rather than a knowledge-level item, which can be simply solved by using formulas. Based on the difference in their performances according to the characteristics of the items, we wonder if the participants have not yet fully developed their systems thinking and anticipatory competences because sustainability addresses real-life issues wherein knowledge application is crucial. These interpretations should be supported by further studies, but educators who are training preservice teachers should fully consider these possibilities while designing and developing curriculum and instruction.
We observed a significant increase in test scores on topic 4: statistical inference. This result supports that the statistical investigation was effective for raising participants’ statistical knowledge. Because the statistical investigation was designed to foreground statistical inference, the test scores show that the investigation worked on teachers, as intended by the developers. Considering that teachers mostly struggle with statistical inference [32], this study provides teacher educators with a productive approach for supporting those struggling with the topic. Although the mean test scores increased for the other three topics, it was not statistically significant. This was somewhat expected because the other three topics were not emphasized in the project. Of the four topics that appeared in this study, statistical inferences have been used when anticipating a possible future within this complex world. This supports our claim that the investigative project supports preservice teachers’ development of key competences for enhancing sustainability. In addition, a careful review of the answer sheets gave us insight on this investigation project’s potential: supporting preservice teachers’ development of statistical knowledge across the four different topics. After the project, some participants developed a better understanding of population versus sample investigation and sampling process. Before and after the project, participants struggled with understanding the relationship between the population mean and sample mean. Therefore, a follow-up study is needed to enhance this aspect of the participants’ knowledge via an investigative project.
In relation to the effectiveness of the project developed and applied in this study, it is noteworthy that students’ scores before and after application of the project showed the greatest change in statistical inference. The project presents a real-world situation in which the population mean and its interpretation need to be utilized. This has led preservice mathematics teachers to experience a series of processes of collecting and analyzing data. The score mostly increased in the specific area targeted by the project. Thus, in addition to the project’s power for nurturing key competencies for sustainability, the content covered in the project and the teaching–learning method utilized were consistent with the learning objectives, and the effectiveness was partially verified. However, in the future, a similar study should be conducted to explore the effectiveness of project-based lessons for enhancing preservice mathematics teachers’ statistical thinking, given that the current study was a one-time application to a specific group of such teachers.
The reason that the project-based lesson developed in this study was effective in improving participants’ conceptual understanding of statistics and statistical thinking can be found in characteristics of the project-based instruction employed in this study. Its main characteristics are the introduction of project-based learning and the use of statistical computer programs. Several studies [10,11,27,36] indicate that statistics classes, which were common in Korean mathematics classrooms in the past, mostly focused on deductive statistical formulas and their application. This educational approach not only made students lose interest in statistics but also led them to lack statistical knowledge [7,32]. Reflecting on this, the statistics lessons developed in this study emphasized statistical concepts and processes rather than focusing on statistical formulas to enable students to recognize the usefulness of statistics, to be interested, and to thoroughly understand statistical concepts. This finding echoes prior research that claimed the role of technology in teaching statistics for sustainability [76]. Considering the importance of mathematics and statistics in particular for sustainability [77,78,79,80] combined with the fact that technology enables much more authentic statistical investigation, this topic is worth further examination. In the future, educators looking to develop statistical education must remember that these two pedagogical features were effective in fostering students’ statistical thinking and, in turn some, of the key competencies.
In developing the task for statistical education, we aimed to establish statistical thinking beyond statistical knowledge as the goal of education. Although the pre- and posttest items seemed to be focused on statistical knowledge, we tried to track how their statistical thinking improved by referring to the solving processes and explanations of the students’ answers. The qualitative analysis of the students’ answers to the pre- and posttest items has, to some extent, fostered the students’ statistical thinking. In this regard, we have shown a case that partially overcomes the limitations of statistical education by focusing on statistical knowledge. In this study, statistical thinking was qualitatively analyzed, but if a quantitative tool that measures statistical thinking is developed, objective measurement of statistical thinking would be possible. This spells out the need for further research.
Answering the last research question, we found that students were given opportunities to practice multiple key competencies, including collaboration and critical thinking, for sustainable development. Such a practice of competencies occurred during the process of making data-driven decisions and in examining others’ decisions. Technology played a central role in numerous aspects of the process—from organizing data to analyzing them, sharing decisions, and commenting on those decisions. This was not surprising considering that prior research emphasized the role of technology in teaching statistics [57]. Particularly, using technology for sharing and commenting provided participants with opportunities to collaborate within their group and the whole class. When considering the role of technology in teaching statistics, the most discussed topic was tools for statistical investigation. However, this study shows that an online communication tool should not be neglected as it could promote students’ competency to collaborate. In addition, students productively engaged in the process of practicing their professional identity as future teachers by making data-driven decisions for social justice and equity or critical thinking. This opportunity was partially available from the context chosen for the investigation project—shadow education. We did not discuss how shadow education might negatively impact social justice and maintain social stratification due to time constraints; however, the participants were able to recognize such an aspect and suggested ways to mitigate the negative effects of shadow education to promote equity. This indicates that, if enough time is provided, the project could provide space for a through consideration and discussion that would lead to preservice teachers’ enhancement of critical thinking competency. Another implication of this study is that, although prior work on teaching statistics seldom emphasized sustainability, statistics could be effective for thinking about the future. Our work validates such expectations by showing that universities can enhance prospective teachers’ awareness of sustainability by providing an opportunity to learn and use statistics. Further examination can focus on how instructors can guide all students to engage in the project as expected. A possible extension of this study is applying a statistical investigation project like the one presented in this study but with a different group of participants. Based on the participants’ backgrounds and interests, an instructor could choose to use data that addresses topics closer to their participants. If the instructor hopes to teach critical thinking or equity as one of the competencies, they might want to search for data with at least some space to discuss equity.
In terms of research methods, we employed qualitative approaches to answer some of the research questions. Such an approach to data analysis allowed us to draw sound conclusions with the data collected from the participants, which may not be large enough for quantitative investigations but is more than sufficient for qualitative investigations. In this study, as an example of a mixed method research, we witness the proper use of quantitative and qualitative approaches wherein each analytical approach compensates potential limitations of the other.
Despite the significance of the results of this study, there are limitations, and future researchers will need to take these into consideration while designing a follow-up study. First, this study used the same items in pre- and posttests. When designing the research, the researchers recognized the possibility that the posttest scores may be overestimated if repeated tests are conducted with the same items. Nevertheless, the research was designed to use the same items because the purpose of this study was not to look at the degree of improvement of statistical knowledge but to observe the improvement in preservice mathematics teachers’ statistical thinking. Further, this study attempted to overcome this limitation by arranging sufficient item intervals between pre- and posttests. Second, the project and test items were developed based on the curriculum of a particular country. Therefore, when researchers in other countries plan to use the questions and projects in this study, they must fully consider and accommodate the differences across curricula.
As a final note, the statistical investigative project supports the development of key competencies for promoting sustainability. This is due to both the nature of statistics that embraces uncertainty when predicting future and the opportunities derived from the design of the investigative project. That said, although statistics itself is important for enhancing some key competencies for sustainability, students can practice the key competencies with more width and depth when they learn statistics through an investigative project. The current study provides an example of such a project that instructors in higher education could enact in their classroom.

Author Contributions

Conceptualization, S.H. (Sunyoung Han); methodology, S.H. (Sunyoung Han), H.S., S.K., and S.H. (Seonyoung Hwang); software, S.K. and S.H. (Seonyoung Hwang); formal analysis, S.K. and S.H. (Seonyoung Hwang); investigation, S.H. (Sunyoung Han) and H.S.; writing—original draft preparation, S.H. (Sunyoung Han), H.S., S.K., and S.H. (Seonyoung Hwang).; writing—review and editing, S.H. (Sunyoung Han), H.S., S.K., and S.H. (Seonyoung Hwang); visualization, H.S. and S.K.; supervision, S.H. (Sunyoung Han); project administration, S.H. (Sunyoung Han); funding acquisition, S.H. (Sunyoung Han). All authors have read and agreed to the published version of the manuscript.

Funding

This work was supported by the Ministry of Education of the Republic of Korea and the National Research Foundation of Korea (NRF-2018S1A5B8A02081889).

Acknowledgments

We thank the preservice teachers who participated in this study. We would also like to thank Lim, Subong for his cooperation in making the study possible. We would like to acknowledge Yu, Seungyeon for her support during various phases of this study.

Conflicts of Interest

The authors declare no conflict of interest.

References

  1. United Nations. Transforming our World: The 2030 Agenda for Sustainable Development; United Nations General Assembly: New York, NY, USA, 2015. [Google Scholar]
  2. UNESCO. Education for Sustainable Development Goals: Learning Objectives; UNESCO: Paris, France, 2017. [Google Scholar]
  3. Lee, S.J. Study of Statistical Teaching; Graduate School of Seoul National University: Seoul, Korea, 2000. [Google Scholar]
  4. Franklin, C.; Kader, G.; Mewborn, D.; Moreno, J.; Peck, R.; Perry, M.; Scheaffer, R. Guidelines for Assessment and Instruction in Statistics Education (GAISE) Report: A Pre-K–12 Curriculum Framework; American Statistical Association: Alexandria, VA, USA, 2007. [Google Scholar]
  5. Gal, I. Statistical literacy, meanings, components, responsibilities. In The Challenge of Developing Statistical Literacy, Reasoning and Thinking; Ben-Zvi, D., Garfield, J., Eds.; Kluwer Academic Publishers: Dordrecht, The Netherlands, 2004; pp. 47–78. [Google Scholar]
  6. Rim, H. Analysis on Middle School Third Graders’ Understanding of Math Curriculum Achievement Standard from the Results of National Assessment of Educational Achievement. J. Curric. Evaluat. 2018, 21, 219–241. [Google Scholar] [CrossRef]
  7. Kim, W.K.; Moon, S.Y.; Byun, J.Y. Mathematics teachers knowledge and belief on the high school probability and statistics. Math. Educ. 2006, 45, 381–406. [Google Scholar]
  8. Kim, J.R.; KIm, Y.H. A study of the policy change of teacher’ education in Korea with an analysis of America statistical literacy education. Korean Sch. Math. Soc. 2017, 20, 163–186. [Google Scholar]
  9. Kim, J.H. An Analysis of Misconception and Their Causes by Students in the ‘Statistical Estimation’; Seoul National University Graduate School of Education: Seoul, Korea, 2012. [Google Scholar]
  10. Ben-Zvi, D.; Makar, K. International perspectives on the teaching and learning of statistics. In The Teaching and Learning of Statistics; Ben-Zvi, D., Makar, K., Eds.; Springer: Cham, Switzerland, 2016; pp. 1–10. [Google Scholar]
  11. Chance, B.; del Mas, R.; Garfield, J. Reasoning about sampling distributions. In The Challenge of Developing Statistical Literacy, Reasoning and Thinking; Ben-Zvi, D., Garfield, J., Eds.; Springer: Dordrecht, The Netherlands, 2004; pp. 295–323. [Google Scholar]
  12. Lovett, J.N.; Lee, H.S. Preservice Secondary Mathematics Teachers’ Statistical Knowledge: A Snapshot of Strengths and Weaknesses. J. Stat. Educ. 2018, 26, 214–222. [Google Scholar] [CrossRef]
  13. Francis, D.C.; Hudson, R.; Vesperman, C.; Perez, A. Comparing Technology-supported Teacher Education Curricular Models for Enhancing Statistical Content Knowledge. Interdiscip. J. Probl. Learn. 2014, 8, 50–64. [Google Scholar] [CrossRef] [Green Version]
  14. Groth, R.E. Developing Statistical Knowledge for Teaching during design-based research. Stat. Educ. Res. J. 2017, 16, 376–396. [Google Scholar]
  15. Makar, K.; Confrey, J. Variation talk: Articulating meaning in statistics. Stat. Educ. Res. J. 2005, 4, 27–54. [Google Scholar]
  16. Garfield, J.; Ben-Zvi, D. Research on Statistical Literacy, Reasoning, and Thinking: Issues, Challenges, and Implications. In The Challenge of Developing Statistical Literacy, Reasoning and Thinking; Springer Science and Business Media LLC: Dordrecht, The Netherlands, 2004; pp. 397–409. [Google Scholar]
  17. Marriott, J.; Davies, N.; Gibson, L. Teaching, Learning and Assessing Statistical Problem Solving. J. Stat. Educ. 2009, 17, 17. [Google Scholar] [CrossRef] [Green Version]
  18. Lee, J.Y. An Analysis on the Mathematics Teachers’ Subject Matter Knowledge of Normal Distribution; Graduate School of Korean National University of Education: Cheongju, Korea, 2016. [Google Scholar]
  19. Magiera, M.; van den Kieboom, L.; Moyer, J. Relationships Among Features of Pre-Service Teachers’ Algebraic Thinking. In Proceedings of the 35th IGPME Conference, Ankara, Turkey, 10–15 July 2011; pp. 169–176. [Google Scholar]
  20. Franklin, C.; Bargagliotti, A.; Case, C.; Kader, G.; Scheaffer, R.; Spangler, D. Statistics Education of Teachers (SET); American Statistical Association: Alexandria, VA, USA, 2015. [Google Scholar]
  21. Kim, C.Y. Analysis of Student’s Misconception and Development of Geogebra Learning Material of Population Mean Estimation; Graduate School of Korean National University of Education: Cheongwon, Korea, 2014. [Google Scholar]
  22. Ko, E.S.; Park, M.S. Pre-service elementary school teachers’ statistical literacy related to statistical problem solving. Sch. Math. 2017, 19, 443–459. [Google Scholar]
  23. Lee, J.H. Statistics reasoning ability. J. Korean Sch. Math. 2011, 14, 299–327. [Google Scholar]
  24. 2014. Available online: http://efsandquality.glos.ac.uk/ (accessed on 12 July 2020).
  25. Statistics Korea. 2020. Available online: https://mdis.kostat.go.kr/index.do (accessed on 12 July 2020).
  26. Ben-Zvi, D.; Garfield, J. Statistical literacy, reasoning, and thinking: Goals, definitions, and challenges. In The Challenge of Developing Statistical Literacy, Reasoning and Thinking; Ben-Zvi, D., Garfield, J., Eds.; Kluwer Academic Publishers: Dordrecht, The Netherlands, 2004; pp. 3–18. [Google Scholar]
  27. Tak, B.; Ku, N.-Y.; Kang, H.-Y.; Lee, K.-H. Preservice Secondary Mathematics Teachers’ Statistical Literacy in Understanding of Sample. Math. Educ. 2017, 56, 19–39. [Google Scholar] [CrossRef] [Green Version]
  28. Shin, B.M. An analysis of teachers’ Pedagogical Content Knowledge on probability. Sch. Math. 2008, 10, 463–487. [Google Scholar]
  29. De Vetten, A.; Schoonenboom, J.; Keijzer, R.; van Oers, B. The development of informal statistical inference content knowledge of pre-service primary school teachers during a teacher college intervention. Educ. Stud. Math. 2018, 99, 217–234. [Google Scholar] [CrossRef] [Green Version]
  30. Doerr, H.; Jacob, B. Investigating secondary teachers’ statistical understandings. J. Stat.Educ. 2018, 26, 776–786. [Google Scholar]
  31. Ko, E.S.; Lee, K.H. Pre-service Teachers’ understanding of statistical sampling. J. Educ. Res. Math. 2011, 21, 17–32. [Google Scholar]
  32. Choi, M.J.; Lee, J.H.; Kim, W.K. An analysis of Mathematical Knowledge for Teaching of statistical estimation. Math. Educ. 2016, 55, 317–334. [Google Scholar] [CrossRef] [Green Version]
  33. Han, G.H.; Jeon, Y.J. A Comparative study on misconception about statistical estimation that future math teachers and high school students have. J. Korean Sch. Math. Soc. 2018, 21, 247–266. [Google Scholar]
  34. Wild, C.J.; Pfannkuch, M. Statistical thinking in empirical enquiry. Intern. Stat. Rev. 1999, 67, 223–248. [Google Scholar] [CrossRef]
  35. Garfield, J.; Ben-Zvi, D. How Students Learn Statistics Revisited: A Current Review of Research on Teaching and Learning Statistics. Int. Stat. Rev. 2007, 75, 372–396. [Google Scholar] [CrossRef]
  36. Kim, D.E.; Kang, P.L.; Lee, M.H. Analysis on pre-service mathematics teachers’ statistical literacy in lesson plan. East Asian Math. J. 2019, 35, 429–449. [Google Scholar]
  37. Casey, S.A.; Wasserman, N.H. Teachers’ knowledge about informal line of best fit. Stat. Educ. Res. J. 2015, 14, 8–35. [Google Scholar]
  38. Burgess, T. Investigating the “Data Sense” of Preservice Teachers. In Proceedings of the Sixth International Conference on Teaching Statistics, Cape Town, South Africa, 7–12 July 2002. [Google Scholar]
  39. Heaton, R.M.; Mickelson, W.T. The Learning and Teaching of Statistical Investigation in Teaching and Teacher Education. J. Math. Teach. Educ. 2002, 5, 35–59. [Google Scholar] [CrossRef]
  40. Makar, K.; Confrey, J. Secondary Teachers’ Statistical Reasoning in Comparing Two Groups. In The Challenge of Developing Statistical Literacy, Reasoning and Thinking; Springer Science and Business Media LLC: Dordrecht, The Netherlands, 2004; pp. 353–373. [Google Scholar]
  41. Lovett, J.N. The Preparedness of Preservice Secondary Mathematics Teachers to Teach Statistics: A Cross-Institutional Mixed Method Study. Unpublished Doctoral Dissertation, NC State University, Raleigh, 2016. Available online: https://repository.lib.ncsu.edu/handle/1840.16/11008 (accessed on 12 July 2020).
  42. Watson, J.M.; Moritz, J.B. Developing Concepts of Sampling. J. Res. Math. Educ. 2000, 31, 44. [Google Scholar] [CrossRef] [Green Version]
  43. Pfannkuch, M. The Role of Context in Developing Informal Statistical Inferential Reasoning: A Classroom Study. Math. Think. Learn. 2011, 13, 27–46. [Google Scholar] [CrossRef] [Green Version]
  44. Mickelson, W.T.; Heaton, R.M. Primary Teachers’ Statistical Reasoning about Data. In The Challenge of Developing Statistical Literacy, Reasoning and Thinking; Springer Science and Business Media LLC: Dordrecht, The Netherlands, 2004; pp. 327–352. [Google Scholar]
  45. Biehler, R.; Ben-Zvi, D.; Bakker, A.; Makar, K. Technology for Enhancing Statistical Reasoning at the School Level. In Third International Handbook of Mathematics Education; Springer Science and Business Media LLC: Dordrecht, The Netherlands, 2012; Volume 27, pp. 643–689. [Google Scholar]
  46. Cobb, G.W.; Moore, D.S. Mathematics, statistics, and teaching. Am. Math. Month. 1997, 104, 801–823. [Google Scholar] [CrossRef]
  47. Conway, B.; Martin, W.G.; Strutchens, M.; Kraska, M.; Huang, H. The Statistical Reasoning Learning Environment: A Comparison of Students’ Statistical Reasoning Ability. J. Stat. Educ. 2019, 27, 171–187. [Google Scholar] [CrossRef]
  48. Wilkerson, M.H.; Laina, V. Middle school students’ reasoning about data and context through storytelling with repurposed local data. ZDM 2018, 50, 1223–1235. [Google Scholar] [CrossRef] [Green Version]
  49. Ball, D.L.; Feiman-Nemser, S. Using textbooks and teachers’ guides: A dilemma for beginning teachers and teacher educators. Curric. Inquiry 1988, 18, 401–423. [Google Scholar] [CrossRef]
  50. Lee, H.; Hollebrands, K. Preparing to teach mathematics with technology: An integrated approach to developing technological pedagogical content knowledge. Contemp. Issues Technol. Teacher Educ. 2008, 8, 326–341. [Google Scholar]
  51. Reston, E.; Bersales, L.G. Fundamental statistical ideas in the school curriculum and in training teachers. In Teaching Statistics in School Mathematics-Challenges for Teaching and Teacher Education; Batanero, C., Burrill, G., Reading, C., Rossman, A., Eds.; Springer: Dordrecht, The Netherlands, 2011; pp. 57–69. [Google Scholar]
  52. Datnow, A.; Hubbard, L. Teacher capacity for and beliefs about data-driven decision making: A literature review of international research. J. Educ. Chang. 2015, 17, 7–28. [Google Scholar] [CrossRef]
  53. Gummer, E.; Mandinach, E. Building a Conceptual Framework for Data Literacy. Teach. College Record 2015, 117, 1–22. [Google Scholar]
  54. Marsh, J.A. Interventions promoting educators’ use of data: Research insights and gaps. Teach. College Record 2012, 114, 1–48. [Google Scholar]
  55. Datnow, A.; Park, V.; Kennedy-Lewis, B. Affordances and constraints in the context of teacher collaboration for the purpose of data use. J. Educ. Adm. 2013, 51, 341–362. [Google Scholar] [CrossRef]
  56. Green, J.L.; Smith, W.M.; Kerby, A.T.; Blankenship, E.E.; Schmid, K.K.; Carlson, M.A. Introductory statistics: Preparing in-service middle-level mathematics teachers for classroom research. Stat. Educ. Res. J. 2018, 17, 216–238. [Google Scholar]
  57. Ben-Zvi, D.; Gravemeijer, K.; Ainley, J. Design of Statistics Learning Environments. In Handbook of Comparative Studies on Community Colleges and Global Counterparts; Springer Science and Business Media LLC: Dordrecht, The Netherlands, 2017; pp. 473–502. [Google Scholar]
  58. Gould, R. Statistics and the Modern Student. Int. Stat. Rev. 2010, 78, 297–315. [Google Scholar] [CrossRef] [Green Version]
  59. Hall, J. Using Census at School and TinkerPlots™ to support Ontario elementary teachers’ statistics teaching and learning. In Teaching Statistics in School Mathematics: Challenges for Teaching and Teacher Education; Batanero, C., Burrill, G., Reading, A., Rossman, A., Eds.; Springer Science and Business Media LLC: Dordrecht, The Netherlands, 2008. [Google Scholar]
  60. Schafer, D.W.; Ramsey, F.L. Teaching the Craft of Data Analysis. J. Stat. Educ. 2003, 11, 11. [Google Scholar] [CrossRef]
  61. Heiberger, R.M.; Neuwirth, E. R Through Excel: A Epreadsheet Interface for Statistics, Data Analysis, and Graphics; Springer: Dordrecht, The Netherlands, 2009. [Google Scholar]
  62. Lee, H.S.; Kersaint, G.; Harper, S.R.; Driskell, S.O.; Jones, D.L.; Leatham, K.R.; Angotti, R.L.; Adu-Gyamfi, K. Teachers’ use of transnumeration in solving statistical tasks with dynamic statistical software. Stat. Educ. Res. J. 2014, 13, 25–52. [Google Scholar]
  63. Lee, S.-B.; Park, J.; Choi, S.H.; Kim, D.-J. Re-exploring teaching and learning of probability and statistics using Excel. J. Korea Soc. Comput. Inf. 2016, 21, 85–92. [Google Scholar] [CrossRef] [Green Version]
  64. Teaching statistical thinking through investigative projects. In Teaching Statistics in School Mathematics-Challenges for Teaching and Teacher Education; Springer: Dordrecht, The Netherlands, 2011; pp. 109–120.
  65. MacGillivray, H.; Pereira-Mendoza, L. Teaching Statistical Thinking Through Investigative Projects. In New ICMI Study Series; Springer Science and Business Media LLC: Dordrecht, The Netherlands, 2011; Volume 14, pp. 109–120. [Google Scholar]
  66. Ben-Zvi, D. Using Wiki to promote collaborative learning in statistics education. Technol. Innovat. Stat. Educ. 2007, 1. Available online: https://escholarship.org/uc/item/6jv107c7 (accessed on 12 July 2020).
  67. Nolan, D.; Lang, D.T. Dynamic, Interactive Documents for Teaching Statistical Practice. Int. Stat. Rev. 2007, 75, 295–321. [Google Scholar] [CrossRef]
  68. LOCUS Project. Available online: https://locus.statisticseducation.org (accessed on 12 July 2020).
  69. Woo, J.H.; Park, K.S.; Lee, J.H.; Park, K.M.; Lim, J.H.; Kwon, S.I.; Nam, J.Y.; Kim, J.H.; Kang, H.Y. Probability and Statistics Textbook; Donga: Seoul, Korea, 2017. [Google Scholar]
  70. Bae, J.S.; Yeo, T.K.; Cho, S.H.; Kim, M.K.; Chun, H.J.; Jo, S.H.; Byun, D.Y. Probability and Statistics Textbook, 2nd ed.; Kumsung: Seoul, Korea, 2018. [Google Scholar]
  71. Braun, V.; Clarke, V. Using thematic analysis in psychology. Qualit. Res. Psychol. 2006, 3, 77–101. [Google Scholar] [CrossRef] [Green Version]
  72. Kuckartz, U. Qualitative Text Analysis: A Systematic Approach. In ICME-13 Monographs; Springer Science and Business Media LLC: Dordrecht, The Netherlands, 2019; pp. 181–197. [Google Scholar]
  73. Nahm, F.S. Understanding Effect Size. Hanyang Med Rev. 2015, 35, 40. [Google Scholar] [CrossRef] [Green Version]
  74. Cohen, J. Statistical Power Analysis for the Behavioral Sciences, 2nd ed.; Lawrence Erlbaum Associates: Hillsdale, NJ, USA, 1988. [Google Scholar]
  75. Song, S.E. The Analysis of Prospective Mathematics Teachers‘ Capacity Recognition and Knowledge about Statistical Problem Solving; Ewha Womans University Graduate School of Education: Seoul, Korea, 2019. [Google Scholar]
  76. Aydın, S.; Aydin, S. Using Excel in Teacher Education for Sustainability. J. Teach. Educ. Sustain. 2016, 18, 89–104. [Google Scholar] [CrossRef] [Green Version]
  77. Kutluca, T.; Yalman, M.; Tum, A. Use of Interactive Whiteboard in Teaching Mathematics for Sustainability and its Effect on the Role of Teacher. Discourse Commun. Sustain. Educ. 2019, 10, 113–132. [Google Scholar] [CrossRef] [Green Version]
  78. Innabi, H. Teaching Statistics for Sustainability. In Proceedings of the 10th International Conference on Teaching Statistics, Kyoto, Japan, 8–13 July 2018. [Google Scholar]
  79. Barwell, R. Some Thoughts on a Mathematics Education for Environmental Sustainability. In International Perspectives on the Teaching and Learning of Geometry in Secondary Schools; Springer Science and Business Media LLC: Dordrecht, The Netherlands, 2018; pp. 145–160. [Google Scholar]
  80. Makar, K.; de Sousa, B.; Gould, R. Sustainability in Statistics Education. In Proceedings of the 9th International Conference on Teaching Statistics, ICOTS9, 13 July 2014; International Statistical Institute: Voorburg, The Netherlands, 2020; Available online: https://icots.info/9/proceedings/contents.html (accessed on 20 September 2020).
Figure 1. Pre- and posttest responses to an item in topic 3 asking to choose a bar graph.
Sustainability 12 09051 g001
Figure 2. Visual representations from participant presentations: (a) each bar represents the mean of a sample. The bars on the left are the means of ten samples of time spent on nonacademic shadow education as a hobby, and the right are those who adopt this route for the future. (b) The graph presents time spent at shadow education (red line) and at afterschool programs provided by the school (blue line).
Sustainability 12 09051 g002
Table 1. An overview of the statistical investigation project.
Session NumberActivity
1
  • Provide a brief description of the project.
  • Participants solve the statistical knowledge questionnaire (pretest).
  • Present a mini lecture on the probability and statistical processes (part1).
2
  • Present a mini lecture on the probability and statistical processes (part2).
3
  • Participants set up appropriate research questions from the provided data.
  • Participants extract data necessary for answering research questions of their own.
4
  • Give a lecture on how to use R.
  • Each group of participants use R to derive population mean results.
5
  • Participants make slides that present their research questions with how they used statistical estimation to answer the questions.
  • Participants solve the statistical knowledge questionnaire (posttest).
6
  • Each group share their prepared slides with the whole class.
  • The audience posts comments on an online discussion board during the presentation.
  • The presenting group respond to the questions and comments.
  • Participants submit individual reflection paper to the online depository.
Table 2. Descriptive statistics.
StatisticsTopic 1Topic 2Topic 3Topic 4Mean of Topics 1–4
Sel (6)Pre (6)Pos (6)Sel (6)Pre (5)Pos (5)Sel (6)Pre (5)Pos (5)Sel (6)Pre (10)Pos (10)Sel (6)Pre (6)Pos (6)
Min.534423512401
Med.5.5555555.533578
IQR1111.5111.25221.3342
Max.666655654699
Mean5.914.875.225.364.354.575.682.913.045.376.177.355.584.324.69
M.
Mean
5.914.875.225.365.225.485.683.493.655.373.704.41
SD0.2940.7570.6710.6580.9820.6620.3951.040.9280.6192.761.95
Note. The number in the parenthesis indicates the maximum score possible. Min.: minimum value, Med: median, IQR: interquartile range, Max.: maximum value, M. Mean: modified mean to the maximum of 6, Sel: the self-perceived degree of statistical knowledge, Pre: the measured degree of statistical knowledge in pretest, Pos: the measured degree of statistical knowledge in posttest, SD: standard deviation.
Table 3. Correlation coefficients.
TopicVariablesSelf-PerceivedPost
Mean
of Topics 1–4
Self-perceived1−0.065
Pre−0.0510.400
Topic 1Self-perceived1−0.117
Pre0.1770.055
Topic 2Self-perceived1−0.079
Pre0.2950.519 *
Topic 3Self-perceived1−0.244
Pre−0.441 *0.450 *
Topic 4Self-perceived10.377
Pre0.3880.561 **
Note. * p < 0.05, ** p < 0.01. Self-perceived: the self-perceived degree of statistical knowledge, Pre: the measured degree of statistical knowledge in pretest, Post: the measured degree of statistical knowledge in posttest.
Table 4. The t-test results of the pre- and posttests for each topic.
t-TestMean of Topics 1–4Topic 1Topic 2Topic 3Topic 4
ScorePrePostPrePostPrePostPrePostPrePost
4.324.694.875.224.354.572.913.046.177.35
t-value−3.1471.7341.1860.504−2.526
p-value0.005 *0.0830.2360.6140.019 *
Cohen’s d−0.67−0.49−0.26−0.13−0.49
Note. * p < 0.05.
Publisher’s Note: MDPI stays neutral with regard to jurisdictional claims in published maps and institutional affiliations.

