Abstract
The decrease in human activities following the COVID-19 pandemic caused an important change in PM2.5 concentration, especially in the most polluted areas in the world: China (44.28 and 18.88 µg/m3 in the first quarters of 2019 and 2020, respectively), India (49.84 and 31.12, respectively), and Nigeria (75.30 and 34.31, respectively). In this study, satellite observations from all around the world of PM2.5 concentration were collected on the grid scale with a high resolution of 0.125° (about 15km). Population data for 2020 were also collected on the same scale. Statistical data from the World Health Organization (WHO) concerning the diseases caused by air pollution (e.g., stroke) were obtained for each country to determine the change in mortality between the first quarter of 2019 and the first quarter of 2020. Expressed in disability-adjusted life years (DALY), it was found that the largest reductions were observed for China (−13.9 million DALY), India (−6.3 million DALY), and Nigeria (−2.3 million DALY).
1. Introduction
The COVID-19 pandemic triggered an unprecedented change in people’s daily lives all around the world, having an important impact on both the economy and human health [1,2,3,4,5]. The pandemic has officially caused more than 300,000 deaths (18 May, 2020 [6]), and the global economy is expected to shrink by 3.2% in 2020 [7]. This economic loss is partly due to the shortage of activity following the national lockdowns imposed by different governments.
Some studies attempted to confirm the link between air pollution and the COVID-19 pandemic [8,9]; others highlighted the change in pollutant concentration, especially in China [10]. However, no study has quantified the global damage reduction in the first quarter of the year.
Air pollution is one of the major causes of death every year in the world (about seven million, including more than 4.2 million due to ambient air pollution according to the World Health Organization (WHO) [11]); it is strongly linked to several diseases such as stroke and heart disease. It would be interesting to observe if the temporary reduction in activity in the first quarter of 2020 had an impact on PM2.5 concentration, which is often used as one of the key indicators to estimate the burden from air pollution, such as in life-cycle assessment (LCA) [12,13].
Therefore, this research aimed at evaluating the global mortality reduction in the first quarter of 2020 due to the reduction in PM2.5 concentration. Compared to recent studies on the topic [14,15,16], we highlighted the change in global PM2.5 concentration but also tried to estimate the reduction in burden due to the change in concentration. Compared with the traditional approach (national or continental) used, for example, in LCA, this study was based on a grid-scale approach to improve the accuracy of the assessment.
This research did not aim to minimize the number of deaths from COVID-19 but rather to support the idea that the improvement in air quality has helped to indirectly save several lives during this period.
2. Methodology
2.1. PM2.5 Concentration Data
PM2.5 concentration (µg/m3) was collected from the European Centre for Medium-Range Weather Forecasts (ECMWF) satellite [17] at grid scale (0.125°, which is about 15 km or 4,150,080 grids globally); data were collected for the periods from 1 January to 30 April, 2019, and from 1 January to 30 April, 2020. Data post-treatment was performed using MATLAB software [18]. For each month, the average concentration as a common indicator for air quality measurement was calculated for both 2019 and 2020. Several studies demonstrated the reliability of satellite data in comparison with ground measurements [19,20,21]. As ground measurement stations are still limited in Africa and Southern America [22], the satellite data helped to overcome this limitation.
2.2. Population Data
The gridded population data were collected for 2020 from the Center for International Earth Science Information Network (CIESIN) [23]; the data are represented in Figure 1. The different age groups for each grid were obtained from the same source for 2010, which was the year with the latest data available. We further confirmed from different sources [24,25] that the share in the age groups in the cities did not change significantly in the last 10 years. Finally, the data provided by the CIESIN at a resolution of 0.042° were converted to the same scale as the PM2.5 concentration data (0.125°).
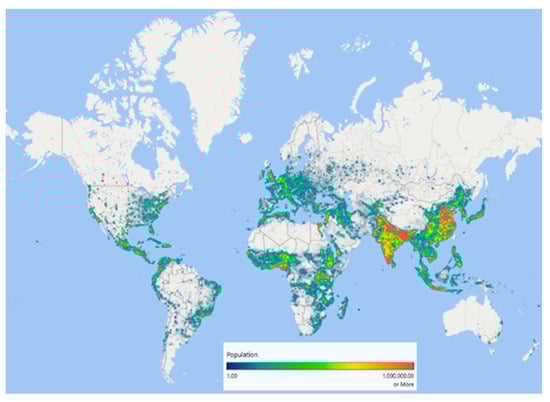
Figure 1.
World population in 2020 [23].
2.3. WHO Data
Data from the WHO [26] were collected for each country (Appendix A Table A1), representing the annual mortality rate per health effect (in 2016). In accordance with previous studies [13,27,28], the population under 5 years old and over 30 years were considered. The information collected corresponds to the mortality rate for health diseases related to air pollution: for people aged above 30 years old, ischemic heart disease (IHD), stroke, lung cancer (LC), and chronic obstructive pulmonary disease (COPD) and for people aged under five years old, acute lower respiratory infections (ALRI). The maps of the populations under 5 years old and over 30 years old are shown in Figure 2.
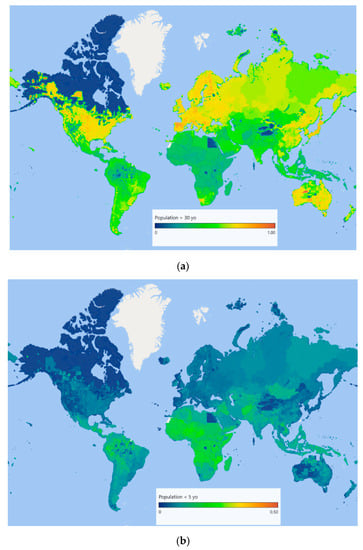
Figure 2.
Ratio of population (a) > 30 years old and (b) < 5 years old.
2.4. Concentration Response Function (CRF)
Based on previous cohort studies [13,27,29], it was decided to pick a relative risk of 1.01 per µg/m3 per health effect. The equation for the CRF applied in each grid is
where:
- RR is the relative risk of a health effect due to exposure to PM2.5 (µg/m3 of air).
- MR (death/person/month) is the mortality rate specific to each country for the health effects related to air pollution.
- is the difference in PM2.5 concentration (µg/m3 of air) between each monthly average in the first quarter of years 2019 and 2020.
- Pop is the population under 5 years old and over 30 years old in the grid.
To express the overall burden, the number of deaths was converted to disability-adjusted life years (DALYs) using the WHO data (Table A1 [26]).
3. Results
3.1. Results Per Country
The highest reductions in burden occurred for China (−13.9 million DALY), India (−6.3 million), and Nigeria (−2.3 million). Italy (26,943 DALY), Germany (23,150), and Switzerland (4,744) showed increases in mortality compared to the same period last year. The results are shown in Table 1 and Figure 3. The results for each grid (including main parameters) are provided in the Supplementary Information.

Table 1.
Comparison of the burden of air pollution at the country level between Q1 2019 and Q1 2020.
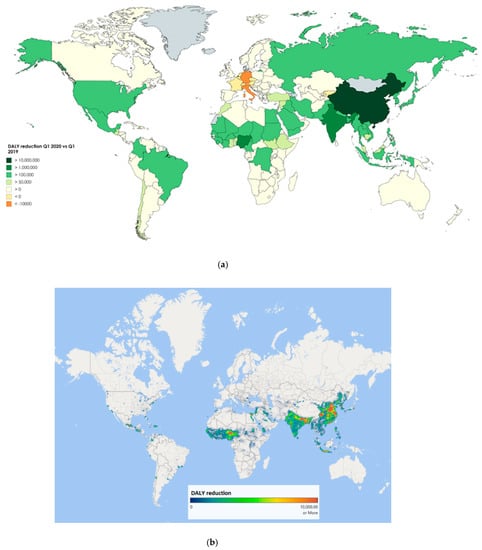
Figure 3.
DALY reduction Q1 2020 vs. Q1 2019: (a) by country; (b) by grid.
The PM2.5 concentration was generally low in Western Europe in the first quarter of the year; events related to lockdowns, such as the reduction in transportation or the temporary reduction in industrial activity, did not affect the level of pollution.
The total reduction in the burden globally was 34.4 million DALY (or 1.3 million deaths), confirming that the actions taken against the COVID-19 pandemic indirectly helped to improve air quality.
3.2. Results Per City
The results for each city were observed: the top 10 is occupied by Chinese cities (eight) and Indian cities (two). With these cities having a high population density and being among the most polluted cities in the world, these results were expected (Table 2).
Table 2.
Comparison of the burden of air pollution at the city(area) level between Q1 2019 and Q2 2020 (top10 DALY reduction).
4. Discussion
4.1. Confirmation of the Results in Accordance with the National Lockdowns
To confirm the validity of the results, we compared the results obtained in this study with the level of confinement in the different countries. The duration of these confinements was considered, as shown in Table 3 and Figure 4.
Table 3.
Definition of the confinement level [30].
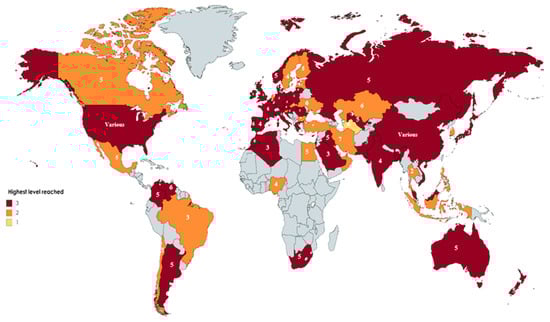
Figure 4.
Highest confinement level by country between 1 January and 30 April 2020 (numbers represent the number of weeks under the highest level).
From the previous information, it was confirmed that the countries with the highest burden reduction adopted strict measures to stop the progress of the COVID-19 pandemic. It can also be supposed that the reduction of pollutant emissions in each country probably improved the air quality in the surrounding countries (even though these surrounding countries adopted less strict measures). Several studies highlighted the importance of the air pollution transboundary effect [12,31,32].
4.2. Comparison with the Annual WHO Estimation
The results were also compared with the annual estimation of the WHO [11]. A comparison for the countries experiencing a reduction in burden above 500,000 DALY according to our results is shown in Table 4.
Table 4.
Comparison between this study and the annual burden of air pollution.
Except for China (54%) and Niger (63%), all of the results were below 50%. Even though direct comparison of the results is difficult (2020 vs. 2016), several studies, such as in China [33,34], showed that the monthly concentration at the end and the beginning of each year are much more important than during the rest of year. This would explain why the reduction in each country was within the range of 20–50%. To confirm this observation, the monthly average for 2019 of each country listed above was collected (Figure 5). In these countries, the level of air pollution in the first quarter of the year (as well as the last quarter of the year) was the highest.
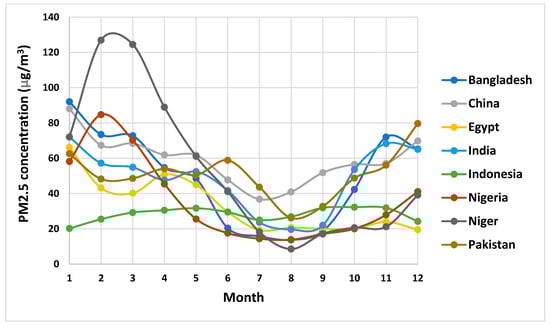
Figure 5.
Monthly population-weighted PM2.5 (µg/m3) concentration in 2019.
4.3. Sensitivity Analysis
To confirm the accuracy of our calculation, we considered different methodologies. First, using He et al. 2016 [29] and the conversion provided by the WHO (0.65 PM10 = PM2.5 [35]) coupled with the United Nations (UN) population data [36], different relative risks for each age group were determined: 1.029 for the age group 0–5 years old, 1.006 for the 30–50-year-olds, 1.01 for the 50–60-year-olds, and 1.014 for the population over 60 years old. Then, a different approach based on different relative risks (RRs) for each disease related to air pollution [27] was considered: 1.013 for cardiopulmonary diseases, 1.014 for lung cancer and 1.024 for ischemic heart disease, with ALRI not being considered in the study. The results obtained in this study for the 20 countries with the highest reductions in burden (representing 85% of the global reduction of burden) were compared using these two different approaches, as shown in Table 5.
Table 5.
Comparison between different approaches based on different relative risks (RRs) in DALY (death).
The following observations were noted from the results. Based on the approach adapted from He et al. [29], for the most developed countries on the list (USA, China, and Korea), the results were estimated to be less than 20% higher; for the African countries, the results were estimated to be more than 100% higher. In these developed countries, the age groups are homogeneous, whereas, for African countries, the population under five years old is the highest in the world. Based on the approach by Krewski et al. 2009 [27], an opposite trend was observed: the results were higher for the most developed countries, but lower for the African countries. The two reasons for this are that ALRI is not considered in this method, and, more importantly according to the WHO statistics, that the sub-Saharan African population is young, so this population suffers less from heart diseases.
These results confirm the approach chosen in this study. To avoid any over- or underestimation due to the lack of detailed information concerning each country, we chose a constant relative risk of 1.01, which is midway between the relative risk of 1.006 adapted from He et al. [29] (age group 30–50) and the relative risk of 1.024 for IHD in Krewski et al. [27]. This constant relative risk is also in the same range as the value adapted from He et al. [29] for the age group 50–60 (RR = 1.01) and the RRs for lung cancer and cardiopulmonary disease in Krewski et al. [27] (1.013 and 1.014, respectively).
4.4. Why Did the PM2.5 Concentration Not Fall to Zero?
One of the last questions that one may ask could be: “why have air pollution levels not dropped to zero and even increased in some areas where a lockdown was active?”.
It should be clarified that PM2.5 emissions as a primary source, followed by NOx, SO2 and, NH3 as secondary sources, contribute to the PM2.5 concentration.
There are several reasons that the PM2.5 concentration did not fall to zero: electricity generation from industry decreased [37], but electricity generation in the residential sector did not stop during the lockdown period [38]. Many countries (e.g., in Asia) still rely considerably on coal-fired power plants, which emit a large amount of PM2.5, NOx and SO2 (especially when technologies such as electrostatic precipitators (ESP), selective catalytic redactors (SCR) and flue-gas desulfurization (FGD) are not applied), thereby contributing to the PM2.5 concentration. According to the user data provided by Apple [39], in different cities all around the world, key workers were still active during lockdowns. Shipments by heavy trucks, one of the major contributors of NOx emissions, were popular during the different lockdowns. Finally, agriculture, a major source of NH3 emissions, also contributed to keeping the PM2.5 concentration at a certain level.
4.5. Limitations and Future Work
The results of this study were obtained from models but not clinical observations; therefore, caution is needed when interpreting the results. Heterogeneity also exists between the population of the same country following, for example, their economic situation or their access to medical structure. Cohort studies conducted in developing countries (e.g., those in South/Southeast Asia and Western Africa) are urgently required, as only models based on the situation in developed countries are available for predicting the damage caused by air pollution in developing countries.
As highlighted in Section 4.4, even during strict lockdowns, the levels of air pollution remained at a certain level. Some additional work is needed to isolate the sources of air pollution in each country; the lockdowns provide a good opportunity to isolate the different sources as reported by some recent studies [40,41]. Similar to water [42] or carbon dioxide [43,44], a detailed database for air pollution could be created. Once such a database is established, different scenarios could be considered to keep the PM2.5 concentration under a certain level in daily life.
5. Conclusions
In this study, it was confirmed that national lockdowns helped to reduce the impact of air pollution in the first quarter of 2020, especially in Asia and Western Africa. The greatest reductions were observed in China (−13.9 million DALY), India (−6.3 million DALY), and Nigeria (−2.3 million DALY). In developed countries, such as those in Western Europe, no major difference was observed compared with 2019.
These observations provide some indications. In Western Europe, advanced technologies (e.g., electricity from renewable energies, vehicles with high fuel efficiency) already help to keep the air pollution level low in daily life. Conversely, with these technologies still being unavailable in several parts of the world, the suspension of activity directly reduced the impact of polluting technologies. Advanced technologies are usually expensive; using a cost-benefit approach, future works might focus on comparing the affordability of advanced technologies and opportunities for teleworking in developing countries.
Supplementary Materials
The following are available online at https://zenodo.org/record/3932692#.XwQZTOcRVPY.
Author Contributions
Conceptualization, S.K. and N.I.; methodology, S.K. and N.I.; software, S.K.; formal analysis, S.K.; investigation, S.K.; resources, N.I.; writing—original draft preparation, S.K.; supervision, N.I. All authors have read and agreed to the published version of the manuscript.
Funding
This research received no external funding.
Conflicts of Interest
The authors declare no conflict of interest.
Appendix A
Table A1.
WHO data for each country concerning the diseases related to air pollution.
Table A1.
WHO data for each country concerning the diseases related to air pollution.
| ISO Alpha−3 CODE [45] | Stroke (DALY/Person/Month) | IHD (DALY/Person/Month) | LC (DALY/Person/Month) | COPD (DALY/Person/Month) | ALRI (DALY/Person/Month) | Stroke (DALY/Death) | IHD (DALY/Death) | LC (DALY/Death) | COPD (DALY/Death) | ALRI (DALY/Death) |
|---|---|---|---|---|---|---|---|---|---|---|
| AFG | 1.2 × 10⁻⁴ | 2.7 × 10⁻⁴ | 8.9 × 10⁻⁶ | 3.6 × 10⁻⁵ | 2.0 × 10⁻⁴ | 28 | 28 | 33 | 29 | 91 |
| ALB | 2.6 × 10⁻⁴ | 3.6 × 10⁻⁴ | 5.5 × 10⁻⁵ | 3.0 × 10⁻⁵ | 2.2 × 10⁻⁵ | 17 | 18 | 24 | 19 | 93 |
| DZA | 7.1 × 10⁻⁵ | 2.0 × 10⁻⁴ | 1.2 × 10⁻⁵ | 1.8 × 10⁻⁵ | 5.5 × 10⁻⁵ | 22 | 21 | 30 | 28 | 91 |
| AGO | 7.9 × 10⁻⁵ | 9.9 × 10⁻⁵ | 2.1 × 10⁻⁶ | 2.4 × 10⁻⁵ | 2.7 × 10⁻⁴ | 25 | 24 | 30 | 30 | 91 |
| ATG | 8.5 × 10⁻⁵ | 1.5 × 10⁻⁴ | 6.7 × 10⁻⁶ | 2.2 × 10⁻⁵ | 3.2 × 10⁻⁶ | 22 | 21 | 28 | 21 | 94 |
| ARG | 7.5 × 10⁻⁵ | 1.8 × 10⁻⁴ | 3.7 × 10⁻⁵ | 7.6 × 10⁻⁵ | 1.2 × 10⁻⁵ | 22 | 18 | 25 | 18 | 92 |
| ARM | 1.1 × 10⁻⁴ | 4.4 × 10⁻⁴ | 6.6 × 10⁻⁵ | 5.1 × 10⁻⁵ | 2.2 × 10⁻⁵ | 21 | 17 | 26 | 18 | 92 |
| AUS | 6.1 × 10⁻⁵ | 1.3 × 10⁻⁴ | 4.9 × 10⁻⁵ | 5.0 × 10⁻⁵ | 1.8 × 10⁻⁶ | 16 | 15 | 21 | 18 | 95 |
| AUT | 6.7 × 10⁻⁵ | 2.7 × 10⁻⁴ | 5.8 × 10⁻⁵ | 5.0 × 10⁻⁵ | 2.7 × 10⁻⁷ | 18 | 14 | 23 | 18 | 99 |
| AZE | 1.2 × 10⁻⁴ | 3.9 × 10⁻⁴ | 1.9 × 10⁻⁵ | 2.6 × 10⁻⁵ | 6.3 × 10⁻⁵ | 23 | 21 | 31 | 24 | 92 |
| BHS | 6.8 × 10⁻⁵ | 1.2 × 10⁻⁴ | 1.6 × 10⁻⁵ | 9.8 × 10⁻⁶ | 2.6 × 10⁻⁵ | 23 | 22 | 27 | 27 | 92 |
| BHR | 1.2 × 10⁻⁵ | 6.0 × 10⁻⁵ | 7.7 × 10⁻⁶ | 6.8 × 10⁻⁶ | 2.4 × 10⁻⁶ | 33 | 27 | 25 | 40 | 95 |
| BGD | 1.4 × 10⁻⁴ | 1.4 × 10⁻⁴ | 1.6 × 10⁻⁵ | 7.7 × 10⁻⁵ | 9.3 × 10⁻⁵ | 25 | 26 | 27 | 24 | 91 |
| BRB | 1.6 × 10⁻⁴ | 1.7 × 10⁻⁴ | 2.0 × 10⁻⁵ | 2.7 × 10⁻⁵ | 5.0 × 10⁻⁶ | 18 | 18 | 24 | 18 | 95 |
| BLR | 1.9 × 10⁻⁴ | 7.6 × 10⁻⁴ | 4.3 × 10⁻⁵ | 2.6 × 10⁻⁵ | 3.8 × 10⁻⁶ | 22 | 18 | 27 | 24 | 95 |
| BEL | 8.2 × 10⁻⁵ | 1.7 × 10⁻⁴ | 7.7 × 10⁻⁵ | 7.7 × 10⁻⁵ | 1.7 × 10⁻⁶ | 17 | 15 | 23 | 18 | 93 |
| BLZ | 7.8 × 10⁻⁵ | 1.5 × 10⁻⁴ | 2.2 × 10⁻⁵ | 2.6 × 10⁻⁵ | 1.8 × 10⁻⁵ | 23 | 22 | 28 | 23 | 92 |
| BEN | 1.2 × 10⁻⁴ | 1.4 × 10⁻⁴ | 1.3 × 10⁻⁶ | 3.6 × 10⁻⁵ | 2.7 × 10⁻⁴ | 27 | 24 | 34 | 29 | 91 |
| BTN | 8.1 × 10⁻⁵ | 1.9 × 10⁻⁴ | 9.0 × 10⁻⁶ | 7.6 × 10⁻⁵ | 8.2 × 10⁻⁵ | 29 | 30 | 33 | 30 | 92 |
| BOL | 8.3 × 10⁻⁵ | 1.8 × 10⁻⁴ | 7.4 × 10⁻⁶ | 4.4 × 10⁻⁵ | 9.0 × 10⁻⁵ | 27 | 22 | 25 | 20 | 91 |
| BIH | 2.5 × 10⁻⁴ | 3.9 × 10⁻⁴ | 6.6 × 10⁻⁵ | 4.7 × 10⁻⁵ | 5.2 × 10⁻⁶ | 20 | 18 | 25 | 21 | 95 |
| BWA | 8.6 × 10⁻⁵ | 1.2 × 10⁻⁴ | 4.5 × 10⁻⁶ | 4.0 × 10⁻⁵ | 6.8 × 10⁻⁵ | 23 | 23 | 31 | 28 | 91 |
| BRA | 8.3 × 10⁻⁵ | 1.3 × 10⁻⁴ | 2.3 × 10⁻⁵ | 4.7 × 10⁻⁵ | 2.2 × 10⁻⁵ | 23 | 24 | 25 | 21 | 92 |
| BRN | 5.0 × 10⁻⁵ | 9.7 × 10⁻⁵ | 2.5 × 10⁻⁵ | 2.8 × 10⁻⁵ | 4.4 × 10⁻⁶ | 29 | 26 | 25 | 29 | 93 |
| BGR | 3.6 × 10⁻⁴ | 6.2 × 10⁻⁴ | 6.3 × 10⁻⁵ | 6.3 × 10⁻⁵ | 1.8 × 10⁻⁵ | 18 | 18 | 27 | 21 | 92 |
| BFA | 8.3 × 10⁻⁵ | 1.5 × 10⁻⁴ | 2.8 × 10⁻⁶ | 2.2 × 10⁻⁵ | 1.9 × 10⁻⁴ | 28 | 25 | 32 | 31 | 91 |
| BDI | 1.0 × 10⁻⁴ | 1.1 × 10⁻⁴ | 2.3 × 10⁻⁶ | 3.3 × 10⁻⁵ | 2.2 × 10⁻⁴ | 27 | 26 | 34 | 29 | 91 |
| KHM | 1.4 × 10⁻⁴ | 1.1 × 10⁻⁴ | 1.7 × 10⁻⁵ | 2.8 × 10⁻⁵ | 8.7 × 10⁻⁵ | 25 | 25 | 28 | 34 | 92 |
| CMR | 1.2 × 10⁻⁴ | 1.4 × 10⁻⁴ | 2.3 × 10⁻⁶ | 3.9 × 10⁻⁵ | 2.3 × 10⁻⁴ | 26 | 24 | 39 | 28 | 91 |
| CAN | 4.5 × 10⁻⁵ | 1.4 × 10⁻⁴ | 7.3 × 10⁻⁵ | 5.0 × 10⁻⁵ | 1.5 × 10⁻⁶ | 21 | 17 | 22 | 18 | 95 |
| CPV | 1.1 × 10⁻⁴ | 2.4 × 10⁻⁴ | 3.3 × 10⁻⁶ | 3.4 × 10⁻⁵ | 4.7 × 10⁻⁵ | 21 | 18 | 32 | 22 | 91 |
| CAF | 1.7 × 10⁻⁴ | 1.6 × 10⁻⁴ | 2.6 × 10⁻⁶ | 4.3 × 10⁻⁵ | 3.9 × 10⁻⁴ | 25 | 25 | 33 | 28 | 91 |
| TCD | 1.3 × 10⁻⁴ | 1.7 × 10⁻⁴ | 1.6 × 10⁻⁶ | 3.7 × 10⁻⁵ | 5.8 × 10⁻⁴ | 29 | 26 | 35 | 30 | 91 |
| CHL | 7.8 × 10⁻⁵ | 1.0 × 10⁻⁴ | 2.8 × 10⁻⁵ | 3.8 × 10⁻⁵ | 4.5 × 10⁻⁶ | 21 | 20 | 23 | 17 | 92 |
| CHN | 2.0 × 10⁻⁴ | 1.9 × 10⁻⁴ | 6.2 × 10⁻⁵ | 8.7 × 10⁻⁵ | 2.0 × 10⁻⁵ | 23 | 19 | 23 | 20 | 92 |
| COL | 6.3 × 10⁻⁵ | 1.7 × 10⁻⁴ | 2.2 × 10⁻⁵ | 3.6 × 10⁻⁵ | 2.5 × 10⁻⁵ | 23 | 21 | 25 | 18 | 92 |
| COM | 9.0 × 10⁻⁵ | 1.4 × 10⁻⁴ | 2.8 × 10⁻⁶ | 2.6 × 10⁻⁵ | 2.4 × 10⁻⁴ | 27 | 26 | 31 | 29 | 91 |
| COG | 8.9 × 10⁻⁵ | 1.2 × 10⁻⁴ | 1.9 × 10⁻⁶ | 2.8 × 10⁻⁵ | 1.4 × 10⁻⁴ | 25 | 23 | 29 | 29 | 91 |
| CRI | 5.4 × 10⁻⁵ | 1.3 × 10⁻⁴ | 1.2 × 10⁻⁵ | 4.0 × 10⁻⁵ | 7.2 × 10⁻⁶ | 19 | 21 | 22 | 16 | 93 |
| CIV | 1.6 × 10⁻⁴ | 2.3 × 10⁻⁴ | 2.4 × 10⁻⁶ | 4.2 × 10⁻⁵ | 2.9 × 10⁻⁴ | 31 | 28 | 31 | 31 | 91 |
| HRV | 1.9 × 10⁻⁴ | 3.8 × 10⁻⁴ | 8.4 × 10⁻⁵ | 5.5 × 10⁻⁵ | 3.1 × 10⁻⁶ | 18 | 16 | 24 | 18 | 94 |
| CUB | 1.0 × 10⁻⁴ | 2.3 × 10⁻⁴ | 6.3 × 10⁻⁵ | 5.5 × 10⁻⁵ | 1.1 × 10⁻⁵ | 19 | 19 | 23 | 19 | 92 |
| CYP | 6.9 × 10⁻⁵ | 1.9 × 10⁻⁴ | 4.4 × 10⁻⁵ | 5.2 × 10⁻⁵ | 4.9 × 10⁻⁷ | 17 | 18 | 23 | 15 | 94 |
| CZE | 1.0 × 10⁻⁴ | 3.6 × 10⁻⁴ | 6.2 × 10⁻⁵ | 4.5 × 10⁻⁵ | 3.4 × 10⁻⁶ | 19 | 16 | 23 | 22 | 93 |
| PRK | 2.7 × 10⁻⁴ | 1.8 × 10⁻⁴ | 8.0 × 10⁻⁵ | 1.8 × 10⁻⁴ | 5.1 × 10⁻⁵ | 23 | 21 | 27 | 21 | 92 |
| COD | 1.1 × 10⁻⁴ | 1.1 × 10⁻⁴ | 1.6 × 10⁻⁶ | 3.2 × 10⁻⁵ | 2.8 × 10⁻⁴ | 25 | 24 | 31 | 28 | 91 |
| DNK | 7.8 × 10⁻⁵ | 1.2 × 10⁻⁴ | 9.0 × 10⁻⁵ | 9.3 × 10⁻⁵ | 1.2 × 10⁻⁶ | 18 | 17 | 21 | 18 | 93 |
| DJI | 8.9 × 10⁻⁵ | 1.4 × 10⁻⁴ | 4.1 × 10⁻⁶ | 2.3 × 10⁻⁵ | 1.6 × 10⁻⁴ | 27 | 25 | 32 | 30 | 91 |
| DOM | 1.1 × 10⁻⁴ | 2.3 × 10⁻⁴ | 2.1 × 10⁻⁵ | 2.0 × 10⁻⁵ | 5.8 × 10⁻⁵ | 24 | 23 | 25 | 22 | 91 |
| ECU | 5.9 × 10⁻⁵ | 1.0 × 10⁻⁴ | 1.1 × 10⁻⁵ | 3.5 × 10⁻⁵ | 4.4 × 10⁻⁵ | 22 | 20 | 23 | 16 | 91 |
| EGY | 1.2 × 10⁻⁴ | 3.5 × 10⁻⁴ | 1.0 × 10⁻⁵ | 3.6 × 10⁻⁵ | 3.9 × 10⁻⁵ | 24 | 25 | 30 | 28 | 92 |
| SLV | 4.0 × 10⁻⁵ | 2.0 × 10⁻⁴ | 1.1 × 10⁻⁵ | 2.8 × 10⁻⁵ | 2.9 × 10⁻⁵ | 24 | 20 | 23 | 20 | 92 |
| GNQ | 7.9 × 10⁻⁵ | 1.2 × 10⁻⁴ | 4.8 × 10⁻⁶ | 2.7 × 10⁻⁵ | 2.5 × 10⁻⁴ | 27 | 25 | 34 | 30 | 91 |
| ERI | 1.3 × 10⁻⁴ | 1.3 × 10⁻⁴ | 3.5 × 10⁻⁶ | 3.8 × 10⁻⁵ | 1.6 × 10⁻⁴ | 25 | 24 | 34 | 27 | 91 |
| EST | 9.4 × 10⁻⁵ | 5.5 × 10⁻⁴ | 6.7 × 10⁻⁵ | 2.6 × 10⁻⁵ | 2.2 × 10⁻⁶ | 23 | 15 | 22 | 21 | 98 |
| ETH | 8.8 × 10⁻⁵ | 1.3 × 10⁻⁴ | 4.6 × 10⁻⁶ | 2.8 × 10⁻⁵ | 1.7 × 10⁻⁴ | 25 | 24 | 34 | 28 | 91 |
| FJI | 3.0 × 10⁻⁵ | 2.8 × 10⁻⁴ | 7.9 × 10⁻⁶ | 2.8 × 10⁻⁵ | 4.4 × 10⁻⁵ | 33 | 27 | 28 | 31 | 92 |
| FIN | 9.9 × 10⁻⁵ | 2.5 × 10⁻⁴ | 5.2 × 10⁻⁵ | 3.0 × 10⁻⁵ | 8.5 × 10⁻⁷ | 19 | 15 | 21 | 23 | 94 |
| FRA | 6.8 × 10⁻⁵ | 1.2 × 10⁻⁴ | 6.8 × 10⁻⁵ | 4.1 × 10⁻⁵ | 7.0 × 10⁻⁷ | 17 | 15 | 24 | 14 | 98 |
| GAB | 8.6 × 10⁻⁵ | 1.2 × 10⁻⁴ | 7.4 × 10⁻⁶ | 2.5 × 10⁻⁵ | 1.1 × 10⁻⁴ | 22 | 20 | 32 | 27 | 91 |
| GMB | 9.7 × 10⁻⁵ | 1.8 × 10⁻⁴ | 2.8 × 10⁻⁶ | 3.1 × 10⁻⁵ | 1.7 × 10⁻⁴ | 27 | 24 | 31 | 28 | 91 |
| GEO | 3.8 × 10⁻⁴ | 7.1 × 10⁻⁴ | 3.3 × 10⁻⁵ | 6.2 × 10⁻⁵ | 1.2 × 10⁻⁵ | 19 | 17 | 27 | 20 | 92 |
| DEU | 8.5 × 10⁻⁵ | 2.8 × 10⁻⁴ | 6.8 × 10⁻⁵ | 7.0 × 10⁻⁵ | 1.1 × 10⁻⁶ | 18 | 15 | 23 | 19 | 94 |
| GHA | 1.5 × 10⁻⁴ | 1.6 × 10⁻⁴ | 3.0 × 10⁻⁶ | 2.5 × 10⁻⁵ | 1.2 × 10⁻⁴ | 25 | 23 | 31 | 29 | 91 |
| GRC | 1.6 × 10⁻⁴ | 2.4 × 10⁻⁴ | 8.0 × 10⁻⁵ | 7.0 × 10⁻⁵ | 2.7 × 10⁻⁶ | 15 | 16 | 22 | 18 | 92 |
| GRD | 1.2 × 10⁻⁴ | 2.1 × 10⁻⁴ | 2.3 × 10⁻⁵ | 2.4 × 10⁻⁵ | 3.0 × 10⁻⁵ | 19 | 21 | 24 | 22 | 92 |
| GTM | 5.3 × 10⁻⁵ | 1.1 × 10⁻⁴ | 5.3 × 10⁻⁶ | 2.6 × 10⁻⁵ | 7.8 × 10⁻⁵ | 21 | 20 | 25 | 20 | 91 |
| GIN | 1.4 × 10⁻⁴ | 1.8 × 10⁻⁴ | 2.1 × 10⁻⁶ | 4.0 × 10⁻⁵ | 2.8 × 10⁻⁴ | 27 | 25 | 37 | 29 | 91 |
| GNB | 1.1 × 10⁻⁴ | 1.5 × 10⁻⁴ | 2.6 × 10⁻⁶ | 3.1 × 10⁻⁵ | 2.9 × 10⁻⁴ | 27 | 24 | 32 | 30 | 91 |
| GUY | 1.7 × 10⁻⁴ | 2.8 × 10⁻⁴ | 6.3 × 10⁻⁶ | 3.3 × 10⁻⁵ | 4.6 × 10⁻⁵ | 25 | 26 | 27 | 24 | 91 |
| HTI | 1.7 × 10⁻⁴ | 2.5 × 10⁻⁴ | 1.0 × 10⁻⁵ | 3.5 × 10⁻⁵ | 2.6 × 10⁻⁴ | 26 | 25 | 27 | 25 | 91 |
| HND | 3.9 × 10⁻⁵ | 1.6 × 10⁻⁴ | 8.0 × 10⁻⁶ | 3.2 × 10⁻⁵ | 3.7 × 10⁻⁵ | 25 | 22 | 26 | 21 | 92 |
| HUN | 1.3 × 10⁻⁴ | 5.2 × 10⁻⁴ | 1.1 × 10⁻⁴ | 7.4 × 10⁻⁵ | 4.2 × 10⁻⁶ | 21 | 17 | 26 | 23 | 94 |
| ISL | 6.1 × 10⁻⁵ | 1.9 × 10⁻⁴ | 5.9 × 10⁻⁵ | 5.4 × 10⁻⁵ | − | 17 | 14 | 21 | 19 | − |
| IND | 9.8 × 10⁻⁵ | 2.2 × 10⁻⁴ | 1.2 × 10⁻⁵ | 1.1 × 10⁻⁴ | 1.1 × 10⁻⁴ | 26 | 27 | 30 | 27 | 91 |
| IDN | 1.7 × 10⁻⁴ | 2.1 × 10⁻⁴ | 2.2 × 10⁻⁵ | 4.1 × 10⁻⁵ | 6.7 × 10⁻⁵ | 26 | 26 | 28 | 32 | 92 |
| IRN | 6.4 × 10⁻⁵ | 2.0 × 10⁻⁴ | 1.0 × 10⁻⁵ | 2.1 × 10⁻⁵ | 3.1 × 10⁻⁵ | 21 | 20 | 26 | 24 | 92 |
| IRQ | 7.6 × 10⁻⁵ | 2.3 × 10⁻⁴ | 1.7 × 10⁻⁵ | 1.3 × 10⁻⁵ | 8.3 × 10⁻⁵ | 25 | 22 | 27 | 31 | 91 |
| IRL | 5.3 × 10⁻⁵ | 1.5 × 10⁻⁴ | 5.6 × 10⁻⁵ | 5.9 × 10⁻⁵ | 1.1 × 10⁻⁶ | 19 | 17 | 22 | 18 | 93 |
| ISR | 5.1 × 10⁻⁵ | 1.0 × 10⁻⁴ | 4.3 × 10⁻⁵ | 3.7 × 10⁻⁵ | 9.2 × 10⁻⁷ | 19 | 16 | 23 | 19 | 93 |
| ITA | 1.2 × 10⁻⁴ | 2.2 × 10⁻⁴ | 6.7 × 10⁻⁵ | 6.1 × 10⁻⁵ | 6.7 × 10⁻⁷ | 14 | 14 | 20 | 14 | 94 |
| JAM | 1.4 × 10⁻⁴ | 1.2 × 10⁻⁴ | 2.9 × 10⁻⁵ | 2.9 × 10⁻⁵ | 1.1 × 10⁻⁵ | 18 | 17 | 24 | 20 | 93 |
| JPN | 1.1 × 10⁻⁴ | 1.4 × 10⁻⁴ | 7.2 × 10⁻⁵ | 5.8 × 10⁻⁵ | 2.9 × 10⁻⁶ | 17 | 15 | 17 | 17 | 93 |
| JOR | 7.5 × 10⁻⁵ | 1.8 × 10⁻⁴ | 1.4 × 10⁻⁵ | 1.5 × 10⁻⁵ | 2.5 × 10⁻⁵ | 23 | 25 | 28 | 28 | 92 |
| KAZ | 1.8 × 10⁻⁴ | 4.5 × 10⁻⁴ | 3.9 × 10⁻⁵ | 5.4 × 10⁻⁵ | 2.4 × 10⁻⁵ | 24 | 20 | 27 | 24 | 92 |
| KEN | 3.9 × 10⁻⁵ | 4.1 × 10⁻⁵ | 2.7 × 10⁻⁶ | 1.3 × 10⁻⁵ | 1.3 × 10⁻⁴ | 25 | 24 | 28 | 31 | 91 |
| KIR | 1.3 × 10⁻⁴ | 1.3 × 10⁻⁴ | 2.1 × 10⁻⁵ | 3.5 × 10⁻⁵ | 1.7 × 10⁻⁴ | 30 | 30 | 30 | 35 | 91 |
| KWT | 3.1 × 10⁻⁵ | 1.1 × 10⁻⁴ | 8.3 × 10⁻⁶ | 7.8 × 10⁻⁶ | 8.6 × 10⁻⁶ | 29 | 32 | 26 | 37 | 92 |
| KGZ | 1.7 × 10⁻⁴ | 4.4 × 10⁻⁴ | 1.7 × 10⁻⁵ | 4.7 × 10⁻⁵ | 7.1 × 10⁻⁵ | 24 | 19 | 29 | 21 | 92 |
| LAO | 1.6 × 10⁻⁴ | 2.0 × 10⁻⁴ | 1.8 × 10⁻⁵ | 4.3 × 10⁻⁵ | 2.0 × 10⁻⁴ | 26 | 25 | 29 | 32 | 91 |
| LVA | 3.1 × 10⁻⁴ | 5.6 × 10⁻⁴ | 5.9 × 10⁻⁵ | 2.0 × 10⁻⁵ | 4.8 × 10⁻⁶ | 18 | 16 | 24 | 24 | 95 |
| LBN | 5.7 × 10⁻⁵ | 4.0 × 10⁻⁴ | 2.9 × 10⁻⁵ | 3.1 × 10⁻⁵ | 7.2 × 10⁻⁶ | 23 | 20 | 26 | 23 | 93 |
| LSO | 1.8 × 10⁻⁴ | 1.7 × 10⁻⁴ | 4.1 × 10⁻⁶ | 8.7 × 10⁻⁵ | 2.5 × 10⁻⁴ | 22 | 22 | 31 | 24 | 91 |
| LBR | 9.1 × 10⁻⁵ | 1.4 × 10⁻⁴ | 2.1 × 10⁻⁶ | 1.9 × 10⁻⁵ | 2.1 × 10⁻⁴ | 25 | 23 | 35 | 29 | 91 |
| LBY | 6.5 × 10⁻⁵ | 2.3 × 10⁻⁴ | 2.1 × 10⁻⁵ | 2.2 × 10⁻⁵ | 1.9 × 10⁻⁵ | 25 | 24 | 28 | 28 | 92 |
| LTU | 2.4 × 10⁻⁴ | 6.7 × 10⁻⁴ | 5.6 × 10⁻⁵ | 2.5 × 10⁻⁵ | 3.4 × 10⁻⁶ | 18 | 15 | 24 | 22 | 96 |
| LUX | 5.6 × 10⁻⁵ | 1.3 × 10⁻⁴ | 5.6 × 10⁻⁵ | 5.0 × 10⁻⁵ | 2.8 × 10⁻⁷ | 19 | 17 | 23 | 18 | 96 |
| MDG | 1.3 × 10⁻⁴ | 9.8 × 10⁻⁵ | 9.2 × 10⁻⁶ | 3.8 × 10⁻⁵ | 1.5 × 10⁻⁴ | 27 | 25 | 29 | 28 | 91 |
| MWI | 6.1 × 10⁻⁵ | 8.9 × 10⁻⁵ | 1.4 × 10⁻⁶ | 2.1 × 10⁻⁵ | 1.3 × 10⁻⁴ | 23 | 22 | 31 | 27 | 91 |
| MYS | 7.9 × 10⁻⁵ | 2.0 × 10⁻⁴ | 2.7 × 10⁻⁵ | 2.8 × 10⁻⁵ | 7.9 × 10⁻⁶ | 25 | 23 | 28 | 36 | 92 |
| MDV | 3.6 × 10⁻⁵ | 1.3 × 10⁻⁴ | 9.2 × 10⁻⁶ | 3.7 × 10⁻⁵ | 9.9 × 10⁻⁶ | 24 | 20 | 29 | 26 | 92 |
| MLI | 1.2 × 10⁻⁴ | 1.7 × 10⁻⁴ | 2.9 × 10⁻⁶ | 5.3 × 10⁻⁵ | 2.7 × 10⁻⁴ | 27 | 24 | 34 | 28 | 91 |
| MLT | 8.4 × 10⁻⁵ | 2.6 × 10⁻⁴ | 5.4 × 10⁻⁵ | 4.0 × 10⁻⁵ | 3.1 × 10⁻⁶ | 17 | 16 | 22 | 18 | 91 |
| MRT | 8.7 × 10⁻⁵ | 1.7 × 10⁻⁴ | 1.9 × 10⁻⁶ | 2.4 × 10⁻⁵ | 2.3 × 10⁻⁴ | 26 | 23 | 35 | 28 | 91 |
| MUS | 1.1 × 10⁻⁴ | 2.1 × 10⁻⁴ | 1.8 × 10⁻⁵ | 6.7 × 10⁻⁵ | 1.6 × 10⁻⁵ | 24 | 23 | 26 | 26 | 92 |
| MEX | 4.9 × 10⁻⁵ | 1.4 × 10⁻⁴ | 9.8 × 10⁻⁶ | 3.9 × 10⁻⁵ | 2.5 × 10⁻⁵ | 21 | 20 | 24 | 18 | 92 |
| FSM | 1.5 × 10⁻⁴ | 2.2 × 10⁻⁴ | 2.8 × 10⁻⁵ | 5.5 × 10⁻⁵ | 8.5 × 10⁻⁵ | 25 | 24 | 28 | 30 | 91 |
| MNG | 1.8 × 10⁻⁴ | 2.4 × 10⁻⁴ | 2.5 × 10⁻⁵ | 1.2 × 10⁻⁵ | 4.1 × 10⁻⁵ | 29 | 25 | 27 | 30 | 92 |
| MNE | 3.5 × 10⁻⁴ | 3.6 × 10⁻⁴ | 7.3 × 10⁻⁵ | 3.6 × 10⁻⁵ | 2.4 × 10⁻⁶ | 17 | 18 | 30 | 19 | 102 |
| MAR | 7.8 × 10⁻⁵ | 2.3 × 10⁻⁴ | 2.0 × 10⁻⁵ | 2.3 × 10⁻⁵ | 5.2 × 10⁻⁵ | 20 | 19 | 31 | 24 | 91 |
| MOZ | 9.0 × 10⁻⁵ | 8.0 × 10⁻⁵ | 3.6 × 10⁻⁶ | 1.8 × 10⁻⁵ | 1.8 × 10⁻⁴ | 25 | 23 | 27 | 30 | 91 |
| MMR | 1.7 × 10⁻⁴ | 1.0 × 10⁻⁴ | 2.9 × 10⁻⁵ | 7.4 × 10⁻⁵ | 1.6 × 10⁻⁴ | 25 | 24 | 28 | 28 | 91 |
| NAM | 1.1 × 10⁻⁴ | 1.4 × 10⁻⁴ | 4.9 × 10⁻⁶ | 4.8 × 10⁻⁵ | 1.3 × 10⁻⁴ | 23 | 22 | 30 | 27 | 91 |
| NPL | 1.2 × 10⁻⁴ | 2.5 × 10⁻⁴ | 2.0 × 10⁻⁵ | 1.0 × 10⁻⁴ | 9.1 × 10⁻⁵ | 24 | 24 | 30 | 26 | 91 |
| NLD | 7.5 × 10⁻⁵ | 1.4 × 10⁻⁴ | 8.4 × 10⁻⁵ | 6.9 × 10⁻⁵ | 9.5 × 10⁻⁷ | 18 | 16 | 22 | 20 | 92 |
| NZL | 7.1 × 10⁻⁵ | 1.6 × 10⁻⁴ | 5.1 × 10⁻⁵ | 5.2 × 10⁻⁵ | 5.9 × 10⁻⁶ | 17 | 16 | 22 | 19 | 92 |
| NIC | 4.8 × 10⁻⁵ | 1.4 × 10⁻⁴ | 9.8 × 10⁻⁶ | 2.7 × 10⁻⁵ | 6.2 × 10⁻⁵ | 25 | 20 | 26 | 20 | 91 |
| NER | 1.1 × 10⁻⁴ | 1.6 × 10⁻⁴ | 9.8 × 10⁻⁷ | 3.2 × 10⁻⁵ | 3.2 × 10⁻⁴ | 28 | 25 | 33 | 29 | 91 |
| NGA | 9.9 × 10⁻⁵ | 1.6 × 10⁻⁴ | 1.4 × 10⁻⁶ | 2.9 × 10⁻⁵ | 3.7 × 10⁻⁴ | 28 | 25 | 34 | 30 | 91 |
| NOR | 7.0 × 10⁻⁵ | 1.5 × 10⁻⁴ | 5.8 × 10⁻⁵ | 6.7 × 10⁻⁵ | 8.1 × 10⁻⁷ | 18 | 15 | 22 | 18 | 93 |
| OMN | 2.4 × 10⁻⁵ | 1.1 × 10⁻⁴ | 4.7 × 10⁻⁶ | 4.6 × 10⁻⁶ | 1.1 × 10⁻⁵ | 31 | 27 | 29 | 48 | 92 |
| PAK | 1.4 × 10⁻⁴ | 2.9 × 10⁻⁴ | 8.0 × 10⁻⁶ | 6.4 × 10⁻⁵ | 2.1 × 10⁻⁴ | 24 | 24 | 30 | 28 | 91 |
| PAN | 7.3 × 10⁻⁵ | 1.2 × 10⁻⁴ | 1.5 × 10⁻⁵ | 3.8 × 10⁻⁵ | 3.6 × 10⁻⁵ | 19 | 20 | 23 | 18 | 92 |
| PNG | 1.2 × 10⁻⁴ | 1.8 × 10⁻⁴ | 8.2 × 10⁻⁶ | 4.3 × 10⁻⁵ | 1.5 × 10⁻⁴ | 28 | 28 | 30 | 35 | 91 |
| PRY | 9.6 × 10⁻⁵ | 1.7 × 10⁻⁴ | 2.2 × 10⁻⁵ | 2.9 × 10⁻⁵ | 3.6 × 10⁻⁵ | 24 | 22 | 25 | 21 | 92 |
| PER | 4.8 × 10⁻⁵ | 1.2 × 10⁻⁴ | 1.5 × 10⁻⁵ | 2.7 × 10⁻⁵ | 2.5 × 10⁻⁵ | 26 | 21 | 23 | 21 | 92 |
| PHL | 1.7 × 10⁻⁴ | 2.3 × 10⁻⁴ | 2.1 × 10⁻⁵ | 5.0 × 10⁻⁵ | 8.7 × 10⁻⁵ | 29 | 27 | 29 | 33 | 91 |
| POL | 1.1 × 10⁻⁴ | 4.0 × 10⁻⁴ | 8.3 × 10⁻⁵ | 5.1 × 10⁻⁵ | 3.8 × 10⁻⁶ | 21 | 17 | 25 | 20 | 93 |
| PRT | 1.4 × 10⁻⁴ | 1.4 × 10⁻⁴ | 4.8 × 10⁻⁵ | 5.4 × 10⁻⁵ | 2.9 × 10⁻⁶ | 16 | 16 | 24 | 15 | 92 |
| QAT | 7.8 × 10⁻⁶ | 4.7 × 10⁻⁵ | 5.0 × 10⁻⁶ | 2.3 × 10⁻⁶ | 6.4 × 10⁻⁶ | 42 | 31 | 34 | 69 | 93 |
| KOR | 6.8 × 10⁻⁵ | 6.4 × 10⁻⁵ | 4.7 × 10⁻⁵ | 2.5 × 10⁻⁵ | 1.2 × 10⁻⁶ | 22 | 19 | 21 | 26 | 97 |
| MDA | 2.4 × 10⁻⁴ | 6.1 × 10⁻⁴ | 3.9 × 10⁻⁵ | 3.0 × 10⁻⁵ | 4.5 × 10⁻⁵ | 21 | 18 | 28 | 21 | 92 |
| ROU | 2.7 × 10⁻⁴ | 5.1 × 10⁻⁴ | 6.5 × 10⁻⁵ | 4.6 × 10⁻⁵ | 4.3 × 10⁻⁵ | 18 | 17 | 27 | 22 | 92 |
| RUS | 2.8 × 10⁻⁴ | 5.4 × 10⁻⁴ | 5.6 × 10⁻⁵ | 2.7 × 10⁻⁵ | 8.3 × 10⁻⁶ | 20 | 18 | 27 | 24 | 93 |
| RWA | 6.2 × 10⁻⁵ | 6.6 × 10⁻⁵ | 2.1 × 10⁻⁶ | 2.5 × 10⁻⁵ | 8.8 × 10⁻⁵ | 25 | 23 | 33 | 28 | 91 |
| LCA | 1.3 × 10⁻⁴ | 1.2 × 10⁻⁴ | 1.5 × 10⁻⁵ | 4.0 × 10⁻⁵ | 1.6 × 10⁻⁵ | 19 | 21 | 30 | 25 | 92 |
| VCT | 1.4 × 10⁻⁴ | 2.4 × 10⁻⁴ | 1.3 × 10⁻⁵ | 2.5 × 10⁻⁵ | 3.3 × 10⁻⁵ | 21 | 18 | 29 | 23 | 92 |
| WSM | 1.1 × 10⁻⁴ | 1.8 × 10⁻⁴ | 1.2 × 10⁻⁵ | 3.6 × 10⁻⁵ | 2.7 × 10⁻⁵ | 24 | 22 | 31 | 31 | 92 |
| STP | 1.2 × 10⁻⁴ | 1.1 × 10⁻⁴ | 2.0 × 10⁻⁵ | 7.1 × 10⁻⁵ | 7.9 × 10⁻⁵ | 23 | 20 | 26 | 22 | 91 |
| SAU | 5.5 × 10⁻⁵ | 1.4 × 10⁻⁴ | 4.4 × 10⁻⁶ | 8.9 × 10⁻⁶ | 1.3 × 10⁻⁵ | 25 | 26 | 30 | 33 | 91 |
| SEN | 9.1 × 10⁻⁵ | 1.6 × 10⁻⁴ | 2.4 × 10⁻⁶ | 3.2 × 10⁻⁵ | 1.3 × 10⁻⁴ | 25 | 22 | 36 | 27 | 91 |
| SRB | 2.0 × 10⁻⁴ | 3.1 × 10⁻⁴ | 8.5 × 10⁻⁵ | 5.8 × 10⁻⁵ | 3.5 × 10⁻⁶ | 20 | 18 | 27 | 21 | 94 |
| SYC | 8.1 × 10⁻⁵ | 1.8 × 10⁻⁴ | 2.1 × 10⁻⁵ | 3.1 × 10⁻⁵ | 1.4 × 10⁻⁵ | 27 | 24 | 27 | 35 | 92 |
| SLE | 1.6 × 10⁻⁴ | 2.2 × 10⁻⁴ | 1.9 × 10⁻⁶ | 4.0 × 10⁻⁵ | 2.9 × 10⁻⁴ | 31 | 28 | 36 | 31 | 91 |
| SGP | 5.0 × 10⁻⁵ | 1.1 × 10⁻⁴ | 4.3 × 10⁻⁵ | 1.3 × 10⁻⁵ | 4.5 × 10⁻⁶ | 22 | 21 | 22 | 27 | 92 |
| SVK | 1.1 × 10⁻⁴ | 3.1 × 10⁻⁴ | 5.7 × 10⁻⁵ | 2.6 × 10⁻⁵ | 1.0 × 10⁻⁵ | 22 | 17 | 25 | 24 | 92 |
| SVN | 1.2 × 10⁻⁴ | 2.3 × 10⁻⁴ | 6.9 × 10⁻⁵ | 3.3 × 10⁻⁵ | 5.2 × 10⁻⁷ | 18 | 15 | 24 | 18 | 109 |
| SLB | 1.2 × 10⁻⁴ | 1.5 × 10⁻⁴ | 9.7 × 10⁻⁶ | 4.5 × 10⁻⁵ | 7.9 × 10⁻⁵ | 26 | 25 | 31 | 31 | 92 |
| SOM | 1.1 × 10⁻⁴ | 1.5 × 10⁻⁴ | 3.0 × 10⁻⁶ | 2.6 × 10⁻⁵ | 5.7 × 10⁻⁴ | 28 | 27 | 33 | 29 | 91 |
| ZAF | 1.0 × 10⁻⁴ | 1.4 × 10⁻⁴ | 2.5 × 10⁻⁵ | 5.6 × 10⁻⁵ | 1.2 × 10⁻⁴ | 24 | 24 | 28 | 28 | 92 |
| SSD | 9.0 × 10⁻⁵ | 1.1 × 10⁻⁴ | 3.3 × 10⁻⁶ | 2.4 × 10⁻⁵ | 3.5 × 10⁻⁴ | 26 | 25 | 31 | 30 | 91 |
| ESP | 7.3 × 10⁻⁵ | 1.4 × 10⁻⁴ | 5.6 × 10⁻⁵ | 6.8 × 10⁻⁵ | 1.2 × 10⁻⁶ | 16 | 15 | 23 | 14 | 93 |
| LKA | 9.3 × 10⁻⁵ | 2.1 × 10⁻⁴ | 9.9 × 10⁻⁶ | 3.9 × 10⁻⁵ | 9.0 × 10⁻⁶ | 23 | 23 | 27 | 32 | 93 |
| SDN | 1.2 × 10⁻⁴ | 3.3 × 10⁻⁴ | 2.6 × 10⁻⁶ | 3.5 × 10⁻⁵ | 1.7 × 10⁻⁴ | 28 | 28 | 31 | 29 | 91 |
| SUR | 1.5 × 10⁻⁴ | 1.9 × 10⁻⁴ | 2.2 × 10⁻⁵ | 2.0 × 10⁻⁵ | 2.3 × 10⁻⁵ | 24 | 24 | 26 | 25 | 92 |
| SWZ | 1.1 × 10⁻⁴ | 1.4 × 10⁻⁴ | 4.5 × 10⁻⁶ | 5.4 × 10⁻⁵ | 1.9 × 10⁻⁴ | 24 | 23 | 31 | 27 | 91 |
| SWE | 8.4 × 10⁻⁵ | 2.2 × 10⁻⁴ | 5.1 × 10⁻⁵ | 5.6 × 10⁻⁵ | 1.5 × 10⁻⁶ | 17 | 15 | 20 | 20 | 93 |
| CHE | 5.5 × 10⁻⁵ | 1.7 × 10⁻⁴ | 5.1 × 10⁻⁵ | 4.3 × 10⁻⁵ | 9.3 × 10⁻⁷ | 18 | 14 | 22 | 20 | 93 |
| SYR | 6.8 × 10⁻⁵ | 3.7 × 10⁻⁴ | 2.3 × 10⁻⁵ | 1.8 × 10⁻⁵ | 2.8 × 10⁻⁵ | 27 | 22 | 27 | 28 | 91 |
| TJK | 1.5 × 10⁻⁴ | 3.2 × 10⁻⁴ | 8.5 × 10⁻⁶ | 4.0 × 10⁻⁵ | 1.3 × 10⁻⁴ | 22 | 20 | 32 | 22 | 92 |
| THA | 8.9 × 10⁻⁵ | 1.2 × 10⁻⁴ | 3.9 × 10⁻⁵ | 5.2 × 10⁻⁵ | 1.6 × 10⁻⁵ | 25 | 22 | 26 | 28 | 92 |
| MKD | 2.6 × 10⁻⁴ | 2.4 × 10⁻⁴ | 5.6 × 10⁻⁵ | 4.4 × 10⁻⁵ | 1.3 × 10⁻⁵ | 20 | 21 | 28 | 22 | 92 |
| TLS | 1.0 × 10⁻⁴ | 1.5 × 10⁻⁴ | 3.4 × 10⁻⁵ | 3.4 × 10⁻⁵ | 1.9 × 10⁻⁴ | 26 | 25 | 30 | 36 | 91 |
| TGO | 1.2 × 10⁻⁴ | 1.8 × 10⁻⁴ | 1.8 × 10⁻⁶ | 3.6 × 10⁻⁵ | 2.1 × 10⁻⁴ | 28 | 25 | 33 | 29 | 91 |
| TON | 9.5 × 10⁻⁵ | 1.8 × 10⁻⁴ | 4.7 × 10⁻⁵ | 5.4 × 10⁻⁵ | 2.8 × 10⁻⁵ | 22 | 22 | 25 | 26 | 92 |
| TTO | 1.1 × 10⁻⁴ | 2.2 × 10⁻⁴ | 1.7 × 10⁻⁵ | 2.3 × 10⁻⁵ | 2.3 × 10⁻⁵ | 21 | 23 | 26 | 22 | 92 |
| TUN | 1.0 × 10⁻⁴ | 2.9 × 10⁻⁴ | 2.5 × 10⁻⁵ | 3.1 × 10⁻⁵ | 1.8 × 10⁻⁵ | 21 | 20 | 29 | 24 | 92 |
| TUR | 6.7 × 10⁻⁵ | 2.0 × 10⁻⁴ | 4.9 × 10⁻⁵ | 5.5 × 10⁻⁵ | 7.7 × 10⁻⁶ | 23 | 21 | 30 | 22 | 92 |
| TKM | 1.6 × 10⁻⁴ | 4.3 × 10⁻⁴ | 1.7 × 10⁻⁵ | 1.3 × 10⁻⁵ | 1.4 × 10⁻⁴ | 28 | 23 | 35 | 31 | 91 |
| UGA | 7.7 × 10⁻⁵ | 8.2 × 10⁻⁵ | 3.4 × 10⁻⁶ | 2.6 × 10⁻⁵ | 1.6 × 10⁻⁴ | 27 | 25 | 34 | 29 | 91 |
| UKR | 2.2 × 10⁻⁴ | 8.5 × 10⁻⁴ | 4.7 × 10⁻⁵ | 3.2 × 10⁻⁵ | 1.2 × 10⁻⁵ | 21 | 17 | 28 | 23 | 93 |
| ARE | 2.2 × 10⁻⁵ | 5.4 × 10⁻⁵ | 3.0 × 10⁻⁶ | 6.9 × 10⁻⁶ | 5.7 × 10⁻⁶ | 38 | 34 | 33 | 58 | 94 |
| GBR | 7.7 × 10⁻⁵ | 1.5 × 10⁻⁴ | 7.3 × 10⁻⁵ | 7.4 × 10⁻⁵ | 2.8 × 10⁻⁶ | 18 | 17 | 20 | 18 | 92 |
| TZA | 6.7 × 10⁻⁵ | 1.2 × 10⁻⁴ | 1.1 × 10⁻⁶ | 2.3 × 10⁻⁵ | 1.5 × 10⁻⁴ | 26 | 23 | 30 | 29 | 91 |
| USA | 6.3 × 10⁻⁵ | 2.1 × 10⁻⁴ | 6.7 × 10⁻⁵ | 8.3 × 10⁻⁵ | 3.0 × 10⁻⁶ | 22 | 18 | 22 | 23 | 93 |
| URY | 1.2 × 10⁻⁴ | 1.8 × 10⁻⁴ | 6.1 × 10⁻⁵ | 7.7 × 10⁻⁵ | 6.1 × 10⁻⁶ | 19 | 17 | 25 | 18 | 92 |
| UZB | 1.0 × 10⁻⁴ | 4.0 × 10⁻⁴ | 8.9 × 10⁻⁶ | 1.1 × 10⁻⁵ | 5.8 × 10⁻⁵ | 25 | 21 | 32 | 29 | 92 |
| VUT | 1.1 × 10⁻⁴ | 1.9 × 10⁻⁴ | 1.3 × 10⁻⁵ | 4.3 × 10⁻⁵ | 6.6 × 10⁻⁵ | 26 | 24 | 30 | 31 | 92 |
| VEN | 7.8 × 10⁻⁵ | 1.9 × 10⁻⁴ | 2.4 × 10⁻⁵ | 3.2 × 10⁻⁵ | 2.8 × 10⁻⁵ | 22 | 22 | 27 | 22 | 92 |
| VNM | 1.4 × 10⁻⁴ | 1.2 × 10⁻⁴ | 3.7 × 10⁻⁵ | 3.8 × 10⁻⁵ | 4.5 × 10⁻⁵ | 23 | 19 | 27 | 29 | 92 |
| YEM | 1.5 × 10⁻⁴ | 3.6 × 10⁻⁴ | 4.6 × 10⁻⁶ | 4.1 × 10⁻⁵ | 1.6 × 10⁻⁴ | 28 | 28 | 29 | 28 | 91 |
| ZMB | 6.5 × 10⁻⁵ | 9.5 × 10⁻⁵ | 2.2 × 10⁻⁶ | 2.2 × 10⁻⁵ | 1.6 × 10⁻⁴ | 26 | 25 | 29 | 31 | 91 |
| ZWE | 6.9 × 10⁻⁵ | 1.0 × 10⁻⁴ | 4.2 × 10⁻⁶ | 3.1 × 10⁻⁵ | 1.4 × 10⁻⁴ | 26 | 22 | 27 | 29 | 91 |
References
- Ayittey, F.K.; Ayittey, M.K.; Chiwero, N.B.; Kamasah, J.S.; Dzuvor, C. Economic impacts of Wuhan 2019-nCoV on China and the world. J. Med. Virol. 2020, 92, 473–475. [Google Scholar] [CrossRef] [PubMed]
- Muhammad, S.; Long, X.; Salman, M. COVID-19 pandemic and environmental pollution: A blessing in disguise? Sci. Total Environ. 2020, 728, 138820. [Google Scholar] [CrossRef] [PubMed]
- Saadat, S.; Rawtani, D.; Hussain, C.M. Environmental perspective of COVID-19. Sci. Total Environ. 2020, 728, 138870. [Google Scholar] [CrossRef] [PubMed]
- Zambrano-Monserrate, M.A.; Ruano, M.A.; Sanchez-Alcalde, L. Indirect effects of COVID-19 on the environment. Sci. Total Environ. 2020, 728, 138813. [Google Scholar] [CrossRef] [PubMed]
- Sarkodie, S.A.; Owusu, P.A. Global assessment of environment, health and economic impact of the novel coronavirus (COVID-19). Environ. Dev. Sustain. 2020. [Google Scholar] [CrossRef]
- Johns Hopkins University. Available online: https://coronavirus.jhu.edu/map.html (accessed on 26 May 2020).
- United Nations. Available online: https://www.un.org/development/desa/dpad/publication/world-economic-situation-and-prospects-as-of-mid-2020/ (accessed on 26 May 2020).
- Wu, X.; Nethery, R.C.; Sabath, B.M.; Braun, D.; Dominici, F. Exposure to air pollution and COVID-19 mortality in the United States. medRxiv 2020. [Google Scholar] [CrossRef]
- Andree, B.P.J. Incidence of COVID-19 and Connections with Air Pollution Exposure: Evidence from the Netherlands. World Bank Policy Res. Work. Paper 2020, 5. Available online: https://documents.worldbank.org/en/publication/documents-reports/documentdetail/462481587756439003/incidence-of-covid-19-and-connections-with-air-pollution-exposure-evidence-from-the-netherlands (accessed on 30 June 2020).
- Bao, R.; Zhang, A. Does lockdown reduce air pollution? Evidence from 44 cities in northern China. Sci. Total Environ. 2020, 139052. [Google Scholar] [CrossRef]
- World Health Organization (WHO). Available online: https://www.who.int/health-topics/air-pollution#tab=tab_1 (accessed on 26 May 2019).
- Tang, L.; Nagashima, T.; Hasegawa, K.; Ohara, T.; Sudo, K.; Itsubo, N. Development of human health damage factors for PM2.5 based on a global chemical transport model. Int. J. Life Cycle Assess. 2018, 23, 2300–2310. [Google Scholar] [CrossRef]
- van Zelm, R.; Preiss, P.; van Goethem, T.; Van Dingenen, R.; Huijbregts, M. Regionalized life cycle impact assessment of air pollution on the global scale: Damage to human health and vegetation. Atmos. Environ. 2016, 134, 129–137. [Google Scholar] [CrossRef]
- Berman, J.D.; Ebisu, K. Changes in U.S. air pollution during the COVID-19 pandemic. Sci. Total Environ. 2020, 739, 139864. [Google Scholar] [CrossRef]
- Krecl, P.; Targino, A.C.; Oukawa, G.Y.; Cassino Junior, R.P. Drop in urban air pollution from COVID-19 pandemic: Policy implications for the megacity of São Paulo. Environ. Pollut. 2020, 265, 114883. [Google Scholar] [CrossRef] [PubMed]
- Kanniah, K.D.; Kamarul Zaman, N.A.F.; Kaskaoutis, D.G.; Latif, M.T. COVID-19’s impact on the atmospheric environment in the Southeast Asia region. Sci. Total Environ. 2020, 736, 139658. [Google Scholar] [CrossRef] [PubMed]
- ECMWF. Available online: https://www.ecmwf.int/ (accessed on 26 May 2020).
- MATLAB and Statistics Toolbox Release 2019a; The MathWorks, Inc.: Natick, MA, USA, 2019; Available online: https://www.mathworks.com/products/matlab.html (accessed on 30 June 2020).
- Copernicus. Available online: https://atmosphere.copernicus.eu/sites/default/files/2019-03/16_CAMS84_2018SC1_D1.1.1_SON2018_v1.pdf (accessed on 26 May 2020).
- Zhao, Y.; Huang, B.; Marinoni, A.; Gamba, P. High spatiotemporal resolution PM2.5 concentration estimation with satellite and ground observations: A case study in New York City. IEEE 2018. [Google Scholar] [CrossRef]
- Prud’homme, G.; Dobbin, N.A.; Sun, L. Comparison of remote sensing and fixed-site monitoring approaches for examining air pollution and health in a national study population. Atmos. Environ. 2013, 80, 161–171. [Google Scholar] [CrossRef]
- WHO. Available online: https://www.who.int/airpollution/data/AAP_database_summary_results_2018_final2.pdf (accessed on 26 May 2020).
- SEDAC. Available online: https://sedac.ciesin.columbia.edu/data/collection/gpw-v4. (accessed on 26 May 2020).
- INSEE. Available online: https://www.insee.fr/en/statistiques. (accessed on 26 May 2020).
- China Statistics Press. Available online: http://www.stats.gov.cn/english/. (accessed on 26 May 2020).
- WHO. Available online: https://www.who.int/healthinfo/global_burden_disease/en/, (accessed on 26 May 2020).
- Krewski, D.; Jerrett, M.; Burnett, R.T.; Ma, R.; Hughes, E.; Shi, Y.; Thun, M.J. Extended Follow-up and Spatial Analysis of the American Cancer Society Study Linking Particulate Air Pollution and Mortality (No. 140) 2009; Health Effects Institute: Boston, MA, USA, 2009. [Google Scholar]
- Apte, J.S.; Marshall, J.D.; Cohen, A.J.; Brauer, M. Addressing Global Mortality from Ambient PM2.5. Sci. Total Environ. 2015, 49, 8057–8066. [Google Scholar] [CrossRef] [PubMed]
- He, G.; Fan, M.; Zhou, M. The effect of air pollution on mortality in China: Evidence from the 2008 Beijing Olympic Games. J. Environ. Econ. Manag. 2016, 79, 18–39. [Google Scholar] [CrossRef]
- Le Quéré, C.; Jackson, R.B.; Jones, M.W.; Smith, A.J.; Abernethy, S.; Andrew, R.M.; Friedlingstein, P. Temporary reduction in daily global CO2 emissions during the COVID-19 forced confinement. Nat. Clim. Chang. 2020, 1–7. [Google Scholar] [CrossRef]
- Yienger, J.J.; Galanter, M.; Holloway, T.A.; Phadnis, M.J.; Guttikunda, S.K.; Carmichael, G.R.; Levy, H. The episodic nature of air pollution transport from Asia to North America. J. Geophysical Res. Atmos. 2000, 105, 26931–26945. [Google Scholar] [CrossRef]
- Chen, D.S.; Cheng, S.Y.; Liu, L.; Chen, T.; Guo, X.R. An integrated MM5–CMAQ modeling approach for assessing trans-boundary PM10 contribution to the host city of 2008 Olympic summer games—Beijing, China. Atmos. Environ. 2007, 41, 1237–1250. [Google Scholar] [CrossRef]
- Long, Y.; Wang, J.; Wu, K.; Zhang, J. Population exposure to ambient PM2.5 at the subdistrict level in China. Int. J. Environ. Res. Public Health 2018, 15, 2683. [Google Scholar] [CrossRef]
- Wang, W.; Zhao, S.; Jiao, L.; Taylor, M.; Zhang, B.; Xu, G.; Hou, H. Estimation of PM2.5 Concentrations in China using a spatial back propagation neural network. Sci. Rep. 2019, 9, 1–10. [Google Scholar]
- WHO. Carbonh. Available online: http://www.euro.who.int/en/health-topics/environment-and-health/Climate-change/publications/2018/achieving-health-benefits-from-carbon-reductions-manual-for-carbonh-calculation-tool-2018 (accessed on 26 May 2020).
- UN, World Population Prospects 2019. Available online: https://population.un.org/wpp/Download/Standard/Population/ (accessed on 26 May 2020).
- RTE France, Eco2mix. Available online: https://www.rte-france.com/en/eco2mix/eco2mix (accessed on 26 May 2020).
- ENTSO-E, Transparency Platorm. Available online: https://transparency.entsoe.eu/generation/r2/actualGenerationPerProductionType/show (accessed on 26 May 2020).
- Apple, Mobility Trends Reports. Available online: https://www.apple.com/covid19/mobility (accessed on 26 May 2020).
- Tobías, A.; Carnerero, C.; Reche, C. Changes in air quality during the lockdown in Barcelona (Spain) one month into the SARS-CoV-2 epidemic. Sci. Total Environ. 2020, 726, 138540. [Google Scholar] [CrossRef] [PubMed]
- Kerimray, A.; Baimatova, N.; Ibragimova, O.P. Assessing air quality changes in large cities during COVID-19 lockdowns: The impacts of traffic-free urban conditions in Almaty, Kazakhstan. Sci. Total Environ. 2020, 730, 139179. [Google Scholar] [CrossRef] [PubMed]
- FAO. 2016. Available online: http://www.fao.org/nr/water/aquastat/data/query/index.html?lang=en (accessed on 26 May 2020).
- IDEAv2 Database. Available online: http://idea-lca.com/?lang=en (accessed on 26 May 2020).
- GREET Model. Available online: https://greet.es.anl.gov/ (accessed on 26 May 2020).
- International Organization for Standardization (ISO). Available online: https://www.iso.org/obp/ui/#search/code/ (accessed on 26 May 2020).
© 2020 by the authors. Licensee MDPI, Basel, Switzerland. This article is an open access article distributed under the terms and conditions of the Creative Commons Attribution (CC BY) license (http://creativecommons.org/licenses/by/4.0/).