Article

Research on Urban Bearing Capacity of Gas Supply Stations

1
School of Remote Sensing and Information Engineering, Wuhan University, Wuhan 430079, China
2
China Special Equipment Inspection and Research Institute, Beijing 100029, China
3
School of Journalism and Communication, Wuhan University, Wuhan 430079, China
*
Author to whom correspondence should be addressed.
Sustainability 2019, 11(24), 6971; https://doi.org/10.3390/su11246971
Submission received: 27 October 2019 / Revised: 1 December 2019 / Accepted: 2 December 2019 / Published: 6 December 2019

Abstract

:
Given the continuous optimisation of the energy structure, the proportion of natural gas consumption in China increases annually, the urban gas pipeline network continues to extend outward, and the supply range continues to expand. Although an increasing number of users can use natural gas, the coverage of the natural gas pipeline network remains low in some areas in China. A “point supply” pattern, which provides gas through liquefied natural gas (LNG), compressed natural gas (CNG) and liquefied petroleum gas (LPG) supply stations, has been developed to solve the problem of gas unavailability in areas not covered by the pipeline network. This pattern flexibly supplies gas, whose cost is low and market determined. Thus, the substantial development of these gas supply stations has been promoted. This pattern will continue to play an important role in the future. However, no unified standards for the construction of these gas supply stations have been provided, resulting in various problems, such as unreasonable location, inadequate management, potential risk and imbalance between supply and demand. On the basis of these concerns, this research attempts to study the urban bearing capacity of gas supply stations, provide some new ideas for the construction and planning of urban gas supply stations, and help promote sustainable urban development. The pressure–state–response model is adjusted to the pressure–state–capability model, which is used as a basis for proposing an evaluation index system and calculation models for the comprehensive evaluation of the urban bearing capacity of gas supply stations on city and country scales. The proposed methodology is used in a case study of urban agglomerations in the Yangtze River Delta.

1. Introduction

The use of low-carbon energy in the world has accelerated, and natural gas and non-fossil energy have become the main directions of global energy development. In China, the energy structure and use of clean energy have been modified via a series of industrial policies and special plans. For example, the Action Plan for the Prevention and Control of Air Pollution [1], which was issued by the State Council on 10 September 2013, was proposed to strengthen the comprehensive control of air pollution in industrial enterprises. This action plan focused on the renovation of small coal-fired boilers and the acceleration of the construction of centralised heating, “coal to gas” and “coal to electricity” projects. To accelerate the adjustment of the energy structure and increase the supply of clean energy, this policy also proposed a series of measures, such as controlling total coal consumption, accelerating the alternative use of clean energy and formulating a natural gas development plan. Additionally, the 13th Five-Year Standard for Energy Development, issued in 2017, put forward the target of energy consumption structures for the 13th Five-Year Plan period: the proportion of non-fossil energy consumption will be increased to over 15%, the proportion of natural gas consumption will reach 10%, and the proportion of coal consumption will be reduced to under 58% [2]. China’s natural gas industry has developed vigorously because of the promotion and implementation of various policies and policies. An increasing number of residents and industrial users have begun to use natural gas, and their consumption scale has further expanded. In 2017, the length of China’s natural gas pipeline and the total natural gas consumption respectively reached 623,253 km and 207.806 billion m3, which accounted for 7% of the total energy consumption [3].
Despite the immense development of the natural gas industry in China, the construction speed of natural gas pipelines in the country does not match the scale of natural gas application. This situation is particularly true when the “coal to gas” policy and “gas to every village” project are implemented. This embarrassing situation indicates that natural gas is unavailable in many areas where the policy is implemented because of the limited coverage of natural gas pipelines. A pattern of “point supply” is used to effectively solve this problem, and this pattern supplies liquefied natural gas (LNG), compressed natural gas (CNG) and liquefied petroleum gas (LPG) to gas supply stations. Additionally, natural gas pipelines are government guided, not market oriented, thereby resulting in a significant price advantage for the “point supply” mode. Furthermore, the “point supply” mode is flexible, low cost and substantially developed.
“Point supply” and pipeline gases complement each other [4]. The former plays an important role as a transitional gas source in areas not covered by pipeline natural gas and the main gas supply source in small towns that are distant from natural gas transmission pipelines or some areas where the construction of high-pressure gas pipelines is uneconomical. Therefore, the “point supply” pattern has far-reaching significance in ensuring the stable supply of urban gas, expanding the scale of natural gas consumption, promoting the use of clean energy and protecting the environment and ecology. However, no uniform regulation on the construction of gas stations of “point supply” has been issued by the government, which leads to a series of problems in the gas industry, such as a low threshold of industry access, unreasonable position, inadequate risk management and disruption of the pipeline gas market [5]. Energy planning is a difficult problem, and there are many challenges in the field, which has been studied by some foreign scholars. Nastasi et al. [6] investigated the impact of renewable energy sources share increase from 25% up to 50% in the electricity mix with the objective function of primary energy consumption and evaluated the leverage effect of power to gas on the system in terms of renewable heat contribution. Stephens-Romero et al. [7] conducted a research on the systematic planning to optimize investments in hydrogen infrastructure deployment by considering the deployment of hydrogen infrastructure and fuel-cell vehicles, and the economic and environmental impact this had. Some scholars have tried to explore the alternatives used in energy planning and spatial distribution. Michel Noussan and Benedetto Nastasi [8] analyzed a dataset of almost 2.9 million of heating systems, and aimed at describing the features of current heating systems in households, offices and public buildings, and the results of this work can be useful and helpful for local energy planners and policy makers. Cajot et al. [9] proposed a systematic framework to analyze the challenges and obstacles which hinder efficient urban energy planning, and discussed the importance of this organized, comprehensive definition and understanding of the problem. Research on energy planning in China is mainly carried out in combination with relevant policies issued by the government, while there is no unified standard and regulation. To provide a new idea to solve these problems, the urban bearing capacity to the gas station of “point supply” is studied.
The physics-based concept of bearing capacity is the ability of a foundation to load buildings. With the cross-application of this concept in other disciplines, it becomes richer in connotation. Foreign scholars studied the bearing capacity, although their methods tended to be quantitative and their content focused on the bearing capacity of resources and environment [10,11,12], economy [13,14] and comprehensive bearing capacity of cities [15]. Related studies started relatively late in China and mainly focused on the fields of natural resources, ecological environment and infrastructure. Nevertheless, Chinese scholars conducted multi-angle, multi-layer and multi-regional studies on the bearing capacity of natural resources, such as water, land and mineral resources. Min et al. [16] applied fuzzy mathematics theory, introduced a method to evaluate the bearing capacity of regional water resources and used Hejin, a city in Shanxi Province, as a case study for concrete calculation and analysis. Na [17] evaluated the bearing capacity of water resource in Liaoning Province by using a pressure–state–response model. Jun et al. [18] proposed a model to evaluate the carrying capacity of water resources in urbanised areas by combining objective comprehensive analysis and multi-stage grey relational evaluation. Since the 1970s, against the background of increasingly prominent global issues, such as population, resources, environment and development, the number of studies on the carrying capacity of land resources on national and regional scales has increased. Feng et al. [19] constructed a land-carrying capacity index (LCCI) model based on the relationship between human and food and evaluated the bearing capacity of land resource in different areas in China from 1949 to 2005 on country, provincial and national scales. Wang et al. [20] analyzed the land-bearing capacity in the Beijing-Tianjin-Hebei area. Qi [21] introduced a research method for the quantitative and comprehensive evaluation of the carrying capacity of land resources. The carrying capacity of mineral resources has been widely explored by scholars and governments with the contradiction between supply and demand of mineral resources. In accordance with the theory of regional sustainable development, Wei [22] estimated the bearing capacity, competitiveness and sustainability of the main mineral resources in Heilongjiang Province by using the multi-stage fuzzy comprehensive evaluation method. Li [23] constructed an evaluation system of the carrying capacity of coal resources, divided the evaluation criteria of indices and proposed a method based on set pair analysis and entropy weight assignment.
The carrying capacity of infrastructure is also an important subject in this field. Studies on the bearing capacity of infrastructure can be divided into three categories. Firstly, the studies have been performed on the bearing capacity of a single kind of urban infrastructure, such as traffic facility. Wang [24] proposed an evaluation model of urban traffic carrying capacity based on the coordination between traffic demand and traffic supply. Zhang [25] studied the factors influencing the supply and demand of urban transportation facilities and the mechanism of action based on basic theories and research methods, such as urban economics, regional economics and statistics. They also discussed the particularity of transportation facilities in megacities from the perspective of regional functions, and objectively determined and analysed the problems related to the carrying capacity of transportation facilities in Beijing. Secondly, the comprehensive bearing capacity of infrastructure has been evaluated by building a model that consisted of indices that reflect the service capacity and state of educational, medical, health, transportation, communication and water supply and drainage facilities. Yang et al. [26] constructed a rating index system of the carrying capacity of urban public service facilities via the Delphi analytic hierarchy process and considered the participation of gas supply facilities in comprehensive carrying capacity evaluation as part of infrastructure. Miao [27] put forward an evaluation index system of the carrying capacity of urban infrastructure and constructed an AHP (Analytic Hierarchy Process)-entropy combination TOPSIS (Technique for Order Preference by Similarity to an Ideal Solution)evaluation model to examine the infrastructure bearing capacity in Beijing–Tianjin–Hebei region. Zhang [28] performed principal component analysis to calculate and compare the carrying capacity index of the infrastructure in Lanzhou and China from 2005 to 2016. Zhao et al. [29] also adopted principal component analysis to determine the bearing capacity index of the infrastructure in Beijing and used a relative resource-carrying capacity measurement method to measure the carrying state of infrastructure. Lastly, some scholars believe that urban comprehensive bearing capacity includes natural environment carrying capacity and artificial environment bearing capacity, and also consider infrastructure a component of an artificial environment to calculate urban comprehensive bearing capacity. Ye [30] revealed that the comprehensive carrying capacity of a city refers to the carrying capacity of urban resource endowment, ecological environment, infrastructure and public services to an urban population and economic and social activities. Fu et al. [31] also sorted out the comprehensive bearing capacity of a city and indicated that urban comprehensive bearing capacity should include the bearing capacities of urban resources, environment, ecosystem, infrastructure, safety and public service. Gao et al. [32] evaluated the comprehensive carrying capacity of the city in the Chengdu–Chongqing economic zone and found that carrying capacity is not proportional to the size of a city.
Few studies have been conducted on the bearing capacity of the natural gas supply facilities, particularly natural gas supply stations, which are important livelihood facilities. When studying the comprehensive bearing capacity of urban infrastructure, some scholars have considered the gas pipeline network as a component of energy supply facilities to participate in the process of evaluation. Yang et al. [26] included gas supply facilities in the evaluation of the comprehensive carrying capacity as part of infrastructure. Yue et al. [33] argued that single bearing capacity is gradually unable to meet the comprehensive assessment of the sustainable state of urban development and built an evaluation index based on economy, resource and society. However, a few other studies have conducted an in-depth research on the bearing capacity of the urban gas pipeline network as a type of individual service facility. Xiao [34] combined the development of urban gas with the network structure; selected indices from such influencing factors as facility capacity, hydraulic conditions and the service radius of gas station to build the evaluation model of pipeline network carrying capacity; and evaluated the bearing capacity of sub-high pressure regulating facilities and medium pressure pipelines in the city. Liu [35] conducted simulation experiments on the flow rate of the regulator station and proposed an estimation method for the flow rate of the regional pressure-regulating station. Additionally, the hydraulic working mode of the pipeline network was simulated, which was beneficial for assessment of the bearing capacity of the gas pipeline network under different hydraulic working conditions and provided a theoretical basis for urban gas planning, transformation and other engineering construction. Numerous foreign scholars have performed experiments on the reliability and risks of the gas pipeline network. Amirat et al. [36] believed that the residual stresses generated during manufacturing and in-service corrosion reduce the ability to resist internal and external loading. They further observed that residual stress distribution in large-diameter pipes has been characterised experimentally to be coupled with the corrosion model. They found that residual stress greatly increases the failure probability, especially at the early stage of the pipe lifetime. In order to deal with vagueness of the data, Shahriar et al. [37] employed fuzzy logic to derive the fuzzy probabilities (likelihood) of basic events in a fault tree and estimate fuzzy probabilities (likelihood) of output event consequences. They further explored how interdependencies amongst various factors may influence analysis results and introduced a fuzzy utility value to perform the risk assessment of natural gas pipelines by using the triple bottom-line sustainability criteria, namely, social, environmental and economical consequences. Badida et al. [38] conducted expert heuristic fuzzy fault tree analysis to analyse the failure rate of natural disasters in pipelines and provided a reference for oil and gas pipeline risk-management decisions.
In summary, bearing capacity has been explored in many fields, such as geographic science, resource science, environmental science, ecological science, land-resource management and urban and rural planning. Studies on bearing capacity have been conducted from different perspectives. Research objects have changed from single to comprehensive, and methods have transformed from qualitative to quantitative. Related results on carrying capacity have provided theoretical and practical guidance for urban planning, resource development and utilisation and coordinated resource and economy development. In the aspect of spatial planning, China focuses on the evaluation of the carrying capacity of resources and environment. The results of bearing capacity have been used to formulate policies associated with not only the population but also the development and utilisation of natural resources, such as land and water. With the acceleration of urbanisation, infrastructure is facing challenges in bearing the increasing demands of urban residents for basic public services. In this context, some scholars proposed different methods to evaluate the bearing capacity of infrastructure, including transportation, education, medical and health, power supply, gas supply facilities and so on. For the sustainable development of a city, some scholars studied ecological carrying capacity and urban comprehensive carrying capacity. Therefore, the concept, method and theory of carrying capacity are continuously being developed.
Although many research works have been performed on bearing capacity and the research object has become increasingly rich on the urban bearing capacity to gas supply stations. The traditional evaluation of bearing capacity mostly involves static evaluation on a single scale, but this method cannot meet the actual needs of space planning. Chinese regional economic integration has been accelerating, and the regional economy represented by urban agglomerations, such as Beijing–Tianjin–Hebei region, Yangtze River Delta and Pearl River Delta, has gradually become the focus of research. Although some scholars studied the bearing capacity of urban agglomerations, few results have been obtained, and most studies have been conducted in the Beijing–Tianjin–Hebei region. This study aims to investigate the urban bearing capacity of gas supply stations on country and city scales and apply the method in urban agglomerations in the Yangtze River Delta. Therefore, this method is a small but important step to fill in the research gap on the urban bearing capacity of gas supply stations and expand the range of research objects.
Theoretically, the geographical space occupied by human survival and development is limited, and the material consumed is supplied by nature. Scientific and reasonable space planning is conducive to optimising the space development pattern, saving and efficient utilisation of resources and improving the quality of the environment. Therefore, the formulation of land and space planning and the implementation of land and space governance will build a beautiful China, create a good working and living environment, and maintain global ecological security [39]. Numerous countries have evaluated carrying capacity based on the main task of their space planning and space management and used it in practice as mentioned above. The results of the evaluation of the carrying capacity of resources and the environment have been used in postdisaster reconstruction in Wenchuan, Yushu, Zhouqu and other areas [40]. In China, the resource and environment carrying capacity assessment has been clearly regarded as the basis for dividing land, allocating space functions and implementing space use control. With the continuous expansion of population and the economy, the pressure on urban infrastructure has been increasing. Urban infrastructure is not only the material foundation of urban existence and development but also the basic condition of citizens’ lives. Studies have evaluated single or comprehensive bearing capacity, and the significance of evaluating carrying capacity in spatial planning and infrastructure assessment has been widely accepted. As an important facility of people’s livelihood, the spatial distribution pattern of gas supply stations is related not only to the reasonable allocation of gas resources and the quality of life of urban residents but also residents’ safety and the rational planning of urban space. However, our literature review has shown few relevant results of the evaluation of the urban bearing capacity to gas supply stations, which is valuable question to explore.
This study aims to propose a model to assess urban bearing capacity to gas supply stations and loading state of them on both city and country scales, which will be a small and important step to fill in the research gap in this aspect and results. The proposed model is based on the pressure–state–capacity model, which consists of the indices reflecting the urban state and ability to bear the facility and the pressure brought by the facility to the area. The corresponding method is applied in urban agglomerations in the Yangtze River Delta. With this method, the urban bearing capacity to gas supply stations and the loading state of the gas supply stations in urban agglomerations in the Yangtze River Delta can be obtained on county and city scales. This method will be beneficial to policy makers, gas distribution companies and the scientific community.
This paper is organized as follows: Section 2 presents the proposed methodology. Section 3 shows a case study that uses the proposed methodology to evaluate the urban bearing capacity of gas supply stations in the study area. Section 4 discusses the research method and the results. Section 5 summarizes the whole paper.

2. Methodology

Multi-index evaluation is a common method in bearing capacity evaluation. This research constructed an evaluation index system based on the press–state–capacity model, which is adjusted from the pressure–state–response model.

2.1. Research Approach

Bearing capacity originates from physics mechanics and indicates the ability of an object to resist an external object. With the expansion of the application field, the concepts of the bearing capacity of population, land, water, resource, ecology, environment and so on have been successively developed. Although research methods and theories on carrying capacity are expanding and improving, the concept of carrying capacity has never achieved consensus, nor has ecological carrying capacity [41]. Therefore, based on the researches of most scholars on carrying capacity, the concept of carrying capacity can be characterized as a specific system to a certain bearing object [42]. Therefore, according to frame of bearing capacity, the concept of urban bearing capacity to gas supply stations in this paper can be defined as the capacity of a region to carry gas supply stations in terms of meeting the needs of gas users and without affecting the sustainable development of a city. Various research methods have been used to evaluate bearing capacity from different perspectives. A common method is the index evaluation method, whose general process is as follows: constructing a conceptual model, establishing an evaluation index system, calculating index weight and evaluating carrying capacity. A common conceptual model used in this field is the pressure–state–response model. In this study, our conceptual model is constructed on the basis of this commonly used model, and an evaluation index system is developed. Then, models of the bearing capacity and loading state of gas supply stations are established. The methodology is applied to urban agglomerations in the Yangtze River Delta as a case study.
To promote energy transformation, China has implemented a series of policies and measures, such as replacing coal with gas and reducing coal consumption, which rapidly accelerate the consumption of oil and gas; China has become the world’s largest importer of crude oil and natural gas [43]. According to the latest development report of China’s energy and chemical industry in 2019, China’s natural gas industry can meet market demands; driven by the policy of replacing coal with natural gas, demand in some regions is growing faster than that of infrastructure [44]. However, many regions still lack a municipal gas pipe network because of the insufficient development of urban gas pipe network facilities; LNG, CNG and other gas supply methods are applied in this case, and they have developed rapidly and shown strong vitality [45]. However, operating these gas supply stations creates security risks and heightened competition in market application; furthermore, relevant regulations are not perfect, and charging license is unavailable [46]. With these factors, China is a suitable country for conducting such a study. Our results can help policy makers propose reasonable space planning, especially in regions with weak gas pipe networks. Our results can also contribute to the safety of residents. Expanding the natural gas consumption market is one of the major tasks indicated in China’s 13th five-year energy plan; the “coal to gas” project will be carried out in key cities such as the Beijing–Tianjin–Hebei region and its surrounding areas, the Yangtze River Delta, the Pearl river delta and northeast China [2]. The Yangtze River Delta is one of the regions with the strongest comprehensive economy, the most dynamic development and the highest degree of development in China; it is also one of the six largest urban groups in the world. Accelerating the regional integration development of the Yangtze River Delta is not only a general trend but also an internal demand. Data availability is also an important reason for us to choose this area as a case study.
The data used in this study can be divided into relevant standards of the Chinese gas industry, social and economic statistical data, data of gas supply stations, geographical condition-monitoring data and dangerous points of interest (POIs). Chinese gas industry standards, which are used to select evaluation indices, include the Code for the Design of City Gas Engineering [47] (GB50028-2006) and the Code for Fire Prevention Design of Buildings [48], which are important and obligatory standards of the gas industry and can be obtained from China standard service network (www.cssn.net.cn). Social and economic statistical data, such as population, GDP and so on, are downloaded from the official website of the Statistics Bureau of Cities in the study area and used to calculate the value of some of the indices (Table 1) including proportion of tertiary industry, per capita GDP, increasing rate of GDP and population density. The data of gas supply stations are downloaded from BaiDu Map via the crawler method, and their distribution is shown in Section 3.1. Geographical conditions monitoring data is provided by the Third Geoinformation Mapping Institute of National Administration of Surveying Mapping and Geoinformation, and used to calculate the proportion of developable area, density of buildings, change rate of building density, per capita construction land area, and convenience of transportation. Dangerous POI data, including chemical plants, gas stations, gasoline stations in this paper, are also downloaded from BaiDu Map via the crawler method. The latest geographical condition monitoring data we can obtain was recorded in 2017, so the social and economic statistical data documented in 2017 is used consistently in this study. Therefore, the duration of research is one year and this was 2017.
The software we used in this research are ArcGIS, Python and Statistical Product and Service Solutions (SPSS) Statistics. The ArcGIS is a complete mapping and analytics platform, which has been released by Environment Systems Research Institute (ESRI). Headquartered in Redlands, California, ESRI is the world’s largest provider of geographic information system technology. Python is an interpretive scripting language invented by the Dutch Guido van Rossum in 1989, and the first public offering was released in 1991. The SPSS Statistics is a powerful statistical software platform. And the SPSS was developed by three researchers from Stanford university in the United States in 1968, which headquartered in Chicago, and in 2009, it was acquired by IBM and renamed IBM SPSS Statistics. The ArcGIS has been used to map the results of bearing capacity and loading state. Our crawler to get the data of gas supply stations and dangerous points of interest (POIs) was created in Python. We used the SPSS software to conduct correlation analysis.

2.2. Pressure–State–Response Model

The pressure–state–response model was proposed by two statisticians in Canada in 1979 and has gradually developed into a framework for studying environmental issues [49]. This model reflects the causal relationship between human social activities and environment and composed of the pressure, state and response indices. Their relationship is shown in Figure 1. The pressure index reflects the impact of the bearing object on a carrier, such as the impact and influence of human social and economic activities on the environment. The state index reflects the state of a carrier at a certain time. The response indicator refers to measures taken by the government or individuals to mitigate, restore or prevent the negative impact of human activities on the environment. The stress–state–response model answers the three basic sustainable development questions of ‘what happened, why did it happen and how we will do’ from the perspective of causality. This model is widely used in the analysis and evaluation of carrying capacity. Yang [50] established the evaluation index system and grading standard of water-resource carrying capacity on the basis of the pressure–state–response model, as well as evaluated the water resource carrying capacity of the coastal areas in Liaoning Province. Wang [51] used the small towns in Xi’an as a research object, combined the features of the local natural environment and economic development level and used the pressure–state–response model to build an evaluation index system. The quantitative evaluation of the ecological security status of small towns reveals their geographic distribution and ecological security.
Response indices refer to the measures taken by the government or individuals to mitigate, restore or prevent the negative impact brought by a gas supply station to society and environment, which are quantified differently. Given this situation, the stress–state–response model has been adjusted to the pressure–state–capacity model (Figure 2). The pressure indicesindices indicate pressure brought by gas supply stations to society and the environment, which will weaken capacity or change the state of society. The state and capacity indices are selected from the point of carrying object, with the former indicating the state of society and the environment at a certain time and the latter demonstrating the urban capacity to bear gas supply stations. That is, the index will be selected from the point of carrying the subject and object.

2.3. Evaluation Index System

When selecting the evaluation indices, the principles of availability, comparability, representativeness and scientificity of data should be followed. Numerous factors can affect the urban bearing capacity to gas supply stations, including urban land resources, social economy, social demand, source of gas, potential risk, and environmental pollution.
The indices can be divided into three categories on the basis of the pressure–state–capacity model. Capacity and state indices are selected from the perspective of a carrier (city). By contrast, pressure index is selected from the point view of the object to be carried (i.e., gas supply station). Table 1 shows the evaluation index system.
Given that a city is an entire system, its supporting ability to the gas supply station is mainly reflected in four aspects: land resources, social economy, social demand and gas resource. In terms of land resources, the proportion of developable area is an important index, which reflects the space capacity to the gas supply station. The proportion of developable area refers to the ratio of the area that can be used for development in a city. According to the China Statistical Yearbook, natural gas is mainly used in secondary and tertiary industries [3]. Thus, the proportion of tertiary industry indicates the social need. Given that gas is a type of resource used in buildings, the density of buildings is another index that reflects social demand. Apart from home users, enterprise users are also a major force of gas users. Hence, the number of enterprise users is also an index indicating social need. Natural gas resource is an important factor that influences the establishment of gas supply station for its impact on construction cost.
State indices reflect the status of a city which including per capita construction land area, convenience of transportation, per capita GDP, increasing rate of GDP, coverage of pipeline gas and change rate of building density. Per capita construction land area relatively reflects the scale of urban development. The Code for Design of City Gas Engineering [47] indicates that fuel gas can be transported by pipeline, railway tank car, automobile tank car and tank ship. Vehicle tankers are widely used in all types of medium and small gas supply stations. Thus, the traffic condition should be considered when evaluating the locations of gas supply stations. Traffic convenience can be described by the density of road network within a region, thereby reflecting the degree of regional traffic development. Economic development will drive the development of urban infrastructure and per capita GDP. Meanwhile, the increasing rate of GDP is a frequently used indicator to describe the status of economic development. Per capita GDP indicates the regional economic level and the increasing rate of GDP reflects the speed of economic development. Generally, the supply scope of LNG and CNG stations should not exceed the red line of users. That is, users in the area covered by a pipeline gas should primarily choose pipeline gas. The higher the coverage of pipeline gas, the lower the demand of gas provided by the “point supply”. Moreover, gas is used in buildings, thereby making density and rate of density of buildings important indices that reflect social demand of gas. The source of gas is an important factor in the construction of gas supply stations in a city. Accordingly, the number of upstream gas receiving stations reflects the adequacy of gas sources.
The pressure indices indicate the pressure brought by the construction of gas supply stations. The Code for Design of City Gas Engineering [47] stipulates that the construction of gas supply stations should be distant from densely populated areas. Meanwhile, the Code for Fire Prevention Design of Buildings [48] stipulates the safety distance between a gas supply station and important buildings and structures, such as chemical plants, gas stations, gasoline stations and other similarly hazardous facilities. Therefore, the pressure indices include the density of the population, gas supply station and dangerous POI (point of interest) (e.g., chemical plants, gas stations, gasoline stations) and pollution emissions of gas supply stations.

2.4. Modelling Process

The comprehensive bearing capacity of each country to gas supply station is obtained on the basis of comprehensive consideration of various factors (see Table 1). Such a bearing capacity can be expressed as a linear function and the calculation method of weight will be introduced in Section 2.4.
BC = S i j × W i
where S i j is standardised index, and W i is the weight of the index.
The pressure–state–capacity model demonstrates the causal relationship between city and gas supply station. Pressure brought by gas supply stations influences or weakens urban capacity and state. Urban capacity and the state support the development of gas supply stations. We used the ratio between them and pressure indices to reflect the current loading state of a region to a gas supply station and can be expressed as the following function:
LS = ( S i j W i + S k j W k ) / S r j W r
where S i j , S k j and S r j are standardised capacity, state and pressure indices, and W i , W k and W r are the corresponding weight of the three kinds of indices. When LS = 1, the load state of an area is currently appropriate for the supporting capacity is equal to the pressure; LS < 1 means low load state and LS > 1 means overload state.
On the city scale, urban bearing capacity and loading state are obtained by the cask principle. The cask principle indicates that the capacity of a cask, which is composed of different lengths of wood, is determined by the shortest (not the longest) board. Similarly, a city is also composed of various districts and counties. When a city is compared to a wooden barrel, regions within are different lengths of wooden boards. Thus, the bearing capacity of a city to the gas supply station is determined by the region with the lowest bearing capacity. Thereafter, the comprehensive carrying capacity of a city can be described as follows:
B C O C i = M i n { B C i 1 , B C i 2 , , B C i j }
where i is the number of city, j is the number of districts or countries in a city, and B C i j is the bearing capacity of the jth district in the ith city.
Similarly, the load state of a city to gas supply station is determined by the region with the worst load state, which can be described as follows:
L S O C i = M a x { L C i 1 , L C i 2 , , L C i j }
where the meaning of i and j is as same as that in formula (3), and L S i j is the loading state of the jth district in the ith city.

2.5. Weight Calculation

The different units, dimensions and orders of magnitude of indicators cause inconvenience for data analysis and may affect the evaluation results. To eliminate the influence of dimensional units, all indices will be unified into dimensionless, standardised indices by certain processing methods before comprehensive evaluation. The minimum–maximum method, which is the most commonly used standardisation method, is adopted for standardisation in this study. When the indicator is positive, it can be unified according to Formula (5). When the indicator is negative, it can be calculated according to Formula (6).
S i j = ( R i j m i n R i j ) / ( m a x R i j m i n R i j )
S i j = ( m a x R i j R i j ) / ( m a x R i j m i n R i j )
where S i j is the standardised index, R i j is the original value of the index, max R i j is the maximum value of the index R i j , and min R i j is the minimum value of the index R i j .
The entropy weight method objectively determines the weight according to the index variability. The smaller the information entropy (IE) of an indicator, the greater its variation degree. The more information it can provide and the greater its role in the comprehensive evaluation, the greater its weight should be. IE of a group of data is as follows:
I E i = ln ( n ) 1 j = 1 n P i j ln ( P i j )
P i j = S i j / i = 1 n S i j
where n means the number of data, S i j means the standardized index. And if P i j = 0 , then define lim P i j 0 P i j ln ( P i j ) = 0 .
After calculating the information entropy of indicators, the weight of each is as follows:
W k = ( 1 I E k ) / ( m i = 1 m I E i )

3. Case Study

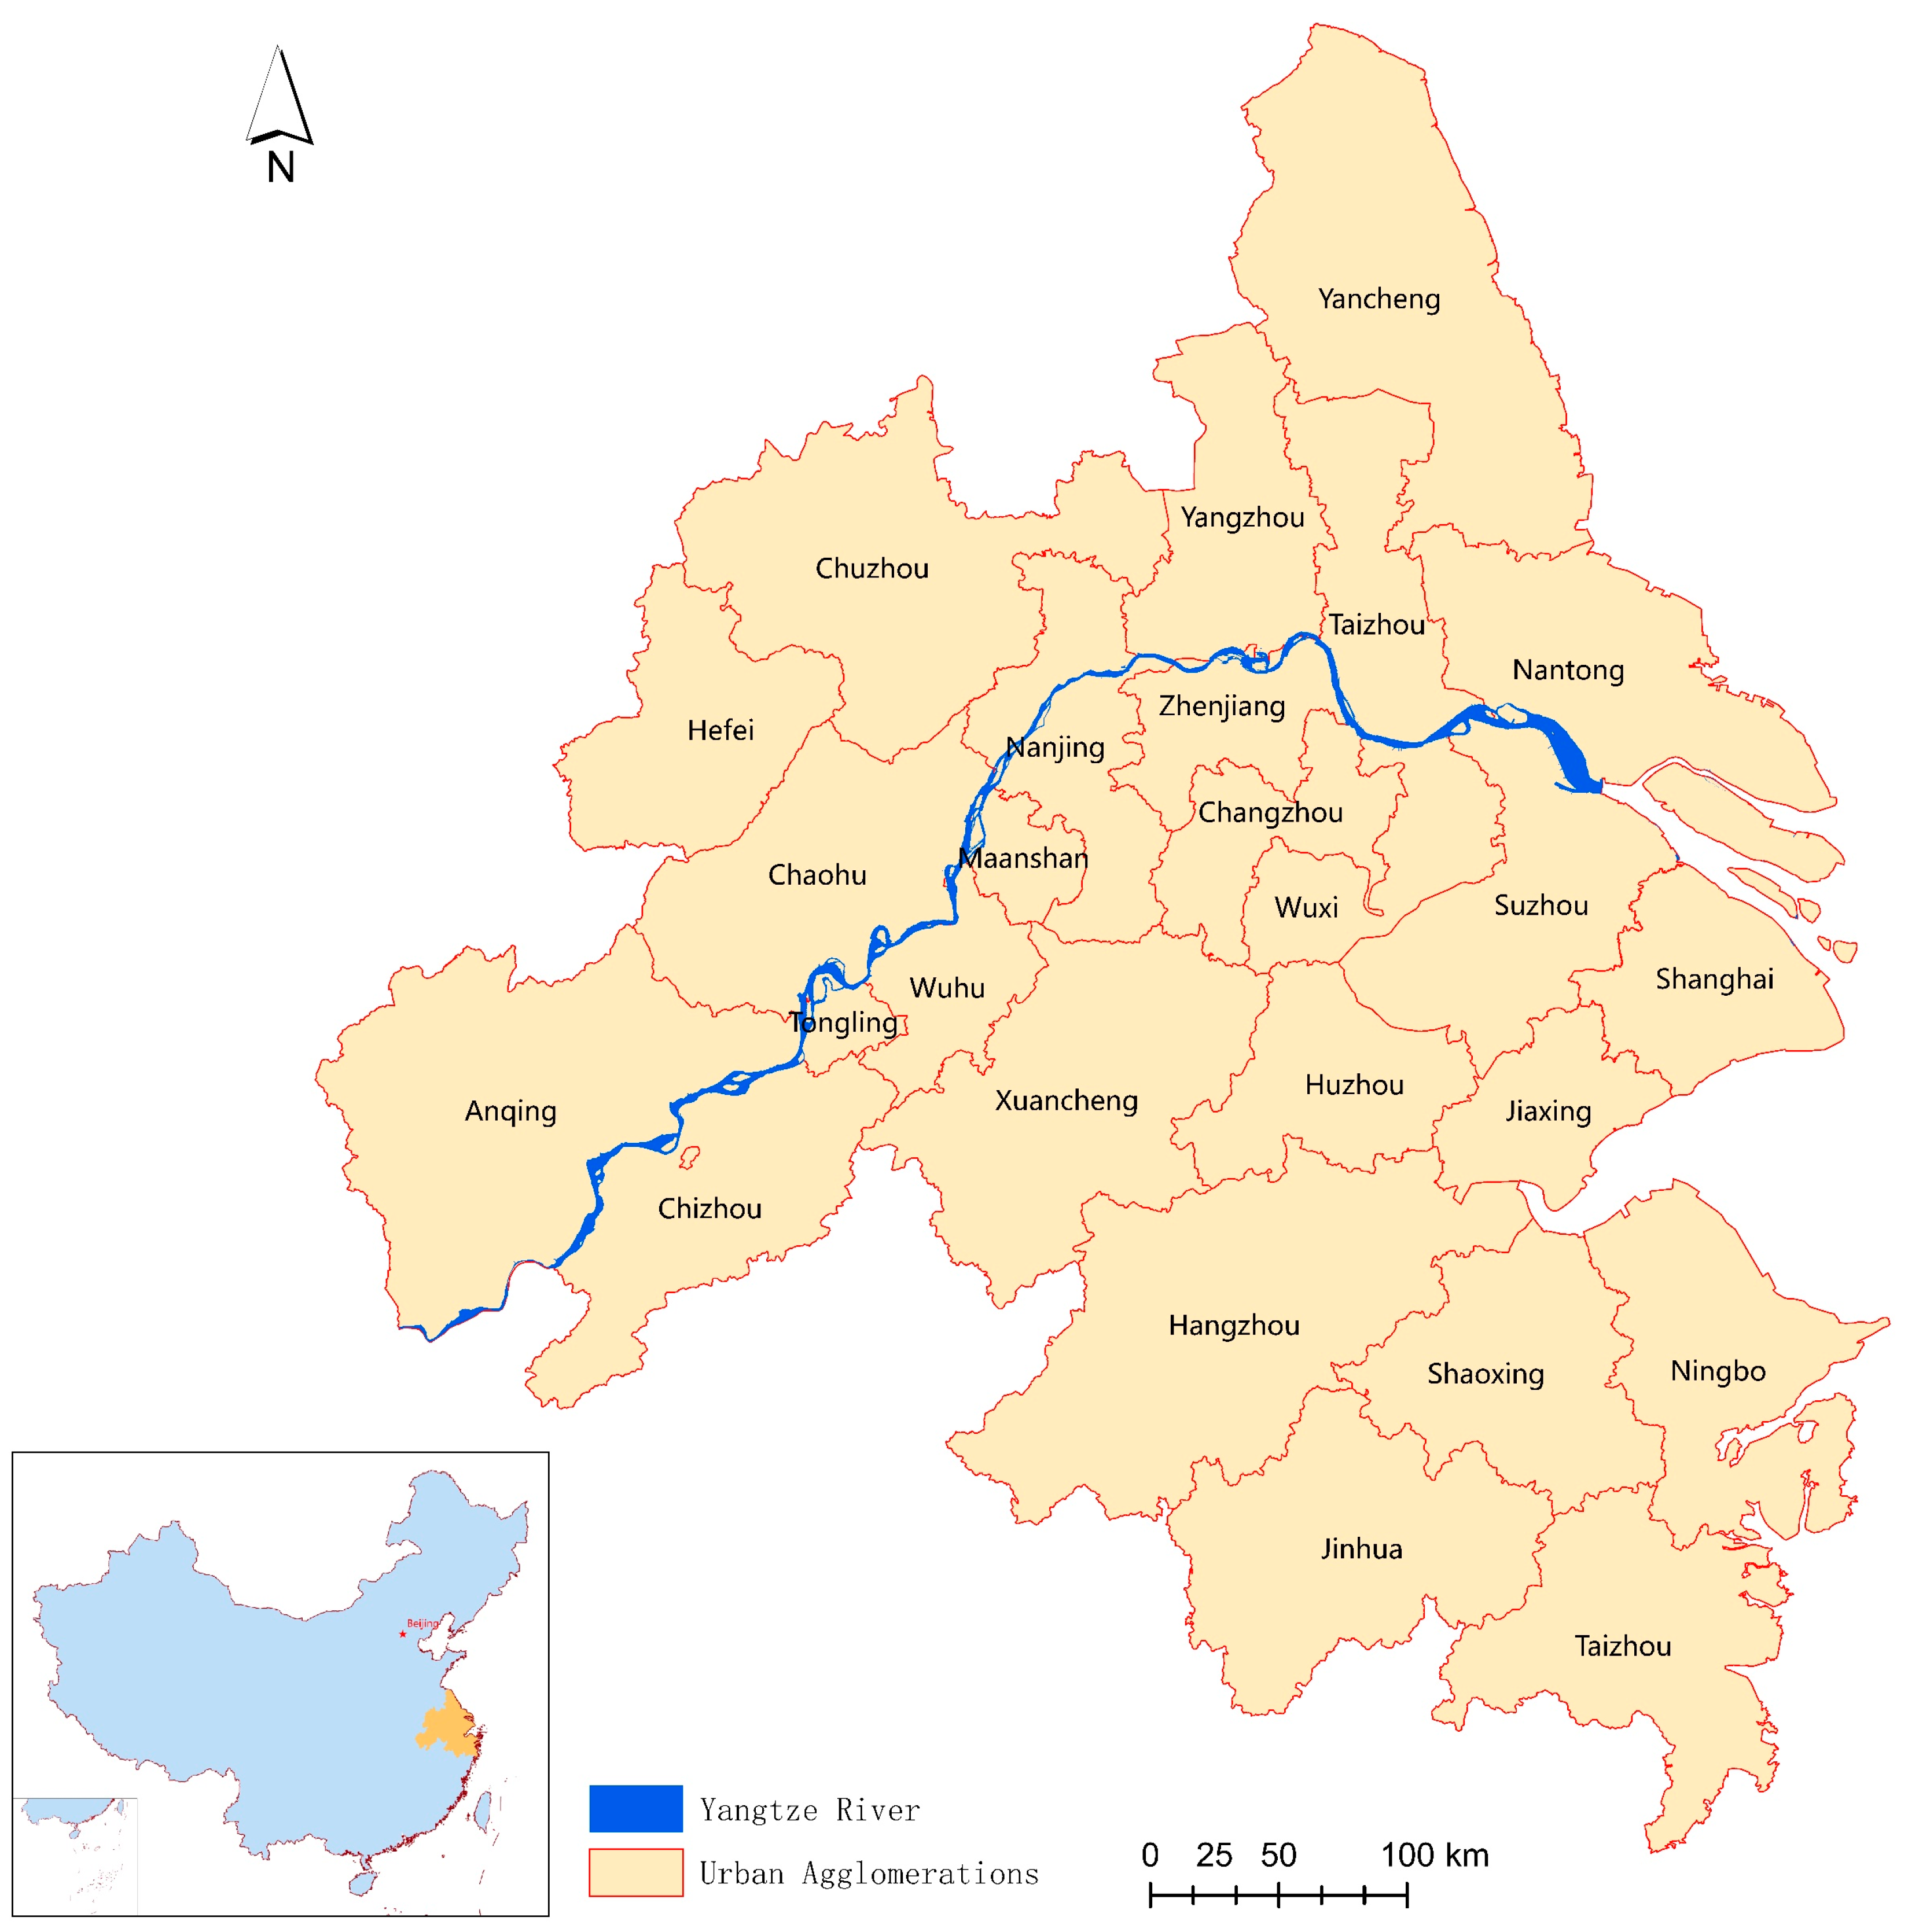
3.1. Region and Data

Urban agglomerations in the Yangtze River Delta, near the Yellow Sea and East Sea, are on an alluvial plain formed before the Yangtze River enters the sea. This area covers Shanghai and some cities in Jiangsu, Zhejiang and Anhui provinces (see location and scope in Figure 3). The area of the region is 21,1700 km2, which accounts for 2.2% of China’s land area. The total population reached 151.89 million in 2017, which comprises 10.93% of the country’s total population. The Yangtze River Delta is also an important intersection of the ‘One Belt and One Road’ and Yangtze River Economic Belt. Accordingly, this region plays an important role in China’s overall modernisation construction as a crucial platform of international competition, an important engine of economic and social development and the leader of the Yangtze River Economic Belt.
The data used in this experiment mainly includes geospatial data, socioeconomic data and gas supply station location data. The first was extracted from the geographic monitoring database of the Yangtze River Delta in 2017, and socioeconomic data were derived from the statistical yearbook or the bulletin of national economic development of urban agglomerations in the Yangtze River Delta in 2017. The crawler method was used to obtain the location of gas supply station on the Baidu map, and its spatial distribution status is shown in Figure 4. It is obvious that gas supply stations are distributing around the Yangtze River, and show a trend of urban agglomeration and rural expansion.

3.2. Results

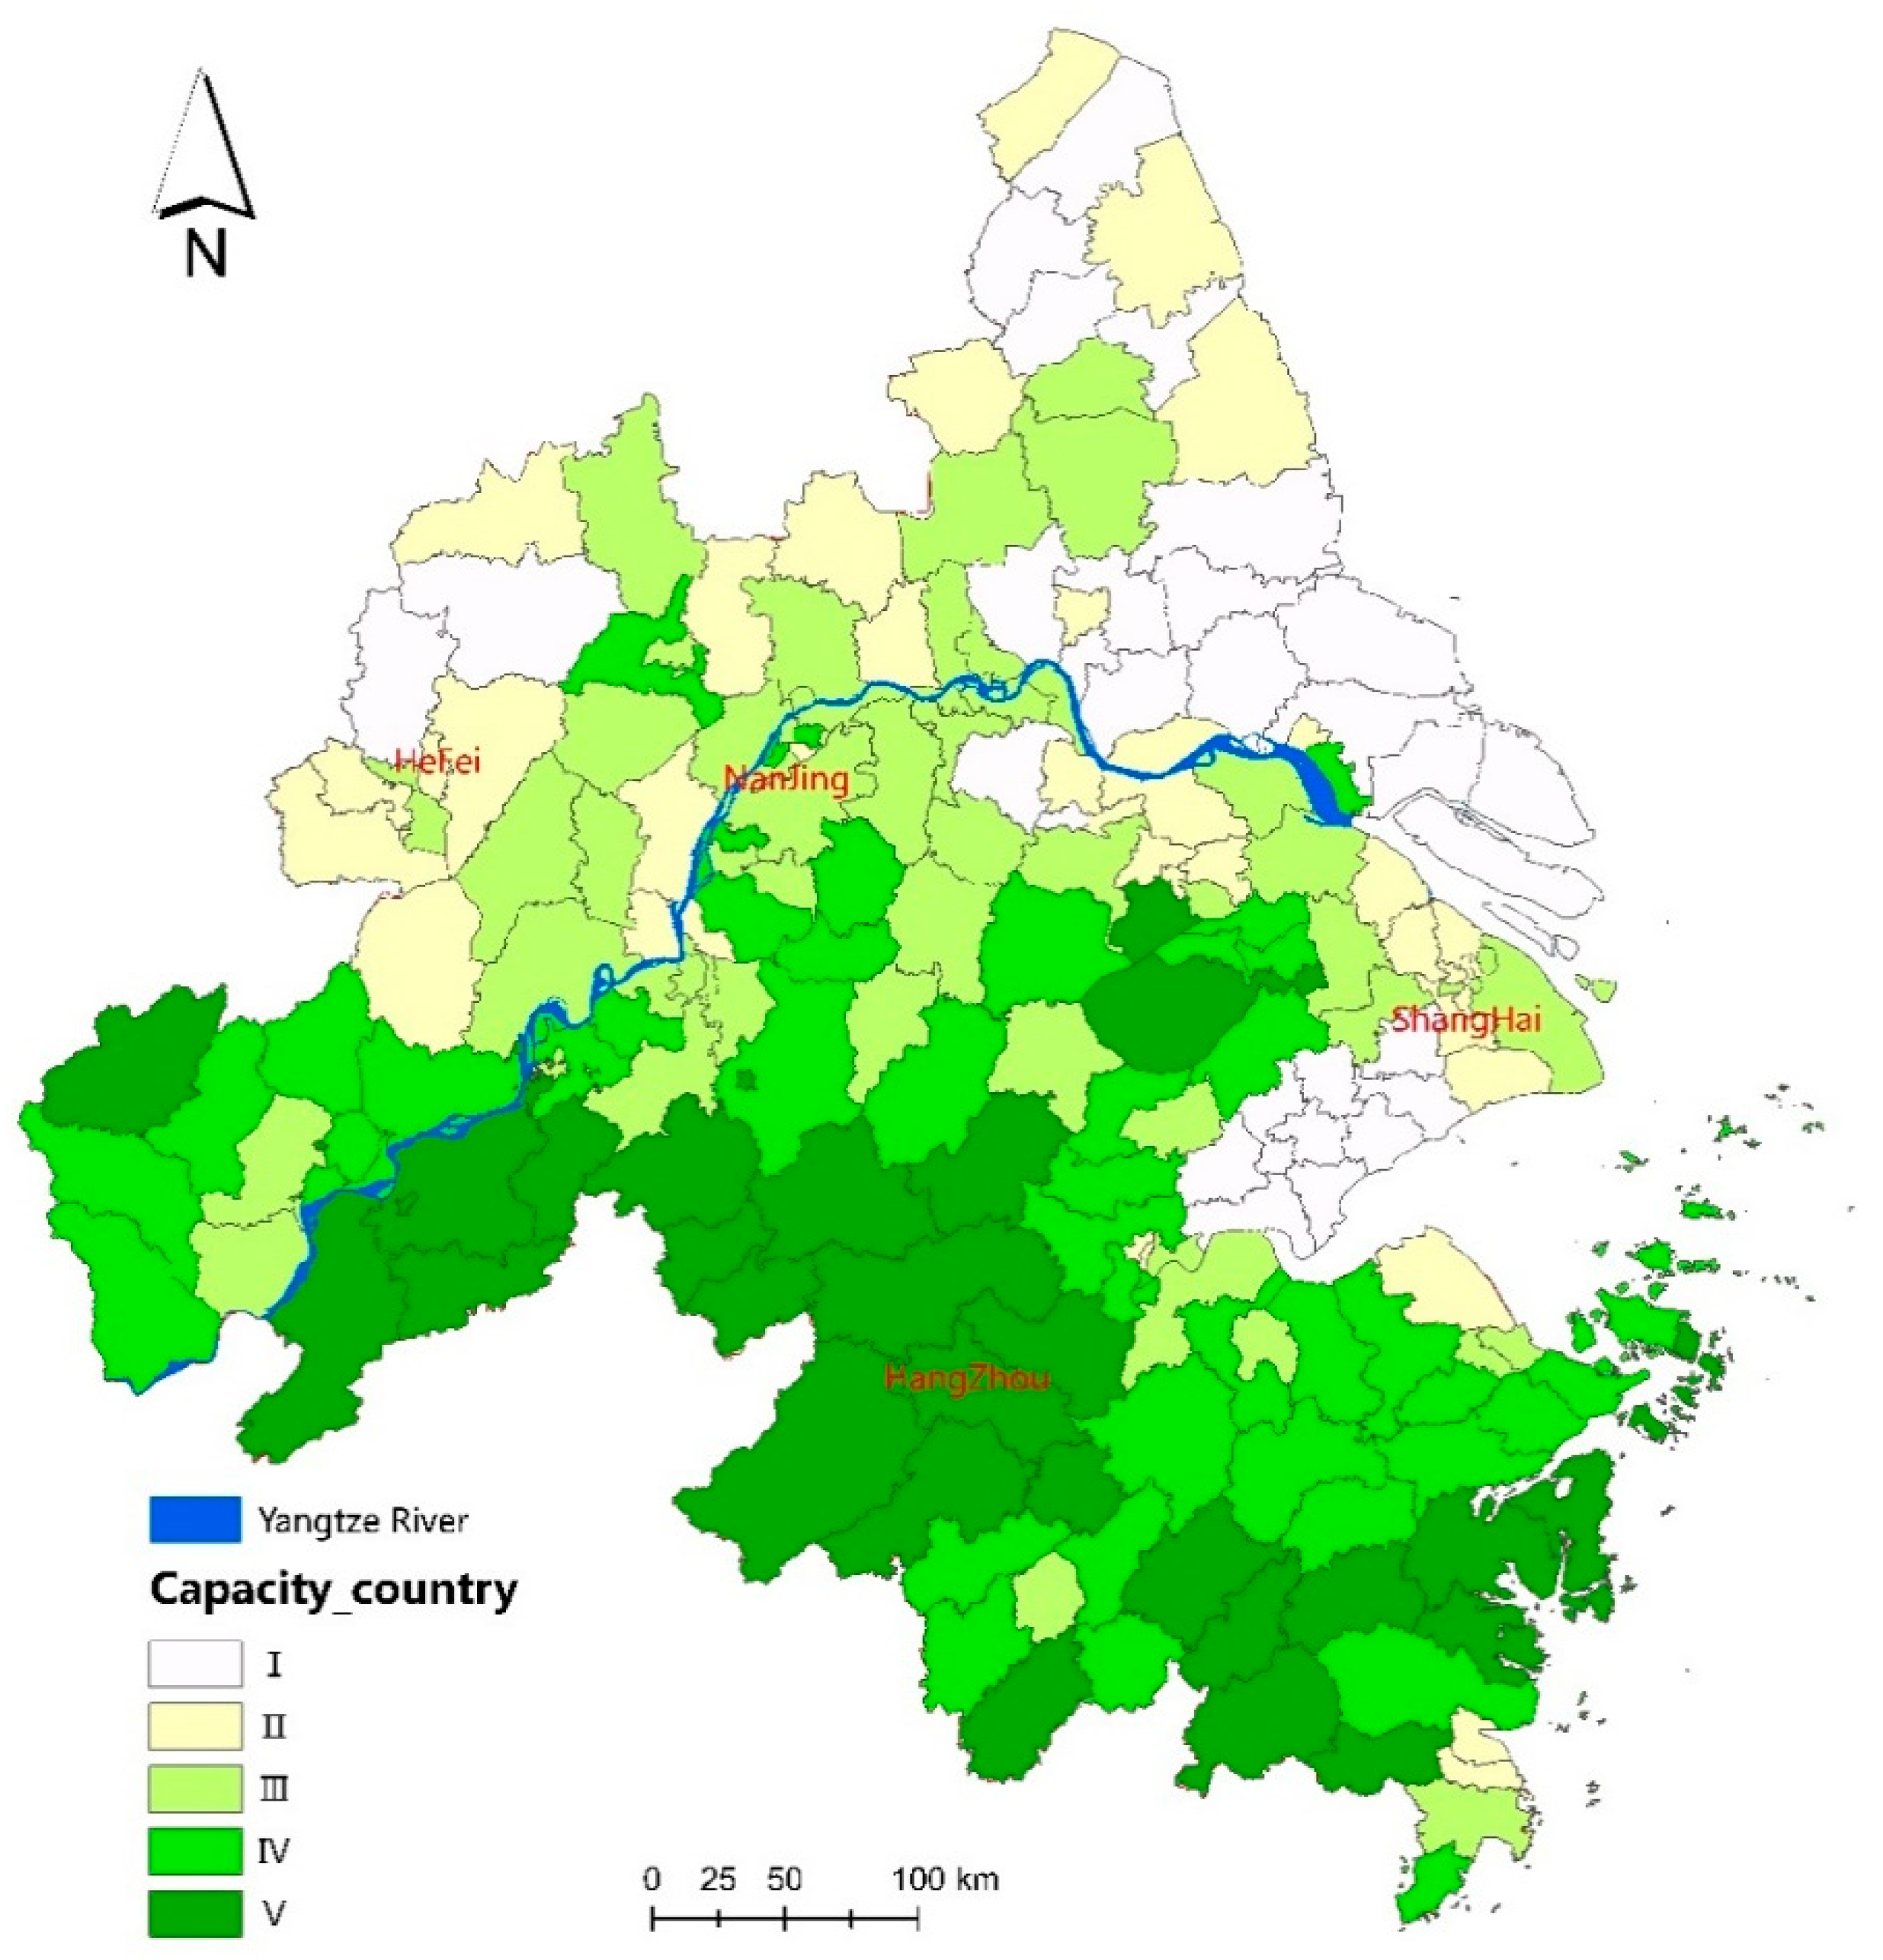
3.2.1. Country Scale
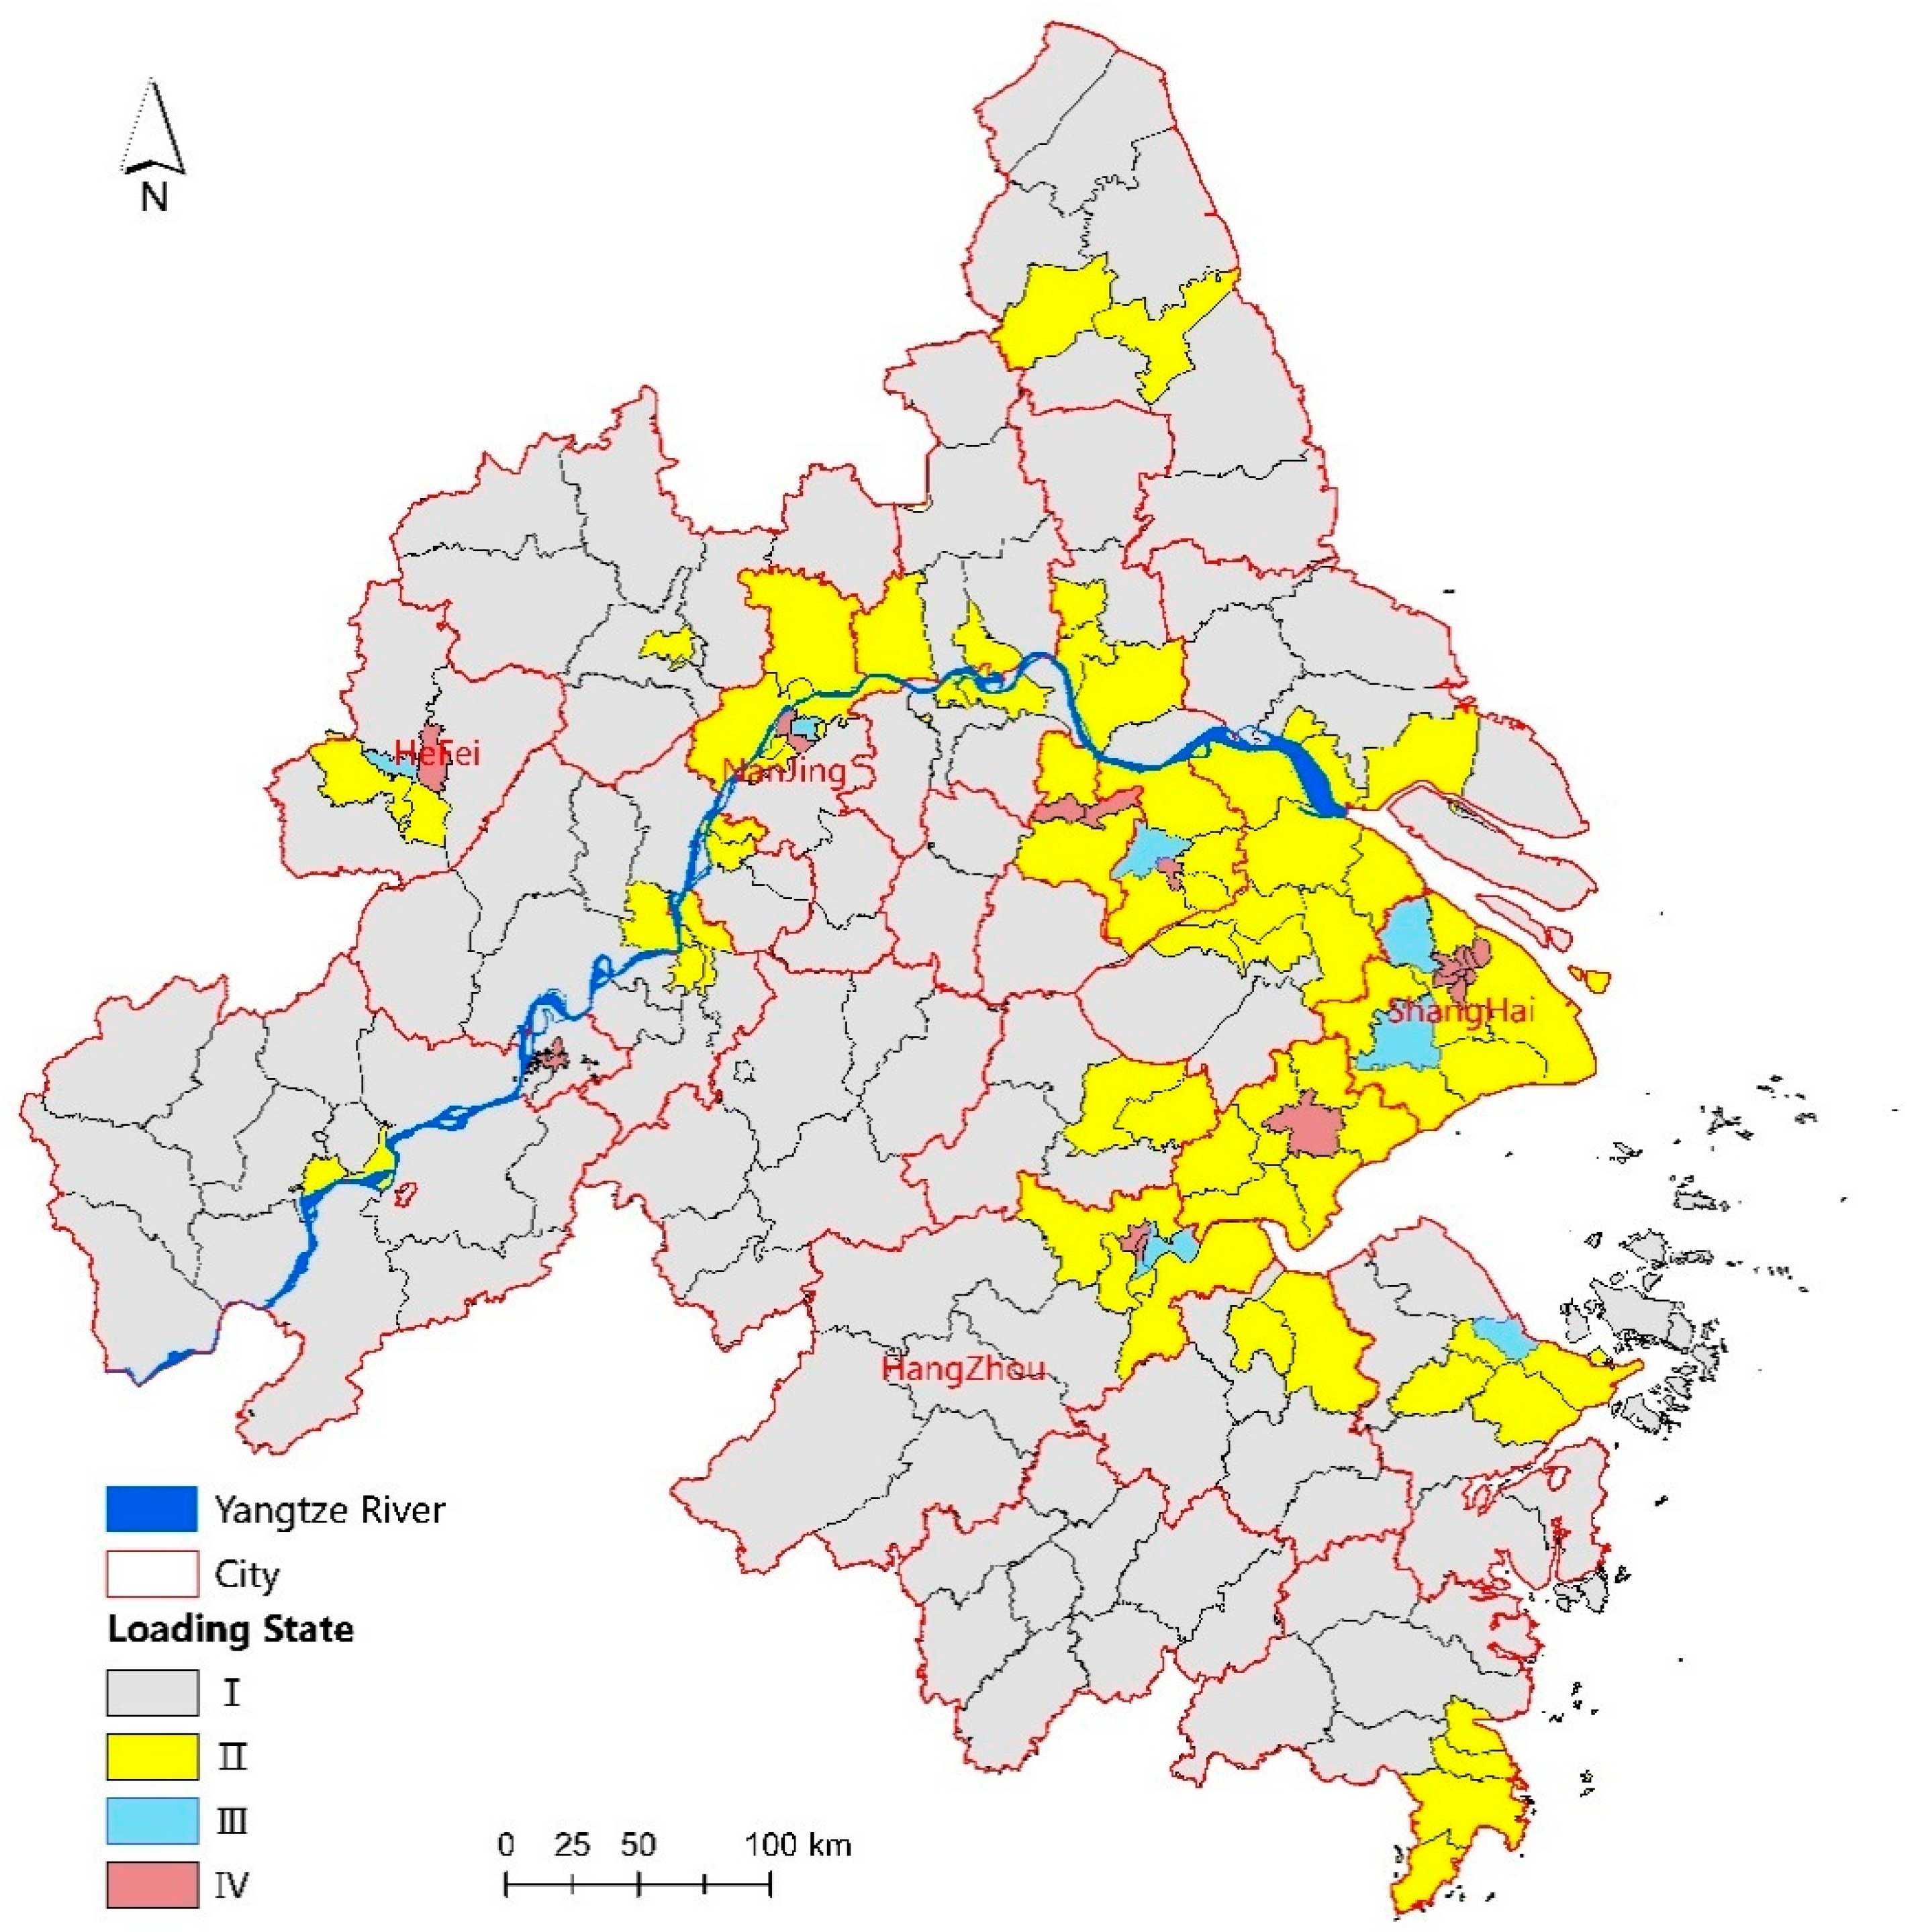
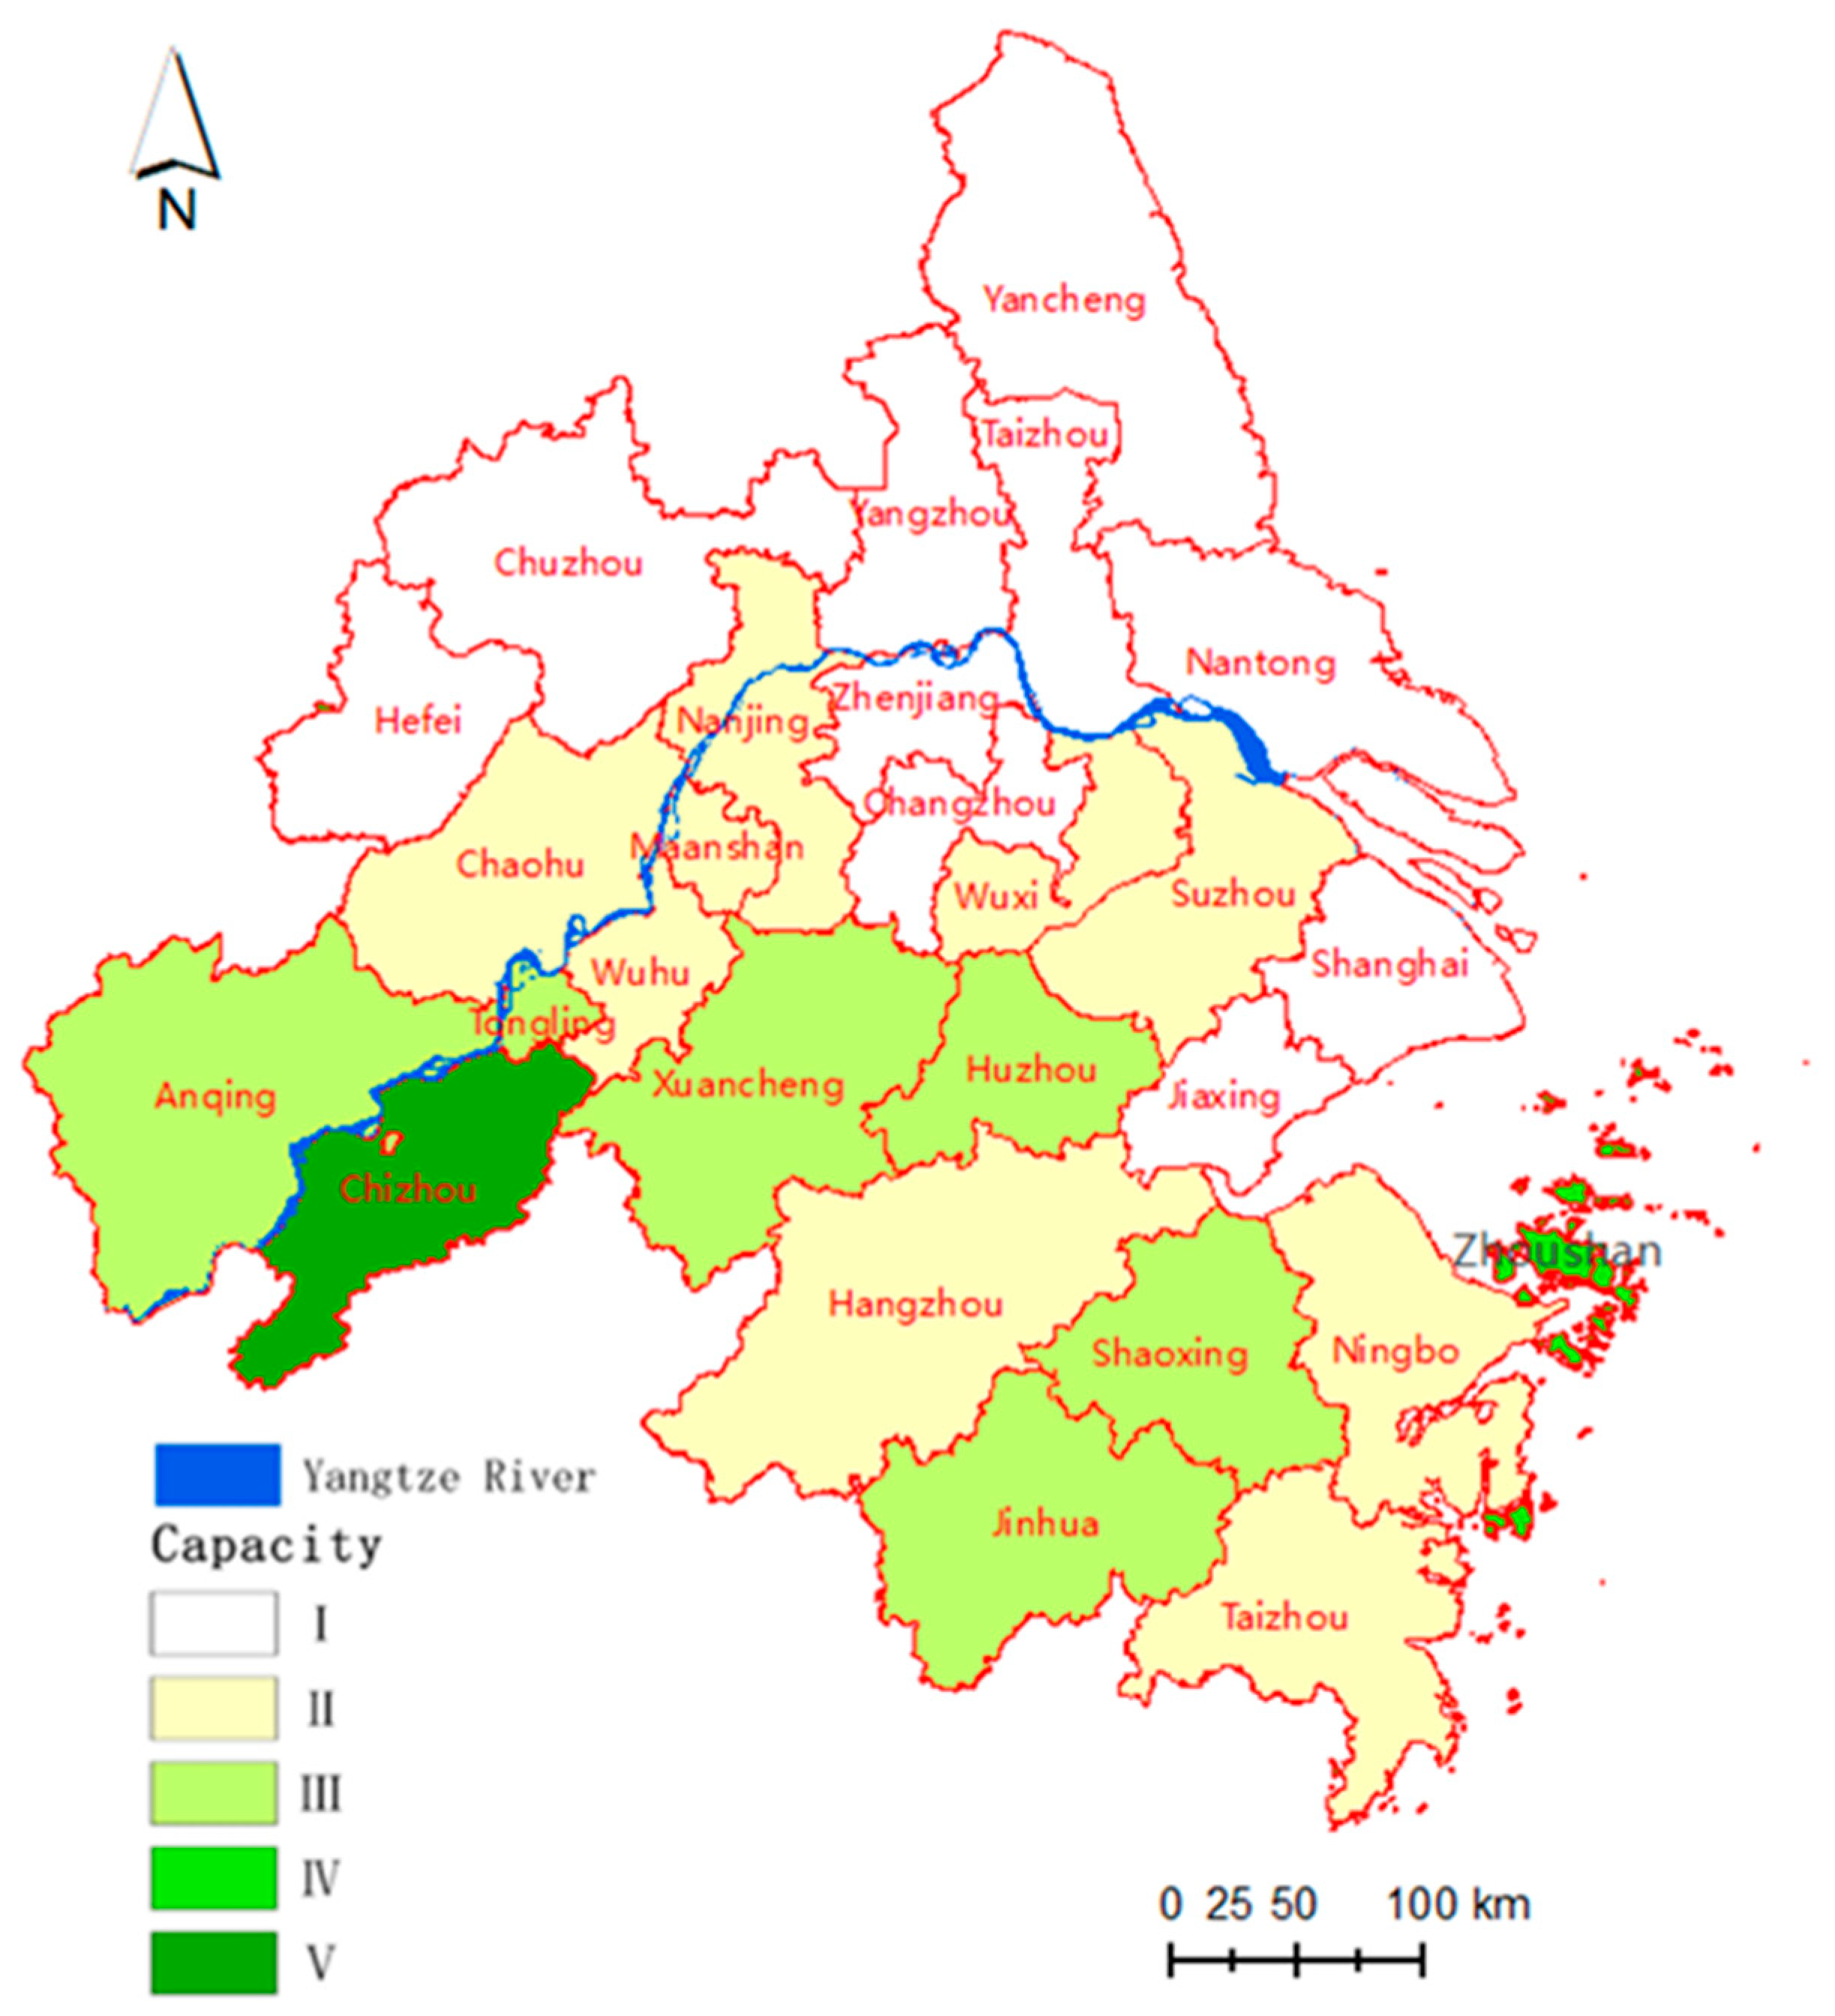
On the country scale, 203 districts were found in urban agglomerations in the Yangtze River Delta and their bearing capacity and loading sate are measured using the current methodology. After calculating the value of the indices in Table 1 by the experimental data, we standardised them using formulas (5) and (6) according to their properties. Thereafter, the weight of the indices can be obtained using formulas (7) to (9) and is shown in Table 2.
• High in the south, low in the north
According to the bearing capacity function (Formula (1)), the bearing capacity of the 203 districts has been obtained, which is expressed as index BC. The results are divided into five grades according to the range of index BC (Table 3), which is presented as Figure 5.
Evidently, the grades of bearing capacity are nearly divided by the Yangtze River. Moreover, the results of grade present a spatial pattern of ‘high in the south and low in the north’. That is, areas south of the line are in relatively higher bearing capacity grade than those in the north. The majority of the regions south of the Yangtze River are in Grade III or above. Meanwhile, all areas with a grade of V are located in the region, except for Yuexi country in Anhui Province. That is, the bearing capacity is medium or above in the majority of the districts south of the Yangtze River. Meanwhile, the majority of the northern areas are in Grade I or II, which means the bearing capacity is low.
Statistics on the bearing capacity grades of all the 203 districts have been provided, which is shown in Table 4. The statistical results indicate that 29 of the 203 districts are with low bearing capacity (Grade I), 39 with medium–low bearing capacity (Grade II), 56 with medium bearing capacity (Grade III), 50 with medium–high bearing capacity (Grade IV), and 29 with high bearing capacity (Grade V). A total of 17 districts in Jiangsu Province have low bearing capacity, which accounts for 58.6% of the total districts with this type of capacity. The highest grade of districts in Shanghai, which is the core of the Yangtze River Delta urban agglomerations, is Grade III. The highest grade in Jiangsu Province is Grade V and the grade with the highest number is Grade III. A total of 25 districts in Zhejiang Province is in Grade IV, which is the highest proportion, and the highest grade is Grade V. Additionally, regions in Anhui Province are in Grade II or above and the highest grade is Grade V.
• Distribution along Yangtze river
The loading state of the 203 districts has been assessed according to Formula (2) and the result is expressed as index LS. The range of index LS (see Table 5) is the reference for the classification of the loading state. Theoretically, LS = 1 means a suitable loading state. Given that errors are inevitable in the calculation process, the range of S is adjusted to (0.9, 1.1). The ideal loading state means the gas supply stations in the region can meet the need and will not affect the sustainable development of society. When LS ≤ 0.9, the region’s support capacity for the gas supply station exceeds the pressure it brings. That is, the number of gas supply stations has not exceeded the region’s capacity. When the value of the index LS ≥ 1.1, the number of gas supply station exceeds the bearing capacity and will cast a negative impact on the development of society if no effective measures is implemented. Figure 6 shows that the majority of the 203 districts in the study region remain in a state of low load. Moreover, the majority of the districts in Grades II, III and IV distribute along the Yangtze River. Overloading likewise occurs in various districts in Shanghai, Nanjing, Hefei, Tongling, Changzhou, Wuxi, Jiaxing and Hangzhou, which are economically developed. The spatial distribution of the loading state presents evident heterogeneity. Furthermore, the three states of low, adequate and overload may even coexist in a same city.

3.2.2. City Scale

On the city scale, 26 cities are located in the urban agglomerations in the Yangtze River Delta. The bearing capacity of each city can be feasibly calculated using Formula (3) when the bearing capacity of subdistricts has been determined. That is, the bearing capacity of a city is equal to the subdistricts’ minimum bearing capacity. Table 6 shows the results of the 23 cities. Figure 7 exhibits the results according to grade. Evidently, the spatial patterns of south high and north low are shown. The grades of urban bearing capacity are concentrated in Grades I, II and III. The bearing capacity of Chizhou, a city in Anhui Province, is in the highest grade (i.e., Grade V).
Similarly, the loading state of cities is determined by that of its subdistricts and can be calculated using Formula (4). Table 6 shows the results. Figure 8 provides the visualisation. A total of 6 cities are in a state of low load, 11 cities in a state of medium–low load, only 1 city is in a state of suitable load and 8 cities in a state of overloading. Hefei, Nanjing, Changzhou, Wuxi, Tongling, Hangzhou, Jiaxing and Shanghai are in a state of overload. Accordingly, gas supply stations should not be built in these areas in the future. Only Ningbo, a city in Zhejiang Province, is in a state of suitable load. Hence, the number of gas supply stations in the region is ideal, can meet the social demand and will not affect the sustainable development of society. The cities in a state of low or medium–low load can increase the number of gas supply stations if needed.
The bearing capacity and loading state indicate an obvious spatial difference and aggregation pattern. On a county scale, the bearing capacity grades of 203 subdistricts vary from county to county but present a trend of high in the south and low in the north, which is almost bounded by the Yangtze River. The loading state grades of the 203 subdistricts are almost in grade I and distributed in the south and north of the Yangtze River. This result indicates that the current state is low and will not affect the sustainability of the society. The loading state grades above grade I show an obvious distribution along the Yangtze River, and the overloading and suitable states occur in different counties in Shanghai, Nanjing, Hefei, Tongling, Changzhou, Wuxi, Jiaxing and Hangzhou, which are economically developed cities.
The bearing capacity on a city scale shows the same spatial distribution pattern as that on a country scale, that is, high in the south and low in the north. Of the total number of cities, 10 are in grade I, 8 are in grade II, 6 are in grade III, one is in grade IV (Zhoushan), and one is in grade V (Chizhou). In terms of spatial distribution, most of the cities in grade II or above are distributed in the southern part of the Yangtze River, and cities in grade I are concentrated in the northern part. The loading state grades show a scattered distribution, which is different from the results on a county scale. The number and spatial distribution of cities in grades I, II and IV are more balanced than those on a county scale. Only Ningbo is in a suitable state, which is an ideal state for society. Hefei, Nanjing, Changzhou, Wuxi, Tongling, Hangzhou, Jiaxing and Shanghai are in overloaded states. Shaoxing, Jinhua, Zhoushan, Chuzhou, Chizhou and Xuancheng are in a low-load state. In addition, other cities are in a medium load state.

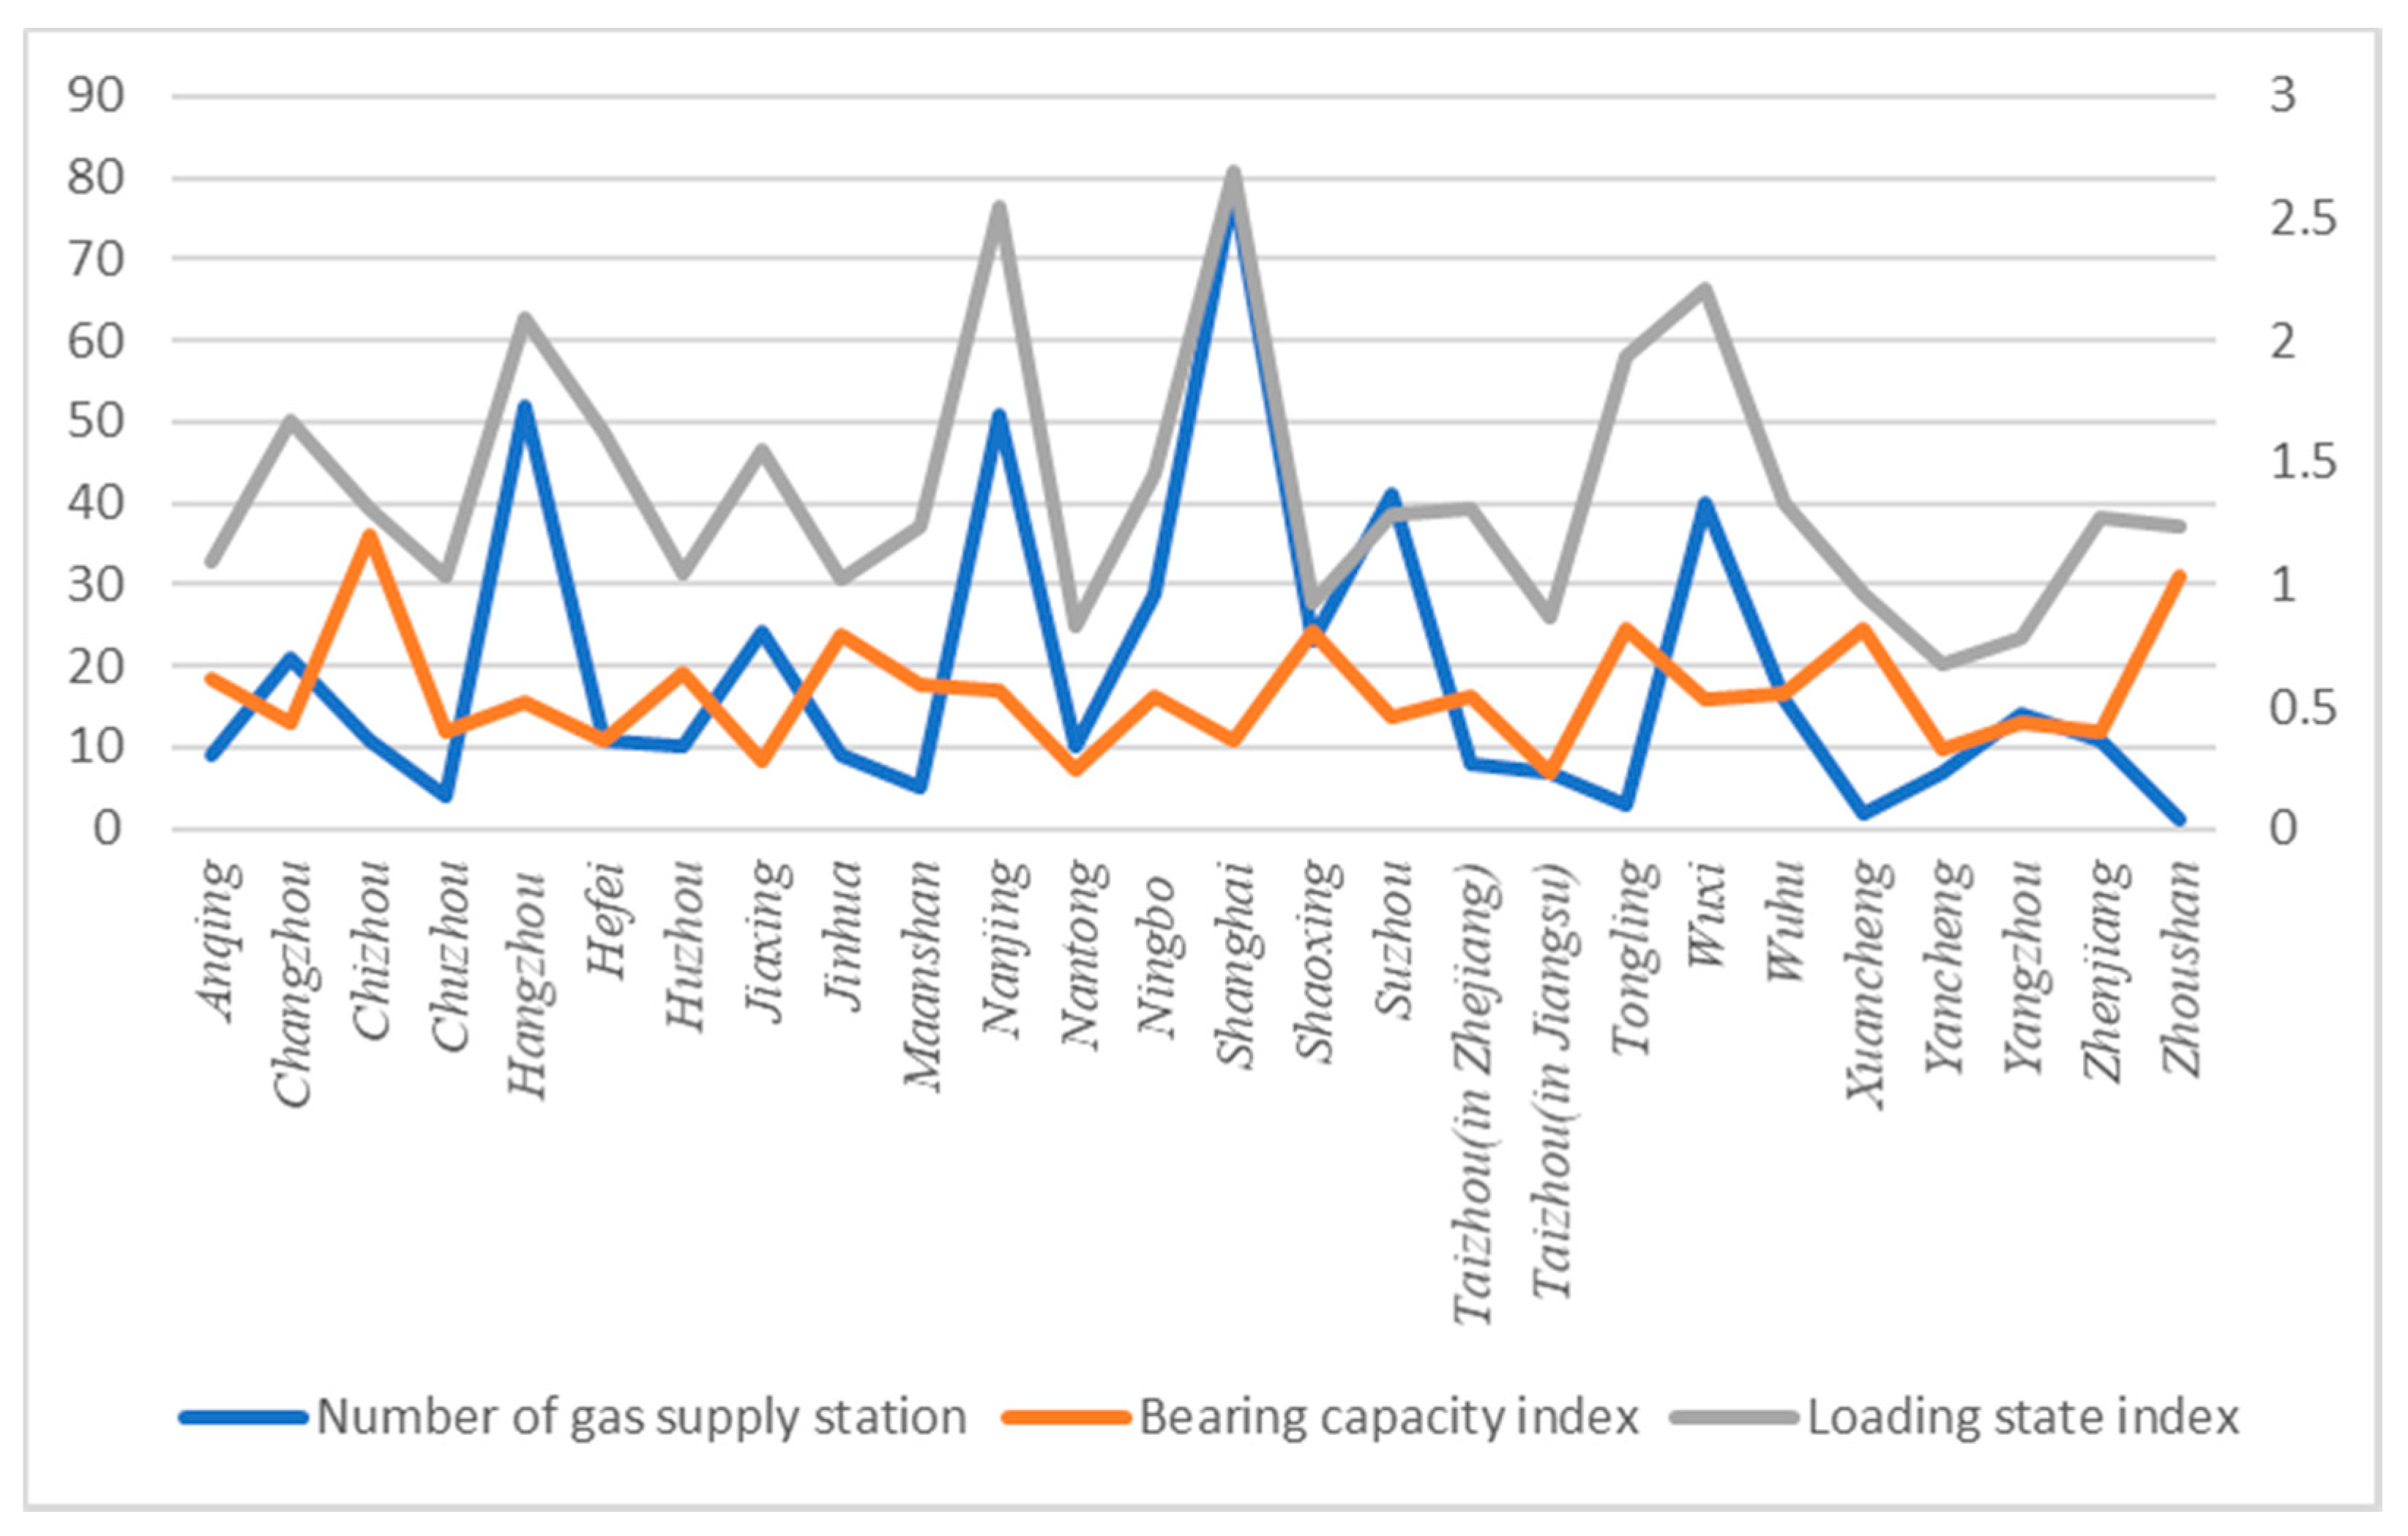
3.3. Correlation Analysis

The results of bearing capacity and loading state show a significant pattern, which is described in Section 3.2. The bearing capacity, loading state and number of gas supply stations are chosen to calculate their Pearson correlation coefficients in SPSS and to analyse the relationship between the results and the current state of gas supply stations. The three indices are shown in Figure 9. A significant similar trend is observed between the curves of number of gas supply stations and loading states, whereas a different trend is found between bearing capacity and loading state. Their correlation coefficients are presented in Table 7. The correlation coefficient between the number of gas supply stations and the loading state is 0.794, which indicates that their relationship is very significant (p < 0.01) and positive. That is, the larger the number of gas supply stations, the higher the possibility of being overloaded. This finding is consistent with our perception of the actual situation. The correlation coefficient between bearing capacity and loading state is −0.433, which implies that they are negatively but not strongly correlated (p < 0.05). Therefore, in some areas, the higher the bearing capacity, the lower the loading state. Their difference reflects the potential bearing capacity to some extent. The number of gas supply stations and urban bearing capacity show a vague relationship because their Pearson correlation coefficient is −0.241, which indicates a non-significant relationship.

4. Discussion

This paper has proposed a method based on the pressure–state–capacity model and the cask principle to evaluate the urban bearing capacity and loading state of gas supply stations. The pressure–state–capacity model is adjusted from the pressure–state–response model, which is an index selection model often used in carrying capacity research, to consider a particular research object for selecting the indices of bearing capacity. The functions of bearing capacity and loading state on a county scale are constructed with the selected indices and their weight. According to the cask principle, we can find the vulnerable areas of cities, which provides the direction for improvement. The methodology proposed is suitable for evaluating the bearing capacity and loading state of areas where natural gas is the main energy source for residents’ cooking and heating or rural areas and other places where natural gas is being promoted. However, the research process has some deficiencies.
The bearing capacity and loading state of gas supply stations are evaluated in a short term and cannot reflect their dynamic modification processes because of difficulties in collecting data. If more years of data can be collected, the trend of their changes can be analysed, and this trend is of great value. No consensus on the selection of bearing capacity evaluation indices has been reached, and the lack of it is another limitation of our research. A pressure–state–capacity model, which is adjusted from a pressure–state–response model, a widely used model to select indices, is used to construct the evaluation index system. The selected indices are universally applicable. If the study area has obvious regional characteristics, some corresponding evaluation indices can be added according to actual situations. Therefore, the method we proposed may be beneficial to readers or stakeholders in different regions with the same degree of gasification or energy market challenges. Measures on how to build a more scientific and comprehensive evaluation index system should be strengthened in future research and addressed in studies on carrying capacity. Evaluating the urban bearing capacity of gas supply stations is a complicated process, so data availability, scientific method and other factors are comprehensively considered in this study. Based on these data, evaluation models are established on county and city scales.

5. Conclusions

This research illustrates and analyses many factors influencing urban bearing capacity of gas supply stations, which is an important facility for residents’ quality of life. The current study extends the few related studies that have been conducted. The pressure–state–response model has been adjusted to the pressure–state–capacity, which is the criteria of evaluation indicator selection model, according to the research object’s characteristics. Additionally, the cask principle has been used to model urban bearing capacity on the city and country scales.
On a country scale, 203 districts were considered and the bearing capacity grade presents a pattern of ‘high in the south, low in the north’. That is, the bearing capacity of areas south of the Yangtze River is higher than that of areas north of the river. The majority of the 203 districts have a medium bearing capacity. Meanwhile, the loading state of the 203 districts is concentrated in a state of low load. Districts in a state of medium, suitable and overload are distributed along the Yangtze River, which is similar to the distribution pattern of gas supply stations.
On a city scale, 26 cities were included in the study area. The results of the urban bearing capacity also present the spatial pattern of south high and north low. The majority of the areas north of the Yangtze River have a low bearing capacity of gas supply stations. Only the city of Chizhou has high bearing capacity. The overload states are located in Hefei, Nanjing, Changzhou, Wuxi, Tongling, Hangzhou, Jiaxing and Shanghai. Evidently, the construction of gas supply stations is unsuitable in these areas. Only Ningbo is in an ideal state, which means that it is suitable for social sustainable development. The areas in a state of low or medium load can increase the number of gas supply station if needed.
We analyzed the correlation relationship of the number of gas supply stations, bearing capacity and loading state on a city scale. The number of gas supply stations and loading state show a significant and positive relationship (p < 0.01). The bearing capacity and loading state present a less significant and negative relationship, and the relationship between the number of gas supply stations is vague.
The results of both the bearing capacity and loading state indicate an imbalance in infrastructure construction in the urban agglomeration are in the Yangtze River Delta. The former reflects the various capacities of bearing gas supply station in different regions which incarnates geographic diversity, and the latter indicates the current state of loading. On the basis of research results, we propose some suggestions for policy makers and gas distribution companies:
(1)
The construction of gas supply stations should be strictly controlled. Gas supply stations are a kind of important infrastructure to ensure residents’ life equality, determine whether their layout is reasonable or not and whether it is related to the balance of gas supply and demand, describe the utilisation of gas resources and evaluate the safety of residents. The construction of gas supply stations should be controlled carefully because the Yangtze River Delta is a region with rapid economic development and a dense population. In creating related policies, the bearing capacity, land-use status, economic development, population and other factors should be considered. According to the results of bearing capacity and loading state, the construction of gas supply stations should be prohibited in areas in a state of overload and increase the number of gas supply stations in regions in a state of low or medium load if needed. For long-term sustainable development, the places in a suitable state should be kept.
(2)
The construction of gas supply stations should be sped up to make up for shortfalls. The cask principle helps find the shortfalls of the bearing capacity and loading state of 203 districts. Policy makers should focus on the shortage of cities and adopt responsive measures to improve the bearing capacity and loading state. The issues of construction standards of gas supply stations and the regulation of the development of gas enterprises are the main directions of policy makers. These directions will benefit the sustainable development of society.
(3)
Enterprise management should be strengthened, and a reasonable investment construction plan should be formulated. Gas enterprises need to cooperate with relevant policies to ensure the rapid and sound development of the Chinese gas industry and promote the use of natural gas energy.
This study proposed a method to evaluate the urban bearing capacity and urban loading state of gas supply stations. This process was a small step in this field, and further studies are needed. Although studies on the bearing capacity and research objects have been conducted, few studies have evaluated the urban bearing capacity of gas supply stations. No consensus on the selection of bearing capacity evaluation indices has been reached, and no mature system of quantitative methods has been established. As a consequence, the lack of consensus and mature systems will cause some differences in the evaluation of the bearing capacity by different scholars. In future, in-depth research on the carrying capacity of urban gas supply stations should be conducted, and more accurate and scientific evaluation results should be provided for policy makers and gas distribution companies. Many methods used to evaluate bearing capacity are regional and specific, and a universal model, which is the direction of efforts in the scientific community, is important.

Author Contributions

Conceptualization, P.Z. and J.W.; Formal analysis X.T.; Methodology, X.T., P.Z., J.W. and J.H.; Writing-Original Draft Preparation, X.T.; Writing-Review and Editing, P.Z. and J.W.; Project Administration, J.H.

Funding

This research was funded by The National Key Research and Development Program of China, grant number 2018YFF0215006.

Acknowledgments

The authors would like to thank the Third Geoinformation Mapping Institute of National Administration of Surveying Mapping and Geoinformation for providing data used in this study, and the authors of the references cited in this article for their contributions.

Conflicts of Interest

The authors declare no conflict of interest.

References

  1. Action Plan for the Prevention and Control of Air Pollution. Available online: http://www.jingbian.gov.cn/gk/zfwj/gwywj/41211.htm?from=timeline (accessed on 24 June 2019).
  2. CHINA: 13th Five-Year Plan for Energy Development. Available online: https://policy.asiapacificenergy.org/node/2918 (accessed on 24 June 2019).
  3. China Statistical Yearbook 2018. Available online: www.stats.gov.cn/tjsj/ndsj/2018/indexch.htm (accessed on 24 June 2019).
  4. Li, H.P.; Li, S. Exploration of natural gas spot supply model. In Proceedings of the Gas Branch of Chinese Society of Civil Engineering, Changzhou, China, 31 August 2017; p. 3. [Google Scholar]
  5. Li, X.J. Problems and safety management measures in natural gas supply stations. Gas and Heat 2018, 38, 40–43. [Google Scholar] [CrossRef]
  6. Nastasi, B.; Lo Basso, G.; Astiaso Garcia, D.; Cumo, F.; de Santoli, L. Power-to-gas leverage effect on power-to-heat application for urban renewable thermal energy systems. Int. J. Hydrog. Energy 2018, 43, 23076–23090. [Google Scholar] [CrossRef]
  7. Stephens-Romero, S.D.; Brown, T.M.; Kang, J.E.; Recker, W.W.; Samuelsen, G.S. Systematic planning to optimize investments in hydrogen infrastructure deployment. Int. J. Hydrog. Energy 2010, 35, 4652–4667. [Google Scholar] [CrossRef] [Green Version]
  8. Noussan, M.; Nastasi, B. Data Analysis of Heating Systems for Buildings—A Tool for Energy Planning, Policies and Systems Simulation. Energies 2018, 11, 233. [Google Scholar] [CrossRef] [Green Version]
  9. Cajot, S.; Peter, M.; Bahu, J.-M.; Guignet, F.; Koch, A.; Maréchal, F. Obstacles in energy planning at the urban scale. Sustain. Cities Soc. 2017, 30, 223–236. [Google Scholar] [CrossRef]
  10. Leeuw, J.d.; Rizayeva, A.; Namazov, E.; Bayramov, E.; Marshall, M.T.; Etzold, J.; Neudert, R. Application of the MODIS MOD 17 Net Primary Production product in grassland carrying capacity assessment. Int. J. Appl. Earth Obs. 2019, 78, 66–76. [Google Scholar] [CrossRef]
  11. Foryś, I.; Kazak, J. “Absorption” or “Carrying Capacity” of Areas–Assessment Methods on the Example of Detached Housing Real Estate. Real Estate Manag. Valuat. 2019, 27, 5–19. [Google Scholar] [CrossRef] [Green Version]
  12. Martire, S.; Castellani, V.; Sala, S. Carrying capacity assessment of forest resources: Enhancing environmental sustainability in energy production at local scale. Resour. Conserv. Recycl. 2015, 94, 11–20. [Google Scholar] [CrossRef]
  13. Kluger, L.C.; Filgueira, R.; Byron, C.J. Using media analysis to scope priorities in social carrying capacity assessments: A global perspective. Mar. Policy 2019, 99, 252–261. [Google Scholar] [CrossRef]
  14. Pinto, H.; Guerreiro, J. Innovation regional planning and latent dimensions: the case of the Algarve region. Ann. Reg. Sci. 2010, 44, 315–329. [Google Scholar] [CrossRef] [Green Version]
  15. Gonson, C.; Pelletier, D.; Alban, F. Social carrying capacity assessment from questionnaire and counts survey: Insights for recreational settings management in coastal areas. Mar. Policy 2018, 98, 146–157. [Google Scholar] [CrossRef] [Green Version]
  16. Min, Q.W.; Yu, W.D.; Zhang, J.C. Fuzzy-based Evaluation of Water Resources Carrying Capacity and Its Application. Res. Soil Water Conserv. 2004, 14–16, 129. Available online: http://stbcyj.paperonce.org/oa/DArticle.aspx?type=view&id=200403004 (accessed on 24 June 2019).
  17. Na, N. Analysis of carrying capacity of water resources in liaoning province based on PSR model. Water Conserv. Tech. Superv. 2019, 149, 149–152. [Google Scholar]
  18. Xia, J.; Zhang, Y.Y.; Wang, Z.G.; Li, H. Water carrying capacity of urbanized area. Water Resour. 2006, 37, 1482–1488. [Google Scholar] [CrossRef]
  19. Feng, Z.M.; Yang, Y.Z.; Zhang, J. The Land Carrying Capacity of China Based on Man-grain Relationship. Chin. J. Popul. Resour. Environ. 2009, 7, 51–58. [Google Scholar]
  20. Wang, D.B.; Liu, B. Evaluation research on the bearing capacity of land resources in beijing-tianjin-hebei region. Econ. Manag. 2019, 33, 9–14. [Google Scholar]
  21. Qi, Y.B. Quantitative and Comprehensive Evaluation on Bearing-capacity of Land Resources—Taking Tianjin as an Example. China Land Resour. Econ. 2004, 6–7, 48, 50. Available online: https://www.cnki.net/KCMS/detail/detail.aspx?filename=ZDKJ200406001&dbname=cjfdtotal&dbcode=CJFD&v=MjMyODF5bkFaTEc0SHRYTXFZOUZaWVI2RGc4L3poWVU3enNPVDNpUXJSY3pGckNVUkxPZVplWnBGeTdtVTc3QVA= (accessed on 24 June 2019).
  22. Wei, J.M. Analysis on Mineral Resource Carrying Capacity and Sustainable Power in Hei Longjiang Province. China Min. Ind. 2006, 102–106, 109. Available online: http://www.cnki.com.cn/Article/CJFDTotal-ZGKA200611039.htm (accessed on 24 June 2019).
  23. Li, M.; Lv, Y.Q. Evaluation of the bearing capacity of the coal resources in Taiyuan city. China Min. Ind. 2018, 27, 62–65. [Google Scholar]
  24. Wang, Z.Z. Research on evaluation model of urban traffic carrying capacity. Master’s Thesis, China University of Geosciences, Beijing, China, 2017. [Google Scholar]
  25. Zhang, M.X. Research on carrying capacity of transportation infrastructure in megacities. Master’s Thesis, Capital University of Economics and Business, Beijing, China, 2014. [Google Scholar]
  26. Yang, S.J.; Gu, G.H. Research on the bearing capacity evaluation of urban public service facilities based on Delphi analytic hierarchy process and grey correlation analysis. Math. Pract. Underst. 2018, 48, 311–320. [Google Scholar]
  27. Miao, X.T. The Evaluation Research of Urban Infrastructure Carrying Capacity-Taking the Beijing-tianjing-hebei Regions as Example. Master’s Thesis, Tianjin Business University, Tianjin, China, 2018. [Google Scholar]
  28. Zhang, B.W. Carrying Capacity Evaluation of Urban Infrastructure—A Case Study of Lanzhou. Dev. Res. 2018, 136–141. Available online: https://www.cnki.net/KCMS/detail/detail.aspx?filename=KFYJ201802022&dbname=cjfdtotal&dbcode=CJFD&v=MjQ0NjRSTE9lWmVacEZ5N2xWcnZMTGl2U1pMRzRIOW5Nclk5SFpvUjZEZzgvemhZVTd6c09UM2lRclJjekZyQ1U= (accessed on 24 June 2019).
  29. Zhao, N.; Shen, J.L.; Jia, L.J. An empirical study on the index and bearing state of Beijing’s infrastructure capacity. Urban Dev. Res. 2009, 16, 68–75. [Google Scholar]
  30. Ye, Y.M. Interpretation of Urban Comprehensive Carrying Capacity. Frontline 2007, 26–28. Available online: http://www.cnki.com.cn/Article/CJFDTotal-QXZZ200704011.htm (accessed on 24 June 2019).
  31. Fu, H.Y.; Hu, Y. Review on the studies on urban comprehensive carrying capacity. Urban Issues 2009, 27–31. [Google Scholar] [CrossRef]
  32. Gao, H.L.; Tu, J.J.; Yang, L. Evaluation of the Comprehensive Carrying Capacity of Cities. J. Southwest Univ. 2010, 32, 148–152. [Google Scholar]
  33. Dong, Y.; Xu, L.Y. Theoretical and empirical study of a bidirectional composite dynamic evaluation method of urban comprehensive carrying capacity. Acta Sci. Circumstantiae 2019, 39, 3171–3179. [Google Scholar]
  34. Xiao, Y. Evaluation Method Research on City Gas Pipeline Network Bearing Capacity. Master’s Thesis, Beijing University of Civil Engineering and Architecture, Beijing, China, 2014. [Google Scholar]
  35. Liu, X. Research on Bearing Capacity of Urban Medium Voltage Gas Network. Master’s Thesis, Harbin Institute of Technology, Harbin, China, 2012. [Google Scholar]
  36. Amirat, A.; Mohamed-Chateauneuf, A.; Chaoui, K. Reliability assessment of underground pipelines under the combined effect of active corrosion and residual stress. Int. J. Pres. Ves. Pip. 2006, 83, 107–117. [Google Scholar] [CrossRef]
  37. Shahriar, A.; Sadiq, R.; Tesfamariam, S. Risk analysis for oil & gas pipelines: A sustainability assessment approach using fuzzy based bow-tie analysis. J. Loss Prevent. Proc. 2012, 25, 505–523. [Google Scholar]
  38. Badida, P.; Balasubramaniam, Y.; Jayaprakash, J. Risk evaluation of oil and natural gas pipelines due to natural hazards using fuzzy fault tree analysis. J. Nat. Gas Sci. Eng. 2019, 66, 284–292. [Google Scholar] [CrossRef]
  39. Fan, J. Perspective of China’s Spatial Governance System after 19th CPC National Congress. Bull. Chin. Acad. Sci. 2017, 32, 396–404. [Google Scholar]
  40. Hao, Q.; Deng, L.; Feng, Z.M. Carrying capacity reconsidered in spatial planning: Concepts, methods and applications. J. Nat. Resour. 2019, 34, 2073–2086. [Google Scholar]
  41. Mou, X.J.; Rao, S.; Zhang, X.; Zhu, Z.X.; Huang, J. Review of ecological carrying capacity and industry consistency evaluation. Environ. Ecol. 2019, 1, 15–22. [Google Scholar]
  42. Xiang, Y.Y.; Meng, J.J. Research and application advances in ecological carrying capacity. J. Ecol. 2012, 31, 2958–2965. [Google Scholar] [CrossRef]
  43. Cheng, L. China’s energy security challenges and analysis of coal security role. Coal Econ. Res. 2019, 39, 10–14. [Google Scholar] [CrossRef]
  44. National Energy Conservation Center. 2019 China Energy and Chemical Industry Development Report. Resour. Conserv. Environ. Prot. 2019, 4–5. Available online: http://www.cnki.com.cn/Article/CJFDTotal-ZYJH201901003.htm (accessed on 24 June 2019). [CrossRef]
  45. Chen, C.J. Design and Application Gas Supply in Weak Pipe Network Regional. Master’s Thesis, South China University of Technology, Guangzhou, China, 2013. [Google Scholar]
  46. Li, K.Y.; Li, Z.Z.; Sang, R.R.; Zhou, M.; Chen, B.J. Small LNG supply station. In Proceedings of the China Gas Operation and Safety Symposium (9th) & 2018 Annual Meeting of Gas Branch of China Society of Civil Engineering, Chengdu, China, 12 September 2018; p. 4. [Google Scholar]
  47. National Standards of China. Available online: http://www.biaozhun8.cn/so.asp?k=GB50028-2006+ (accessed on 24 June 2019).
  48. National Standards of China. Available online: http://www.biaozhun8.cn/so.asp?k=GB50016-2014 (accessed on 24 June 2019).
  49. Heinonen, S.; Jokinen, P.; Kaivo-oja, J. The ecological transparency of the information society. Futures 2001, 33, 319–337. [Google Scholar] [CrossRef]
  50. Yang, T.Y. Research On The Water Resources Carrying Capacity Of Coastal Areas Based On The Pressure-State-Response Model. Water Conserv. Technol. Superv. 2019, 138–142. Available online: http://www.cnki.com.cn/Article/CJFDTotal-SLJD201903043.htm (accessed on 24 June 2019).
  51. Wang, F.; Dang, X.X. Assessment of Ecological Security of Towns in Xi’an Based on "Pressure-State-Response" Model. Dev. Small Cities Towns 2019, 37, 54–62. [Google Scholar]
Figure 1. Pressure–state–response model
Sustainability 11 06971 g001
Figure 2. Pressure–state–capacity model
Sustainability 11 06971 g002
Figure 3. Location of study region.
Sustainability 11 06971 g003
Figure 4. Spatial distribution of gas supply stations.
Sustainability 11 06971 g004
Figure 5. Bearing capacity of country.
Sustainability 11 06971 g005
Figure 6. Loading state of country.
Sustainability 11 06971 g006
Figure 7. Bearing capacity of city.
Sustainability 11 06971 g007
Figure 8. Loading state of city.
Sustainability 11 06971 g008
Figure 9. Correlation analysis: the number of gas supply station depends on the left axis, and bearing capacity and loading state depend on the right axis.
Sustainability 11 06971 g009
Table 1. Index system of bearing capacity evaluation.
Target LayersIndex TypeIndexProperties
Urban Bearing
Capacity
to Gas
Supply
Stations
CapacityProportion of developable area+
Proportion of tertiary industry+
Density of buildings+
Number of enterprise users+
Number of upstream gas receiving stations+
StatePer capita construction land area+
Convenience of transportation+
Per capita GDP+
Increasing rate of GDP+
Coverage of pipeline gas
Change rate of building density+
PressureDensity of gas supply station
Density of dangerous poi
Density of population
Pollution emissions
Note: ‘+’ means the index is positive (i.e. the larger the index value, the higher the bearing capacity) and ‘−’ means the opposite.
Table 2. Weight of index.
IndexWeight
Proportion of developable area0.1601
Proportion of tertiary industry0.1646
Density of buildings0.2592
Number of enterprise users*
Number of upstream gas receiving stations*
Per capita construction land area*
Convenience of transportation0.1531
Per capita GDP0.1848
Increasing rate of GDP0.0527
Coverage of pipeline gas*
Change rate of building density0.02
Density of gas supply station0.1474
Density of dangerous poi0.0125
Density of population0.0207
Pollution Emissions*
Note: ‘*’ means the weight of this index has not been calculated because of loss of data, and the weight of them have been set to 0 in this paper.
Table 3. Classification standard of bearing capacity.
Bearing Capacity (BC)GradeConnotation
BC ≤ 0.45ILow
0.45 < BC ≤ 0.6IIMedium-low
0.6 < BC ≤ 0.9IIIMedium
0.9 < BC ≤ 1.2IVMedium-high
BC > 1.2VHigh
Table 4. Statistical results of bearing capacity grade.
Grade of BC ShanghaiJiangsuZhejiang Anhui
I31772
II816510
III523919
IV0102515
V021710
Table 5. Classification standard of load state.
Loading State (LS)GradeConnotation
LS < 0.3ILow load
0.3 ≤ LS ≤ 0.9IIMedium load
0.9 < LS < 1.1IIISuitable load
LS ≥ 1.1IVOver load
Table 6. Results of urban bearing capacity and loading state.
City Number of SubdistrictsMinimum of Subdistrict’s BCGrade of BCName of Subdistrict with Minimum of BSMaximum of Subdistrict’s LSGrade of LSName of Subdistrict with Maximum of LS
Shanghai160.359574IJinshan2.338802IVPutuo
Nanjing110.567106IIQinhuai1.975725IVGulou
Wuxi70.530294IILiangxi1.681162IVLiangxi
Changzhou60.429831IZhonglou1.236392IVZhonglou
Suzhou90.463182IITaicang0.819637IIXiangcheng
Nantong80.246446IRugao0.58624IIGangzha
Yancheng90.31939IDongtai0.357275IIJianghu
Yangzhou60.437107IJiangdu0.342991IIYizheng
Zhenjiang60.400975IDanyang0.868983IIRunzhou
Taizhou60.230583ITaixing0.636364IIHailing
Hangzhou130.513125IIXiacheng1.573105IVXiacheng
Ningbo100.536724IICixi0.913163IIIZhenhai
Jiaxing70.282773ITongxiang1.269767IVNanhu
Huzhou50.643665IIINanxun0.397596IIWuxing
Shaoxing60.808184IIIYuecheng0.122969IXinchang
Jinhua90.795528IIIJindong0.228047IJindong
Zhoushan41.036035IVDinghai0.205829IPutuo
Taizhou90.537812IILuqiao0.775241IIJiaojiang
Hefei90.357084IChangfeng1.268383IVYaohai
Wuhu80.549569IIJiujiang0.784911IIJinghu
Maanshan60.585424IIHexian0.649445IIHuashan
Tongling40.823177IIITongguan1.110852IVTongguan
Anqing100.61909IIIWangjiang0.470002IIDaguan
Chuzhou80.392824IDingyuan0.647329ILangya
Chizhou41.205657VQingyang0.108325IQingyang
Xuancheng70.817662IIILangxi0.143766ILangxi
Table 7. Results of Pearson correlation coefficient.
IndexesPearson CoefficientNumber of Gas Supply StationsBearing CapacityLoading State
Number of gas supply stationsCorrelations1−0.2410.794
p 0.2360.000
Bearing capacityCorrelations−0.2411−0.433
p−0.236 0.027
Loading stateCorrelations0.794−0.4331
p0.0000.027
Note: p means the significance level, and when p<0.05, it means the relationship is significant; when p<0.01, it means the relationship is very significant.

