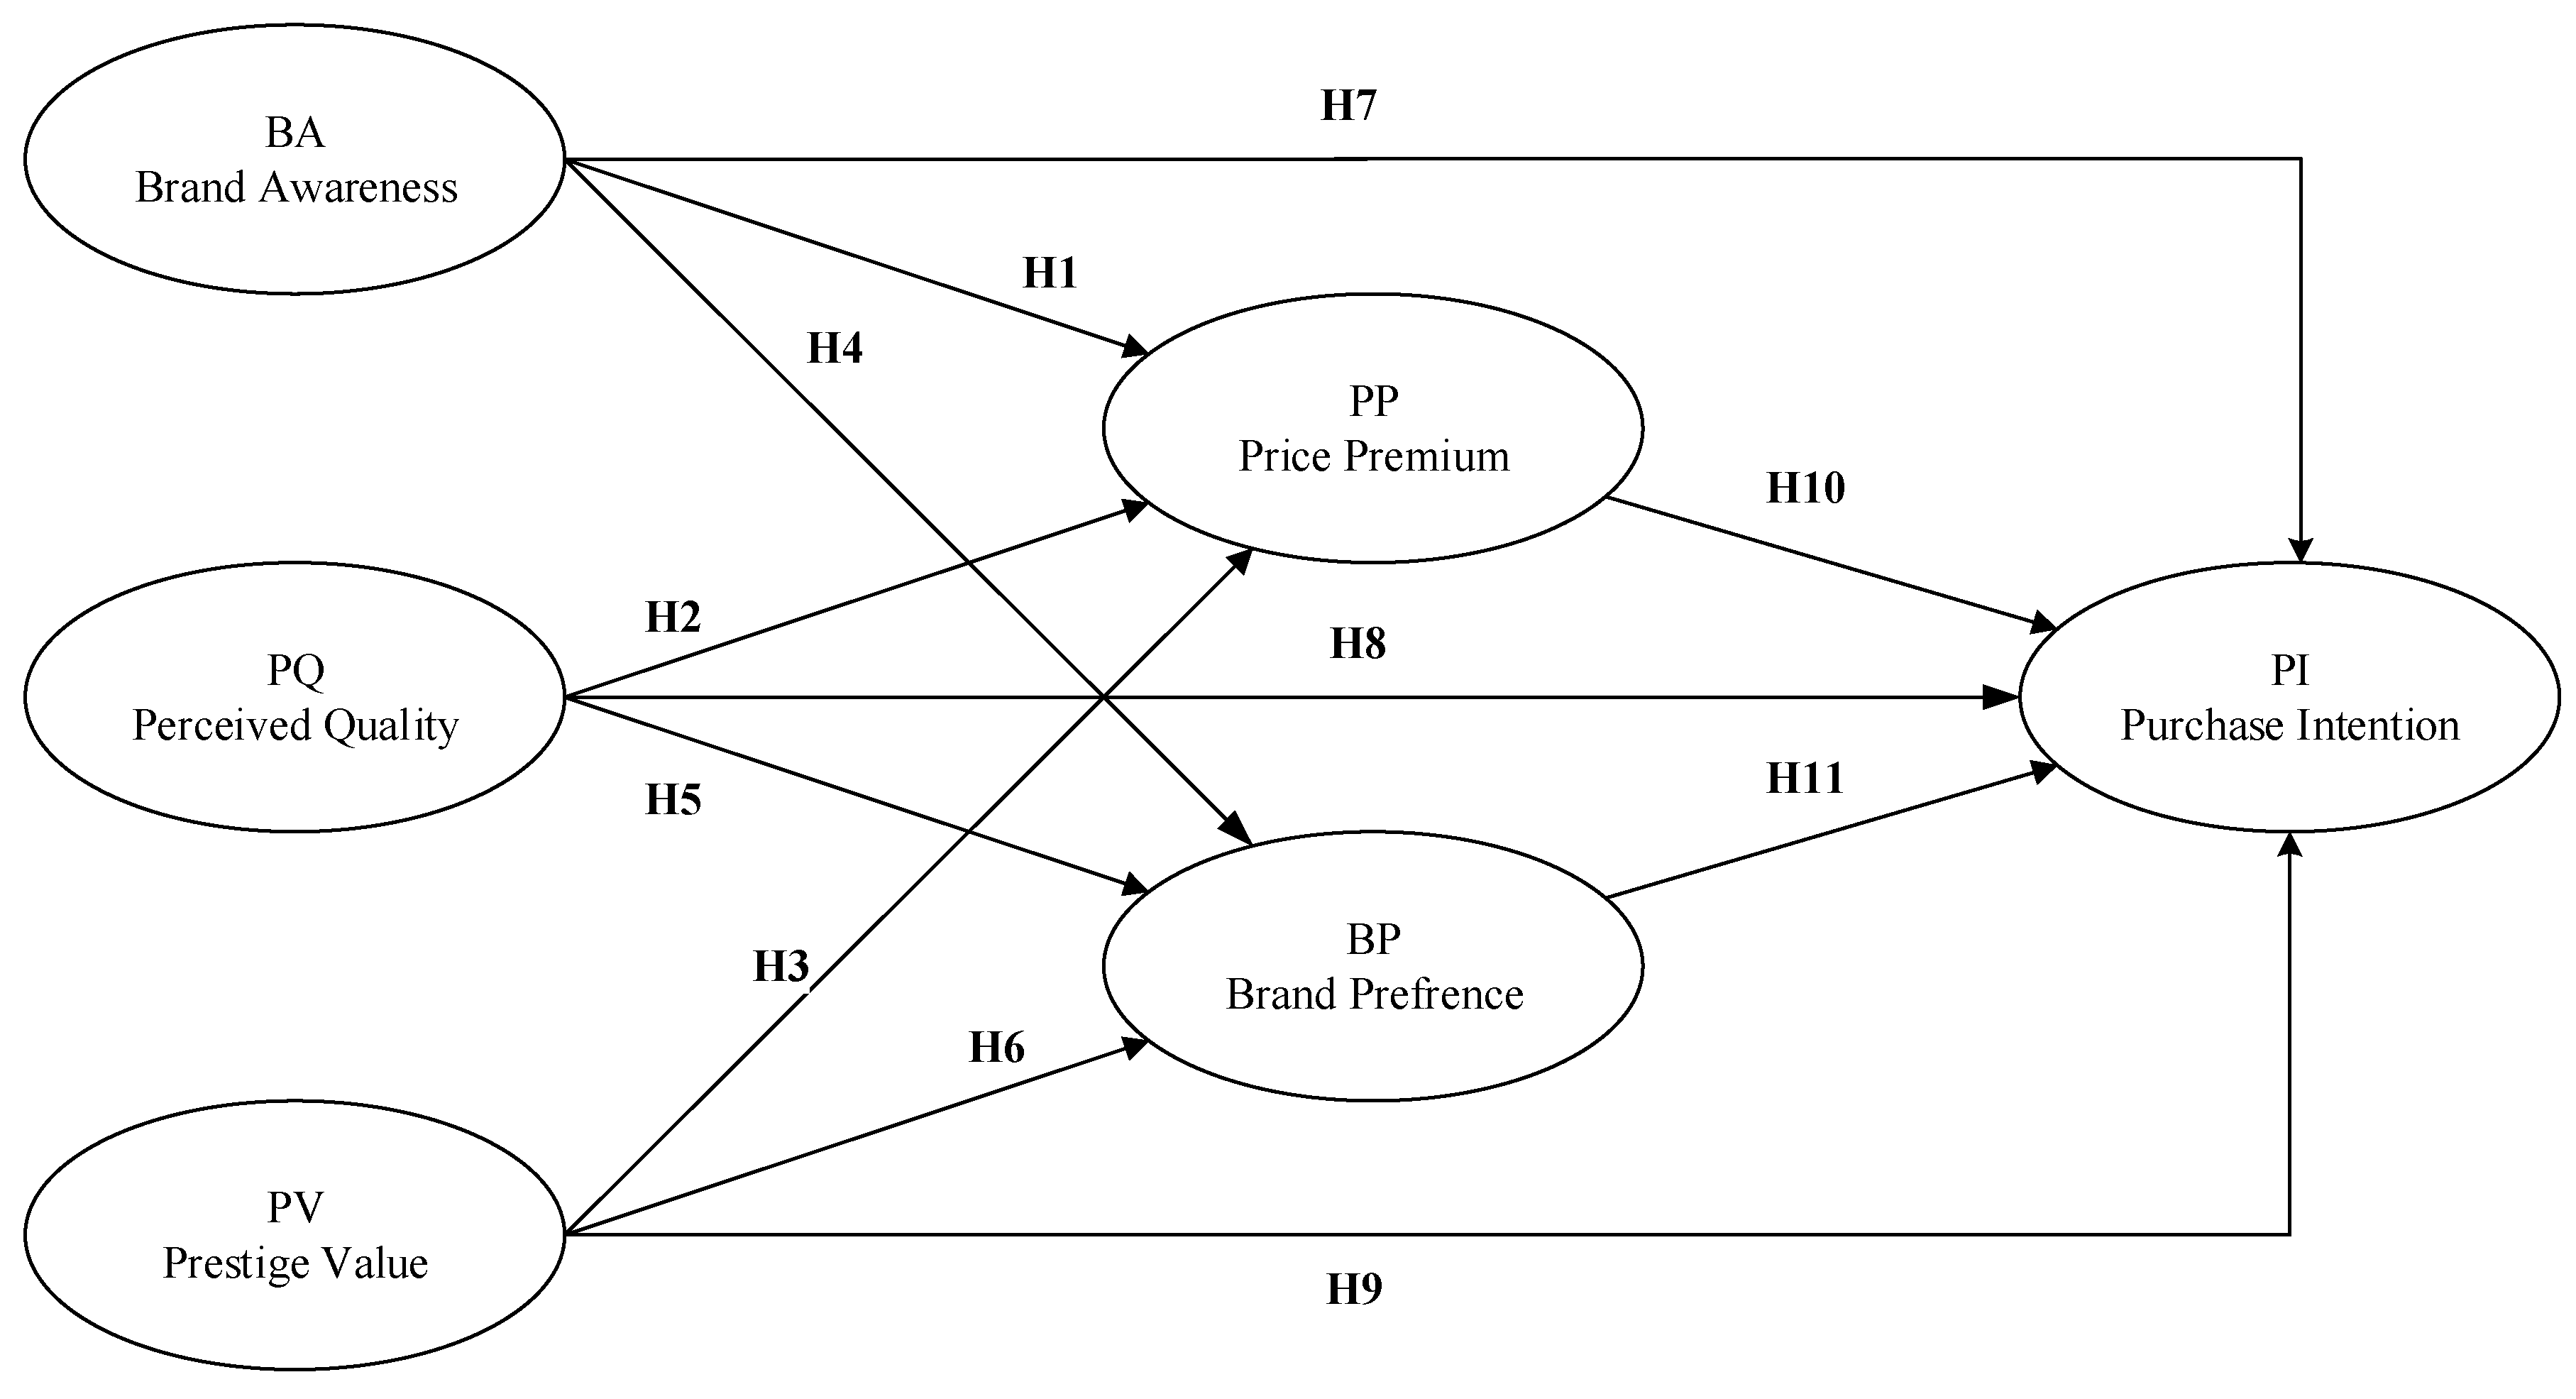
Article

What Killed HTC and Kept Apple Alive? Brand Sustainability Comparison of Two Asian Countries

1
Department of Business Administration, Asia University, Wufeng District, Taichung City 41354, Taiwan
2
Department of Marketing, California State University, San Bernardino, CA 92407, USA
3
Faculty of International Tourism and Management, City University of Macau, Macau, China
4
Department of Business Administration, National Central University, Taoyuan 32001, Taiwan
*
Author to whom correspondence should be addressed.
Sustainability 2019, 11(24), 6973; https://doi.org/10.3390/su11246973
Submission received: 29 October 2019 / Revised: 24 November 2019 / Accepted: 27 November 2019 / Published: 6 December 2019

Abstract

:
Although brand sustainability is found essential for brand survival, establishing it has remained challenging. Brand sustainability requires a strong association between brand equity and consumer values. The current study attempts to discover critical components involved that may influence Indonesian and Taiwanese consumers to purchase smartphones such as Apple and High-Tech Computer Corporation (HTC). Primary data collection was conducted to gather data through an online field survey. Following a quantitative approach, structural equation modeling (SEM) was used to examine the link between research constructs and the proposed hypotheses based on two samples of 202 and 217 respondents in Taiwan and Indonesia, respectively. Results represent significant and non-significant direct influences underlining the significance of perceived quality and brand preferences when testing brand equity effects on how consumers value different brands. While price premium is found to be the most influential factor that shapes the formation of purchase intention for Apple brands among both Taiwanese and Indonesian consumers, perceived quality is also affecting Taiwanese brand preference for HTC. Furthermore, prestige value is revealed to be a predictor of brand preference among Indonesian HTC consumers. Research findings have important implications for decision-makers to motivate purchase intentions of smartphone users toward specific brands. The insights provided by the findings will assist marketers in developing brand strategies that influence Taiwanese and Indonesian consumers’ purchases of Apple or HTC products.

1. Introduction

Nowadays, the concepts of branding and sustainability are tightly intertwined [1]. Brand sustainability provides remarkable competitive advantages for companies as it enables brands to differentiate from competitors, transmit company values, and build a secure connection between stakeholders and companies. More importantly, a successful branding strategy demands a positive evaluation of consumers, and such a favorable assessment can be generated using principles of sustainability. To restate, what consumers are seeking to be satisfied can be meaningful through brand sustainability [2,3,4]. In this sense, brand equity is one of the most valuable assets to differentiate one product from another to sustain a competitive advantage and promote purchase intention [5,6]. The notion is based on the expectancy-value (EV) model [7], where consumers perceive the brand’s quality and expect products to function as expected, leading to purchase intention [8]. With the rapid development of technology, smartphone penetration is expected to reach 48% of the global population by 2021, and gaming smartphones with large screens, high-quality speakers, and long battery lives are trending [9]. As the hardware and functionality of smartphones become comparable, user experiences become a crucial factor in determining brand equity and, ultimately, purchase intention.
In the present study, the researchers will examine the brand equity of two smartphone brands: Apple and HTC (High Tech Computer Corporation). In June 2012, the smartphone penetration rate in the United States crossed over 50% mark, led by Apple with 50.21% market share, followed by Samsung at 12.44% and HTC at 11.31% [10]. However, as of June 2019, Apple still dominated the market with a 52.95% share, followed by Samsung at 26.1%, yet HTC had fallen to a distant 14th place at 0.21% [10]. A similar downward trend was also observed in Taiwan, where in June 2012, Apple’s market share was 27.24%, followed by HTC at 26.47% and Samsung at 20.22%. Nevertheless, in June 2019, Apple’s market share had grown to 45.44%, followed by Samsung at 18.8%. However, HTC had dropped to fifth place at 5.43%. HTC seems to be losing its market, not only in their country of origin (i.e., Taiwan) but also worldwide [10,11].
Prior research suggests that the main reason for HTC’s downward path was due to their weakness in customer satisfaction and loyalty [12], which resulted in reduced brand equity, subsequently reducing purchase intention and market share [13]. In the present study, the researchers are examining the influence of brand equity proposed by Aaker [14] regarding brand awareness, perceived quality, prestige value, consumer’s perceptions of price premium, brand preference, and purchase intention in Taiwan, where HTC’s market share was comparable to Apple’s market share (26.47% vs. 27.24%) in June 2012. This study will also validate the proposed model in Indonesia, one of the largest smartphone markets in the world [15], to identify key factors that influence consumers’ decision to purchase smartphones. This study relies on established concepts and theories to consider brand sustainability through the framework of brand equity, consumer values, and buying behavior. We make a comparison between forenamed brands based on gathered information from consumers in two South Asian countries. Analysis of each brand presents the importance of each approach that can leverage brand sustainability in association with brand equity. Findings from the study will assist marketers and decision-makers in developing strategies to enhance brand equity and market demands for brands.

2. Literature Review

2.1. Brand Equity (BE)

Brand equity is considered marketing’s core concept [6,16,17] and appears when consumers are familiar with certain brands resulting in reliable and unique brand associations in their minds. Brand equity has been widely recognized as a significant factor affecting the sustainable performance of companies by marketing practitioners and scholars [4,18,19,20]. Although there are numerous studies and definitions regarding brand equity [21,22,23], these definitions are either customer-based and/or financial-based perspectives [24,25]. One of the aspects of brand equity is based on customer perspectives. The evaluation of consumer response to a brand is grounded on the power of the brand in the customer’s mind [25]. Park and Srinivasan [26] propose that brand equity is “the added value endowed by the brand to the product as perceived by a consumer.” From the financial-based perspective, brand equity is described as the value of the financial asset created by the brand [27]. The brand’s financial value is considered the consequences of the consumers’ response toward the brand [28].
Brand equity, the value created by the brand, is multidimensional [29,30,31,32]. According to Aaker [7], there are five dimensions of brand equity: Brand awareness, brand loyalty, brand association, perceived quality, and proprietary brand assets. Keller [25] defines brand equity as a model of associative network memory that includes two components: Brand awareness and brand image. Lassar et al. [33] modified the dimensions into performance-giving, perceived prestige value, image, trustworthiness, and a feeling of commitment. Based on the expectancy-value (EV) model, consumers’ perception toward the brand will create value for them (e.g., perceived quality) and lead to purchase intention [34,35]. Considering the dynamic notion of competitive business settings, besides competitive offerings, it is prevalent that consumer’s perception of the value changes over time. Therefore, given the importance of managing and developing BE, on sustainable performance of companies, in particular, brand sustainability of products [36,37], the present study will examine three key sub-dimensions of brand equity: Brand awareness, perceived quality, and prestige value to better understand the consequences of brand equity as one of the most valuable assets from consumers viewpoint.

2.2. Brand Awareness (BA)

Brand awareness is the consumer’s ability to recognize and recall a specific brand in different conditions [38]. In other words, brand awareness refers to the power of a brand in consumers’ minds [39]. According to Chi et al. [40], there are two dimensions of brand awareness, brand recall, and brand recognition. Brand recall is whether consumers can recall an exact brand name when they see a specific product. Brand recognition, however, is about consumers’ ability to name a brand when they see the brand logo. Hoeffler and Keller [41] suggest that brand awareness can be differentiated into width and depth, where width refers to how a particular brand name comes to the consumer’s mind when making a purchase. Depth refers to how consumers identify and remember certain brands easily. Brands that have a high level of brand width and depth have an advantage since consumers will have a higher recall of the brand in purchase decisions [42,43]. In essence, brands that have a high level of width and depth also have high awareness [40].
When it comes to brand equity, brand awareness plays the most crucial role [5,14,44] and is the first step to creating brand equity [45]. High brand awareness signals a high brand’s presence and a sense of familiarity to target consumers [46] that can influence consumers’ choices toward particular products.
There are different arguments regarding major reasons that let the BA concept be considered a significant factor in purchase decision-making. Firstly, purchasers recall the brand when they perceive the product category as necessary. In other words, the possibility of a particular brand to be purchased is higher if that specific brand has a higher level of awareness [47,48]. Moreover, if the consumer can recall a product quickly, it is very likely for that specific brand to be selected over the other existing ones by buyers [42].

2.3. Perceived Quality (PQ)

Perceived quality motivates consumers to choose and buy specific products and [49,50] refers to the consumer’s subjective perception regarding product excellence and quality between one brand versus another [51]. Perceived quality can also be stated as the consumer’s feelings towards a product that influences their level of satisfaction with it and contributes to the profitability of a firm [52]. Alternatively, the PQ is the excellence of a product based on intrinsic cues such as performance and extrinsic cues such as price in the consumer’s mind [47,52,53]. Notably, the assessment of quality from consumers would often occur in a comparison context [52,54].
In order to establish brand sustainability, providing product quality is crucial for a firm to stay competitive and generate opportunities for differentiation [55]. Creating quality goods helps facilitate appropriate brand positioning in the marketplace [56], and the target market can see the brand as one that meets their expectations [57].

2.4. Perceived Prestige Value (PV)

One of the most important decisions a firm makes is regarding the positioning of its products. Brand positioning highlights the unique characteristics and advantages of the product and differentiates it from competitors to attract the target market [58]. There are several ways to position a brand, but a sought-after distinction is to ensure the brand is perceived as a prestige brand by consumers [59,60]. Perceived prestige value is known as an expression of personal evaluative judgment regarding the status of a product associated with a brand, taking into account awareness and knowledge of competing brands [60,61,62]. In a broad sense, defining prestige is difficult. The term prestige is also related to the concept of consumer’s social status and wealth. For instance, brand prestige can be seen as a symbolic indicator of social class [63]. In the marketing context, the construct of brand prestige is recognized as one of the major drivers of consumer behavior that explains brand prestige can generate a sustainable competitive advantage for the company [59,64]. In this vein, there is a handful of studies that highlighted the strong association between consumer’s perception of quality and brand prestige [65,66].
Perceived prestige value is a psychological phenomenon that differs from one person to another [67]. Although people may have different perceptions of the same brand, generally, the more prestigious a brand is, the higher the level of interest it will create [66]. Wong and Zhou [68] point out that perceived prestige value influences purchase intention when the product has a social high-value target audience [69]. Perceived prestige value also affects consumers’ satisfaction levels. For example, consumers that perceive a product or brand to have a high prestige value will derive greater satisfaction than when the brand is not considered prestigious [70,71].

2.5. Price Premium (PP)

A brand may charge a premium price when there is more consumer willingness to pay for the product than those who are willing to pay for a similar product from the brand’s competitors [14]. It is underlined that the perceived quality of a certain product or service in the consumer’s mind is the vital driving force of price premium (PP). Consumers are willing to pay a higher price for a product or service of a specific brand if they recognize that a particular brand has a higher quality in comparing to others. This fact represents the brand strength commanding a higher price than its rivals [72]. It is widely argued that brand equity affects the willingness of consumers to pay a premium price [25,33,41,73]. Consumers are more likely to pay a higher price for their preferred brand when no other competitor can provide a suitable substitute [74].
Prior research has indicated that in business markets, a brand can create price premium [73,75,76], especially when the brand has high brand awareness, perceived quality, and perceived prestige value. Thus, even though there is a price increase, consumer’s responses towards the brand will stay the same or more elastic. Therefore, we propose the following three hypotheses:
Hypothesis 1 (H1).
BA has a statistically significant influence on PP.
Hypothesis 2 (H2).
PQ has a statistically significant influence on PP.
Hypothesis 3 (H3).
PV has a statistically significant influence on PP.

2.6. Brand Preference (BP)

Brand preference is the extent of brand loyalty, where consumers choose a particular brand over alternatives. The choice is based on the perceived value the brand provides [41,77,78]. Creating a superior brand image enhances preference and loyalty to and for the brand resulting in increased sales [79].
Brand preference is useful, not only from a business standpoint but also for consumers to reduce complexity in the purchasing process [77]. According to Gensch [80], forming a brand preference is a continuous process. At first, consumers are exposed to many brands, where they tend to forget some brands and remember those they would consider purchasing in the future [81]. Therefore, the challenge for companies is whether consumers can be persuaded to choose an alternative brand from a variety of options [82].
Companies with higher brand equity are more capable of impacting consumer’s brand perceptions and preferences [83]. Some researchers agree that the three categories of brand equity (brand awareness, perceived quality, and perceived prestige value) positively influence consumers’ brand preferences [78,84,85]. Based on the expectancy-value model that is commonly employed in the marketing context, preference presents a transition condition between inputs and outputs of brand choices. To restate, BP is the connection between information received and intention to purchase while considering brand choices [7,86]. In order to structure sustainable branding, providing a meaningful experience to consumers by brand producers can result in brand preferences [74,86]. A company with a well-known brand name is able to market effectively to enhance awareness and preference for the brand. However, even though some consumers may have little knowledge about the brand, those with high awareness are still preferred [85]. Moreover, brands with strong brand equity tend to get preferential evaluations from consumers [41]. Therefore, we propose the following three hypotheses:
Hypothesis 4 (H4).
BA has a statistically significant influence on BP.
Hypothesis 5 (H5).
PQ has a statistically significant influence on BP.
Hypothesis 6 (H6).
PV has a statistically significant influence on BP.

2.7. Purchase Intention (PI)

Purchase intention points to the effectiveness of a company’s marketing strategy and is described as the likelihood of consumers to purchase certain products in the future [87,88]. Purchase intention is a process in a consumer’s mind that involves thinking, consulting, and decision making regarding a certain product [89]. It is also the willingness and tendency for consumers to buy products or services from a specific company [89,90]. In the marketing context, behavioral intention is addressed to be a significant predictor of actual behavior [8]. Accordingly, some studies propose that consumer’s behavioral intention to purchase a specific brand can be influenced through attitude and values, thus in line with building brand sustainability, brand characteristics as values can effectively encourage consumers to continue using the product [24].
Previous research indicates that brand equity, such as brand awareness, perceived quality, and perceived prestige value, significantly affect consumer’s purchase intention [75,91]. Moreover, brands that have high value and strong brand equity generate greater purchase intention [7,92] than those that do not. For example, Gunawardane [93] finds that a laptop brand in Sri Lanka with high brand equity generated high purchase intention among consumers. Gatti [91] reports similar results in a study regarding two brands of traditional Italian Christmas cakes. Therefore, we propose the following three hypotheses:
Hypothesis 7 (H7).
BA has a statistically significant influence on PI.
Hypothesis 8 (H8).
PQ has a statistically significant influence on PI.
Hypothesis 9 (H9).
PV has a statistically significant influence on PI.
Prior research suggests that price premium is a factor influencing consumers’ purchase intention [58,94]. Consumers are more likely to purchase certain brands and are even willing to pay a premium price because its benefits meet their needs [5,95]. However, companies should manage to create a product that aligns with consumer’s needs and add higher value for them, then, price becomes secondary in the purchase decision [96]. Moon et al. [97] note that a premium price is not a significant factor influencing purchase intention for personalized items such as sunglasses and computer desks. Therefore, we hypothesize that:
Hypothesis 10 (H10).
PP has a statistically significant influence on PI.
Previous research indicates that brand preference is one salient factor that influences consumers’ purchase intention [83,84,98]. The reasoned action theory proposed by Fischbein and Ajzen [8] mainly aims to explain the relationship between an individual’s perceived value (PV) or belief and behavioral intention. It is affected when consumers have a more favorable attitude toward a brand over others. Given that brand equity influences brand preference, it is presumed that brand preference influences purchase intention as well. Thus, we hypothesize that:
Hypothesis 11 (H11).
BP has a statistically significant influence on PI.
The Research framework and proposed hypotheses are shown in Figure 1.

3. Research Methodology

3.1. Measurement and Scaling

The instrument used was a structured questionnaire that consisted of two sections, including the demographics of the respondents and research constructs. All items were derived from existing validated scales with slight modifications as needed to fit the research context. The first antecedent, brand awareness, was assessed using four items adapted from Yoo et al. [22]. In order to operationalize perceived quality, four items were taken from Pappu et al. [99,100]. The third antecedent, perceived prestige value, was measured by using a three-item scale gathered from early works [61,101]. Regarding the first endogenous variable price premium, three items from Netemeyer et al. [73] study were employed. Likewise, following Sirgy et al. [102], a three-item scale was used to measure brand preference. Lastly, to measure outcome variable, purchase intention, the three-item scale suggested by Erdem et al. [103] was used. All scale items are presented in Table 1. Since field studies were conducted in Taiwan and Indonesia first, all original items were translated from English to Mandarin and Bahasa. The instrument was then translated back to English by an independent translator, whose mother tongue was English and who had no knowledge of the questionnaire [104]. After comparing the results for consistency and making the necessary adjustments, the instrument was distributed among the native speakers of each country. It was necessary to pre-test the instrument on the target population. Pre-test respondents included individuals comparable to those who would be administered the questionnaire. A short interview with each pre-test participant helped determine the time needed to answer the questions and detect any other possible concerns to prepare the final version of the questionnaire. The final version of the instrument in the target language was the result of all the iterations described above. This construct instrument used a five-point Likert scale ranging from 1 = strongly disagree to 5 = strongly agree.

3.2. Data Collection

An online survey using Google Forms was conducted between September 2018 and November 2018. The internet-based survey was recommended for its potential benefits to provide unique sources of target respondents while a participant’s identity was protected, and anonymity was guaranteed [105]. Given that nowadays, people are relying on smartphones for internet access, the use of smartphones and the internet is highly related, therefore, collecting data through online questionnaires was considered consistent with research objectives. Moreover, snowballing and convenience sampling methods were used. This is a cross-sectional study with cross-sectional data collection. In this study, data was collected by observing several factors at one point in time. This type of data collection can help avoid several validity and reliability threats such as attrition, maturation, and communication effects [106,107]. Screening questions were asked first to select qualified respondents (e.g., Do you have previous experience using Apple/HTC? Have you ever heard about Apple/HTC?). To reach the participants, we employed several paths. First, we sent emails to randomly selected participants with a web link to the questionnaire. We also randomly picked participants in popular smartphone shopping centers and explained the research purpose to those who were willing to be asked on the spot or provided them the QR code to access the questionnaire’s web page. Using snowball sampling, we also requested respondents to share the questionnaire link with relatives, friends, and acquaintances who are regular smartphone users or potential smartphone purchasers. In total, we collected 202 and 217 qualified questionnaires from Taiwanese and Indonesian respondents, respectively. Privacy and discretion of participants are central to ethical research practice in social research Wiles et al. [108]. This study is a low-risk study for the participants. However, every effort was made to ensure that the data cannot be traced back to the participants.

4. Data Analysis Procedure

Following structural equation modeling (SEM), statistical analysis was conducted using SPSS AMOS 23. In the following sections, we discuss various types of statistical analyses and the results.

4.1. Sample Characteristic

Participant’s demographic characteristics such as gender, age, and education for both samples are presented in Table 2. As shown, most of the Taiwanese respondents were female (67.3%), between 21 to 25 years old (52%), and with an undergraduate degree of education (82.7%). Likewise, female Indonesian respondents dominated the sample (60.4%), they were between 21 to 25 years old (56.7%), and they had an undergraduate level of education (76%).

4.2. Measurement Model and Scale Accuracy Check

Before factor analysis, Kaiser–Meyer–Olkin (KMO) and Barlett’s test of sphericity were utilized to test the construct validity and the appropriateness of data. As its guideline, the KMO should be greater than 0.50, Bartlett’s test of sphericity should be large and significant, and for factor loading, should be at 0.50 or greater and ideally at 0.70, to make sure that there are no items that correlate with each other [109,110].
Measurement model and scale accuracy are evaluated in different ways. Convergent validity is used to make sure that the two constructs of the same concept are correlated. Meanwhile, discriminant validity is used to determine the extent to which constructs that should not be related are in reality not related. In other words, it makes sure that two constructs are genuinely distinct from one another. The parameters average variance extracted (AVE), composite reliability (CR), and maximum inter-construct correlation (Max r), represent the validity and reliability of the study [109].
Average variance extracted (AVE) is used to measure the level of variance captured by a construct versus the level due to measurement error [111]. AVE values above 0.7 are considered very well, whereas the level of 0.5 is acceptable. Composite reliability (CR) is used to estimate reliability and internal consistency based on the square of the total of factor loadings for a construct. According to Former and Larcker [111], CR is a less biased estimate of reliability compared to Chronbach’s Alpha (α), and the acceptable value of CR is 0.7 and above. To check discriminant validity, we conduct a comparison among the square root of each construct’s AVE with the correlation coefficients between each pair of latent variables. Table 3 presents the results of tests of discriminant validity, convergent validity, and composite reliability. Considering values with CR > 0.7, AVE > 0.5, √AVE > max correlation, validation requirements have been fulfilled (Table 3). Furthermore, the results of Cronbach’s Alpha (α) reliability analyses are shown in Table 4.
We conducted confirmatory factor analysis (CFA) to confirm the factors of the measurement model and the results were satisfactory. Table 5 and Table 6, respectively present detailed results for the CFA and SEM goodness of fit test. As seen, all the values for Taiwan-Apple, Taiwan-HTC, Indonesia-Apple, and Indonesia-HTC reached the minimum criteria of acceptable value. It indicates that the proposed model is satisfactory.

4.3. Structural Model and Hypotheses Testing Result

Hypotheses were analyzed after the overall model fit for both cases were approved. Moreover, results for structural equation model testing are illustrated (Figure 2, Figure 3, Figure 4 and Figure 5).
Table 7 presents the results of the proposed hypotheses as well as the comparison between Apple and HTC in the two countries. As seen, out of eleven hypotheses, there are four hypotheses rejected for Taiwan-Apple and only two hypotheses rejected for Indonesia-Apple. Otherwise, the result for Taiwan-HTC showed there are eight hypotheses rejected, and four hypotheses rejected for Indonesia-HTC.

5. Discussion, Conclusions and Implications

Successful implementation of brand sustainability requires a strong association between brand equity, and consumer expectations and their values. In other words, brand sustainability refers to all activities performed by the company to enhance the value of the brand for both consumers and marketers. As discussed, brands can create values, and values are developing or evolving over time, this expansion represents the sustainable characteristic of brands. Based on existing literature, we argued that brand equity is one of the major affecting elements on the sustainable performance of companies that brand owners should consider [18,19,20], having said that, the current research framework is proposed. The major objective of the present study is to analyze the sustainable relationship between the concepts of brand equity and purchase intention mediated through price premium and brand preference. Brand equity components include brand awareness, perceived quality, and perceived prestige value. Our study attempts to compare consumer behavior toward two well-known brands HTC and Apple in Indonesia and Taiwan in order to better understand factors engaged in building brand sustainability. We conducted data collection in both Taiwan and Indonesia for both products, HTC and Apple. Results are summarized and presented based on the smartphone brand for each hypothesis.

5.1. Discussion

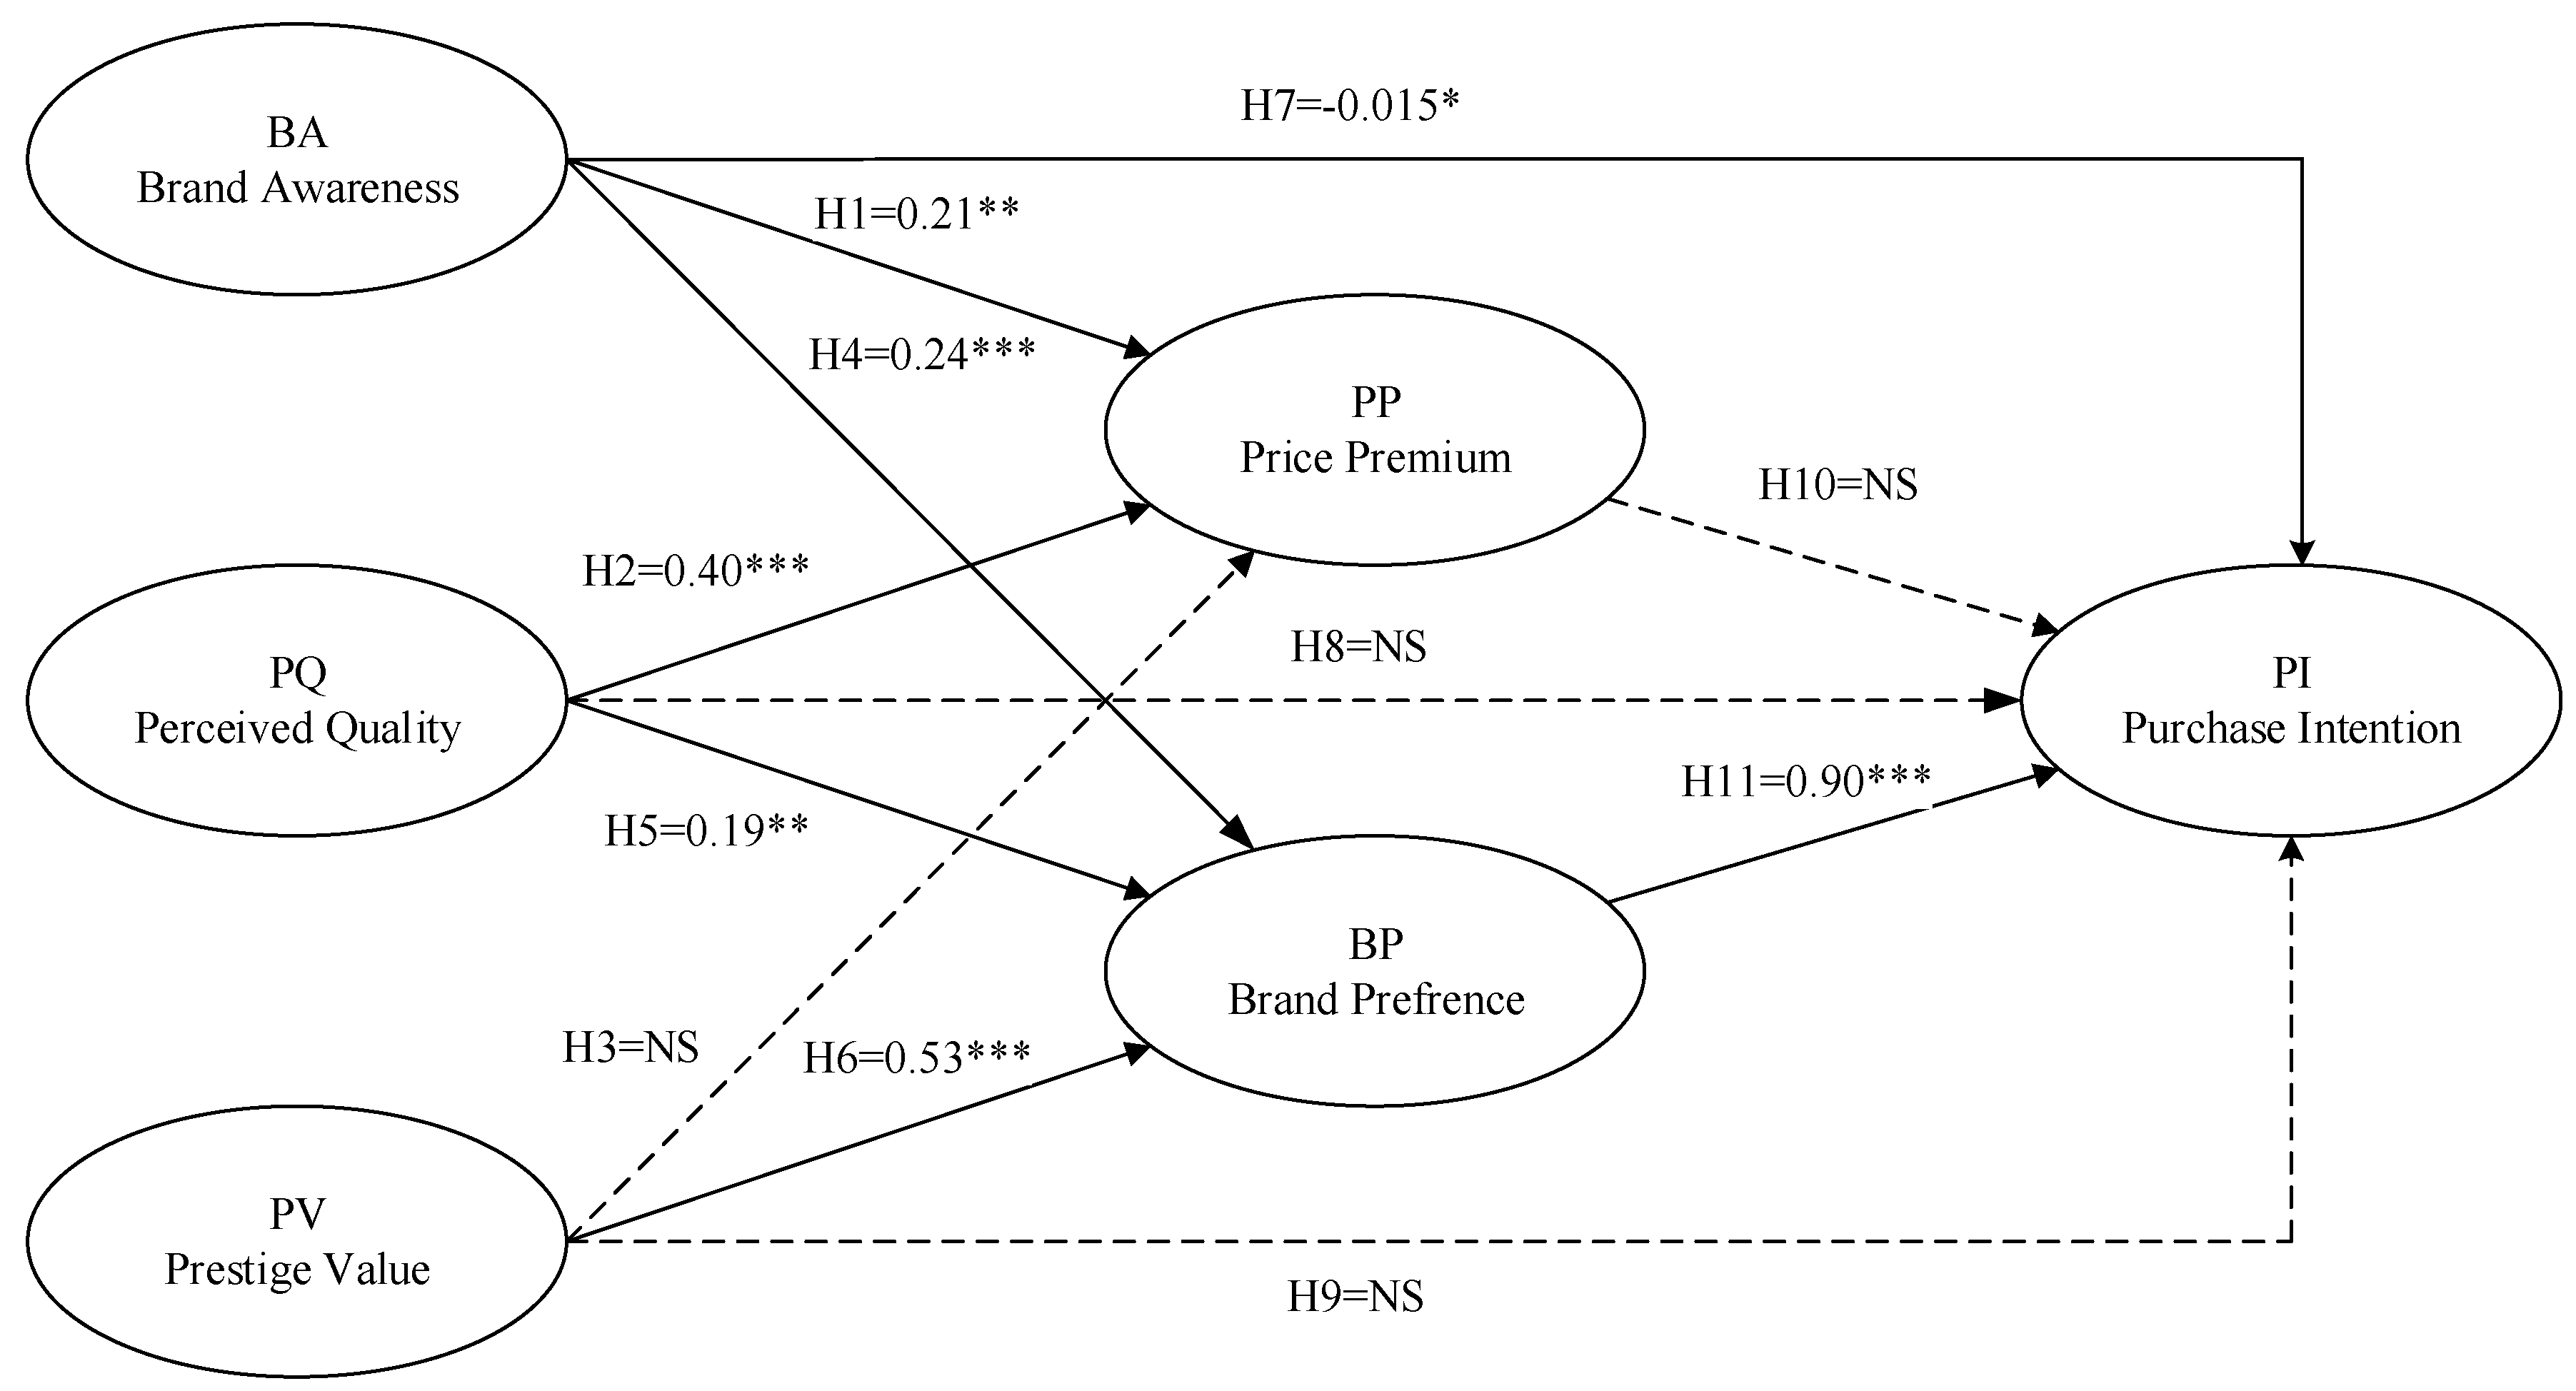
Hypothesis 1 (H1): BA has a statistically significant influence on PP.
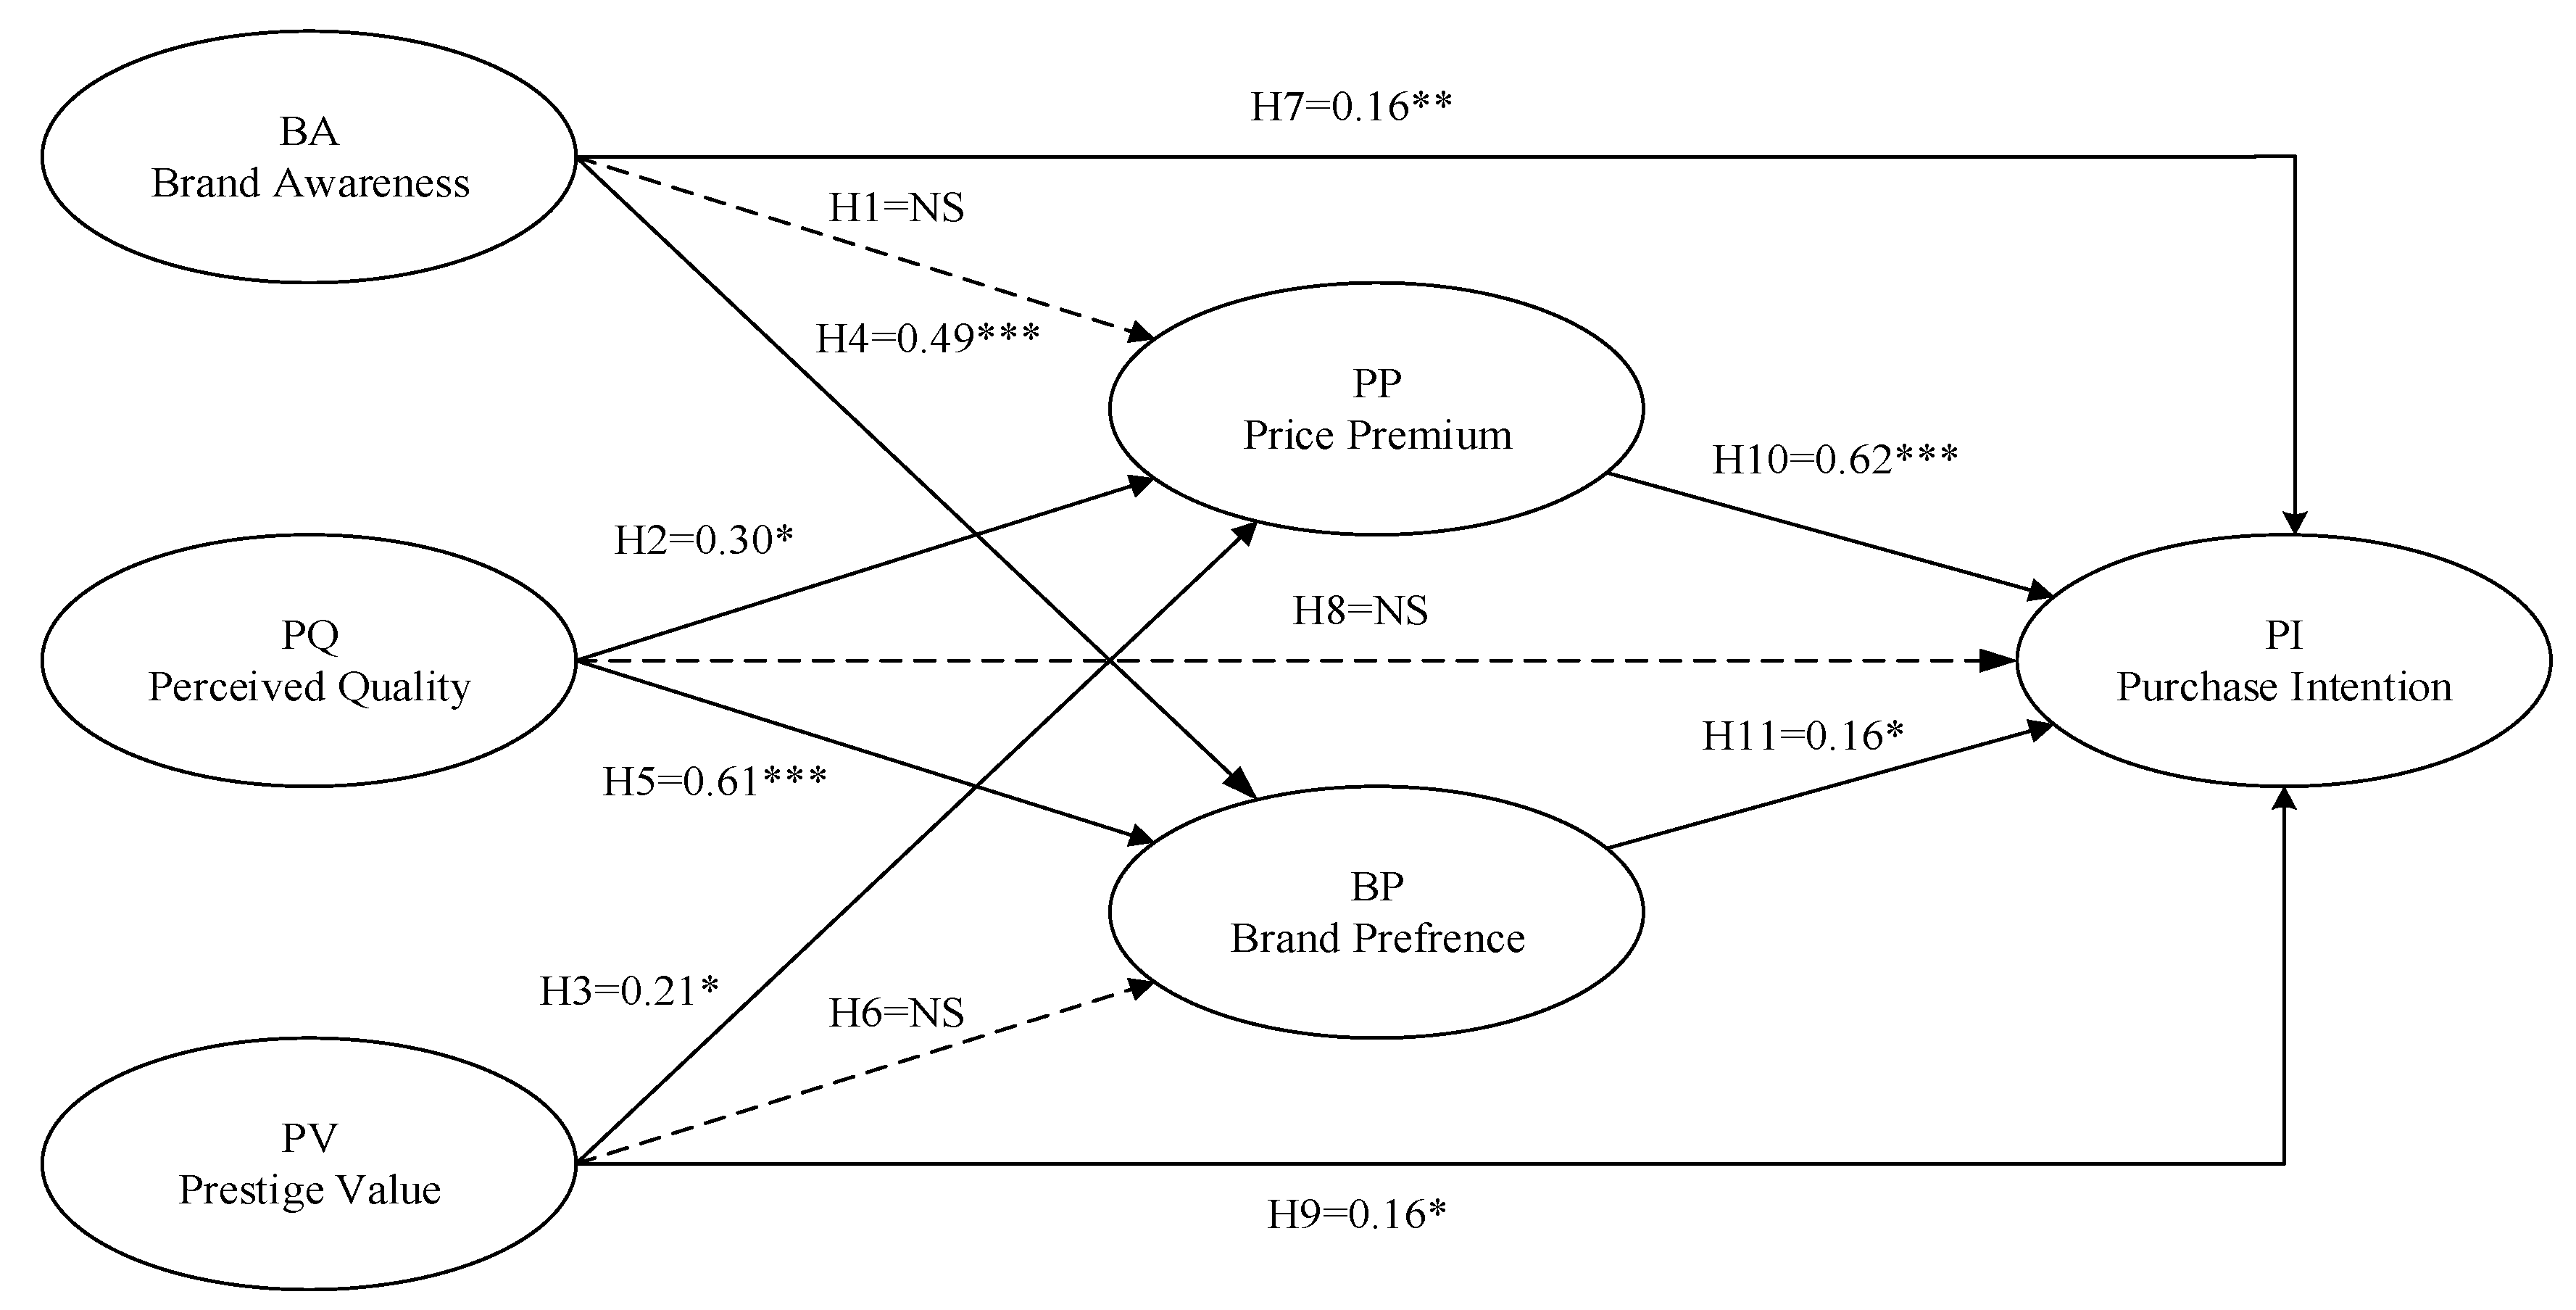
The result of SEM analyses indicates that for Apple, brand awareness does not have a significant sustainable influence on the price premium in the Taiwan smartphone market. This result is not consistent with the findings from Huang and Sarigöllü [
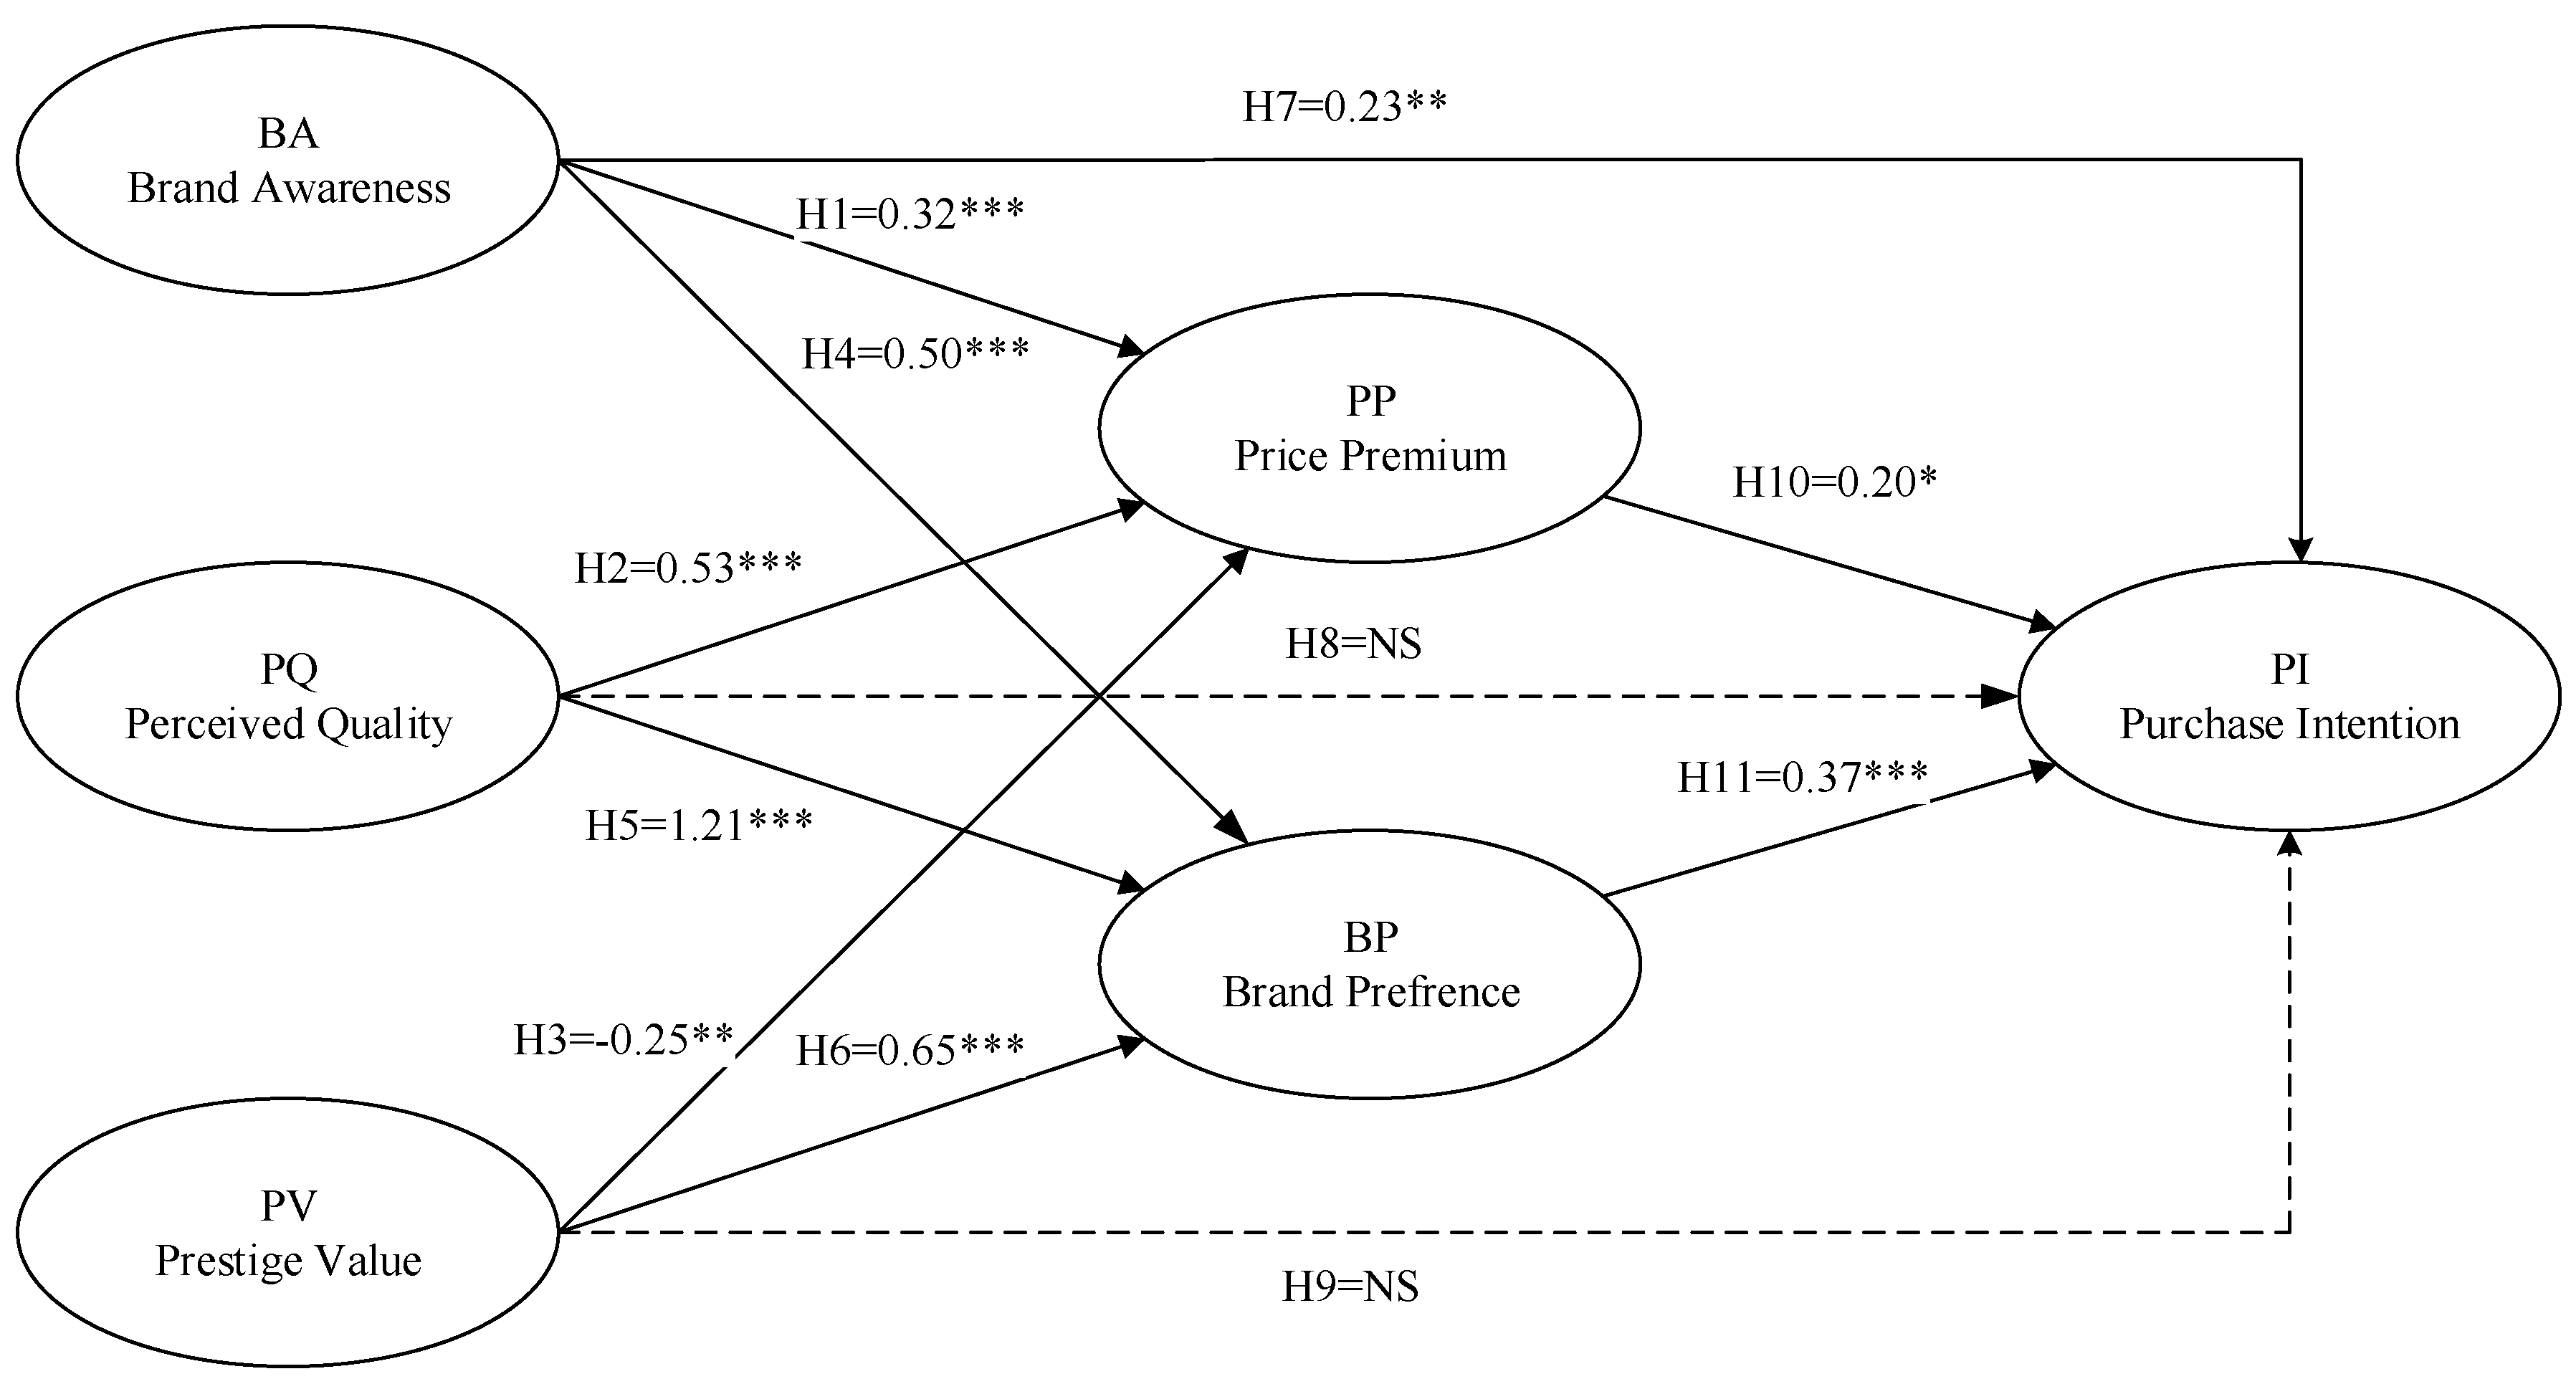
112], claiming that a positive relationship exists between brand awareness and price premium. Meanwhile, in the Indonesian smartphone market, brand awareness has a significant influence on the price premium (β = 0.32, 
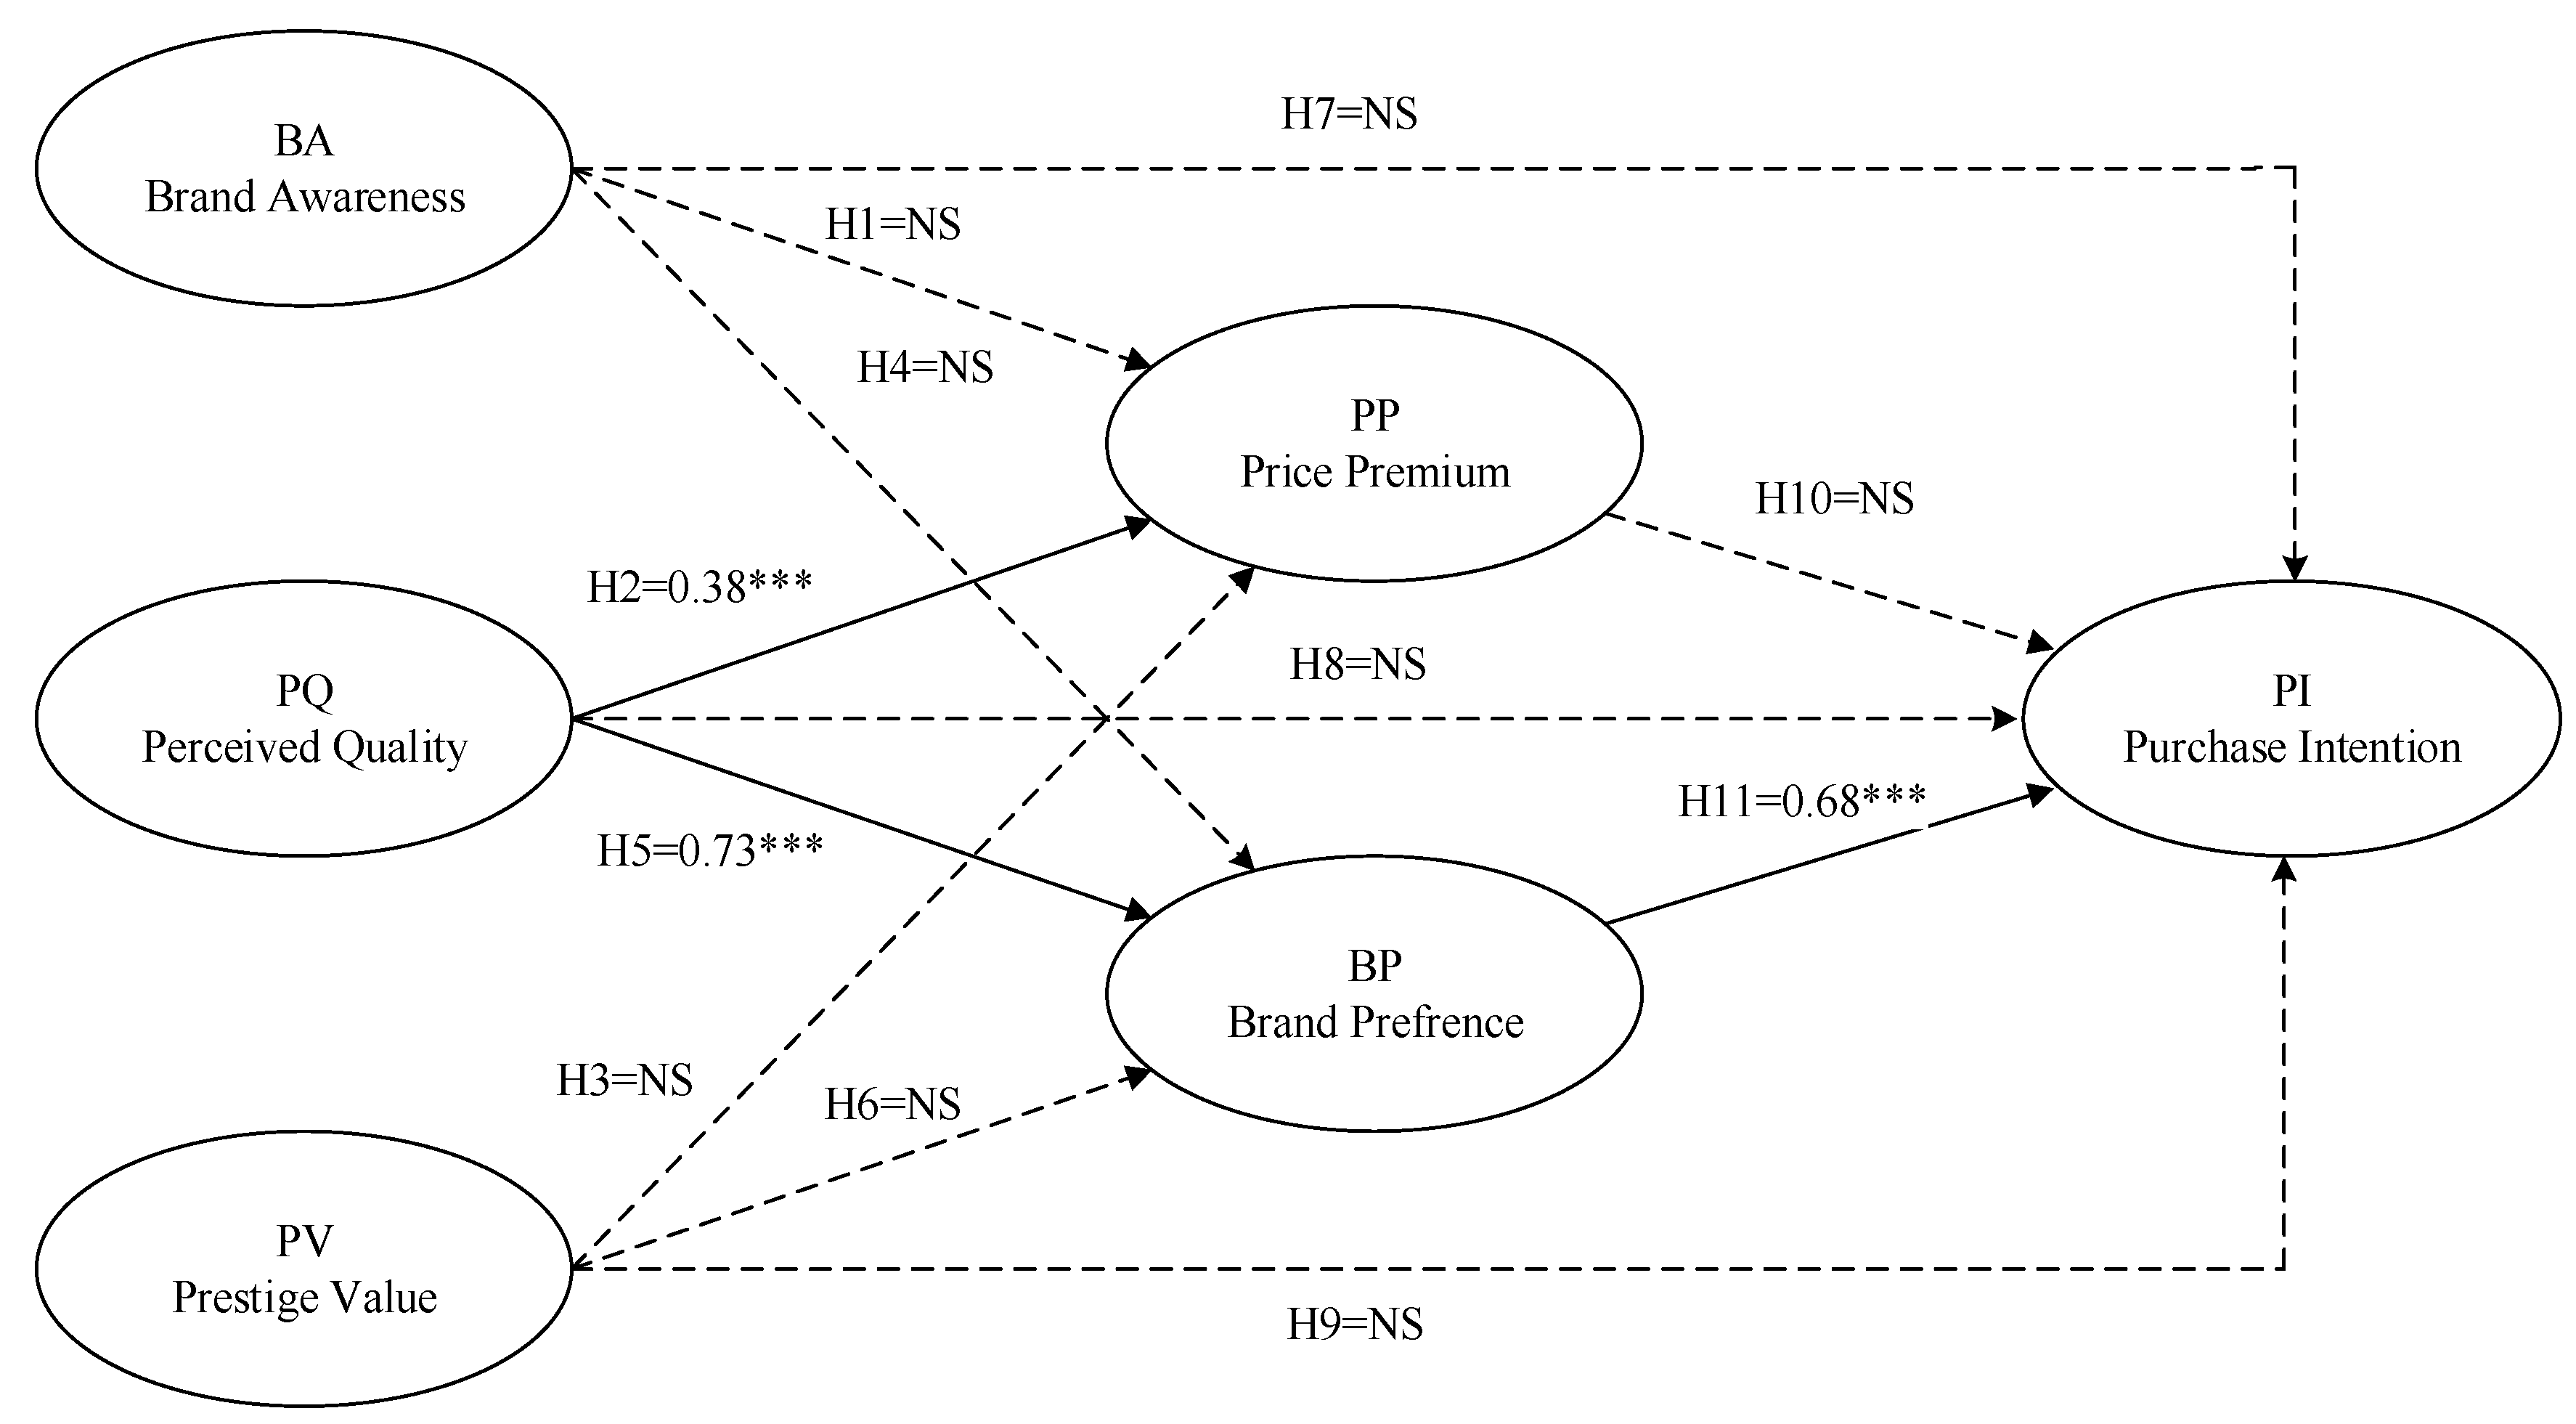
p < 0.001). Similarly, for HTC smartphones, brand awareness has no significant sustainable impact on the price premium for Taiwanese smartphone users. Nevertheless, brand awareness significantly influences price premium in the Indonesia smartphone market.
Hypothesis 2 (H2): PQ has a statistically significant influence on PP.
The results indicate that perceived quality significantly influences consumers’ purchase intention for both Apple (TW: β = 0.30, p < 0.001; IND: β = 0.53, p < 0.001) and HTC (TW: β = 0.38, p < 0.001; IND: β = 0.40, p < 0.001). Perceived quality in the proposed model is one of the important factors that influence both Taiwanese and Indonesian smartphone consumer willingness to pay a premium price for Apple and HTC smartphones. Therefore, no matter what product, and no matter where the product is sold, quality is always on consumers’ minds [69,73,74,75,76,113].
Hypothesis 3 (H3): PV has a statistically significant influence on PP.
Results show that the relationship between perceived prestige value and price premium for Apple is significant in Taiwan (β = 0.21, p < 0.05) and Indonesia (β = −0.25, p < 0.01). This finding is also supported by several researchers in previous studies [75,114]. However, in Indonesia, prestige value negatively influences price premium as consumers are not willing to pay for prestige. Not only are they not willing to pay for it, but they are against it. This may be due to respondents’ economic and financial background, as previously mentioned.
For HTC, however, the results are dissimilar to Apple. Perceived prestige value failed to influence price premium both in Taiwan and Indonesia markets significantly. Thus, Taiwanese and Indonesian consumers do not think of HTC as a prestigious brand and, therefore, not worth to pay more than what they should for it. This has important implications for HTC in terms of pricing their products.
Hypothesis 4 (H4): BA has a statistically significant influence on BP.
In a previous study, Buil et al. [83] stated that companies with higher brand awareness are able to generate a larger impact on consumers’ brand preferences. In line with that, researchers also found that in Indonesia, consumers’ brand preferences are significantly influenced by brand awareness both for Apple (β = 0.50, p < 0.001) and HTC (β = 0.24, p < 0.001). However, Taiwanese consumers have shown a different perspective. Their brand preference is not significantly impacted by brand awareness, both for Apple and HTC. It can be noted that Indonesian consumers are more likely to prefer a smartphone brand (Apple/HTC) with a famous name, while Taiwanese consumers tend to think that a famous name (Apple/HTC) is not the main reason for their brand preference.
Hypothesis 5 (H5): PQ has a statistically significant influence on BP.
Results indicate that in Indonesia and Taiwan markets, perceived quality strongly impacts consumers’ brand preferences for each of the compared smartphone brands, Apple (TW: β = 0.61, p < 0.001; IND: β = 0.54, p < 0.001) and HTC (TW: β = 0.73, p < 0.001; IND: β = 0.19, p < 0.01). Findings from previous research also support these results [78,84]. Therefore, as mentioned before, for both Indonesian and Taiwanese consumers of smartphones, perceived quality is an important factor when it comes to preferring a brand and paying a premium price for it.
Hypothesis 6 (H6): PV has a statistically significant influence on BP.
Hoeffler and Keller [41] suggest that brands with strong brand equity tend to get preferential evaluations and higher preference from consumers than those that do not. Indonesian customers seem to agree with this finding. The researchers discovered that in Indonesia, perceived prestige value has a statistically significant impact on brand preference for Apple (β = 0.65, p < 0.001) and HTC (β = 0.53, p < 0.001) products.
However, this finding does not apply to Taiwan. Our research reveals that in Taiwan, perceived value failed to significantly influence brand preferences both in the case of Apple and HTC products. In the Indonesia market, consumers value prestige and prefer to have a prestigious smartphone, however, they are not willing to pay for it. That is a clue for prestigious brands marking in Indonesia to keep the prices reasonably low. However, Taiwanese do not consider the perceived prestige value when preferring a smartphone to another.
Hypothesis 7 (H7): BA has a statistically significant influence on PI.
Hypothesis 8 (H8): PQ has a statistically significant influence on PI.
Hypothesis 9 (H9): PV has a statistically significant influence on PI.
There are a few studies discovering the relationship between brand awareness and purchase intention. In this vein, Chang and Liu [78], as well as San Martín et al. [45], state that brand awareness significantly influences purchase intention. In this study, researchers also discovered that for Apple products, purchase intention is an influential factor that can influence consumers’ purchase both in Taiwan (β = 0.16, p < 0.01) and Indonesia (β = 0.23, p < 0.05). In the case of HTC products, Indonesian smartphone consumers very weakly agree that brand awareness could increase their purchase intention to buy an HTC product (β = −0.015, p < 0.05). However, for Taiwanese, the total influence of BA on PI is insignificant. In this model, there are two mediating variables. Therefore, there may be an indirect influence.
Perceived quality failed to significantly influence purchase intention for Apple and HTC in both countries (Taiwan and Indonesia). For both Taiwanese and Indonesian consumers, quality is important. However, in this proposed model with the presence of the mediating variables, the indirect influence of PQ on PI should be studied.
Results of statistical analyses indicate that for Apple, Taiwanese consumers believe that PV is an influential factor that could increase their intention to purchase Apple (β = 0.16, p < 0.05). Conversely, Indonesian consumers do not think that the PV of Apple or HTC products is an important factor that can affect their purchase intention. Taiwanese and Indonesian consumers agree that their purchase intention cannot be affected by PV, verifying the previous results of a similar study on the same product [87].
Hypothesis 10 (H10): PP has a statistically significant influence on PI.
Hypothesis 11 (H11): BP has a statistically significant influence on PI.
Prior studies assume that consumers are more likely to purchase a particular product and are even willing to pay a price premium because its benefits meet their needs [5,95]. This study also found that for Apple, the price premium has an influential impact on purchase intention both in Taiwanese (β = 0.62, p < 0.001) and Indonesian (β = 0.20, p < 0.05) consumers’ minds.
However, Indonesian and Taiwanese consumers think that the price premium of the HTC smartphone product does not have an essential role in influencing their purchase intention. Thus, researchers conclude that Taiwanese and Indonesian perceive that a premium price tag put on HTC is not going to influence their purchase intention.
Comparing smartphone brands, Apple and HTC, brand preference has a strong influence on purchase intention in Taiwan (Apple: β = 0.16, p < 0.05; HTC: β = 0.68, p < 0.001) and Indonesia (Apple: β = 0.37, p < 0.001; HTC: β = 0.900, p < 0.001). Hellier et al. [98] state that brand preference is one essential factor that could influence consumers’ purchase intention. When consumers have a favorable preference for a smartphone brand, they will be more likely to purchase it. Similarly, the present findings are consistent with previous work that supports the significant role of brand preference in predicting consumer purchase intention.
For Apple, Taiwanese smartphone consumers stated that the key factors that influence their intention to purchase the brand are its high brand awareness, certain value they perceive when owning or using Apple, its price premium that makes them feel more prestigious and luxurious, and their personal preferences for the Apple brand. Meanwhile, Indonesian consumers have a slightly different opinion. Indonesian consumers perceive that brand awareness, price premium, and brand preference could have an impact on their purchasing intention. However, they disagree that perceived value is an important and influential factor when purchasing Apple products.
Notwithstanding, in terms of HTC, the findings suggest that brand awareness is the only independent variable that can influence both Indonesian and Taiwanese consumers. Perceived quality is the only variable that failed to influence both Taiwanese and Indonesian consumers’ purchase intentions for Apple or HTC. The researchers conclude that nowadays, Taiwanese and Indonesian consumers would prefer a smartphone that has higher brand awareness and their personal brand preferences rather than quality when purchasing smartphones. They feel more up-to-date, stylish, and trendy when owning a smartphone that has a higher brand awareness regardless of its quality, rather than a smartphone advertising good quality but with low brand awareness. The decline of worldwide sales for HTC is possibly due to its decreasing brand awareness. HTC needs to redefine its branding and marketing strategy to increase its brand awareness in order to increase sales among Taiwanese and Indonesian consumers. According to the present study’s findings, Taiwanese and Indonesian consumers still have a favorable purchase intention for HTC due to their personal brand preferences and loyalty towards this brand and its products.

5.2. Conclusions and Implications

The results of the study provide a deeper understanding of the sustainable relationships among brand equity subsets, price premium, brand preference, brand awareness, and purchase intention. In a general sense, our study recommends essential guidelines to international smartphone marketers who are planning to introduce or expand a sustainable marketing strategy. The proposed model focused on testing the brand sustainability relationships among the study constructs. The findings provide useful information to predict consumer tendencies to buy specific brands that would assist marketers in developing strategies in the Indonesian and Taiwanese markets to increase purchase intention for the brands. The results of this study point out several valuable conclusions regarding brand sustainability and marketing sustainability [1].
The first finding indicates a lack of sustainable support for the influence of brand awareness on price premium in Taiwan for both HTC and Apple smartphones. Our conclusion of this finding is that for Taiwanese, despite their awareness of different brands, the price they are willing to pay off a smartphone product (HTC or Apple) does not rely on their brand awareness. In Taiwan, consumers are well-aware of the products and may be willing to pay the higher price, but perhaps due to other variables such as prestige and quality. Meanwhile, Indonesian smartphone consumers’ awareness of the product is an important factor in determining the price they are willing to pay for that product. Indonesian consumers are more selective and more careful when it comes to paying premium prices. This also could be explained by the GDP (nominal) per capita for each country. In 2019, the GDP (nominal) per capita for Taiwan and Indonesia was $25,447 and $4120, respectively [115]. There is a significant (6:1) ratio difference between the GDP (nominal) per capita for Taiwan and Indonesia. However, there is no significant difference in the average price of genuine HTC and Apple in Taiwan and Indonesia [116]. Indonesian consumers are more careful about paying higher prices.
Perceived quality is an influential sustainable factor on the price premium. Indonesian and Taiwanese consumers are aware of HTC and Apple smartphone qualities and are willing to pay a price premium for those brands. There is no surprise element in this finding as it supports previous finding vis-à-vis different products in different countries [69,73,75,76,113].
Neither Taiwanese nor Indonesian consumers perceive HTC as a prestigious brand. For the Taiwanese population, this finding is consistent with a similar previous study of HTC in Taiwan [117]. The results, however, are different for Apple smartphones. Apple smartphones are perceived as prestigious in both Taiwan and Indonesia. The influence of prestige value on the price premium is, however, very different. Taiwanese consumers, perhaps due to a higher standard of living, are willing to pay a premium price for a prestigious product. In other words, for Taiwanese, it is worth to pay more for luxury. It is a matter of social status and feeling unique. For Indonesian consumers, if a product is perceived as prestigious, then it has to be more expensive for no good reason rather than prestige. Indonesian consumers pay for the quality of the smartphone, but not for the brand name. The perception is that if a smartphone is a prestigious global brand, it carries higher prices. This is not a surprising finding for countries with low GDP per capita [118,119].
Taiwanese consumers perceived awareness and perceived prestige of HTC and Apple smartphones do no influence their brand preference. For Taiwanese consumers, quality plays the only role in influencing their brand preference of HTC and Apple. For Indonesian consumers, brand awareness, perceived quality, and prestige value are all influential factors in their preference of HTC and Apple smartphones. From the results of this study, we can also conclude that the direct influence of brand awareness, perceived quality, and prestige value on purchase intention is not sustainable. The influence of the price premium of Apple smartphones on the decision to buy this brand is sustainable both in Taiwan ad Indonesia. For HTC, however, the significance of the price premium on purchase intention is non-significant. Indonesian and Taiwanese consumers will purchase the brand they prefer the most. This variable is highly influential for the HTC brand in Taiwan and Indonesia.
The findings of this study highlight the sustainable role of perceived quality as a valuable parameter regarding consumer brand preferences and price premium for both brands in both countries. Thus, brand managers should emphasize raising consumer’s awareness of the quality of the product, perhaps through planned advertising programs or developing applications that raise consumer perceived quality. Emphasis on product quality through the company’s website, retailer’s site, or even through social media will enhance consumer awareness preference, and purchase intention. Creating and strengthening brand equity is a critical approach for companies that generate high value for consumers, resulting in purchase intention, and conclusively improving brand market position for the company.

5.3. Limitation and Future Research

In the current study, some aspects define the limitations and provide new directions for future research. First of all, this study is limited to only Taiwanese and Indonesian smartphone consumers. Therefore, the representativeness of the sample might contain unexpected bias. Future research should expand the demographic diversity of the samples to verify the results.
Secondly, this study is limited to only three aspects, which are brand equity (brand awareness, perceived value, and perceived quality), price premium, and brand preferences. However, when it comes to forecasting purchase intention, several other factors may be influential. For instance, external factors relevant to consumer’s purchase intention can be included in the model, such as brand reputation or advertising. Besides, as the direct effect of brand preference and price was analyzed, the mediation analysis would be interesting to study further. Considering the comparative notion of our research in two different countries with diverse cultural backgrounds, moderating variables are recommended to be employed, such as cultural beliefs or attitudes. Moreover, this study only compared two smartphone brands, Apple and HTC, while future studies may consider other popular smartphone brands, such as Samsung, Huawei, Oppo, and Xiaomi, to see the differences between these brands when forecasting consumer purchase likelihood. Finally, our model did not deal with control variables, and it is suggested to take into account the role of possible elements, such as sociodemographic variables that may affect the results.
One suggestion for a future study is to take into consideration the significant differences between Indonesians and Taiwanese in their perception of each variable. We believe that it will be beneficial to additionally attempt multi-group analysis for the groupings presented in this study. As such, it will provide better insights on the significant or non-significant relationships established in this study. It will be interesting to see how different brands perform in each country. The future study can explore and compare the model further. More importantly, the role of the mediator can be explored in each country and for each brand. The unsustainable direct influences of brand awareness, perceived quality, and prestige value on purchase intention are hinting toward the possibility of sustainable indirect results thought price premium and brand preferences.
This paper studies the sustainability of brand survival. Extension of our paper could expand to investigate other sustainable issues. For example, one could extend Moslehpour et al. [87,120,121] to study the sustainability of e-business and consumer behavior. Academics and practitioners could also extend Pham et al. [122] and Mou et al. [123] to study the sustainability of outsourcing and supply chains or extend the sustainability studies of funds, futures markets Wong et al. [124,125], and stock market Batmunkh et al. [126].

Author Contributions

Conceptualization, M.M. and A.D.; Data curation, A.D.; Formal analysis, A.D.; Funding acquisition, M.M., K.Y.C. and A.D.; Methodology, M.M.; Project administration, M.M.; Resources, K.Y.C. and A.D.; Supervision, M.M.; Writing–original draft, M.M.; Writing–review editing, M.M., A.D., B.-R.D. and V.S.

Funding

This research received no external funding.

Conflicts of Interest

The authors declare no conflict of interest.

References

  1. Rishi, M.; Jauhari, V.; Joshi, G. Marketing sustainability in the luxury lodging industry: A thematic analysis of preferences amongst the Indian transition generation. J. Consum. Mark. 2015, 32, 376–391. [Google Scholar] [CrossRef]
  2. Gupta, S.; Czinkota, M.; Melewar, T. Embedding knowledge and value of a brand into sustainability for differentiation. J. World. Bus. 2013, 48, 287–296. [Google Scholar] [CrossRef]
  3. Kuchinka, D.; Balazs, S.; Gavriletea, M.; Djokic, B.-B. Consumer attitudes toward sustainable development and risk to brand loyalty. Sustainability 2018, 10, 997. [Google Scholar] [CrossRef] [Green Version]
  4. Kumar, V.; Christodoulopoulou, A. Sustainability and branding: An integrated perspective. Ind. Mark. Manag. 2014, 43, 6–15. [Google Scholar] [CrossRef]
  5. Keller, K.L.; Parameswaran, M.; Jacob, I. Strategic Brand Management: Building, Measuring, and Managing Brand equity; Pearson Education India: Bengaluru, India, 2011. [Google Scholar]
  6. Iglesias, O.; Markovic, S.; Rialp, J. How does sensory brand experience influence brand equity? Considering the roles of customer satisfaction, customer affective commitment, and employee empathy. J. Bus. Res. 2019, 96, 343–354. [Google Scholar] [CrossRef]
  7. Aaker, D. Managing brand equity: Capitalizing on the value of a brand name: David A. Aaker, The Free Press, New York (1991). J. Bus. Res. 1994, 29, 247–248. [Google Scholar]
  8. Fishbein, M.; Ajzen, I. Belief, Attitude, Intention, and Behavior: An Introduction to Theory and Research. 1977. Available online: https://philarchive.org/archive/FISBAI (accessed on 20 July 2019).
  9. Global Mobile Market Report. Top 50 Countries/Markets by Smartphone Users and Penetration. Available online: https://newzoo.com/insights/rankings/top-50-countries-by-smartphone-penetration-and-users/ (accessed on 18 July 2018).
  10. StatCounter. Search Engine Market Share Worldwide. Available online: https://gs.statcounter.com/vendor-market-share/mobile/worldwide (accessed on 10 June 2019).
  11. Zarkov, G. Why did HTC Smartphones Go from Popular to Obscure? Available online: https://www.phonearena.com/news/why-HTC-smartphones-lost-popularity-market-share_id113614 (accessed on 15 May 2019).
  12. Chen, C.-M.; Ann, B.-Y. Efficiencies vs. importance-performance analysis for the leading smartphone brands of Apple, Samsung and HTC. Total. Qual. Manag. Bus. Excel. 2016, 27, 227–249. [Google Scholar] [CrossRef]
  13. Akturan, U. How does greenwashing affect green branding equity and purchase intention? An empirical research. Mark. Intell. Plan. 2018, 36, 809–824. [Google Scholar] [CrossRef]
  14. Aaker, D.A. Measuring brand equity across products and markets. Calif. Manag. Rev. 1996, 38, 3. [Google Scholar] [CrossRef]
  15. Wee, R.Y. Which Country Has the Largest Number of Cellphones? Available online: https://www.worldatlas.com/articles/10-countries-with-the-highest-rates-of-cellphonesubscriptions.html (accessed on 19 July 2019).
  16. Brakus, J.J.; Schmitt, B.H.; Zarantonello, L. Brand experience: what is it? How is it measured? Does it affect loyalty? J. Mark. 2009, 73, 52–68. [Google Scholar] [CrossRef]
  17. Park, C.W.; MacInnis, D.J.; Priester, J.; Eisingerich, A.B.; Iacobucci, D. Brand attachment and brand attitude strength: Conceptual and empirical differentiation of two critical brand equity drivers. J. Mark. 2010, 74, 1–17. [Google Scholar] [CrossRef] [Green Version]
  18. Phung, M.T.; Ly, P.T.M.; Nguyen, T.T. The effect of authenticity perceptions and brand equity on brand choice intention. J. Bus. Res. 2019. [Google Scholar] [CrossRef]
  19. Sasmita, J.; Mohd Suki, N. Young consumers’ insights on brand equity: Effects of brand association, brand loyalty, brand awareness, and brand image. Int. J. Retail. Distrib. Manag. 2015, 43, 276–292. [Google Scholar] [CrossRef]
  20. Wang, K.; Jiang, W. Brand equity and firm sustainable performance: The mediating role of analysts’ recommendations. Sustainability 2019, 11, 1086. [Google Scholar] [CrossRef] [Green Version]
  21. Hariharan, V.G.; Desai, K.K.; Talukdar, D.; Inman, J.J. Shopper marketing moderators of the brand equity–behavioral loyalty relationship. J. Bus. Res. 2018, 85, 91–104. [Google Scholar] [CrossRef]
  22. Yoo, B.; Donthu, N.; Lee, S. An examination of selected marketing mix elements and brand equity. J. Acad. Mark. Sci. 2000, 28, 195–211. [Google Scholar] [CrossRef]
  23. Mohd Yasin, N.; Nasser Noor, M.; Mohamad, O. Does image of country-of-origin matter to brand equity? J. Prod. Brand Manag. 2007, 16, 38–48. [Google Scholar] [CrossRef]
  24. Foroudi, P.; Jin, Z.; Gupta, S.; Foroudi, M.M.; Kitchen, P.J. Perceptional components of brand equity: Configuring the Symmetrical and Asymmetrical Paths to brand loyalty and brand purchase intention. J. Bus. Res. 2018, 89, 462–474. [Google Scholar] [CrossRef] [Green Version]
  25. Keller, K.L.; Lehmann, D.R. How do brands create value? Mark. Manag. 2003, 12, 26. [Google Scholar]
  26. Park, C.S.; Srinivasan, V. A survey-based method for measuring and understanding brand equity and its extendibility. J. Mark. Res. 1994, 31, 271–288. [Google Scholar] [CrossRef]
  27. Bailey, R.; Ball, S. An exploration of the meanings of hotel brand equity. Serv. Ind. J. 2006, 26, 15–38. [Google Scholar] [CrossRef]
  28. Christodoulides, G.; De Chernatony, L. Consumer-based brand equity conceptualization and measurement: A literature review. Int. J. Res. Mark. 2010, 52, 43–66. [Google Scholar] [CrossRef] [Green Version]
  29. Kim, E.Y.; Knight, D.K.; Pelton, L.E. Modeling brand equity of a US apparel brand as perceived by Generation Y consumers in the emerging Korean market. Cloth. Text. Res. J. 2009, 27, 247–258. [Google Scholar] [CrossRef]
  30. Yoo, B.; Donthu, N. Developing and validating a multidimensional consumer-based brand equity scale. J. Bus. Res. 2001, 52, 1–14. [Google Scholar] [CrossRef]
  31. Su, J. Examining the relationships among the brand equity dimensions: empirical evidence from fast fashion. Asis. Pac. J. Mark. Logist. 2016, 28, 464–480. [Google Scholar] [CrossRef]
  32. Hepola, J.; Karjaluoto, H.; Hintikka, A. The effect of sensory brand experience and involvement on brand equity directly and indirectly through consumer brand engagement. J. Prod. Brand Manag. 2017, 26, 282–293. [Google Scholar] [CrossRef] [Green Version]
  33. Lassar, W.; Mittal, B.; Sharma, A. Measuring customer-based brand equity. J. Consum. Mark. 1995, 12, 11–19. [Google Scholar] [CrossRef]
  34. Henning, V.; Hennig-Thurau, T.; Feiereisen, S. Giving the expectancy-value model a heart. Psychol. Mark. 2012, 29, 765–781. [Google Scholar] [CrossRef]
  35. Allen, C.T.; Machleit, K.A.; Kleine, S.S.; Notani, A.S. A place for emotion in attitude models. J. Bus. Res. 2005, 58, 494–499. [Google Scholar] [CrossRef]
  36. Arbouw, P.; Ballantine, P.W.; Ozanne, L.K. Sustainable brand image: An examination of ad–brand incongruence. Mark. Intell. Plan. 2019. [Google Scholar] [CrossRef]
  37. Li, C.; Cui, Z.; Chen, J.; Zhou, N. Brand revitalization of heritage enterprises for cultural sustainability in the digital era: A case study in China. Sustainability 2019, 11, 1769. [Google Scholar] [CrossRef] [Green Version]
  38. Aaker, D.A. The value of brand equity. J. Bus. Strategy 1992, 13, 27–32. [Google Scholar] [CrossRef]
  39. Hutter, K.; Hautz, J.; Dennhardt, S.; Füller, J. The impact of user interactions in social media on brand awareness and purchase intention: the case of MINI on Facebook. J. Prod. Brand Manag. 2013, 22, 342–351. [Google Scholar] [CrossRef] [Green Version]
  40. Chi, H.K.; Yeh, H.R.; Yang, Y.T. The impact of brand awareness on consumer purchase intention: The mediating effect of perceived quality and brand loyalty. J. Int. Manag. Stud. 2009, 4, 135–144. [Google Scholar]
  41. Hoeffler, S.; Keller, K.L. The marketing advantages of strong brands. J. Brand Manag. 2003, 10, 421–445. [Google Scholar] [CrossRef]
  42. Romaniuk, J.; Wight, S.; Faulkner, M. Brand awareness: Revisiting an old metric for a new world. J. Prod. Brand Manag. 2017, 26, 469–476. [Google Scholar] [CrossRef]
  43. Ahn, J.; Park, J.K.; Hyun, H. Luxury product to service brand extension and brand equity transfer. J. Retail. Consum. Serv. 2018, 42, 22–28. [Google Scholar] [CrossRef]
  44. Çifci, S.; Ekinci, Y.; Whyatt, G.; Japutra, A.; Molinillo, S.; Siala, H. A cross validation of Consumer-Based Brand Equity models: Driving customer equity in retail brands. J. Bus. Res. 2016, 69, 3740–3747. [Google Scholar] [CrossRef] [Green Version]
  45. San Martín, H.; Herrero, A.; García de los Salmones, M.d.M. An integrative model of destination brand equity and tourist satisfaction. Curr. Issues Tour. 2019, 22, 1992–2013. [Google Scholar] [CrossRef]
  46. Chow, H.-w.; Ling, G.-J.; Yen, I.-y.; Hwang, K.-P. Building brand equity through industrial tourism. Asia Pac. Manag. Rev. 2017, 22, 70–79. [Google Scholar] [CrossRef]
  47. Kim, S.S.; Choe, J.Y.J.; Petrick, J.F. The effect of celebrity on brand awareness, perceived quality, brand image, brand loyalty, and destination attachment to a literary festival. J. Destin. Mark. Manag. 2018, 9, 320–329. [Google Scholar] [CrossRef]
  48. Kapferer, J.-N.; Valette-Florence, P. The impact of brand penetration and awareness on luxury brand desirability: A cross country analysis of the relevance of the rarity principle. J. Bus. Res. 2018, 83, 38–50. [Google Scholar] [CrossRef]
  49. Cronin Jr, J.J.; Brady, M.K.; Hult, G.T.M. Assessing the effects of quality, value, and customer satisfaction on consumer behavioral intentions in service environments. J. Retail. 2000, 76, 193–218. [Google Scholar] [CrossRef]
  50. Konuk, F.A. The role of store image, perceived quality, trust and perceived value in predicting consumers’ purchase intentions towards organic private label food. J. Retail. Consum. Serv. 2018, 43, 304–310. [Google Scholar] [CrossRef]
  51. Ramaseshan, B.; Tsao, H.-Y. Moderating effects of the brand concept on the relationship between brand personality and perceived quality. J. Brand. Manag. 2007, 14, 458–466. [Google Scholar] [CrossRef]
  52. Zeithaml, V.A. Consumer perceptions of price, quality, and value: a means-end model and synthesis of evidence. J. Mark. 1988, 52, 2–22. [Google Scholar] [CrossRef]
  53. Vera, J. Perceived brand quality as a way to superior customer perceived value crossing by moderating effects. J. Prod. Brand Manag. 2015, 24, 147–156. [Google Scholar] [CrossRef]
  54. Yang, Z.; Sun, S.; Lalwani, A.K.; Janakiraman, N. How Does Consumers’ Local or Global Identity Influence Price–Perceived Quality Associations? The Role of Perceived Quality Variance. J. Mark. 2019, 83, 145–162. [Google Scholar] [CrossRef] [Green Version]
  55. Baksi, S.; Bose, P.; Xiang, D. Credence goods, misleading labels, and quality differentiation. Environ. Resour. Econ. 2017, 68, 377–396. [Google Scholar] [CrossRef]
  56. Baldauf, A.; Cravens, K.S.; Binder, G. Performance consequences of brand equity management: evidence from organizations in the value chain. J. Prod. Brand Manag. 2003, 12, 220–236. [Google Scholar] [CrossRef]
  57. Theurer, C.P.; Tumasjan, A.; Welpe, I.M.; Lievens, F. Employer branding: A brand equity-based literature review and research agenda. Int. J. Manag. Rev. 2018, 20, 155–179. [Google Scholar] [CrossRef]
  58. Kadirov, D. Private labels ain’t bona fide! Perceived authenticity and willingness to pay a price premium for national brands over private labels. J. Mark. Manag. 2015, 31, 1773–1798. [Google Scholar] [CrossRef]
  59. Monga, A.B.; John, D.R. What makes brands elastic? The influence of brand concept and styles of thinking on brand extension evaluation. J. Mark. 2010, 74, 80–92. [Google Scholar] [CrossRef]
  60. O’Shaughnessy, J.; Jackson O’Shaughnessy, N. Marketing, the consumer society and hedonism. Eur. J. Mark. 2002, 36, 524–547. [Google Scholar] [CrossRef] [Green Version]
  61. Steenkamp, J.-B.E.; Batra, R.; Alden, D.L. How perceived brand globalness creates brand value. J. Int. Bus. Stud. 2003, 34, 53–65. [Google Scholar] [CrossRef]
  62. Truong, Y.; McColl, R.; Kitchen, P.J. New luxury brand positioning and the emergence of masstige brands. J. Brand. Manag. 2009, 16, 375–382. [Google Scholar] [CrossRef]
  63. Sung, Y.; Choi, S.M.; Ahn, H.; Song, Y.A. Dimensions of luxury brand personality: Scale development and validation. Psychol. Mark. 2015, 32, 121–132. [Google Scholar] [CrossRef]
  64. Choi, E.; Lee, K.C. Effect of Trust in Domain-Specific Information of Safety, Brand Loyalty, and Perceived Value for Cosmetics on Purchase Intentions in Mobile E-Commerce Context. Sustainability 2019, 11, 6257. [Google Scholar] [CrossRef] [Green Version]
  65. Hwang, Y.; Ko, E.; Megehee, C.M. When higher prices increase sales: How chronic and manipulated desires for conspicuousness and rarity moderate price’s impact on choice of luxury brands. J. Bus. Res. 2014, 67, 1912–1920. [Google Scholar] [CrossRef]
  66. Baek, T.H.; Kim, J.; Yu, J.H. The differential roles of brand credibility and brand prestige in consumer brand choice. Psychol. Mark. 2010, 27, 662–678. [Google Scholar] [CrossRef] [Green Version]
  67. Li, G.; Li, G.; Kambele, Z. Luxury fashion brand consumers in China: Perceived value, fashion lifestyle, and willingness to pay. J. Bus. Res. 2012, 65, 1516–1522. [Google Scholar] [CrossRef]
  68. Wong, A.; Zhou, L. Consumers’ motivations for consumption of foreign products: An empirical test in the People’s Republic of China. U21Global Working Paper. 2005. [Google Scholar] [CrossRef]
  69. Kurokawa, S.; Matsubayashi, N. Price and quality competition with quality positions. J. Econ. Manag. Strategy 2018, 27, 71–81. [Google Scholar] [CrossRef]
  70. El-Adly, M.I. Modelling the relationship between hotel perceived value, customer satisfaction, and customer loyalty. J. Retail. Consum. Serv. 2019, 50, 322–332. [Google Scholar] [CrossRef]
  71. Wang, J.; Wallendorf, M. Materialism, status signaling, and product satisfaction. J. Acad. Mark. Sci. 2006, 34, 494–505. [Google Scholar] [CrossRef]
  72. Yu, J. Verification of the Role of the Experiential Value of Luxury Cruises in Terms of Price Premium. Sustainability 2019, 11, 3219. [Google Scholar] [CrossRef] [Green Version]
  73. Netemeyer, R.G.; Krishnan, B.; Pullig, C.; Wang, G.; Yagci, M.; Dean, D.; Ricks, J.; Wirth, F. Developing and validating measures of facets of customer-based brand equity. J. Bus. Res. 2004, 57, 209–224. [Google Scholar] [CrossRef]
  74. Dwivedi, A.; Nayeem, T.; Murshed, F. Brand experience and consumers’ willingness-to-pay (WTP) a price premium: Mediating role of brand credibility and perceived uniqueness. J. Retail. Consum. Serv. 2018, 44, 100–107. [Google Scholar] [CrossRef]
  75. Bougenvile, A.; Ruswanti, E. Brand Equity on Purchase Intention Consumers’ Willingness to Pay Premium Price Juice. J. Econ. Fin. 2017, 8, 12–18. [Google Scholar] [CrossRef]
  76. Gómez, M.; Martín-Consuegra, D.; Díaz, E.; Molina, A. Determinants and outcomes of price premium and loyalty: A food case study. J. Consum. Behav. 2018, 17, 64–74. [Google Scholar] [CrossRef]
  77. Ebrahim, R.; Ghoneim, A.; Irani, Z.; Fan, Y. A brand preference and repurchase intention model: The role of consumer experience. J. Mark. Manag. 2016, 32, 1230–1259. [Google Scholar] [CrossRef] [Green Version]
  78. Chang, H.H.; Liu, Y.M. The impact of brand equity on brand preference and purchase intentions in the service industries. Serv. Ind. J. 2009, 29, 1687–1706. [Google Scholar] [CrossRef]
  79. Rundle-Thiele, S.; Maio Mackay, M. Assessing the performance of brand loyalty measures. J. Serv. Mark. 2001, 15, 529–546. [Google Scholar] [CrossRef]
  80. Gensch, D.H. A two-stage disaggregate attribute choice model. Mark. Sci. 1987, 6, 223–239. [Google Scholar] [CrossRef]
  81. Roberts, J.H.; Lattin, J.M. Development and testing of a model of consideration set composition. J. Mark. Res. 1991, 28, 429–440. [Google Scholar] [CrossRef]
  82. Mathur, A.; Moschis, G.P.; Lee, E. Life events and brand preference changes. J. Consum. Behav. Int. Res. Rev. 2003, 3, 129–141. [Google Scholar] [CrossRef]
  83. Buil, I.; Martínez, E.; De Chernatony, L. The influence of brand equity on consumer responses. J. Consum. Mark. 2013, 30, 62–74. [Google Scholar] [CrossRef] [Green Version]
  84. Wang, E.S.-T. Impact of multiple perceived value on consumers’ brand preference and purchase intention: a case of snack foods. J. Food Prod. Mark. 2010, 16, 386–397. [Google Scholar] [CrossRef]
  85. Milberg, S.J.; Sinn, F. Vulnerability of global brands to negative feedback effects. J. Bus. Res. 2008, 61, 684–690. [Google Scholar] [CrossRef]
  86. Halkias, G.; Davvetas, V.; Diamantopoulos, A. The interplay between country stereotypes and perceived brand globalness/localness as drivers of brand preference. J. Bus. Res. 2016, 69, 3621–3628. [Google Scholar] [CrossRef]
  87. Moslehpour, M.; Wong, W.-K.; Lin, Y.H.; Nguyen, T.L.H. Top purchase intention priorities of Vietnamese low cost carrier passengers: expectations and satisfaction. Eurasian Bus. Rev. 2018, 8, 371–389. [Google Scholar] [CrossRef]
  88. Kim, A.J.; Ko, E. Impacts of luxury fashion brand’s social media marketing on customer relationship and purchase intention. J. Glob. Fash. Mark. 2010, 1, 164–171. [Google Scholar] [CrossRef]
  89. Ha, S.; Stoel, L. Consumer e-shopping acceptance: Antecedents in a technology acceptance model. J. Bus. Res. 2009, 62, 565–571. [Google Scholar] [CrossRef]
  90. Das, G.; Agarwal, J.; Malhotra, N.K.; Varshneya, G. Does brand experience translate into brand commitment?: A mediated-moderation model of brand passion and perceived brand ethicality. J. Bus. Res. 2019, 95, 479–490. [Google Scholar] [CrossRef]
  91. Gatti, L.; Caruana, A.; Snehota, I. The role of corporate social responsibility, perceived quality and corporate reputation on purchase intention: Implications for brand management. J. Brand Manag. 2012, 20, 65–76. [Google Scholar] [CrossRef]
  92. Cobb-Walgren, C.J.; Ruble, C.A.; Donthu, N. Brand equity, brand preference, and purchase intent. J. Advert. 1995, 24, 25–40. [Google Scholar] [CrossRef]
  93. Gunawardane, N.R. Impact of brand equity towards purchasing desition: a situation on mobile telecommunication services of Sri Lanka. 2015. Available online: http://jmm-net.com/journals/jmm/Vol_3_No_1_June_2015/10.pdf (accessed on 15 May 2019).
  94. Ashill, N.J.; Sinha, A. An exploratory study into the impact of components of brand equity and country of origin effects on purchase intention. Asia Pac. Bus. Rev. 2004, 5, 27–43. [Google Scholar] [CrossRef]
  95. Broekhuizen, T.L.J.; Alsem, K.J. Success factors for mass customization: A conceptual model. J. Mark. Focused Manag. 2002, 5, 309–330. [Google Scholar] [CrossRef]
  96. Wind, J.; Rangaswamy, A. Customerization: The next revolution in mass customization. J. Interact. Mark. 2001, 15, 13–32. [Google Scholar] [CrossRef]
  97. Moon, J.; Chadee, D.; Tikoo, S. Culture, product type, and price influences on consumer purchase intention to buy personalized products online. J. Bus. Res. 2008, 61, 31–39. [Google Scholar] [CrossRef] [Green Version]
  98. Hellier, P.K.; Geursen, G.M.; Carr, R.A.; Rickard, J.A. Customer repurchase intention: A general structural equation model. Eur. J. Mark. 2003, 37, 1762–1800. [Google Scholar] [CrossRef] [Green Version]
  99. Pappu, R.; Quester, P.G.; Cooksey, R.W. Consumer-based brand equity: improving the measurement–empirical evidence. J. Prod. Brand Manag. 2005, 14, 143–154. [Google Scholar] [CrossRef]
  100. Pappu, R.; Quester, P.G.; Cooksey, R.W. Consumer-based brand equity and country-of-origin relationships: some empirical evidence. Eur. J. Mark. 2006, 40, 696–717. [Google Scholar] [CrossRef]
  101. Han, C.M.; Terpstra, V. Country-of-origin effects for uni-national and bi-national products. J. Int. Bus. Stud. 1988, 19, 235–255. [Google Scholar] [CrossRef]
  102. Sirgy, M.J.; Grewal, D.; Mangleburg, T.F.; Park, J.-o.; Chon, K.-S.; Claiborne, C.B.; Johar, J.S.; Berkman, H. Assessing the predictive validity of two methods of measuring self-image congruence. J. Acad. Mark. Sci. 1997, 25, 229. [Google Scholar] [CrossRef]
  103. Erdem, T.; Swait, J.; Valenzuela, A. Brands as signals: A cross-country validation study. J. Mark. 2006, 70, 34–49. [Google Scholar] [CrossRef] [Green Version]
  104. Brislin, R.W. Back-translation for cross-cultural research. J. Cross. Cult. Gerontol. 1970, 1, 185–216. [Google Scholar] [CrossRef]
  105. Wright, K.B. Researching Internet-based populations: Advantages and disadvantages of online survey research, online questionnaire authoring software packages, and web survey services. J. Comput. Mediat. Commun. 2005, 10, JCMC1034. [Google Scholar] [CrossRef]
  106. Vogt, W.P. Quantitative Research Methods for Professionals; Pearson/allyn and Bacon Boston: Boston, MA, USA, 2007. [Google Scholar]
  107. Vogt, W.P. SAGE Quantitative Research Methods; SAGE Publications Ltd.: Thousand Oaks, CA, USA, 2011. [Google Scholar]
  108. Wiles, R.; Crow, G.; Heath, S.; Charles, V. The management of confidentiality and anonymity in social research. Int. J. Soc. Res. Methodol. 2008, 11, 417–428. [Google Scholar] [CrossRef]
  109. Hair, J.F.; Black, W.C.; Babin, B.J. Multivariate Data Analysis: A Global Perspective; Pearson Education: London, UK, 2010. [Google Scholar]
  110. Tabachnick, B.G.; Fidell, L.S. Principal components and factor analysis. Using Multivar. Stat. 2001, 4, 582–633. [Google Scholar]
  111. Fornell, C.; Larcker, D.F. Evaluating structural equation models with unobservable variables and measurement error. J. Mark. Res. 1981, 18, 39–50. [Google Scholar] [CrossRef]
  112. Huang, R.; Sarigöllü, E. How brand awareness relates to market outcome, brand equity, and the marketing mix. In Fashion Branding and Consumer Behaviors; Springer: Berlin/Heidelberg, Germany, 2014; pp. 113–132. [Google Scholar] [CrossRef]
  113. Kim, J.-H.; Kim, H.-J.; Yoo, S.-H. Willingness to Pay Price Premium for Smartphones Produced Using Renewable Energy. Sustainability 2019, 11, 1566. [Google Scholar] [CrossRef] [Green Version]
  114. Arvidsson, A. Brands: Meaning and Value in Media Culture; Routledge: London, UK, 2006. [Google Scholar]
  115. IMF. World Economic Outlook Database. International Monetary Fund. Available online: www.IMF.org (accessed on 20 August 2019).
  116. Statistica. Smartphone Average Price Forecast in 2019, by Region. Available online: https://www.statista.com/statistics/283334/average-smartphone-price-by-region/ (accessed on 17 November 2019).
  117. Moslehpour, M.; Yumnu, S. The mediating effect of quality and prestige on the relationship between brand globalness and purchase likelihood of HTC mobile phone. Int. Bus. Res. 2014, 7, 94. [Google Scholar] [CrossRef]
  118. Gilady, L. The Price of Prestige: Conspicuous Consumption in International Relations; University of Chicago Press: Chicago, IL, USA, 2018. [Google Scholar]
  119. Wegener, B. Concepts and measurement of prestige. Annu. Rev. Sociol. 1992, 18, 253–280. [Google Scholar] [CrossRef]
  120. Moslehpour, M.; Wong, W.-K.; Pham, K.V.; Aulia, C.K. Repurchase intention of Korean beauty products among Taiwanese consumers. Asis. Pac. J. Mark. Logist. 2017, 29, 569–588. [Google Scholar] [CrossRef]
  121. Moslehpour, M.; Altantsetseg, P.; Mou, W.; Wong, W.-K. Organizational Climate and Work Style: The Missing Links for Sustainability of Leadership and Satisfied Employees. Sustainability 2019, 11, 125. [Google Scholar] [CrossRef] [Green Version]
  122. Pham, V.; Wong, W.; Moslehpour, M.; Musyoki, D. Simultaneous Adaptation of AHP and Fuzzy AHP to Evaluate Outsourcing Service in East and Southeast Asia. J. Test. Eval. 2020. [Google Scholar] [CrossRef]
  123. Mou, W.; Wong, W.-K.; McAleer, M. Financial credit risk evaluation based on core enterprise supply chains. Sustainability 2018, 10, 3699. [Google Scholar] [CrossRef] [Green Version]
  124. Wong, W.-K. Stochastic dominance and mean–variance measures of profit and loss for business planning and investment. Eur. J. Oper. Res. 2007, 182, 829–843. [Google Scholar] [CrossRef] [Green Version]
  125. Wong, W.-K.; Lean, H.; McAleer, M.; Tsai, F.-T. Why Are Warrant Markets Sustained in Taiwan but Not in China? Sustainability 2018, 10, 3748. [Google Scholar] [CrossRef] [Green Version]
  126. Munkh-Ulzii, B.; McAleer, M.; Moslehpour, M.; Wong, W.-K. Confucius and herding behaviour in the stock markets in China and Taiwan. Sustainability 2018, 10, 4413. [Google Scholar] [CrossRef] [Green Version]
Figure 1. Research framework.
Sustainability 11 06973 g001
Figure 2. The result of SEM testing for Taiwan-Apple.
Sustainability 11 06973 g002
Figure 3. The result of SEM testing for Taiwan-HTC.
Sustainability 11 06973 g003
Figure 4. The result of SEM testing for Indonesia-Apple.
Sustainability 11 06973 g004
Figure 5. The result of SEM testing for Indonesia-HTC.
Sustainability 11 06973 g005
Table 1. Research instrument.
VariablesItemsReference
Exogenous Variables
Brand AwarenessBA1. I am aware of Apple/HTC.Yoo et al. [22]
BA2. When I think of smartphones, Apple/HTC is one of the brands that come to my mind.
BA3. Apple/HTC is a brand of smartphones I am very familiar with.
BA4. I know what Apple/HTC looks like.
Perceived QualityPQ1. Apple/HTC offers very good quality products.Pappu et al. [99,100]
PQ2. Apple/HTC offers products of consistent quality.
PQ3. Apple/HTC offers reliable products.
PQ4. Apple/HTC offers products with quality features.
Perceived Prestige ValuePV1. Apple/HTC is a prestigious product.Han Terpstra [101] Steenkamp et al. [61]
PV2. Apple/HTC has a high status.
PV3. Apple/HTC is upscale among my friends.
Endogenous Variables
Price PremiumPP1. Apple/HTC is a good value for the money.Netemeyer et al. [73]
PP2. The price of Apple/HTC is acceptable.
PP3. Buying Apple/HTC is money well spent.
Brand PreferenceBP1. I like Apple/HTC better than other brands of smartphones.Sirgy et al. [102]
BP2. I would use Apple/HTC more than other brands of smartphones.
Outcome VariableBP3. In the Smartphone, Apple/HTC is my preferred brand.
Purchase IntentionPI1. Apple/HTC is one of the preferred brands I want to buy.Erdem et al. [103]
PI2. I would definitely buy Apple/HTC in the future.
PI3. I would seriously consider buying Apple/HTC.
Table 2. Demographics of respondents.
ProfileCategoriesFrequencyPercentage (%)
TWINDTWIND
GenderFemale13613167.360.4
Male668632.739.6
Total202217100100
Age20 below645031.723.0
21–2510512352.056.7
26–3018308.913.8
31 and above15147.46.5
Total202217100100
EducationHigh School or less9264.512.0
Undergraduate16716582.776.0
Graduate252312.410.6
Post-Graduate130.51.4
Total202217100100
Table 3. Test of composite reliability and convergent validity.
Country Product Composite Reliability and Convergent Validity
CRAVEMax rBAPQPVPPBPPI
Taiwan–AppleBA0.8360.5660.9340.752
PQ0.8130.5230.9570.0890.723
PV0.7610.5160.9460.1700.1020.718
PP0.8700.6910.8820.0530.3200.2440.831
BP0.9040.7590.9820.0130.588-0.0590.1860.871
PI0.9420.8440.9760.2170.2730.3220.6830.2290.919
Taiwan–HTCBA0.8630.6780.9320.824
PQ0.8860.7220.9720.3260.850
PV0.8770.7060.9630.0580.2760.840
PP0.8080.7110.8600.1760.6980.2660.767
BP0.9460.7470.9860.1560.7030.2530.8430.864
PI0.9230.8000.9790.0600.5780.1520.5920.7280.894
Indonesia–AppleBA0.8400.5710.9180.756
PQ0.8920.6740.9600.5760.821
PV0.7670.5260.9370.4520.6310.725
PP0.7900.5640.8350.4540.5150.2950.751
BP0.9570.7860.9860.6610.6260.3260.7340.887
PI0.9550.8770.9790.5390.4170.2740.5440.6190.937
Indonesia–HTCBA0.8000.5730.8910.757
PQ0.8950.6820.9630.4040.826
PV0.8910.7330.9450.4960.6340.856
PP0.7600.5220.7990.4470.7210.5040.722
BP0.8900.6190.9760.6180.6180.7750.6350.787
PI0.8190.6070.9700.4270.5220.6640.5820.9050.779
Note: CR > 0.7; AVE > 0.5; MSV < AVE; √AVE > Max r, √AVE is bold face diagonal.
Table 4. Cronbach’s alpha (α) reliability analysis.
VariablesCronbach’s Alpha (α)
Taiwan-AppleTaiwan-HTCIndonesia-AppleIndonesia-HTC
BA0.830.860.710.79
PQ0.810.890.890.90
PV0.760.870.750.89
PP0.870.800.770.76
BP0.900.950.960.90
PI0.940.920.960.83
Table 5. Goodness of fit test for confirmatory factor analysis (CFA).
GOF IndexAcceptable ValueAppleHTC
TaiwanIndonesiaTaiwanIndonesia
X2 (Chi-square) 290.62403.86349.10430.97
df (Degree of freedom) 155215174171
X2/df<31.881.882.012.52
GFI>0.80.880.870.870.85
CFI>0.90.940.950.950.92
TLI>0.90.930.940.940.90
RMSEA≤0.080.070.060.070.08
Table 6. Goodness of fit test for the proposed SEM.
GOF IndexAcceptable ValueAppleHTC
TaiwanIndonesiaTaiwanIndonesia
X2 (Chi-square) 290.74456.96416.85453.30
df (Degree of freedom) 156216175173
X2/df<31.862.122.382.62
GFI>0.80.880.850.840.84
CFI>0.90.940.940.930.91
TLI>0.90.930.930.920.89
RMSEA≤0.080.070.070.080.08
Table 7. Hypotheses results.
HypothesesPathAppleHTC
TaiwanIndonesiaTaiwanIndonesia
H1BA→PPNS0.32 ***NS0.21 **
H2PQ→PP0.30 ***0.53 ***0.38 ***0.40 ***
H3PV→PP0.21 *−0.25 **NSNS
H4BA→BPNS0.50 ***NS0.24 ***
H5PQ→BP0.60 ***0.54 ***0.73 ***0.19 **
H6PV→BPNS0.65 ***NS0.53 ***
H7BA→PI0.16 **0.23 *NS−0.015 *
H8PQ→PINSNSNSNS
H9PV→PI0.16 *NSNSNS
H10PP→PI0.62 ***0.20 *NSNS
H11BP→PI0.16 *0.37 ***0.68 ***0.90 ***
* p < 0.05, ** p < 0.01, *** p < 0.001, NS = not significant.

