Article

Analysis of Public Complaints to Identify Priority Policy Areas: Evidence from a Satellite City around Seoul

1
Social Science Research Institute, Yonsei University, Seoul 03722, Korea
2
Department of Electrical and Electronic Engineering, Xi’an Jiaotong-Liverpool University, Suzhou 215123, China
3
Faculty of Information Technology, Ton Duc Thang University, Ho Chi Minh City 700000, Vietnam
4
Centre for Smart Grid and Information Convergence, Xi’an Jiaotong-Liverpool University, Suzhou 215123, China
5
Institute of Public Affairs, Yonsei University, Seoul 03722, Korea
*
Author to whom correspondence should be addressed.
Sustainability 2019, 11(21), 6140; https://doi.org/10.3390/su11216140
Submission received: 30 April 2019 / Revised: 15 October 2019 / Accepted: 25 October 2019 / Published: 4 November 2019
(This article belongs to the Special Issue Local Government Responses to Catalyse Sustainable Urban Development)

Abstract

:
Conventional studies on policy demand identification that are anchored in big data on urban residents are limited in that they mostly involve the top-down and government-oriented use of such data. It restricts treatment to specific issues (e.g., public safety and disaster management), even from the beginning of data collection. Scant research has emphasized the general use of data on civil complaints—which are independent of areas of application—in the examination of sustainable cities. In this work, we hypothesized that the analyses of civil complaint data and big data effectively identify what urban residents want from local governments with respect to a broad range of issues. We investigated policy demand using big data analytics in examining unstructured civil complaint data on safety and disaster management. We extracted major keywords associated with safety and disaster management via text mining to inquire into the relevant matters raised in the civil complaints. We also conducted a panel analysis to explore the effects exerted by the characteristics of 16 locally governed towns on residents’ policy demands regarding safety and disaster management-related complaints. The results suggest that policy needs vary according to local sociocultural characteristics such as the age, gender, and economic status of residents as well as the proportion of migrants in these localities, so that, city governments need to provide customized services. This research contributes to extend with more advanced big data analysis techniques such as text mining, and data fusion and integration. The technique allows the government to identify more specifically citizens’ policy needs.

1. Introduction

With the advent of the Fourth Industrial Revolution, interest in smart cities and big data (big data generally refers to large and complex sets of data that represent digital traces of human activities and can be defined in terms of scale or volume, analytical methods [1], or organizational effects [2]) has been increasing. In particular, the demand for science-based urban policies based on big data has grown, as has the value of big data and the possibilities of using it as an analytical tool for rational urban public policy making and evidence-based administration [3,4,5,6,7,8,9]. For example, cities around the world collect massive amounts of data related to urban life, from objects (e.g., energy infrastructure) and people (e.g., energy use from household residents). This information, if analyzed properly, can become useful to various stakeholders, including citizens, local and national governments, and companies [5,6].
Many local governments have been actively reflecting on how to use effectively big data for policy making [10,11,12]. Furthermore there have been efforts to combine big data with various other types of data (spatial indicators constitute more than 80% of all the data produced by the public sector (e.g., real estate, economy, transportation, welfare, education, culture, health, tourism) and used in the policies of the central and local governments [13]) (e.g., space, property, and administrative data) to enable user-oriented policy development [14,15,16]. For instance, the Seoul government collects data on public health, transportation, and residences to design sustainable solutions that improve the life of urban residents. In this case data was utilized to identify the use and demand for night buses, and was subsequently used to improve these public bus services [17]. Similarly, the San Francisco government analyzed crime records to improve public security services [18], while the Rio de Janeiro government used data from cameras and sensors to address various concerns related to weather, energy, and safety [19]. Other similar cases include local governments in Santander (Spain) and Cosenza (Italy) [20,21].
However, despite these promising examples and the expanding academic literature [19,22,23,24,25], there is still limited understanding of how to harness and effectively use big data for smart cities. Some studies have investigated the top-down and government-led use of big data in smart cities, and identified relevant issues in specific areas such as transportation, public safety, and sustainability [10,20,26,27]. However, many important gaps remain at the interface of big data and smart cities such as the elements of data management, infrastructure, governance, human resources, and data analysis in the operations [3,4,5,6].
Furthermore, large volumes of unstructured textual datasets are still not utilized effectively due to analytical difficulties [3]. However, unstructured data could provide useful information to identify urban challenges and priority policy areas as demonstrated in some studies [4,5,6]. For example, in the United States, unstructured Twitter data in the Seattle area was analyzed based on the location to extract knowledge about people’s everyday life [28]. In addition, text extracted from social media (Twitter) in the United States on obesity-related queries show distinct spatial pattern between rural and urban areas, northern and southern states, and between coasts and inland states [29]. Another methodological study extracted perceptions related to health and harmful food from unstructured Twitter data across the contiguous United States to investigate the prevalence of food that is harmful to health [30].
Civil complaints are a particular type of unstructured data that holds great promise for identifying priority policy areas in urban contexts. This is because through civil complaints, citizens “appeal for what they want to the administrative institutions” [31]. In this case the local policy demand is articulated in civil complaints, and local governments could develop sustainable solutions by swiftly responding to these complaints. While civil petitions used to be conducted in an antiquated manner, the current technological advancements can allow citizens to express their needs and complaints in a fast, positive, and convenient way [17,32]. Thus, local governments could identify and prioritize almost in real time the policy demands expressed in civil complaints, and use them effectively to help promote the transition to a smart city. Research on civil complaints has been shifting to consumer-oriented research, and some studies have sought to improve the quality of civil service. However, very few studies have emphasized the general applicability of civil complaint data in the context of sustainable and smart cities independent of the area of application [24,33].
The use of big data and civil complaints in particular, can be particularly useful in countries such as Korea. On the one hand, due to ongoing decentralization processes the role of the local government has expanded to include new responsibilities such as safety, security, and disaster management. At the same time, due to overcrowding in Seoul, satellite cities have become popular residential areas in its periphery, with many urban residents moving there. The development of the transportation system has contributed to the growth of satellite cities such as Namyangju city (in order to avoid duplication, Namyangju city is shortened to Namyangju) near Seoul [34] that attract an increasing number of external and young migrants. In such contexts there is a growing demand for new policies, particularly related to safety and disaster preparedness and mitigation.
In this study, we investigate how town characteristics affect the demand for policies on safety and disaster management through civil complaints. In particular, we analyze the major issues raised in civil complaints as a reflection of policy demand and citizen priorities. We undertake text mining and panel analysis in a large dataset of textual data to identify real alternatives to enhance urban sustainability and improve the quality of urban life. We discuss the applicability of the results for identifying data-driven solutions to social problems and to customize policies for residents. This is because we believe that the handling of civil complaints through the textual analysis of big data can provide a scientific basis for identifying policy directions, formulating and implementing effectively policies, and improving the related systems and institutions.

2. Methodology

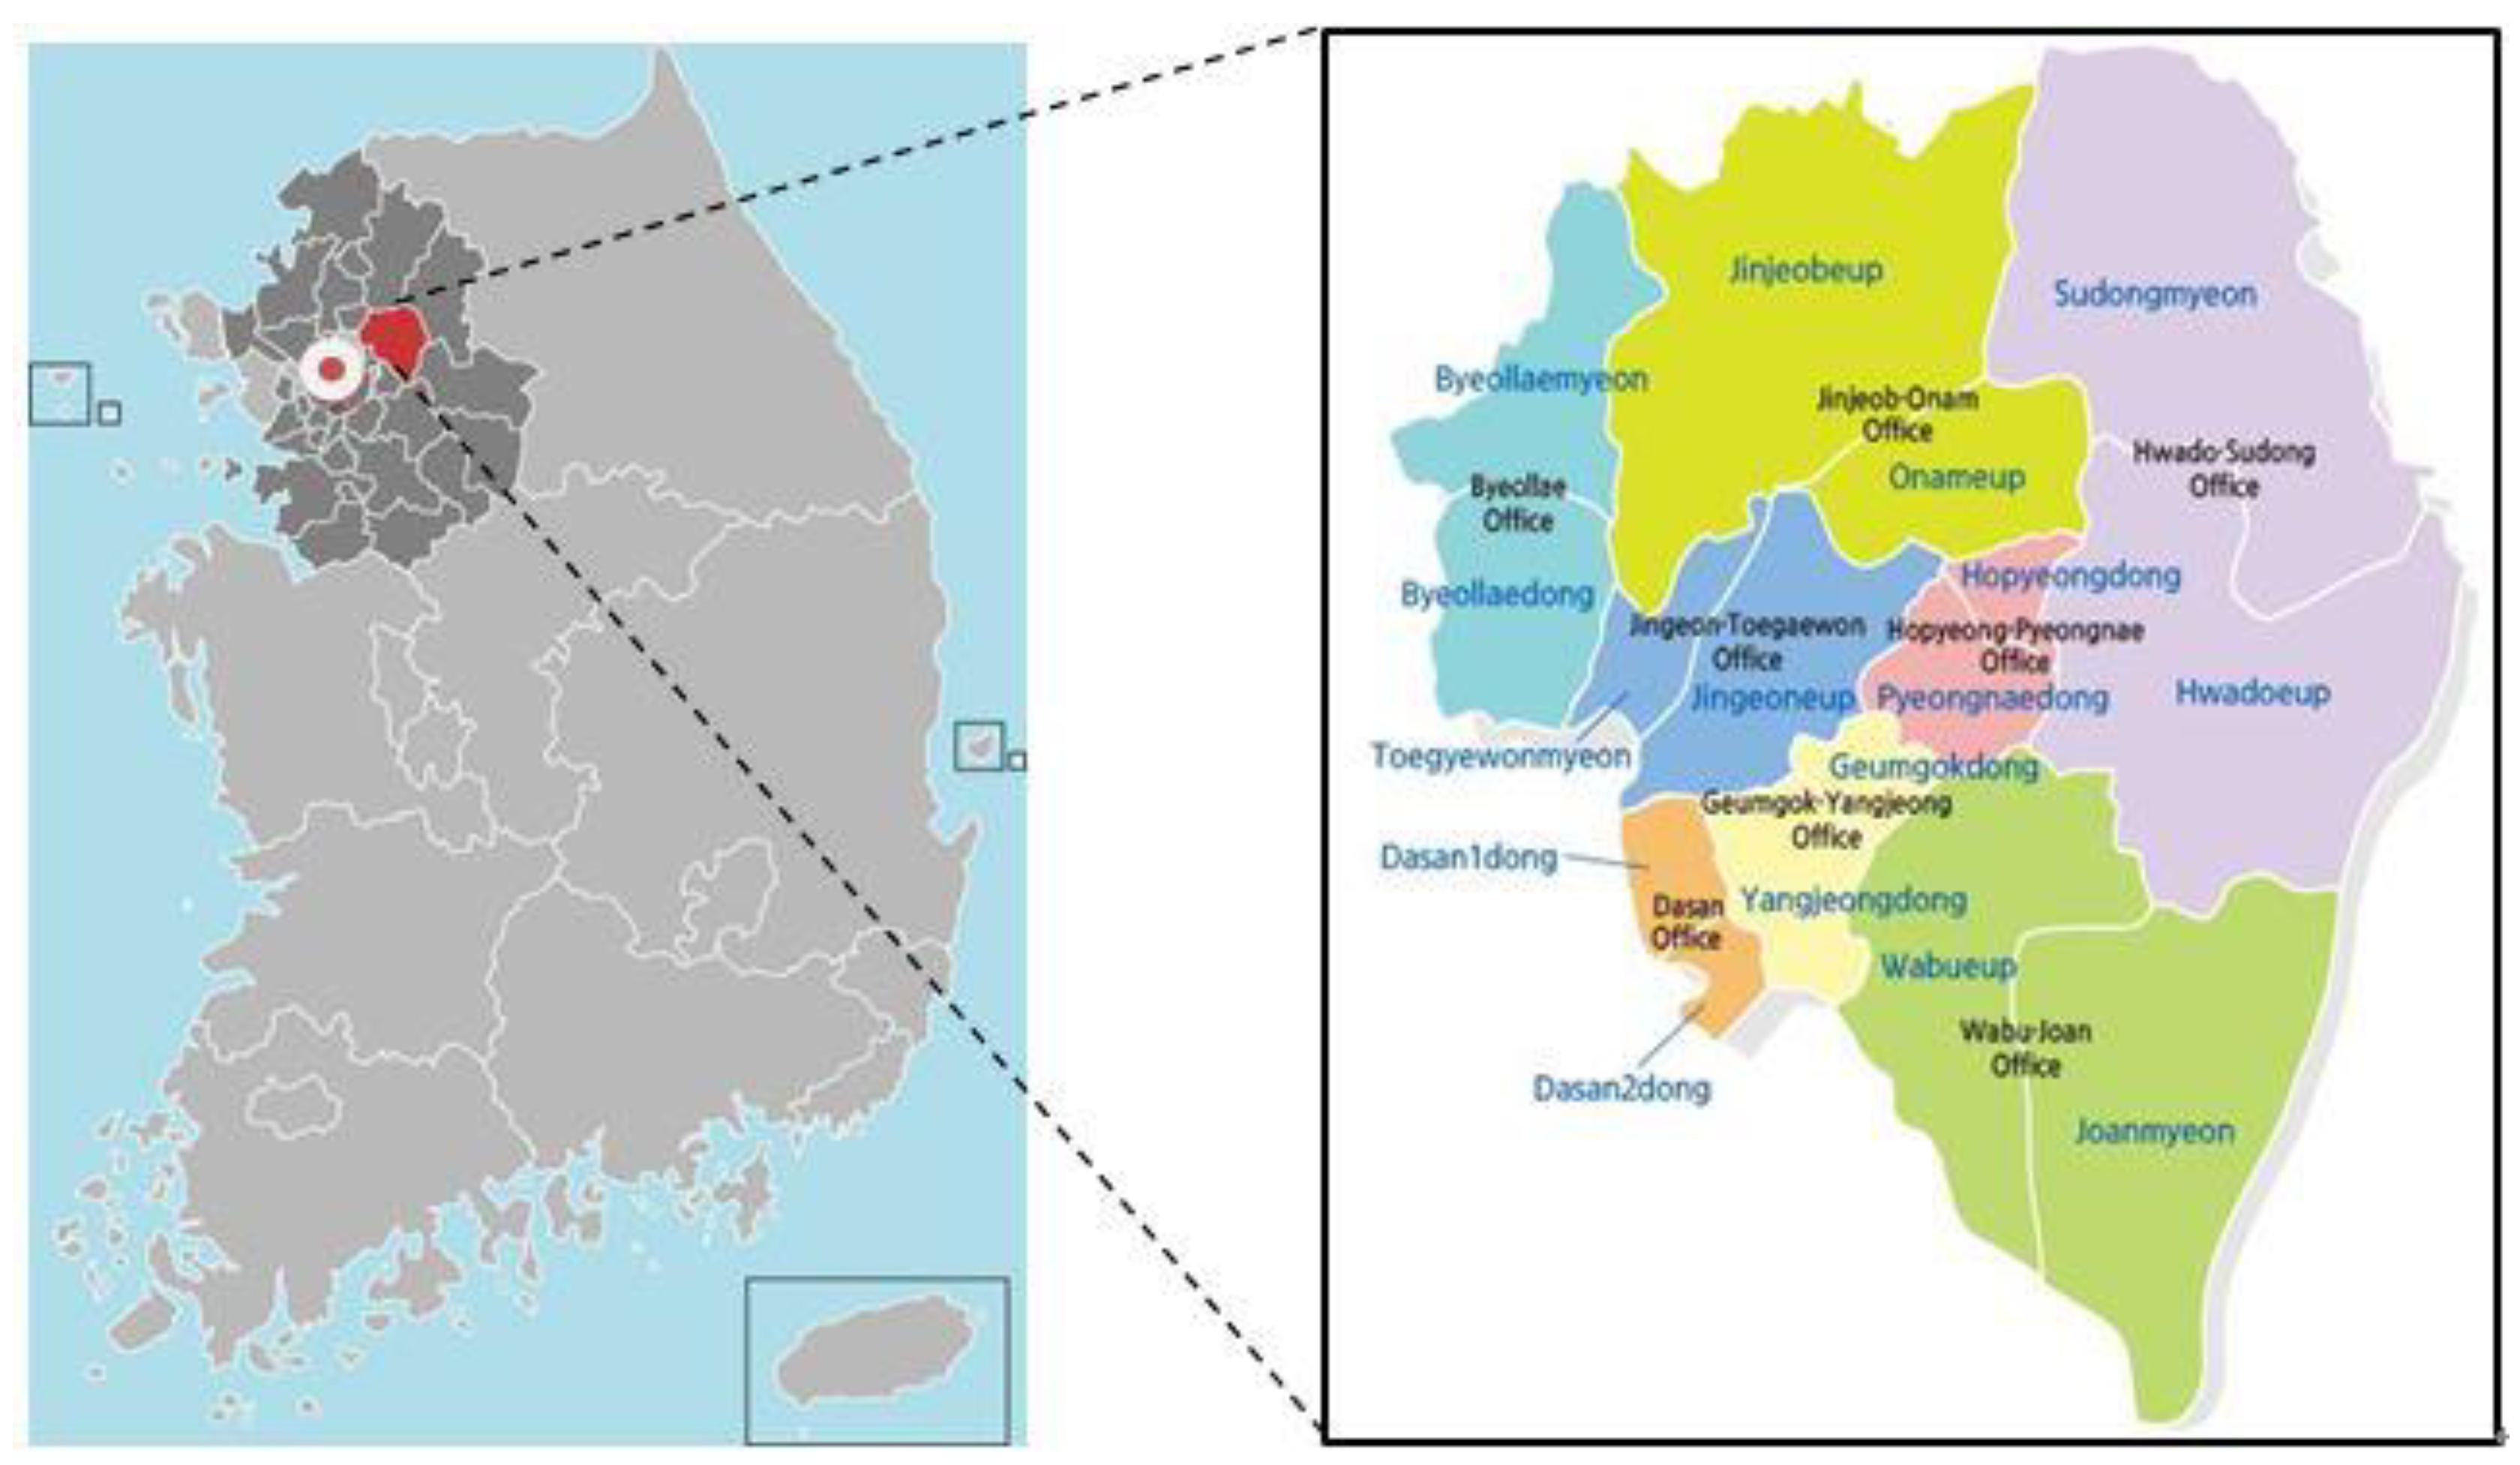
2.1. Study Site: Namyangju as a Smart City

Namyangju is a new city in South Korea, whose development has been guided by the concepts of the Fourth Industrial Revolution and the smart city. The current population is approximately 670,000 people, of which about 15% are new residents from Seoul, and about 27% come from other parts of the country [35]. Namyangju is easily accessible to downtown Seoul (train lines, highways, a beltway around Seoul, and the Han River’s northernmost road between Seoul and other satellite cities, all pass through Namyangju. National highways and local roads also connect the city to other northern rural areas), as it is the gateway of the northeastern transportation network linking Gyeonggi province and Seoul, which is shown in Figure 1. The economy of the broader area mainly focuses on fruit and dairy farming because about 70% of the land is located in a mountainous area. In addition, as the city is conveniently located near Seoul it has a well-developed service sector such as tourism [35].
The city has recently simplified its administration system and is aiming for balanced development between its urban and rural areas. The city explores also customized services related to the transport and welfare systems for its residents. Additionally, the influx of external populations increases the policy demand for aspects related to crisis and safety, with an increasing focus on safety and disaster management policies.
Data from the 2015 Namyangju social survey (the Namyangju social survey was conducted by the Gyeonggi local government in 2015 and provides secondary information about the living conditions and perceptions of urban residents across the study area. The sample comprises of household members aged 15 or older who live in Namyangju. A total of 1000 household members were sampled from 20 households in each of the 50 counties across Namyangju (n = 20 × 50 = 1000) using the sampling framework of the Korean Population and Housing Census. The survey was conducted between August 17 and 31, 2015 (The 4th Namyangju-si Social Survey Report), and the raw data include responses from 2274 interviewees [37]) shows citizen perceptions about crisis management and policy priority areas, and can inform the creation of customized services at the city level. For example, citizens’ perceptions about safety vary according to age, residence period, education level, marital status, and residence type [37]. About half (51.6%) of the respondents felt that the city was very safe or relatively safe in terms of security, and 54.1% felt it was very safe or relatively safe from natural disasters. However, the residents were dissatisfied with the traffic problems, the poor educational environment, and the lack of alternative residential and parking facilities.
When breaking down these perceptions, the fear of fire or crime was the main reason for dissatisfaction among women. In the 20–30 age group, the causes of dissatisfaction were mainly traffic discomfort (50.7%), lack of convenient facilities (25.4%), and public safety, crime, and anxiety (23.9%) [37]. The perceived level of risk increased as the residents’ age increased, and was higher among women than men [37]. Overall, the demand for policies on traffic, safety, and health seems to have increased in the city.

2.2. Data Collection

We used basic statistical tools to analyze some of the data from the 2015 social survey to understand the level of the safety-related perception of urban residents (Section 2.1). Results vary depending on age of the town and demographic characteristics such as gender and age. We used this preliminary study to understand whether the safety-related perceptions of urban residents have changed or whether they articulate a policy demand.
For this purpose, we used two data sets; a civil complaint dataset and a demographic dataset; 9 years from January 2009 to June 2017 of telephone based complaint dataset and population movement data.
With the first civil complaints text data, we made an additional two data sets. Then, first, we analyzed the content of the complaints written and filed in the text by accessing Namyangju official complaint site. Based on this text, safety-related texts were drawn and frequency measurements were taken. The dataset was constructed by classifying the frequency by month and by place of residence. The telephone-based data is essentially big data that the local government accumulates on their own platform (for more information refer to: https://www.nyj.go.kr/minwon/2828?space=main_favorites, (accessed on 17 January 2019)). Second, according to the policy type suggested by Namyangju, 396,658 complaints were categorized by policy type and classified by month. Then, a panel data set was constructed by merging demographic data set by 16 towns in Namyangju.
For the panel analysis (Section 2.3.2), we used statistical tools to determine the impact of the local sociocultural characteristics on safety-related civil complaints. We used the 16 towns of Namyangju as the units of analysis for four types of complaints, namely hygiene, traffic safety, lighting facilities, and disaster management. The average population of the 16 towns is 38,881, and the average monthly number of civil complaints per town is 249.
We integrated the civil complaints according to the complainants’ broad residential area. We merged and analyzed the demographic data of the 16 towns as the personal information protection law prohibits the direct use of the civil complainants’ personal information. First, we divided the telephone complaint data into 69 categories, and then arranged the dataset by month according to the complainants’ area of residence. Second, based on the annual population change data of the study region, we merged the demographic data (e.g., gender, population composition, migrant population) by town with the monthly telephone-based civil complaint data obtained from Namyangju for research purposes. Finally, we constructed the panel data from January 2009 to September 2017 for all of the 16 towns (the town of Byeollaedong was established on 22 December 2011. Therefore, the civil complaint data for this town were from February 2012 onward).

2.3. Data Analysis

2.3.1. Text Mining

The main purpose of text mining is to elicit high-quality information by applying natural language processing and statistical learning methods [3,38]. In particular, we used frequency analysis to track the use of frequent non-common words such as nouns, which is perceived to represent the main points that an individual respondent aims to convey [3,38]. We examined the frequencies of nouns and noun phrases in a semi-automatic manner through coded data and commands (see below for the different analytical steps). We used the R program for the original Korean text, as it can process Korean text without altering its meaning. The final results were translated into English.
In particular, during the preprocessing stage, we used the R package to decompose the words from the civil complaint data [3,38]. For word extraction, we used the Korean Natural Language Processing (KoNLP) program and the Sejong dictionary package from the R program [17,32,39]. The unit of analysis was the individual complaint, with a total of 111,105 words extracted during the first refinement process (excluding the wrong words or number combinations). We extracted only nouns manually by processing figures, symbols, and duplicate words, and used Microsoft Excel and coded equations to calculate the frequency of each word. In the second refinement process, we deleted words with a frequency lower than 10 that were erroneously extracted or had incorrect syllable combinations. In the third refinement process, from the 500 words, we excluded those that were unclear or incorrectly extracted, and then extracted the word with the highest frequency for each town and for all towns. The 200 words used for the final analysis were extracted through an iterative refinement process.
Language processing is very important in text mining analysis because a word could be interpreted in various meanings or there is a homonym. Since the analysis is based on frequency, the accuracy of language processing that can affect the results is essential. In previous research, it is also verified that low frequency does not affect its final analysis [40,41]. Hence, words frequencies below the top 500 are too few, it happens just once or twice, so low frequency words did not affect to the final decision or rankings [40,41]. Therefore, among the top 500 words, the spelling or homonyms were rearranged and merged according to the Korean language, Hangul, characteristics. Additionally, we chose the top 200 words to process the analysis.

2.3.2. Panel Analysis

As discussed above, panel analysis can determine the relationship between local sociocultural characteristics and safety-related civil complaints. In particularly, we explored whether gender, age, external transfer rate, and income level (which are all factors related to safety perception), actually appear as safety-related complaints and articulated policy demand. Panel analysis can control for unobserved heterogeneity across various towns [42]. This means that it allows for overcoming the limitations of missing variables by controlling the estimation errors that occur in the time series process and in the individual unit of analysis. The panel model is divided into a fixed effects (FE) model and a random effects (RE) model depending on the assumptions of the error term that controls the missing variable.
The FE model takes into account the inherent heterogeneity of the panel entity that does not change with time—that is, the effect of individual characteristics—and assumes that its inherent characteristics are latent [42,43]. On the other hand, the RE model assumes that the inherent characteristics of an individual are not fixed but change stochastically [42].
The choice between the two models depends on the type of study. However, in general, the Hausman test can be used to determine which model is more suitable [42,43]. In this study, we analyzed the pooled ordinary least squares (OLS) model, the FE model, and the RE model. We used the F test to compare the pooled OLS model with the FE model [42,43], and we used the Breusch–Pagan LM test to test the significance of the time probability effect [42,43]. Finally, we used the Hausman test to compare the FE and RE models. The results verified that the pooled OLS model is not suitable because of autocorrelation and heterogeneity [42]. For example, the regression equation used for hygiene-related complaints would be as follows:
H i t = β 0 + β 1 F e i t + β 2 Y o i t + β 3 I n i t + β 4 E x i t + β 5 C a r i t + β 6 N e w i t + β 7 C P o p i t + β 8 S e a s o n i t + μ i t + e i t ,  
where all independent variables are explained in Table 1. S e a s o n i t denotes the vector value of the season variables, i and t are each town and time, respectively. In addition, μ i t and e i t are town-specific error and total error term, also respectively. β 0 ,   β 1 ,   ,   β 8 are regression coefficients. Other variables such as traffic safety, lighting facility, and disaster related complaints are expressed with the same regression equation by T i t , L i t , and D i t .
Based on the Hausman test results, the hygiene-related complaint rate and the lighting facility complaint rate were estimated in the FE model, and the traffic safety and disaster-related complaint rates were estimated in the RE model. However, the FE model cannot estimate the influence of time invariants in each town. Therefore, the estimates of the FE and RE models are presented together in later.
According to Namyangju administration, civil complaints are classified into 29 types; traffic, architecture, road, education, tax, disaster, hygiene, lighting facility, disaster, farm, library, sewage, daycare center, land, park, forest, and so on. In this study, we did focus on safety related complaints, because Korean local governments policy has paid much attention to the safety issues of urban residents gradually. In particular, satellite cities near to Seoul, such as Namyangju, are faced with the demand about the safety issues to facilitate the immigrants from outside, and try to minimize the emigration as well.
The dataset was generated monthly by receiving civil complaints of 16 towns in Namyangju. For the 9 years data of Namyangju, each town-level (16 towns) complaint was measured as the proportion of safety-related complaints among the total complaints for every month. Just because there are more safety-related complaints in one village does not mean more complaints than in other villages. It is more precise to measure the portion of safety-related complaints among all complaints in a town so that they could be compared between towns. Therefore, in this paper, the dataset is composed of the ratio (%) of safety-related complaints (H, T, L, D) among monthly total complaints by town to maintain the equivalence of data.

3. Results

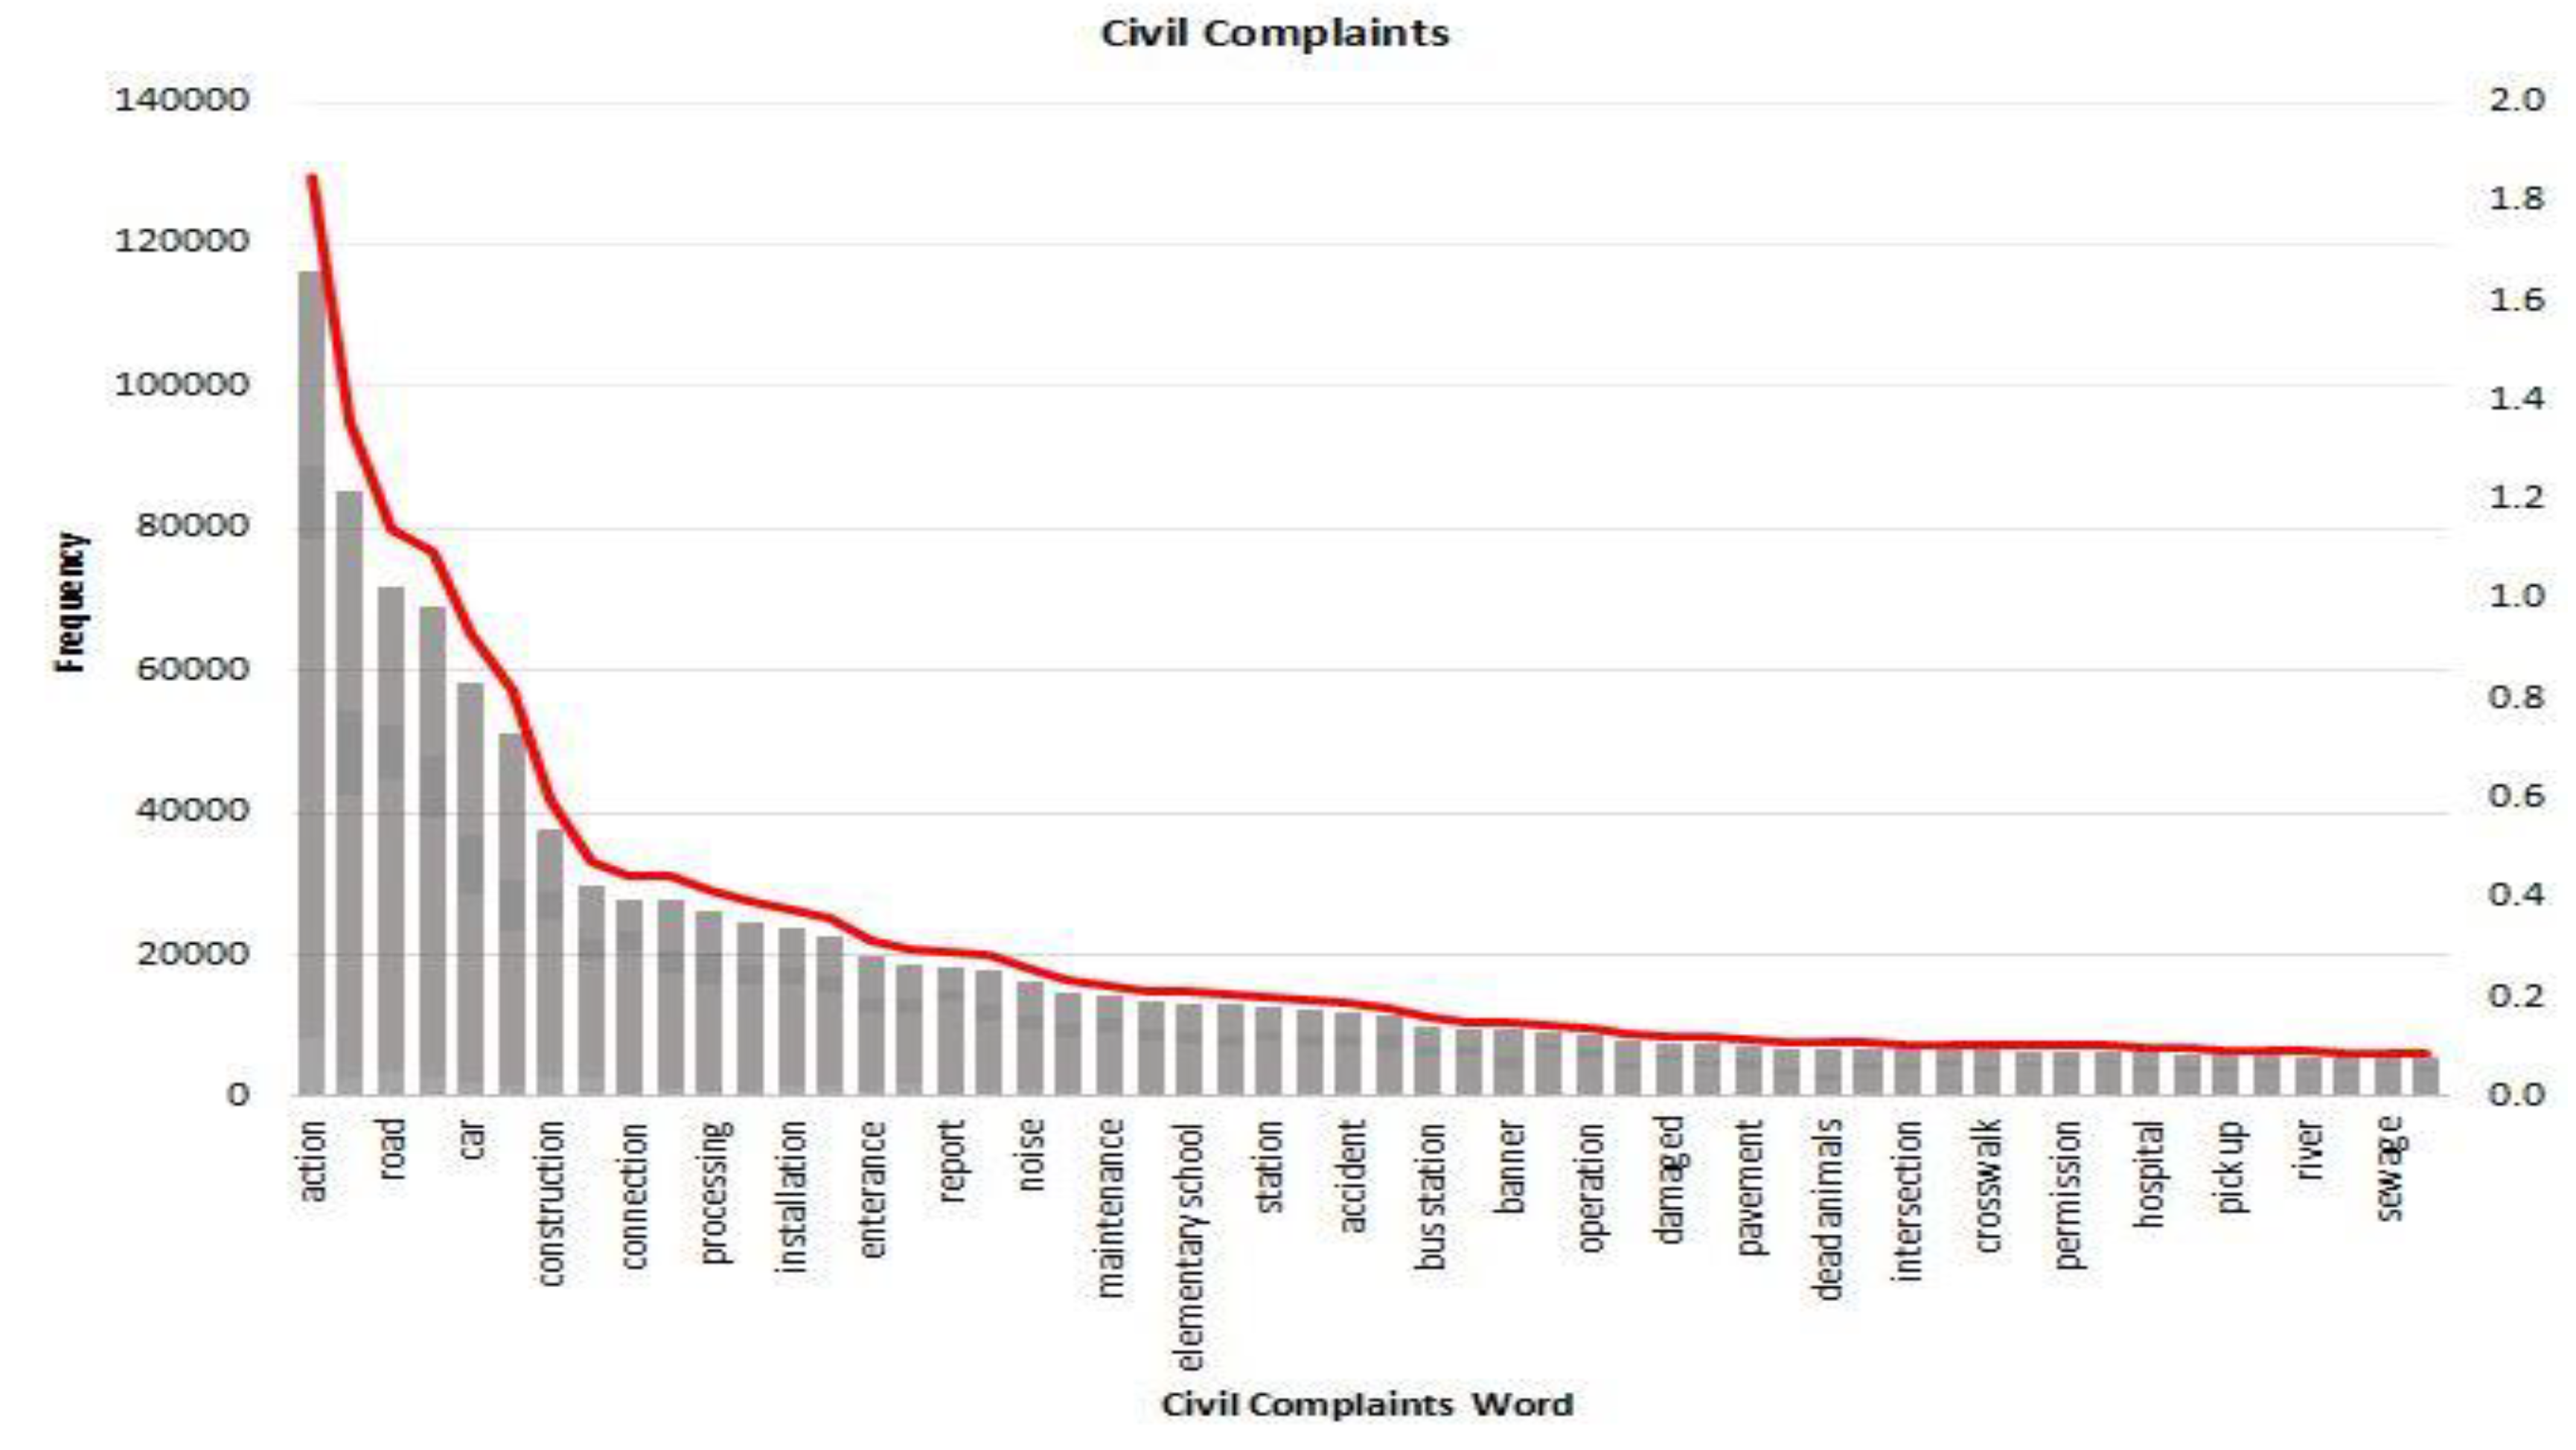
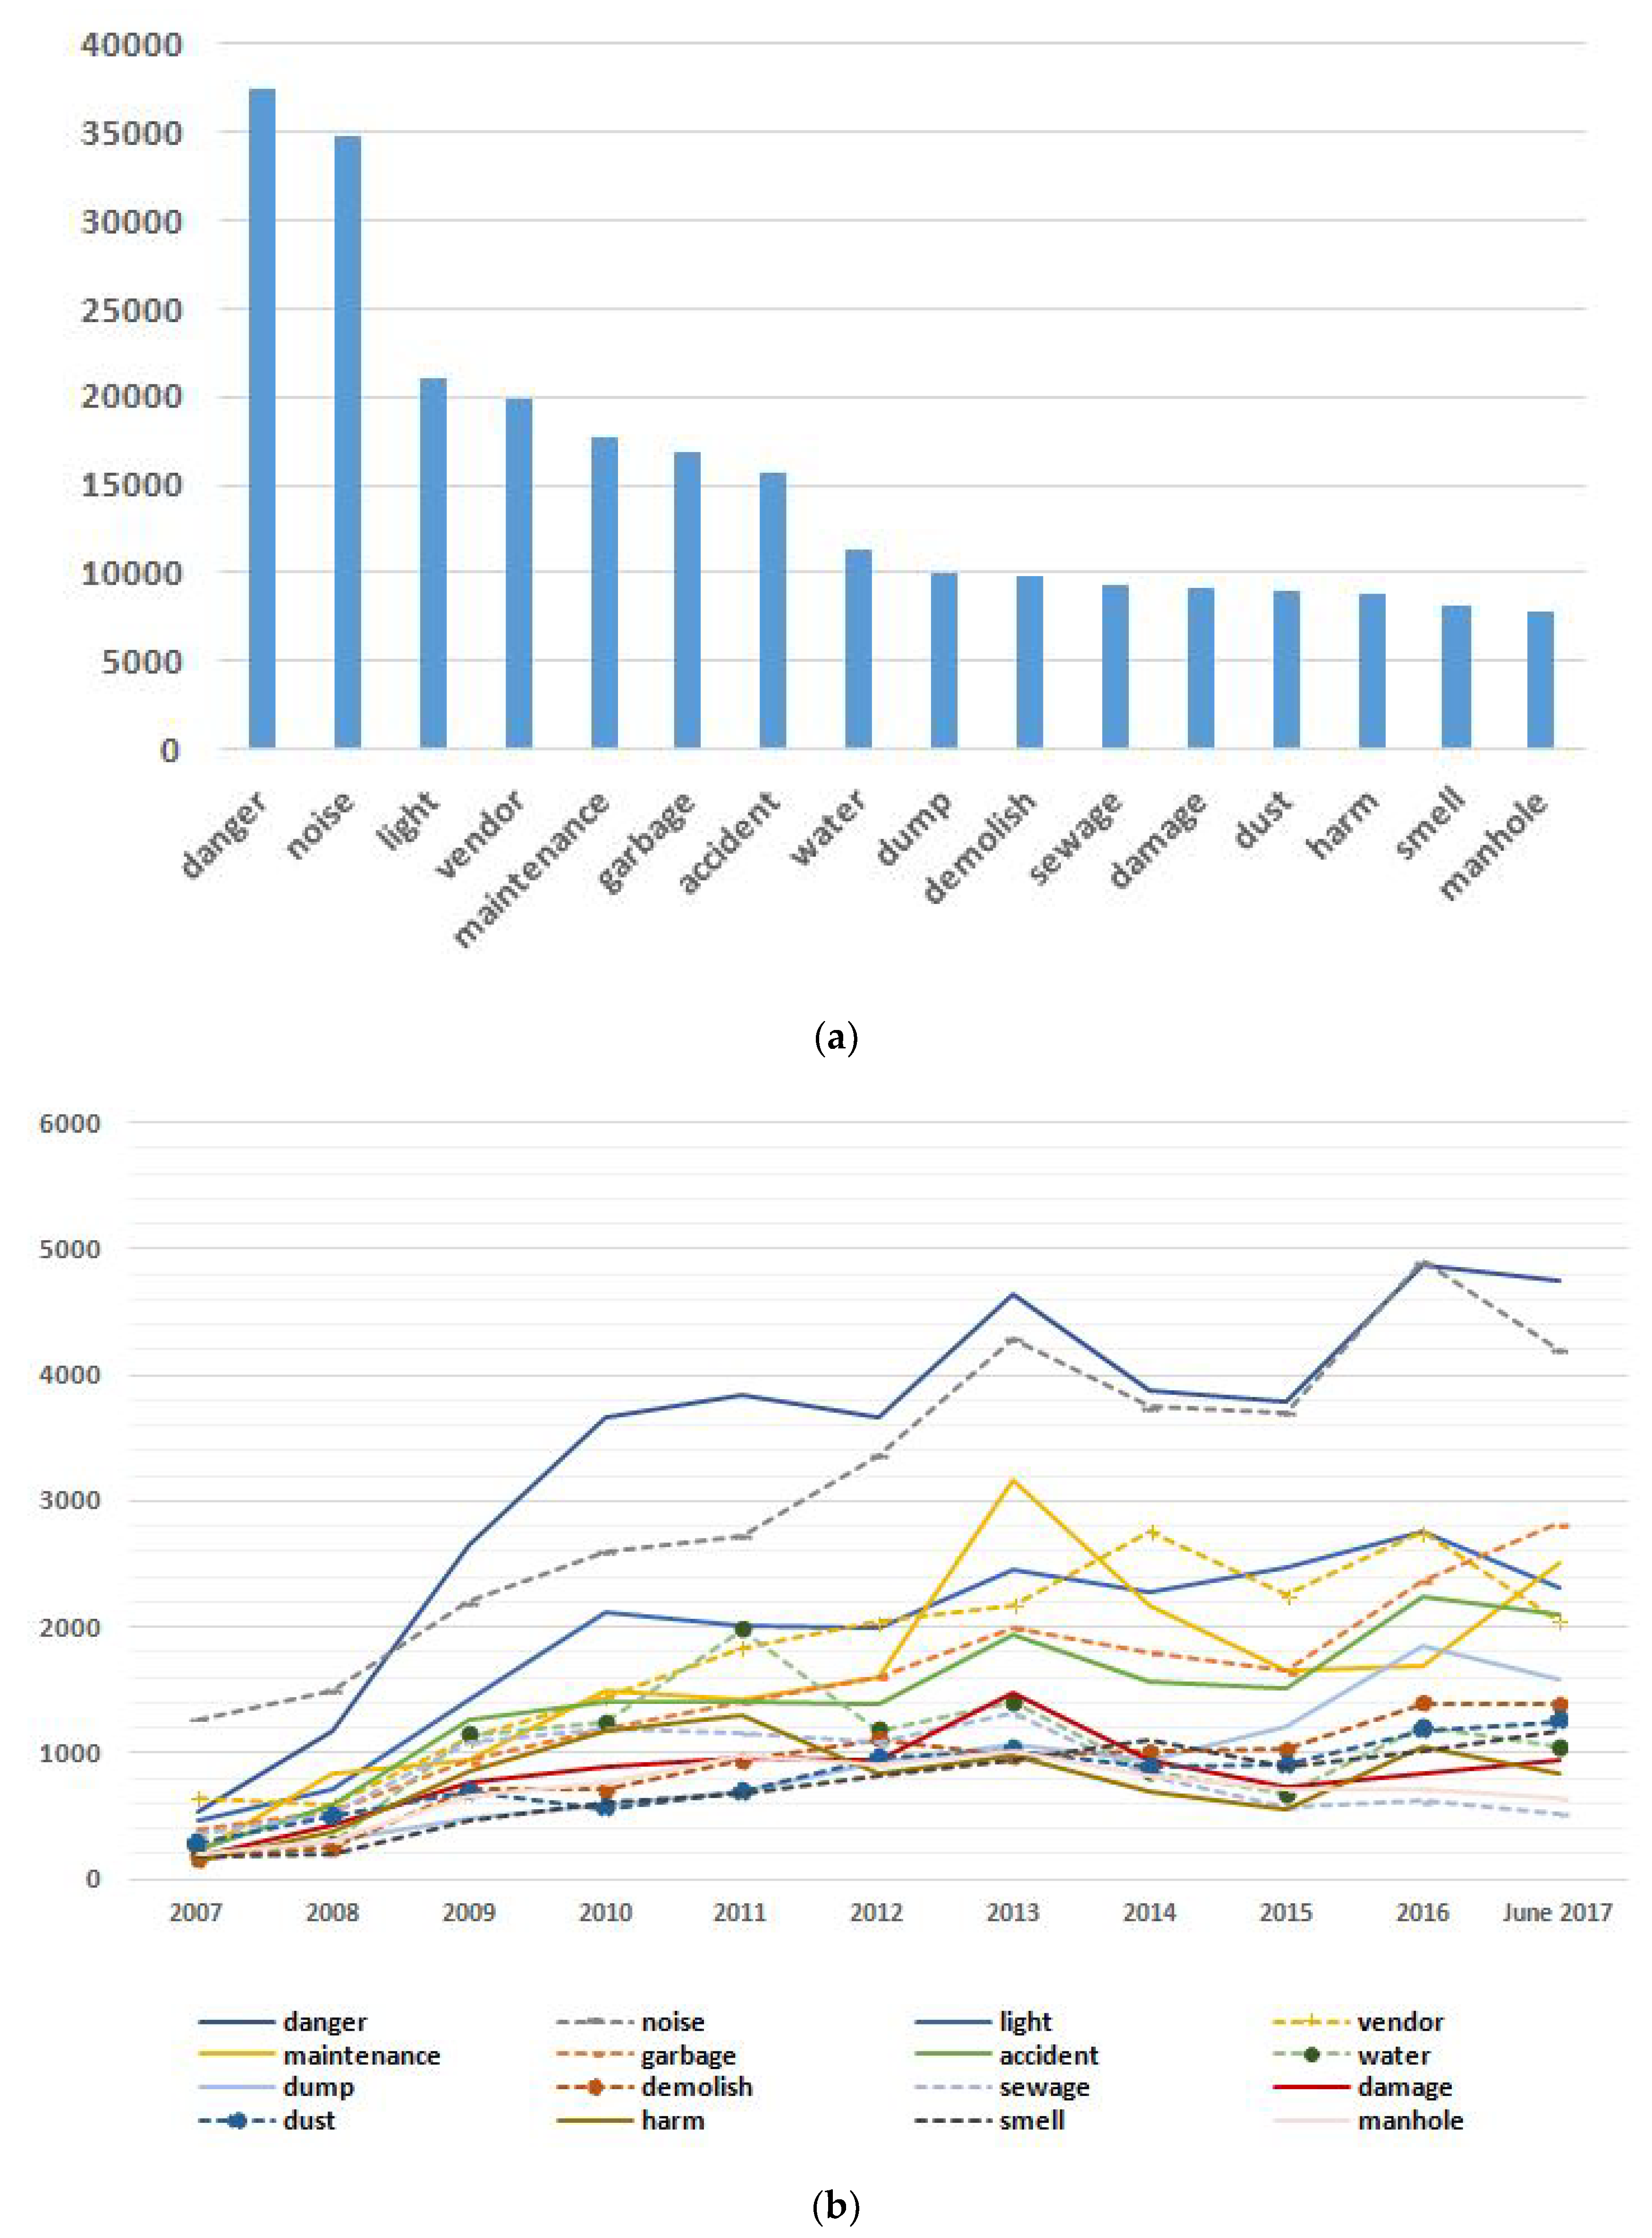
3.1. Text Mining Analysis

We used computerized techniques to classify, cluster, and analyze large volumes of textual data to find useful patterns in this section. Figure 2 and Figure 3 summarize the main findings of the text mining analysis. Figure 2 shows the most common words after the different refinement processes outlined in Section 2.3.1. Some of the most common words include “action”, “parking lot”, “construction”, “noise”, and “installation”. These words are essentially related to the citizens’ dissatisfaction with the inconveniences they experience or with the urban government’s late response to their complaints. Several civil complaints called for the construction of roads, parking lots, and new facilities for the new towns, as many parts of the city are currently under development (Section 2.1). Due to the construction of roads, constantly recurring themes in the complaints include noise nuisance, traffic problems, and the lack of parking lots. Although Namyangju is not yet a smart city, its expansion has led to an influx of migrants, which has led to some conflicts and inconveniences between older residents and new migrants.
However, these results do not show the diversity of civil complaints because they do not account for approximately 70–80% of the complaints, such as those related to sewage, factories, and cleaning. Therefore, to examine the policy demand related to safety and disaster management, we extracted the relevant words and investigate the trends by year (Figure 3). In Figure 3, hygiene-related words represent problems related to water, garbage, smell, and sewage, while words such as “dust”, “damage”, and “manhole” are related to disasters and crises.
When examining at the results it is possible to identify various different problems. Apart from “parking”, “noise”, and “road construction” problems (which are consistent with the contents of the telephone-based civil complaints), other problems such as “garbage”, “elementary school”, “moving”, “bus lines”, and “pavement construction” are also raised. Minor inconveniences are also mentioned, such as problems with “apartment entrances”, “unprocessed complaints”, “infant care”, and the “location of civil service centers”.
Results from Figure 3 also suggest that citizen complaints have been changed from the technical and infrastructure-related (e.g., facility installation or maintenance) to the complaints related with more social policy requirements such as the welfare system. Initially, citizens tended to express their complaints about public services, but the complaints were seemed to shift toward more constructive complains related to policy requests or suggestions.

3.2. Panel Analysis

Table 2 contains the scores for the main variables outlined in Table 1. As we pointed out, we used the safety related complaints data among all 29 complaints types in accordance with the criteria provided by Namyangju. It is about 16% of total complaints. A large portion of complaints are about parking lot limitation and illegal parking, and many analyses regarding on this issue have already been completed in the previous researches [11,12,13,14,15,16,17,32]. Even though it is a small portion, safety related policy demands are important to keep the city government stable because immigrants and natives consider safety more and more. The local government considers how to make their city sustainable and satisfy residents.
To analyze the factors, we postulated four types of complaint as the dependent variable (H, T, L, D) and they were expressed by the ratio of safety related complaints. There are two reasons for measuring the ratio variable in this study [42,43]: (1) to ensure normality because the numerical values are skewed, (2) to identify changes in safety-related complaints (four types; H, T, L, D) among the entire complaints over time (monthly).
The safety related complaints were divided into four areas: hygiene, traffic safety, lighting facilities, and disaster prevention. First, the ratio of hygiene complaints was measured as the ratio of civil complaints related to hygiene complaints among the total complaints per month. The same way, the ratio of traffic safety complaints is the proportion of civil complaints related to traffic safety among all civil complaints. It accounts for each complaint from the total number of complaints filed at the relevant time (month) for each town. The percentage of complaints about lighting facilities is also the ratio of civil complaints related to security at the month the complaints occurred. Disaster emergency civil complaints ratio is the ratio of complaints related to general safety such as floods at the month.
On Table 2, it is constructed the panel data from January 2009 to September 2017 for all of the 16 towns The civil complaint data for this town were from February 2012 onward. The number of sample are 1595 and represent to n = 1595 [44]). Table 2 shows the average proportion of hygiene-related complaints and complaints about lighting facilities are extremely low, at 0.42% and 0.51%, respectively. The average proportion of disaster-related complaints is higher at 2.82%, and the average proportion of traffic safety complaints is the highest at 12.46%. On average, about half of the citizens that lodged the complaints are female and below 40 years old. An average of 28.8% owned cars during the survey period. The average rate of internal migrants within the sample is 2.41%, and the average rate of external migrants is 1.01%. On average, about 0.836 complaints are lodged per person per month.
We analyzed the derived variables from the civil complaints through regression analysis to determine the factors explaining the prevalence of different types of complaints (Table 3). The FE analysis for hygiene-related complaints (H) shows that the proportions of females, internal and external migrants, and the total ratio of civil complaints, do not have a significant effect on the hygiene-related complaint ratio. On the other hand, the proportion of people under 40 years old has a statistically significant positive effect on the hygiene-related civil complaint ratio (b = 0.0264, SE = 0.0065, p < 0.01). Car ownership also has a positive effect on the hygiene-related complaint ratio (p < 0.05). The period of lodging complaints (i.e., summer, winter) had a statistically significant negative effect on the hygiene-related complaint ratio. The additional RE model analysis shows that residence in new towns does not have a statistically significant effect on the hygiene-related complaint ratio.
These results suggest that the higher the number of people under 40 years old, and the higher the economic status of the town residents, the more likely they are to file hygiene-related complaints. In addition, hygiene-related complaints are more common during the spring than in other seasons. However, there are no differences in the complaint rate between new and old towns.
The RE model for traffic safety complaints (T) shows that the proportion of females (b = −1.712, SE = 0.245, p < 0.01), external migration (b = −0.301, SE = 0.174, p < 0.1), car ownership (b = −0.305, SE = 0.061, p < 0.01), and new towns (b = −3.571, SE = 0.99, p < 0.01) has negative effects on the traffic safety complaint ratio. The proportion of the younger generation (b = 0.232, SE = 0.044, p < 0.01) and internal migration (b = 0.121, SE = 0.073, p < 0.1) has a statistically significant positive effect, as does the ratio of civil complaints to the population. Autumn has a negative effect and winter has a positive effect on the traffic safety complaint ratio.
These results suggest that the higher the proportion of women, the greater the inflow of external migrants, and the higher the economic status of the residents, the lower the traffic safety complaint ratio. Traffic safety complaints were more common in the winter, and the traffic safety complaint ratio rose as the number of civil complaints relative to the population increased.
The FE model for lighting facilities complaints (L) shows that the proportion of women has a negative effect (b = 0.206, SE = 0.052, p < 0.01) on the ratio of civil complaints related to lighting facilities. The proportion of the younger generation has a positive effect on the lighting-related complaint ratio (b = 0.035, SE = 0.007, p < 0.01). Therefore, there are relatively few civil complaints related to lighting facilities in towns with more women and a relatively large number of civil complaints in towns with many young people. The ratio of complaints related to lighting facilities is high in the towns where the number of civil complaints per population is high due to the negative influence of the complaints on the perceived safety. In the case of seasonal variables, summer has a negative effect, while winter has a positive effect, which means that the complaints for lighting facilities is relatively high in the winter. The RE model does not reveal any significant difference in the complaints related to lighting facilities between new and old towns. However, external migration has a statistically significant positive effect (b = 0.0735, SE = 0.022, p < 0.01). Thus, the higher the proportion of the external migrants, the higher the amount of complaints for lighting facilities.
The RE model analysis for disaster-related complaints (D) shows that the proportion of females (b = 0.339, SE = 0.133, p < 0.05) and new towns (b = 3.464, SE = 0.482, p < 0.01) has a statistically significant positive effect on the ratio of disaster-related civil complaints. The proportion of people below 40 years old (b = −0.184, SE = 0.026, p < 0.01) and external migrants (b = −0.303, SE = 0.111, p < 0.01) has a negative effect, whereas seasonal variables have a positive effect. Therefore, for overall disaster-related civil complaints, relatively high rates are found in new towns and towns with a high proportion of women. Relatively low complaint rates are found in towns with a large number of young people and external migrants. The overall prevalence of these complaints is higher in most seasons apart from spring.
We conducted t-tests to determine whether there are differences in the demographic characteristics and different types of complaints (e.g., hygiene-related, traffic safety, lighting facility, disaster-related) between new and old towns. We considered Hopyung-dong, Pyungnae-dong, Byulnae-dong as new towns, and Joan-myeon, Soodong-myeon, and Chingun-eup as old towns. The t-test results in Table 4 suggest that the proportion of women, young people, and both internal and external migrants are significantly higher in new towns than in old towns. On the other hand, car ownership is generally high in old towns. As a proxy for economic status, we measured car ownership per population, and not per household (there are limitations when using car ownership as an economic indicator. However, in South Korea, automobiles are included in income and property, which are the standard metrics for calculating the premiums for the members of the national health insurance premium area (Enforcement Decree of the National Health Insurance Act, § 42). Therefore, in this study, due to data constraints, we used car ownership ratio as a proxy of regional income levels).
The total number of complaints is higher in new towns, than in old towns. However, the total number of complaints is lower in Pyungnae-dong (new town), than in Chingun-eup (old town). The number of complaints per population is significantly lower in new towns, than in old towns. Therefore, in general, more complaints are filed in new towns, but the number of civil complaints per population is lower in new towns due to population differences. New towns are characterized by a large number of women, young people, and external migrants. However, due to differences in population, the number of complaints per population in new towns is relatively small. Compared to old towns, new towns have more disaster-related complaints, hygiene-related complaints, and complaints related to lighting facilities. Traffic safety complaints are less common in new towns compared to old towns.

4. Discussion

4.1. Synthesis of Main Findings

Previous studies have been investigated with the top-down approach by use of big data from national governments and also have been identified with the relevant issues in specific areas of urban policy such as transportation, public safety, and sustainability [10,20,26,27]. However, few studies have emphasized the general applicability of civil complaint data to inform urban policies [24,33]. In particular, there are limited efforts to reap the benefits of civil complaint data for urban policy making, although such work would be key in developing real-world applications. This study was aimed at reducing this research gap by utilizing civil complaint data at the town level to represent the policy demand and priorities of citizens.
By using the civil complaint data from Namyangju, a satellite city in South Korea, as an example, we showed that it is possible to analyze unstructured, non-spatialized, and non-specialized data using big data analytical techniques. Such analyses could provide powerful and cost-effective tools for informing the formulation of policy recommendations to identify and solve social problems, as well as customize policy priorities for each town. This could help overcome the limitations and higher cost of conventional studies on policy demand identification based on top-down and government-oriented use of big structured data [40].
Specifically, using text mining, we analyzed the linguistic and semantic characteristics of the civil complaints to determine what policy needs for safety and disaster management are presented. Then, the panel analysis identified the socioeconomic factors that influence the policy demand. The main results of this two-stage analysis show that some specific factors indeed seem to affect the probability of complaint articulation.
First, in towns with high proportion of women, the rate of civil complaints related to hygiene, closed circuit television (CCTV), and street lighting are low. In this study, the rate of complaints about hygiene, traffic safety, and lighting facilities was low in towns where women were living in a lot of places. On the other hand, the rate of complaints related to infrastructure related to disaster prevention was high in areas with new towns such as Byulnae-dong, Hopyoung-dong, and Pyungnae-dong.
This result was the opposite of what we expected. We hypothesized that the higher the female population, the higher the policy demands for street lighting and hygiene. However, this result reflected the characteristics of Namyangju new town with a high female population. The new town analyzed in this study was already well-designed for safety, so the interest in disaster-related facilities rather than street lighting and hygiene-related facilities was expressed as policy demand.
Second, when analyzing the type of civil complaints by age, the proportion of complaints related to hygiene, traffic safety, and lighting facilities is higher in towns with a high portion of young peoples. In these towns, there is a high demand for the matter of traffic safety, security, and safety in common life, while policy demand for overall safety management such as natural disasters is relatively low [41]. Relatively young people express high policy demands on safety infrastructure. This shows that there is a high demand for safety-related facilities that are needed in reality rather than prevention of future situations such as disasters.
Third, when looking in the type of complaints according to the type of migrant population, we found that (a) the higher moving happens from the inside of Namyangju, the higher the demands for traffic safety are required; (b) the higher migrations from the outside of Namyangju, the more demands are asked for the security issue than the traffic safety or natural disaster. It shows that the security issue is an important reason for the influx of people from Seoul to Namyangju [41]. From the complaint analysis of (a), it expresses the policy demands related to safety measures for the traffic situation, which are relatively inconvenient by the influx of migrants from the city. The complaint analysis of (b) tells that the policy needs of those who have migrated from the outside are focused on the necessary security related facilities such as street lighting rather than the well-planned transportation.
Fourth, when analyzing the types of complaints according to the income level, we found a higher probability of hygiene rate and disaster prevention complaints with a higher car ownership rate. On the other hand, the complaints related to traffic safety ratio and lighting facility ratio is low. This shows that citizens with higher income level express a higher demand for safety management related hygiene and natural disaster than traffic safety and security [41]. Migrants from outside have a relatively higher income level than natives. In particular, some people who have moved to Namyangju have families with kindergarten or elementary school students. Looking at the complaints, they express expectations for high hygiene linked to natural environments such as fine dust and dermatitis.
Fifth, town characteristics also seem to affect the rate of safety-related complaints. The t-test results reveal that the articulation of safety complaints is higher in new towns with a large number of women, younger people, and migrants. On the other hand, new towns have a relatively lower articulation of traffic complaints compared to old towns because they largely have an adequate transportation system as they are in a more mature stage of urban development. This suggests that it is needed for policies on safety in cities in terms of constructing infrastructure related to early traffic systems. The above results also imply that policy priorities should be changed according to local sociocultural characteristics such as the age, gender, and economic status of the residents, as well as the proportion of migrants.
Finally, we should note that the overall framework of our work presented in this paper is not limited to specific data (i.e., the civil complaint data) and methodologies (i.e., text mining and panel analysis) but can be applicable to any unstructured and readily available data. It can be extended with more advanced big data analysis techniques such as sentiment analysis, supervised learning, and data fusion and data integration [45]. This technique allows the government to identify more specifically which of the citizens’ policy needs is positive or negative. In addition, it is possible to increase the efficiency of how fast and accurate analysis of huge amounts of big data.

4.2. Implications for Local Governments

This study discussed how local governments can use complaints to understand real policy demand and make customized policies to enhance urban sustainability. Our results find a high variability in the type of civil complaints due to socioeconomic, geographic, and other factors. It is confirmed that the policy demand varies depending on the gender, age, income, period of stay, and new or old town. Despite these diverse citizen needs, the city government has been created with a single top-down policy. This increases the inefficiency of policy formation and undermines the sustainability of cities. For, if they do not meet the needs of their citizens, they can move to another city. Therefore, this result suggests that policy demand might vary significantly within cities, and thus a uniform approach towards urban policy formulation might fail to take into consideration important context-specific problems. The use of civil complaint data can offer a powerful lens to identify more context-specific issues, and assist local governments in developing appropriate interventions to tackle them.
Second, local governments should have the skills and capacity to effectively use citizen data, including complaint data. As complaint data is being accumulated in real time, local governments should invest in technology for data storage and utilization. Similarly, there should be effort to create or reorganize appropriate data collection and utilization departments within the local government structures, possibly investing in data expertise.
Third, there is a need to create appropriate and ethical data collection and sharing mechanisms for the local governments. For example, currently, the national government of South Korea owns the data of local governments. When local governments need citizen data, they must get approval from the central government. This procedure increases the time and budget needed for urban policy making based on citizen data, reducing thus the efficiency of policy-making processes. As a result, local governments often use unnecessarily repetitive policies that complement existing policies rather than innovative ones [42].

5. Conclusions

There are two major contributions made by this research. First, this study demonstrated that using computational tools such as text mining for analyzing large volumes of text data allows city governments to uncover latent citizens’ policy demand enabling a richer analysis. Specifically, this research involved the analysis of big data on citizen complaints, which reflect what urban residents desire from their local governments in terms of a wide range of issues [43]. The unstructured civil complaints regarding safety and disaster management were used as grounding in the investigation of policy demand. To this end, text mining was performed to extract major keywords associated with the safety and disaster management matters raised in the civil complaints. A panel analysis was also carried out to ascertain the effects of the characteristics of 16 locally governed towns on residents’ policy demands regarding safety and disaster-related complaints. This examination revealed that differences in such characteristics are related to population change arising from urban development, which, in turn, is connected to population differences between newly founded towns and existing localities. On this basis, policy priorities should be changed in accordance with local sociocultural characteristics.
Second, related to civil complaints data, this study illustrated the possibility of how local governments can use citizens’ complaints data. They are increasingly common (see for example, http://change.org, http://gopetition.com/, http://avaaz.org [46,47]), yielding vast numbers of texts that now appear to be amenable to analysis. Questions about the linguistic and semantic features of texts that are related to citizens’ complaint analysis should continue to be explored. It provides a promising approach for capturing emergent policy demands within such bodies of text and lends itself to continuing refinement in the discovery of local issues. The civil complaints data can serve as a useful foundation for policy recommendations that are designed to eliminate social problems and customize policy priorities for local government.
We believe explorations along these lines will yield useful strategies to address the unsatisfactory issues such as diverse complaints from citizens, to facilitate the enhancement of citizen participation in policy making, and to promote sustainable local governments.

Author Contributions

E.L. and J.S. conceived and designed the research study and analyzed empirical findings; E.L. conducted text mining, and J.S. coded panel data and analyzed statistics. K.S.K. and S.L. checked and clarified the results and made major revisions to the manuscript. V.H.P. raised data gathering and summary from the data base viewpoint. All authors read and approved the final manuscript.

Funding

This research received no external funding

Acknowledgments

The authors appreciate to the support from the CeSGIC of XJTLU to finish this research article.

Conflicts of Interest

The authors declare no conflict of interest.

References

  1. Chen, H.; Chiang, R.H.; Storey, V.C. Business intelligence and analytics: From big data to big impact. MIS Q. Dec. 2012, 36, 1165–1188. [Google Scholar] [CrossRef]
  2. McAfee, A.; Brynjolfsson, E. Big data: The management revolution. Harv. Bus. Rev. 2012, 90, 60–68. [Google Scholar] [PubMed]
  3. Hagen, L.; Harrison, T.M.; Uzuner, Ö.; May, W.; Fake, T.; Katragadda, S. E-petition popularity: Do linguistic and semantic factors matter ? Gov. Inf. Q. 2016, 33, 783–795. [Google Scholar] [CrossRef]
  4. Steenbruggen, J.; Tranos, E.; Nijkamp, P. Data from mobile phone operators: A tool for smarter cities? Telecommun. Policy 2015, 39, 335–346. [Google Scholar] [CrossRef] [Green Version]
  5. Ruijer, E.; Grimmelikhuijsen, S.; Meijer, A. Open data for democracy: Developing a theoretical framework for open data use. Gov. Inf. Q. 2017, 34, 45–52. [Google Scholar] [CrossRef]
  6. Lim, C.; Kim, K.H.; Kim, M.J.; Kim, K.J.; Maglio, P.P. From data to value: A nine factor framework for data-based value creation in information intensive services. Int. J. Inf. Manag. 2018, 39, 121–135. [Google Scholar] [CrossRef]
  7. Bibri, S.E.; Krogstie, J. The core enabling technologies of big data analytics and context-aware computing for smart sustainable cities: A review and synthesis. J. Big Data 2017, 4, 38. [Google Scholar] [CrossRef]
  8. Cao, Q.H.; Giyyarpuram, M.; Farahbakhsh, R.; Crespi, N. Policy-based usage control for a trustworthy data sharing platform in smart cities. Future Gener. Comput. Syst. 2017. (In press). Available online: https://www.sciencedirect.com/science/article/pii/S0167739X1731107X (accessed on 13 December 2018).
  9. Abella, A.; Ortiz-de-Urbina-Criado, M.; De-Pablos-Heredero, C. A model for the analysis of data-driven innovation and value generation in smart cities’ ecosystems. Cities 2017, 64, 47–53. [Google Scholar] [CrossRef]
  10. Ang, L.M.; Seng, K.P. Big sensor data applications in urban environments. Big Data Res. 2016, 4, 1–12. [Google Scholar] [CrossRef]
  11. Al Nuaimi, E.; Al Neyadi, H.; Mohamed, N.; Al-Jaroodi, J. Applications of big data to smart cities. J. Internet Serv. Appl. 2015, 6, 25. [Google Scholar] [CrossRef] [Green Version]
  12. Fernández-Ares, A.; Mora, A.M.; Arenas, M.G.; García-Sanchez, P.; Romero, G.; Rivas, V.; Merelo, J.J. Studying real traffic and mobility scenarios for a smart city using a new monitoring and tracking system. Future Gener. Comput. Syst. 2017, 76, 163–179. [Google Scholar] [CrossRef]
  13. Folger, P. Geospatial Information and Geographic Information Systems (GIS): An Overview for Congress; Diane Publishing: Darby, PA, USA, 2011. [Google Scholar]
  14. Aguilera, U.; Peña, O.; Belmonte, O.; López-de-Ipiña, D. Citizen-centric data services for smarter cities. Future Gener. Comput. Syst. 2017, 76, 234–247. [Google Scholar] [CrossRef] [Green Version]
  15. Maglio, P.P.; Lim, C.H. Innovation and big data in smart service systems. J. Innov. Manag. 2016, 4, 11–21. [Google Scholar] [CrossRef]
  16. Walravens, N. Mobile city applications for Brussels citizens: Smart city trends, challenges and a reality check. Telemat. Inform. 2015, 32, 282–299. [Google Scholar] [CrossRef]
  17. NIA. Big Data Use Cases in South Korea; National Information Society Agency of South Korea: Seoul, Korea, 2013. [Google Scholar]
  18. Lee, W. Smart city management using big data. BDI Focus 2013, 190, 1–12. [Google Scholar]
  19. Kitchin, R. The real-time city? Big data and smart urbanism. GeoJournal 2014, 79, 1–14. [Google Scholar] [CrossRef]
  20. Díaz-Díaz, R.; Muñoz, L.; Pérez-González, D. Business model analysis of public services operating in the smart city ecosystem: The case of SmartSantander. Future Gener. Comput. Syst. 2017, 76, 198–214. [Google Scholar] [CrossRef] [Green Version]
  21. Cicirelli, F.; Guerrieri, A.; Spezzano, G.; Vinci, A. An edge-based platform for dynamic smart city applications. Future Gener. Comput. Syst. 2017, 76, 106–118. [Google Scholar] [CrossRef]
  22. Barns, S. Mine your data: Open data, digital strategies and entrepreneurial governance by code. Urban Geogr. 2016, 37, 554–571. [Google Scholar] [CrossRef]
  23. Bibri, S.E. The IoT for smart sustainable cities of the future: An analytical framework for sensor-based big data applications for environmental sustainability. Sustain. Cities Soc. 2018, 38, 230–253. [Google Scholar] [CrossRef]
  24. Hashem, I.A.T.; Chang, V.; Anuar, N.B.; Adewole, K.; Yaqoob, I.; Gani, A.; Chiroma, H. The role of big data in smart city. Int. J. Inf. Manag. 2016, 36, 748–758. [Google Scholar] [CrossRef] [Green Version]
  25. Rabari, C.; Storper, M. The digital skin of cities: Urban theory and research in the age of the sensored and metered city, ubiquitous computing and big data. Camb. J. Reg. Econ. Soc. 2015, 8, 27–42. [Google Scholar] [CrossRef]
  26. Clarke, A.; Steele, R. How personal fitness data can be re-used by smart cities. In Proceedings of the 2011 Seventh International Conference on Intelligent Sensors, Sensor Networks and Information Processing, Adelaide, SA, Australia, 6–9 December 2011; pp. 395–400. [Google Scholar]
  27. Perera, C.; Zaslavsky, A.; Christen, P.; Georgakopoulos, D. Sensing as a service model for smart cities supported by internet of things. Trans. Emerg. Telecommun. Technol. 2014, 25, 81–93. [Google Scholar] [CrossRef]
  28. Andrienko, G.; Andrienko, N.; Bosch, H.; Ertl, T.; Fuches, G.; Jankowski, P.; Thom, D. Thematic patterns in georeferenced tweets through space-time visual analytics. Comput. Sci. Eng. 2013, 15, 72–82. [Google Scholar] [CrossRef]
  29. Ghosh, D.; Guha, R. What are we ‘tweeting’ about obesity? Mapping tweets with topic modeling and geographic information system. Cartogr. Geogr. Inf. Sci. 2013, 40, 90–102. [Google Scholar] [CrossRef]
  30. Widener, J.; Li, L. Using geolocated twitter data to monitor the prevalence of healthy and unhealthy food references across the US. Appl. Geogr. 2014, 54, 189–197. [Google Scholar] [CrossRef]
  31. Naver Knowledge Encyclopedia. Available online: https://terms.naver.com/entry.nhn?docId=958728&cid=47312&categoryId=47312 (accessed on 7 February 2018).
  32. KLID. Study on Developing Strategies for Big Data Application in Private and Public Sector through Case-Study Analysis; Korea Local Information Research & Development Institute: Seoul, Korea, 2014. [Google Scholar]
  33. Mora, L.; Bolici, R. How to become a smart city: Learning from Amsterdam. In Smart and Sustainable Planning for Cities and Regions; Bisello, A., Vettorato, D., Stephens, R., Elisei, P., Eds.; Springer: Berlin/Heidelberg, Germany, 2017; pp. 251–266. [Google Scholar]
  34. Maps of World. Available online: https://www.mapsofworld.com/where-is/namyangju.html (accessed on 18 March 2019).
  35. Namyangju. Available online: https://www.nyj.go.kr/english/2019 (accessed on 17 January 2019).
  36. Wikipedia. Available online: https://en.wikipedia.org/wiki/Namyangju (accessed on 17 January 2019).
  37. Namyangju, S. 2015 Namyangju City Social Research Results; Namyangju Si: Namyangju, Korea, 2015. [Google Scholar]
  38. Lim, C.; Maglio, P.P. Data-driven understanding of smart service systems through text mining. Serv. Sci. 2018, 10, 154–180. [Google Scholar] [CrossRef]
  39. R package for Korean NLP. Available online: https://github.com/haven-jeon/KoNLP (accessed on 17 November 2018).
  40. Lee, E.; Kim, D. Does the institution actually change? An exploratory study on policy idea and policy competition. Inf. Polity 2018, 23, 163–175. [Google Scholar] [CrossRef]
  41. Jun, D.; Hagen, L.; Lee, E.; Lim, H.; Kim, D. How big data contributes to the building of citizen-centric smart cities: The case of Namyangju city in Korea. In Proceedings of the 19th Annual International Conference on Digital Government Research: Governance in the Data Age, Delft, The Netherlands, 30 May–1 June 2018; p. 80. [Google Scholar]
  42. Wooldridge, J.M. Econometric Analysis of Cross Section and Panel Data; MIT Press: Cambridge, MA, USA, 2010. [Google Scholar]
  43. Wooldridge, J.M. Introductory Econometrics: A Modern Approach; Nelson Education: Toronto, ON, Canada, 2015. [Google Scholar]
  44. GoPetition homepage. Available online: http://gopetition.com (accessed on 8 October 2019).
  45. Manyika, J. Big Data: The Next Frontier for Innovation, Competition, and Productivity. 2011. Available online: http://www. mckinsey.com/Insights/MGI/Research/Technology_and_Innovation/Big_data_The_next_frontier_for_innovation (accessed on 9 October 2019).
  46. The World’s Platform for Change. Available online: http://change.org (accessed on 11 October 2019).
  47. Avaaz homepage. Available online: http://avaaz.org (accessed on 13 October 2019).
Figure 1. Map of Namyangju in South Korea [34,36]. Note: Administrative districts: five eups (one branch office), four myeons, and seven dongs (eight administrative welfare centers). Sustainability 11 06140 i001 represents Seoul, the capital of Korea [34].
Sustainability 11 06140 g001
Figure 2. Most frequently used words in civil complaints elicited through text mining.
Sustainability 11 06140 g002
Figure 3. Frequency of safety- and disaster-related words: (a) for the entire period and (b) by year.
Sustainability 11 06140 g003
Table 1. Variables used for the panel analysis.
Variable SymbolMeasures
Complaints CHygiene-related complaintsH Number   of   hygiene   related   complaints N ×   100  
Traffic safety complaints T Number   of   traffic   safety   complaints N ×   100  
Lighting facility complaintsL Number   of   lighting   facility   complaints N ×   100  
Disaster-related complaintsD Number   of   disaster   related   complaints N ×   100  
Explanatory variablesFemaleFe Number   of   females   P o p ×   100  
Young (under 40)Yo Number   of   people   under   40   P o p ×   100  
Internal migrantsIn Number   of   internal   migrants   P o p ×   100  
External migrants Ex Number   of   external   migrants   P o p ×   100  
Car ownership Car Number   of   registered   cars   P o p ×   100  
New townNewNew town = 1, old town = 0
Control variablesComplaints per population C P o p   C P o p
SummerSuSummer = 1, others = 0
AutumnAuAutumn = 1, others = 0
WinterWiWinter = 1, others = 0
Table 2. Descriptive statistics (n = 1595).
VariableMeanStd. Dev.MinMax
Hygiene-related complaints (H)0.4230.6280.0006.977
Traffic safety complaints (T)12.4615.7240.00043.939
Lighting facility complaints (L)0.5110.7050.0007.143
Disaster-related complaints (D)2.8243.8700.00057.746
Female49.4671.52444.53051.360
Young (under 40)51.2207.68633.53567.406
Internal migration population rate2.4072.3000.17669.868
External migration1.0071.0200.10313.511
Car ownership28.8143.77222.29744.491
New town0.1690.3750.0001.000
Complaints per population0.8360.6030.0734.481
Spring0.1810.3850.0001.000
Summer0.1610.3670.0001.000
Autumn0.1500.3580.0001.000
Winter0.1700.3760.0001.000
Table 3. Effects of town characteristics on safety-related civil complaints.
Explanatory VariablesComplaints
Hygiene-Related (H)Traffic (T)Lighting (L)Disaster (D)
FEREFEREFEREFERE
Fe−0.06560.00687−1.270 ***−1.712***−0.206 ***−0.02401.603 ***0.339 **
(0.0481)(0.0191)(0.384)(0.245)(0.0523)(0.0217)(0.242)(0.133)
Yo0.0264 ***0.0126 ***0.275 ***0.232 ***0.0354 ***0.0193 ***−0.425 ***−0.184 ***
(0.00650)(0.00393)(0.0519)(0.0444)(0.00706)(0.00447)(0.0327)(0.0260)
In−0.00407−0.002020.1210.121 *0.003440.00827−0.0718−0.0519
(0.00931)(0.00881)(0.0743)(0.0733)(0.0101)(0.00968)(0.0469)(0.0478)
Ex−0.0002910.00687−0.172−0.301 *0.03350.0735 ***−0.140−0.303 ***
(0.0230)(0.0199)(0.184)(0.174)(0.0250)(0.0219)(0.116)(0.111)
Car0.0215 **0.0139 **−0.237 ***−0.305 ***−0.00640−0.0172 **0.0756*0.226 ***
(0.00851)(0.00624)(0.0679)(0.0614)(0.00924)(0.00698)(0.0428)(0.0377)
New 0.0402 −3.571 *** −0.0303 3.464 ***
(0.0617) (0.990) (0.0716) (0.482)
C/Pop0.0227−0.01880.911 **0.942 ***0.122 **0.0519−0.396 *−0.317
(0.0448)(0.0428)(0.357)(0.353)(0.0486)(0.0470)(0.225)(0.231)
Su−0.107 **−0.138 ***−0.0736−0.198−0.229 ***−0.246 ***0.653 ***1.338 ***
(0.0485)(0.0466)(0.387)(0.382)(0.0527)(0.0510)(0.244)(0.250)
Au−0.0421−0.0826 *−1.222 ***−1.346 ***−0.0764−0.110 **0.855 ***1.534 ***
(0.0488)(0.0471)(0.390)(0.384)(0.0531)(0.0515)(0.246)(0.252)
Wi−0.125 **−0.174 ***3.496 ***3.392 ***0.195 ***0.148 ***0.812 ***1.550 ***
(0.0490)(0.0469)(0.391)(0.384)(0.0532)(0.0514)(0.247)(0.251)
Constant1.729−0.89266.71 ***93.48 ***8.949 ***1.105−56.58 ***−11.60 *
(2.381)(0.979)(19.01)(12.23)(2.587)(1.113)(11.99)(6.683)
n15951595159515951595159515951595
R-squaredWithin = 0.0291,
Between = 0.1075,
Overall = 0.0236
Within = 0.0255,
Between = 0.4877,
Overall = 0.0411
Within = 0.1159,
Between = 0.0918,
Overall = 0.1101
Within = 0.1141,
Between = 0.7478,
Overall = 0.2282
Within = 0.0750,
Between = 0.0634,
Overall = 0.0176
Within = 0.0643,
Between = 0.5954,
Overall = 0.0912
Within = 0.2683,
Between = 0.5660,
Overall = 0.0206
Within = 0.2390,
Between = 0.1739,
Overall = 0.1961
Model testHausman test: χ2(9) = 21.48,
Prob. > χ2 = 0.0107
POLS relevance test: χ2(1) = 4.80,
Prob. > χ2 = 0.0142
Hausman test: χ2(9) = 10.68,
Prob. > χ2 = 0.2982
POLS relevance test: χ2(1) = 101.96,
Prob. > χ2 = 0.0000
Hausman test: χ2(9) = 37.85,
Prob. > χ2 = 0.0000
POLS relevance test: χ2(1) = 10.45,
Prob. > χ2 = 0.0006
Failure to meet the asymptotic assumptions of the Hausman testPOLS relevance test: χ2(1) = 440.29,
Prob. > χ2 = 0.0000
Notes: Standard errors are in parentheses. The Hausman test is for the null hypothesis that the difference in coefficients is not systematic (i.e., the coefficients are equal). The POLS test indicates the Breusch and Pagan Lagrangian multiplier test for random effects, which determines whether the null hypothesis reject or not, and a common intercept is being or not (i.e., pooled OLS is appropriate). *** p < 0.01. ** p < 0.05. * p < 0.10.
Table 4. Comparisons with t-tests for key variables between new and old towns.
GroupThree New Towns vs. Old TownsByulnae-Dong vs. Joan-MyeonHopyoung-Dong vs. Soodong-MyeonPyungnae-Dong vs. Chingun-Eup
Fe17.11***29.119***25.117***92.081***
Yo22.605***86.265***22.225***20.730***
In3.818***7.891***9.842***7.914***
Ex6.634***8.492***−1.269 7.835***
Car−2.399**−5.726***−0.508 −1.485
Total complaints0.208 12.468***14.983***−10.378***
C/Pop−8.857***−8.460***−7.894***−18.442***
H4.131***0.656 3.708***3.838***
T−10.484***−6.674***−5.614***−9.452***
L3.14***4.719***0.700 2.419**
D7.608***13.923***5.597***1.107
Note: *** p < 0.01. ** p < 0.05. * p < 0.10.

