Abstract
Ports are important network nodes for cargo transportation between cities and even countries, and they play vital roles in stimulating urban economies. However, at the same time, port production activities also consume various resources, such as water, electricity, coal, and land. In addition, ports inevitably produce waste—solid, water, gas, and other pollutants—which damages the environment of their hinterland cities, hindering the growth of urban GDP. Therefore, this study sought to build a reasonable system dynamics model to measure the positive and negative effects of ports on cities, and to put forward countermeasures and suggestions for promoting port–city green cooperative development. We selected Shanghai Port as a case study, estimated its parameters with 2010–2017 data, and tested the historical fitness of the model. We then carried out a scheme simulation by changing relevant parameters and comparing coordinated port–city development under different schemes. The simulation results show that increases in sea transportation activity and economic pull coefficients help to propel the growth of port–city GDP to a certain extent, but also cause environmental pollution and resource wastage. Therefore, effective energy-saving and emission-reduction measures are needed to achieve the coordinated development of economic growth and green environmental protection in ports and cities.
1. Introduction
As the circulation hub supporting a city’s opening to the outside world, a port is an important cargo distribution and industrial agglomeration area [1,2]. In 2017, the top five cities in China’s GDP ranking were all port cities, except for Beijing [3]. Port activities themselves contribute to urban GDP, and at the same time, ports can promote the development of both upstream and downstream industries. In addition, as a necessary piece of infrastructure for the development of maritime transport services, ports can facilitate the export of urban industrial products, which has become an important growth point for coastal economic development.
There is no doubt that ports play an important role in promoting urban economic development [4,5]; however, the negative impacts of their activities, such as emissions (at the regional, national, and global levels), health and safety issues, and resource management, cannot be overlooked. In the past, port construction and operation at the expense of energy and the environment was a common phenomenon globally. Port operations use a large number of production resources—non-renewable coal, water, and land. In addition, the transportation of ships and trucks, operation of machinery, and production operations in port industrial parks cause a lot of environmental pollution, propelling hinterland cities to invest in pollution governance [6,7]. In addition, this pollution also poses a threat to the health of residents in hinterland cities. With the concept of “green development” becoming more popular in recent years, governments, enterprises, and researchers have been addressing the question of how to reduce waste emissions and energy consumption caused by port-based production operations and port-vicinity industrial parks, and also how to coordinate the benign interaction between ports and cities under the conditions of promoting energy conservation and emission reduction.
The interactive development system of a port and city is dynamic, with multiple feedback and time-delay factors. These non-linear characteristics often lead to the unrealistic use of linear theory and static points of view to solve problems in the system. As a subject based on information feedback, system dynamics offers great advantages in solving dynamic and non-linear complex system problems. Therefore, based on earlier studies of other port–city relationships, this study chose Shanghai Port as a case study, establishing a system dynamics model of the port, economy, and environment, and simulating the interaction between various factors affecting the development of ports and hinterland cities.
The rest of this paper is arranged as follows: Section 2 reviews the literature and raises three questions. Section 3 analyzes the system and causal feedback loops. Section 4 estimates and tests the parameters of a simulation model based on actual historical data of Shanghai Port. In Section 5, the multi-scheme simulation which quantitatively analyzed the economic pull effect and quantity of waste discharge at Shanghai Port under different circumstances is described. Finally, Section 6 summarizes the analysis from Section 5 and draws conclusions.
2. Literature Review
As early as the 1950s, Chinese scholars conducted detailed analyses and elaborations on the development and historical processes of port cities [8]. Early studies on the interaction between ports and cities focused on exploring the synergy between ports’ economies and cities’ economies [9,10,11]. The Delaware River Port Authority pointed out in 1953 that port cargo throughput could result in a lot of direct benefits to the local economy. They comprehensively studied the economic contribution of the Delaware River Port to its hinterland, and provided a new way of thinking for later studies [12]. Subsequently, the Port Authority of New York defined industries that are related to port activities in its report, and used the input–output model (a quantitative research method) to analyze the impact of the port economy on urban GDP and other industrial sectors. The report successfully linked port and urban development and was the most representative research of its time [13]. On this basis, Yochum et al. introduced the concepts of port-related industry, port-attracted industry, and port-induced industry [14].
It is widely accepted that the pulling effect of the port economy, based on an input–output perspective, is divided into three parts, as mentioned above. Scholars have often used this method to calculate the correlation effects of ports. Based on the statistical data of Santander Port and the city of Santander in 2005, Pablo Coto-Millán et al. calculated the direct, indirect, and induced effects of Santander Port on the city and its hinterland economy [15]. Jung B studied Busan and Incheon ports in South Korea, concluding that ports need to strengthen their cooperation and integration into the global value chain, without which the correlation effect of port activities on the urban economy will gradually weaken [16]. On the basis of traditional ports, Lee et al. further explored the impact of smart ports—which involve high-tech industries, such as the Internet of Things, and information and communications technology—on the Korean economy. They found that the economic pulling effect of industries in smart ports is mainly reflected in forward correlation, and there, it has a greater impact on productivity, added value, and employment [17].
Chinese scholars have also used this model to quantify the direct and indirect contribution of their country’s port industry, outlining policy applications by using input–output analyses [18]. At present, the interaction degree of the port–city relationship can be qualitatively analyzed and quantitatively characterized by constructing an index system or evaluation model, which can verify the mutual promotion between port development and economic growth [19,20,21,22]. In terms of the interaction mechanism between port and city, although their size is not the main influencing factor [23], labor and capital factors do have a positive pulling effect on the economic development level of port cities [24], and the driving mechanism of different port cities at different stages of economic development is not the same [25].
With the deepening of research, a comprehensive index system including the economy, was constructed to evaluate the comprehensive impact of ports on cities. Pablo Coto-Millán et al. analyzed the relationship between port infrastructure investment and regional output value, employment, human resources, and private capital, combining econometrics, industrial economics, and social project evaluation methods [26]. Taking Dubai Port as an example, Mina Akhavan compared the similarities and differences between the development models of port cities in the Middle East and those in Asia and Europe, and found that the dynamic evolution of Dubai Port City was influenced by oil revenue, government strategy, and external factors [27]. C.A. Schipper et al. developed a comparative method to evaluate the key indicators of ports, which included social, economic, and environmental performance. Through that sustainable performance evaluation method, they ranked the long-term plans and vision documents of selected ports [28]. On the basis of reviewing the existing sustainable development frameworks, Lam et al. took Guangzhou and Shenzhen as examples and suggested that port cities should establish a structured framework with economic, social, and environmental indicators as the main categories, so as to provide a reference for stakeholders and the government to promote the sustainable development of port cities [29].
In recent years, people have begun to notice that the rapid development of port cities is partly at the expense of resources and the environment [30]. In fact, Brooke first analyzed the environmental impact factors involved in port construction based on the green concept in 1992 [31]. Later, alongside the continuous evolution of the port–city relationship, scholars began to pay attention to the sustainability of the port economy. A large number of scholars have measured and calculated the ecological-environmental index of ports [32,33,34,35]. Others have attempted to simulate and analyze the operation mode of port cities by means of system dynamics, in order to explore the green development of ports and the sustainability of the port–hinterland interaction. Mamatok et al. used a system dynamics model to analyze the carbon emissions of container transportation in ports [36]. Geng et al. took Qingdao Port as an example to study the emissions of ships’ exhaust gas in the port by establishing a system dynamics model [37]. Liu et al. established a system dynamics model of the interaction between ports and cities based on the green concept in order to describe the relations between ports and cities systematically, considering economic promotion, resource consumption, and environmental pollution [38]. Zhao et al. analyzed the interactive development of Tianjin port city and proposed enhancing environmental protection and resource saving to promote the sustainable development of ports [39]. Hou and Geerling studied the sustainable development of Shanghai Port and its hinterland transportation system, and compared four choices to improve the sustainable transportation performance of the port hinterland through a system dynamics model [40].
In summary, existing scholars have produced abundant research on the interaction between port and city to promote urban economic development. Furthermore, the analysis of green, sustainable construction of port cities is also deepening. On the basis of previous research, this study constructed a system dynamics model from the perspective of green and sustainable development, and predicted and evaluated the positive and negative impacts of Shanghai Port on its hinterland until 2025. The following questions are the main concerns of this paper: (1) Does Shanghai′s current port–city operation mode conform to the development concept of a “green port” until 2025? (2) How can the contribution of Shanghai Port’s production to urban economic development be increased? (3) How can the damage to the urban environment and resources caused by the production operations of Shanghai Port be reduced? To answer those three questions, we traced the economic pulling role and the environmental resource loss paths of ports, and added the concept of green port GDP into the model. At the same time, we also considered the possible limitations of port investment and shoreline resources in terms of increasing port cargo throughput, bringing us closer to the actual situation of Shanghai Port’s development, and depicting the coordinated and interactive development of Shanghai Port and city scientifically and intuitively.
3. Research Design
3.1. Methodology
System dynamics is a subject that analyzes and studies information feedback systems. It is the unification of structural methods, functional methods, and historical methods. On the basis of qualitative analysis, a problem of a complex system can be quantitatively simulated by computer software using this method. System dynamics considers that the operation mode and characteristics of a system mainly depend on its internal feedback mechanism and behavior structure. Therefore, the system dynamics model can be built as a “laboratory” of the actual system by dynamically describing and establishing the relationships among the system and its subsystems. Then, one can analyze and solve a series of problems in social, economic, ecological, and biological, non-linear, complex, large-scale systems.
As shown in Figure 1 [41], when using the system dynamics model to analyze and solve a problem, one should first put forward clear and specific practical problems. Secondly, according to the subject and its behavior in relation to the problem, the system-boundary of the object of study can be determined. Thirdly, according to the interaction behavior and interaction mechanism among the subsystems, one can find the causal feedback relationship and draw the causal feedback loops. Fourthly, the causal feedback loops can be refined, and the overall operation model of the system can be built by the important state variables, speed variables, and auxiliary variables, which are selected to characterize the system boundary. At the same time, simulation Equations should be established. Fifthly, the values of specific coefficients in the simulation Equation are determined by historical data, and the fitting degree between the estimated value of the system model and the historical value should be tested. After determining the accuracy and scientific nature of the simulation model, one can predict and simulate the future development of the relevant indicators. Finally, by adjusting the correlation coefficients, one can analyze different policies and compare their various benefits, so as to provide a reference for stakeholders and decision makers.
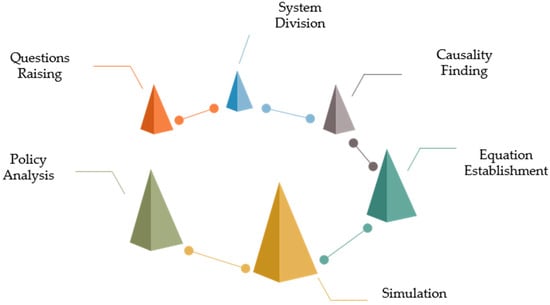
Figure 1.
System dynamics modeling process.
3.2. System Division
Based on the analysis of the three abovementioned problems, we divided the system into three subsystems: the port subsystem, urban economic subsystem, and environment and resources subsystem. Among them, the port subsystem can be further divided into the port input subsystem (that is, the port value creation activity) and the port output subsystem (that is, the port investment and construction activity). In the green coordinated development system of port and city, on the one hand, the port subsystem, urban economic subsystem, and environment and resources subsystem follow their own operation and development rules; on the other hand, they also need to accept feedback from each other. The structure of the system is shown in Figure 2. Among the elements of the system, the port subsystem, as an important economic growth pole, while driving the growth of urban GDP, will simultaneously increase the loss of urban resources and environmental pollution and have a negative effect on the environment resources subsystem. An increase in resource occupancy cost and environmental governance cost will increase the loss of urban GDP, which will hinder the development of the port to a certain extent.
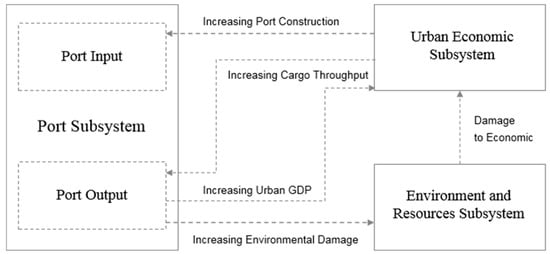
Figure 2.
Systematic structure division.
3.3. Causality Finding
A detailed description of the causal feedback loops in the port–city green cooperative development system can clearly reflect the interactions among the subsystems. The main factors in the port subsystem are the port throughput capacity, port cargo throughput, port pressure (reflecting the extent to which port cargo handling demand exceeds port handling capacity), port-driven GDP, port revenue, port profit, port investment, and port demand. Port investment and port demand, as the interface of the urban economic subsystem to the port subsystem, are affected by the amount of investment in fixed assets and trade volumes in the city. On the one hand, port production directly provides power for the growth of urban GDP by generating economic benefits; on the other hand, it produces a negative accumulation effect on urban GDP through five relevant factors of the environment and resources subsystem; namely, waste solid discharge, waste water discharge, waste gas discharge, energy occupation, and water resources occupation. These factors interact with each other and form a causal feedback loop, as shown in Figure 3.
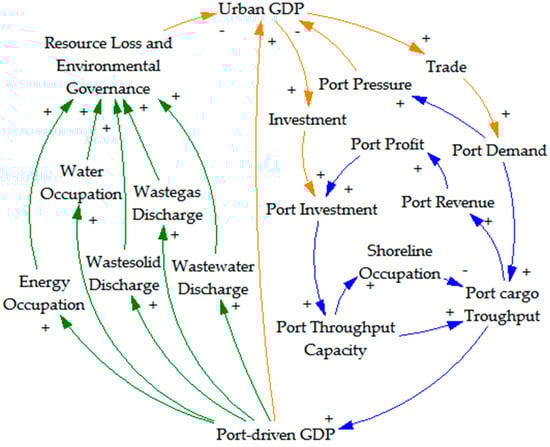
Figure 3.
Causal Feedback Loops in the System. Notes: Different colors are used to highlight the subsystems. The orange paths refer to the urban economic subsystem; the blue refer to the port subsystem; and the green refer to the environment and resources subsystem.
Urban economic subsystem and port subsystem: (a) Urban GDP → + Trade → + Port Demand → + Port Pressure → − Urban GDP. (b) Urban GDP → + Trade → + Port Demand → + Port Cargo Throughput → + Port-Driven GDP → + Urban GDP. (c) Urban GDP → + Investment → + Port Investment → + Port Throughput Capacity → + Port Cargo Throughput → + Port-Driven GDP →+Urban GDP. Among them, path (a) is a negative feedback cycle, and an increase in urban GDP will lead to an increase in the load of port production operations, which in turn will inhibit the development of the urban economy. Routes (b) and (c) are positive feedback cycles; that is, the promotion of urban GDP will promote the development of the port through trade and investment channels, and then provide impetus for urban economic growth.
Urban economic subsystem, port subsystem, and environment resources subsystem: (d) Urban GDP → + Trade → + Port Demand → + Port Cargo Throughput → + Port-Driven GDP → + Resource Occupation and Environmental Governance →−Urban GDP. (e) Urban GDP → + Investment → + Port Investment → + Port Throughput Capacity → + Port Cargo Throughput → + Port-Driven GDP → + Resource Occupation and Environmental Governance →−Urban GDP. (f) Urban GDP → + Investment → + Port Investment → + Port Throughput Capacity → + Shoreline Occupation →−Port Cargo Throughput → + Port-driven GDP → + Urban GDP. Paths (d)–(f) are all negative feedback cycles. The resource loss and environmental governance in paths (d) and (e) can be divided into five parts: energy occupation, water occupation, waste solid discharge, waste gas discharge, and waste water discharge. Generally speaking, the development of the port economy will cause resource occupation and environmental pollution, which will lead to resource depletion and environmental governance costs that will hinder urban economic growth. In addition, the limitation of coastline resources is another important factor restraining the sustainable and coordinated development of the port and urban economies.
Internal circulation of the port subsystem: (g) Port Cargo Throughput → + Port Revenue → + Port Profit → + Port Investment → + Port Throughput Capacity → + Port Cargo Throughput. Path (g) is a positive feedback cycle, which reflects the positive effect by which the profit creation of the port itself can provide financial support for port construction and further promote port development.
4. Simulation Model and Equation
4.1. Simulation Design
After analyzing the causal feedback loops of the system, the factors in each loop were described in more detail by introducing state variables, rate variables, and auxiliary variables; and an SD (stock flow diagram) flow graph model was constructed, as shown in Figure 4. As analyzed above, the whole system can be divided into four subsystems for research.
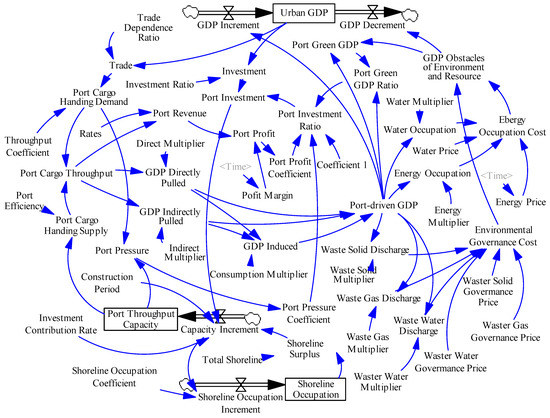
Figure 4.
System stock flow diagram.
4.1.1. Urban Economic Subsystem
In the subsystem of the urban economy (see Figure 5), the state variable of urban GDP is obtained by integrating the difference between GDP growth and GDP reduction. Because the system only considers port-related production activities and their impacts, GDP increment depends on all the values of port activities, and GDP decrement equals the obstacles related to environment and resources caused by port production activities. The quantity of urban GDP can affect the volume of trade and investment in fixed assets, which may further influence the port cargo throughput and the port investment.
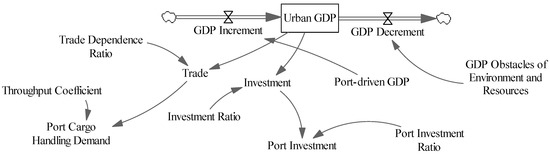
Figure 5.
Urban economic subsystem stock flow diagram.
4.1.2. Port Input Subsystem
As described above, port investment depends on how much of the urban fixed assets investment is invested in port construction; that is, the index of port investment ratio. As shown in Figure 6, the port investment rate is affected by three factors; namely, port profit, freight pressure, and green port-GDP rate. It is very easy to understand that for port enterprises, the greater the profits brought by port production, the more funds they will invest to expand port construction for getting more returns, so that the port investment rate will be higher. At the same time, if the existing port throughput capacity cannot meet the needs of maritime transport, this means that further increases in port investment and further strengthening of port construction are needed. In addition, the high green GDP rate of ports, which can also play a role in promoting the construction of ports, shows that ports have a strong pulling effect on the economy and cause a low level of damage to the environment and resources. Port investment and the port investment ratio can be calculated by the following Equations:
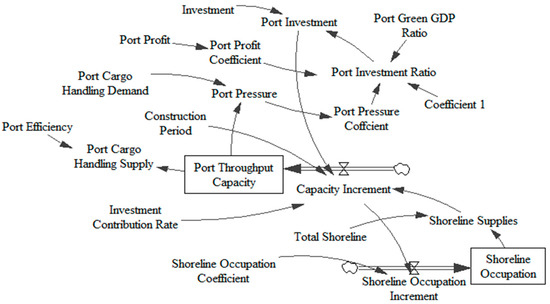
Figure 6.
Port input subsystem stock flow diagram.
Among them, the port pressure coefficient and port profit coefficient are the look-up functions of port pressure and port profit, respectively, and port pressure depends on the proportion of freight demand exceeding port cargo handling capacity [42], as shown in the Equation below:
Port investment will increase port throughput capacity, but as port construction takes a certain period of time, the increase in port throughput capacity will be delayed [43]. At the same time, the increase in port throughput capacity is not unlimited. It is subject to the constraints of the shoreline supply available [42]. Port construction can only be carried out when there is a surplus of shoreline, as shown in Equation (4). In turn, the occupation of shoreline resources is also related to the increment in port throughput capacity, as shown in Equation (6).
Port cargo handling supply depends on port cargo handling capacity and port efficiency (usually greater than 1); that is:
4.1.3. Port Output Subsystem
As described in 4.1.1, by means of the throughput coefficient, the quantity of goods traded by sea in foreign trade can be measured; that is, the index of port cargo handling demand. In the port output subsystem (see Figure 7), the same as for other production activities, the actual volume of cargo transported by a port is determined by both demand and supply. Port cargo handling demand and port cargo throughput can be calculated by the following Equations:
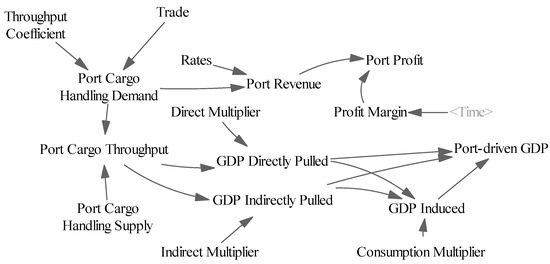
Figure 7.
Port output subsystem stock flow diagram.
For port enterprises, an increase in port cargo throughput will promote increases in port revenue and port profit. For the national economy, the economic contribution of port production mainly involves three parts: direct economic contribution, indirect economic contribution, and induced economic contribution [43].
Direct economic contribution refers to the contribution of a port′s direct economic activities to the urban economy; that is, the initial or first-round impact of the port and its related industries on the national economy. Therefore, direct economic contribution should be calculated by merging the added value of enterprises and institutions engaged in direct economic activities. Indirect economic contributions can be divided into a forward effect and a backward effect. The full operation of the port transport function can promote the circulation of raw materials and products in various production departments, and create conditions for the original production departments to expand production. For the production of these departments, port service is essentially an indispensable intermediate input. At the same time, the construction of the port cannot be separated from the construction of infrastructure, which requires a large amount of raw materials, electricity, and other related resources. The forward and backward correlation effects of port-related industries lead to expansion of the production and efficiency of related industries, such as construction, finance, insurance, machinery manufacturing, and so on, which in turn increases the income of practitioners in these industries. Part of this income is used for consumption, which will increase the ultimate demand of society, as well as stimulate expansion of production and further increase income. This cycle is called induced economic contribution. Port-driven GDP includes the added-value generated by direct port production and the added value of other industries caused by the input–output function of related industries and consumption. The Equation for port-driven GDP is as follows:
4.1.4. Environment and Resources Subsystem
As shown in Figure 8, port-driven GDP will result in waste discharge and resource occupation, increase the cost of environmental treatment and resource consumption, and finally, lead to obstacles to GDP growth. Waste discharge and resource occupation, separately, include waste solid, waste gas, waste water, energy resources, and water resources. The port’s green GDP can be obtained by deducting the GDP obstacles related to environment and resources from the port-driven GDP, so that we can calculate the green port GDP ratio [44].
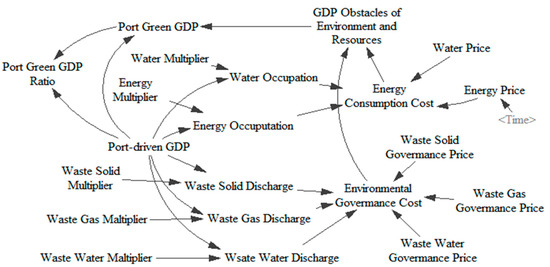
Figure 8.
Environment and resources subsystem stock flow diagram.
4.2. Case Study
4.2.1. Overview of Shanghai Port
Shanghai Port is located in the middle of the coastline in the eastern coastal area of China, with convenient water, rail, and air transportation networks, and it is an important hub port for opening up trade in the Yangtze River Delta and even the whole country. Shanghai is relied upon as China′s largest economic, financial, trade, science and technology, information, and cultural center, and is the largest port city in the country. In 2017, Shanghai′s gross national product reached 3063.30 billion yuan [45], ranking first in the country; port cargo throughput was 750.51 million tons, second only to Ningbo′s Zhoushan Port; port container throughput was 40.23 million (definition) TEU (Transmission extension unit) [46], ranking first in the country. At the same time, the mutual promotion of port production and the urban economy also has a significant impact on environmental resources. In 2017, Shanghai′s waste solid and waste water emissions reached 0.016 and 21.20 billion tons respectively, while its gas emissions reached 1386.70 billion cubic meters, and its energy consumption reached 118.59 million tons of standard coal [47]. With the continuous construction of a resource-saving and environment-friendly society, the question of how to promote the coordinated development of the port–city system towards a green and sustainable direction has become an important issue to be solved by enterprises and government departments in recent years.
4.2.2. Coefficient Estimation
The simulation model of Shanghai’s port–city green cooperative development started in 2010; the time change DT (Differential step) was set to one year; the simulation step was unchanged according to the default value, and the termination year was 2025. The data involved in the model were from the China Statistical Yearbook, Shanghai Statistical Yearbook, China Port Yearbook, the website of the Ministry of Transportation, and the Shanghai Statistical Bureau. The coefficients used in the model, such as foreign trade dependence ratio, investment ratio of fixed assets, throughput coefficient, rates, waste solid multiplier, waste water multiplier, waste gas multiplier, energy multiplier, and water resource multiplier, were obtained by linear regression. Government prices for waste solid, waste gas, and waste water were all obtained by calculating the average value. Because profit margins and energy prices change with time, the port profit coefficient varied with port profit, and the port pressure coefficient varied with port pressure; they were all set in the form of a table function. The determination of direct pull multiplier, indirect pull multiplier, and consumption multiplier was based on the input–output model of port economy contribution in Jiang′s [48] research. The scope of the port direct production operation was defined as the port transportation and logistics industry, port-vicinity industry, shipping service industry, port construction industry, and port government functional departments. The economic pulling role of the port was quantified from three parts: direct economic contribution, indirect economic contribution, and economic consumption contribution. More information on parameter definitions and data sources can be found in the Appendix A and Appendix B.
4.2.3. Historical Matching Testing
In order to verify the accuracy and scientific nature of the model’s construction, equation establishment and coefficient determinations, after checking the consistency of the model structure and dimension using Vensim software, historical fitting was performed with the relevant, actual data of Shanghai Port from 2010 to 2017. The simulation results of the main variables are shown in Table 1. As can be seen, the deviation between the simulation values of the main variables and the corresponding historical real data is not more than ±6%, which proves that the simulation model has a good ability for behavior replication and can scientifically and accurately reflect the interactive relationship in the port–city green coordinated development of Shanghai. The model can be used to predict the future situation and to simulate the effects of relevant policies.

Table 1.
Deviation between simulation and historical values of major variables.
5. Scheme Simulation and Results
5.1. Natural Development Mode
In this mode, we assumed that no change took place in Shanghai Port and the existing operation form was maintained to test Question 1. We set Scheme 0 as a basic simulation; that is, the natural development mode without changing any variables. The simulation results show that by 2025, Shanghai′s GDP will continue to grow, reaching 4,829.08 billion yuan (simulation values of major variables from 2017 to 2025 can be found in Appendix C). Port cargo throughput will increase to 1.18 billion tons, boosting the GDP growth by 303.01 billion yuan. At the same time, the cost of environmental governance and energy consumption caused by port production operations will reach 0.46 and 10.99 billion yuan, respectively. The green GDP of the port will increase to 291.56 billion yuan, which is 54.74% higher than that in 2017. The green GDP rate of the port will also increase from 93.71% to 96.22%. This shows that even under the natural development mode, Shanghai Port can reduce the proportion of environmental pollution and energy resources occupied year by year.
5.2. Port Economic Pulling Mode
In order to prove the role of ports in promoting urban economies and answer Question 2, we adjusted the port economic pulling variables, including the throughput coefficient in Scheme 1, direct multiplier, and indirect multiplier in Scheme 2 (Table 2).
Table 2.
Economic pulling simulation schemes.
In Scheme 1, we improved the throughput coefficient from 0.00026 to 0.00028. The simulation results show that by 2025, Shanghai′s GDP will reach 5096.83 billion yuan, of which 321.80 billion yuan will be driven by the port. The cargo throughput of the port will be 1.26 billion tons, and the cost of environmental governance and energy consumption will reach 0.49 billion yuan and 11.68 billion yuan, respectively. The green GDP of the port will reach 309.63 billion yuan, an increase of 45.14% compared with 2017.
In Scheme 2, we improved the direct multiplier and indirect multiplier from 75.68 and 67.83 to 82 and 72, respectively. The simulation results show that by 2025, Shanghai′s GDP will reach 5136.90 billion yuan, and port cargo throughput will reach 1.22 billion tons, which will stimulate an economic growth of 334.22 billion yuan, resulting in 0.50 billion yuan of environmental control costs and 12.13 billion yuan of energy consumption costs. The green GDP of the port will reach 321.59 billion yuan, an increase of 53.27% compared with 2017.
By comparing the schemes, we found that the average annual growth rate of urban GDP in Scheme 0 was 6.35% from 2017 to 2025, which is 0.15% and 0.18% lower than that in Schemes 1 and 2, respectively. This shows that the measures in the port economic pulling mode are effective for the growth of urban GDP. The average annual growth rate of cargo throughput in Scheme 0 is 5.27% from 2017 to 2025, which is 0.84% and 0.13% higher than that in Schemes 1 and 2, respectively. This shows that the growth rate of cargo throughput in Shanghai Port will slow down with the increase in business volume in Shanghai Port, and the slowdown level in Scheme 1 is even greater. In 2025, the port-driven GDP and GDP obstacles related to environment and resources in Schemes 1 and 2 are both 6.2% and 10.3% higher than that of Scheme 0, indicating that in the port economic pulling mode, the negative inhibition effect of ports on cities is more obvious.
5.3. Port Energy Saving and Emission Reducing Mode
While considering the contribution of ports to urban economic development, the model of port–city green-coordinated development also focuses on the necessity and effectiveness of energy saving and emission reduction in port operations, as in Question 3.
In this mode, we chose the waste solid multiplier, waste gas multiplier, waste water multiplier, energy multiplier, and water multiplier as environmental resource variables to simulate the green development of Shanghai Port from 2017 to 2025. Based on the first three schemes, we set Schemes 3–5 as in Table 3 above.
Table 3.
Energy-saving and emission-reducing simulation schemes.
Scheme 3 reduces the multipliers of environment and resources to varying degrees on the basis of the natural development mode. The simulation results show that by 2025, Shanghai′s urban GDP will reach 4,847.81 billion yuan. Port cargo throughput will be 1.18 billion tons, boosting GDP growth by 303.44 billion yuan. The costs of environmental governance and energy consumption will be 0.38 billion yuan and 8.46 billion yuan, respectively. The green port GDP will be 294.60 billion yuan, which is 54.92% higher than that in 2017. The green port-GDP rate will increase from 94.58% to 97.09%.
Scheme 4 reduces the multipliers of environment and resources to varying degrees on the basis of Scheme 1. The simulation results show that by 2025, Shanghai′s urban GDP will reach 5116.14 billion yuan. Port cargo throughput will be 1.26 billion tons, driving GDP growth up by 322.26 billion yuan. The costs of environmental governance and energy consumption will be 0.40 billion yuan and 8.99 billion yuan, respectively. The green port GDP will be 312.87 million yuan, which is 45.32% higher than that in 2017.
Scheme 5 reduces the multipliers of environment and resources to varying degrees on the basis of Scheme 2. The simulation results show that by 2025, Shanghai′s urban GDP will reach 5157.21 billion yuan. Port cargo throughput will be 1.22 billion tons, driving GDP growth by 334.71 billion yuan. The cost of environmental governance and energy consumption will be 0.42 billion yuan and 9.33 billion yuan, respectively. The green port GDP will be 324.96 million yuan, which is 53.46% higher than that in 2017.
Compared with Schemes 0, 1, and 2, the average annual growth rates of Shanghai′s urban GDP and port cargo throughput increase by 0.05% and 0.02% from 2017 to 2025; the average annual growth rate of port-driven GDP and GDP obstacles related to environment and resources increase by 0.02% and −1.34%, respectively. This shows that the port energy-saving and emission-reduction mode can further expand the port′s contribution to the urban economy and reduce the obstacles to GDP growth on the basis of the port economic pulling mode.
5.4. Results and Discussion
In the above simulation, we mainly focus on the changes of four “green port”-related indicators from 2017 to 2025, namely, port cargo throughput, port-driven GDP, GDP obstacles related to environment and resources, and green port GDP ratio. The simulation results are shown in Figure 9. In contrast to the results mentioned in Section 5.3, an increase in throughput coefficient or economic pulling multiplier can significantly promote the growth of urban GDP. However, it is noteworthy that an increase in cargo throughput in the port will be affected by port capacity and coastline resources. When the demand for port cargo throughput increases too quickly and is higher than the supply capacity of port cargo throughput, the actual cargo throughput will change from demand to supply. In Scheme 0, the port cargo throughput increases from 0.78 billion tons in 2017 to 1.01 billion tons in 2021, consistently equal to the throughput demand. However, in 2022, the demand for throughput increases to 1.07 billion tons, exceeding the supply of 1.04 billion tons, and the growth of actual cargo throughput is restrained. The same phenomenon occurs in Scheme 1, which leads to a situation in which the port-pulling GDP of Scheme 1 is higher in the early period but lower in the later period compared to that of Scheme 2. In addition, the growth of the port’s green GDP in Schemes 1 and 2 is not as good as that of the natural development mode, which indicates that further promoting port operations to promote GDP growth will cause greater damage to the environment and resources, and corresponding energy-saving and emission-reduction measures should be taken. Generally speaking, reducing the multiplier of environment and resources can effectively reduce the waste discharge and resource occupation of ports, and promote the green GDP rate of ports. In 2017, compared with the port economy pulling mode, the environment and resources’ GDP hindrance of various schemes under the energy-saving and emission-reducing mode decreases by 13.77%, and the port’s green GDP increases by 0.92%. In 2025, the increase and decrease ranges of the two indicators change to 22.79% and 1.04%, respectively, indicating that energy-saving and emission-reduction measures can better reduce the obstacles to GDP growth related to the environment and resources and enhance the port’s green GDP. In addition, the implementation of port energy saving and emission reduction can also promote the growth of the city′s overall GDP to a certain extent, and further achieve a positive accumulation effect through increases in port cargo throughput and port-driven GDP, and promote the port–city green coordinated development of Shanghai.
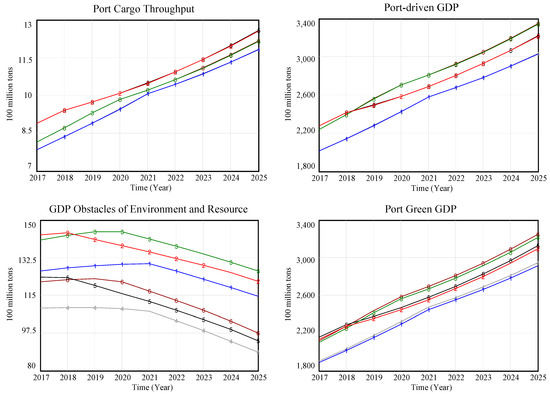
Figure 9.
Simulation results.
6. Conclusions
Based on the analysis of the system structure and causal feedback loops in the green coordinated development of a port and city, an SD system simulation flow chart was constructed in this paper, reflecting the variations of several variables of the port subsystem, urban economic subsystem, and environment and resources subsystem. The fitting degree of the system’s equation was tested using the relevant historical data of Shanghai Port and city from 2010 to 2017. Based on verifying the validity and scientific nature of the system’s structure and quantitative equation, this study forecasted the main indicators of Shanghai Port, such as port cargo throughput, port-driven GDP, GDP obstacles related to environment and resources, and green port-GDP rate in 2017–2025. By adjusting the port economic pulling multiplier and the port energy-saving and emission-reduction multiplier, the simulation of different development schemes was carried out, and the main conclusions are as follows, answering the three questions mentioned in the introduction:
- From the simulation results of Scheme 0, the coordinated port–city economic development of Shanghai is good, and the construction of green sustainable development in the port is noticeably improving. By 2025, Shanghai’s current port–city operation mode will basically conform to the development concept of a “green port.”
- From the simulation results of Schemes 1 and 2, we found that increasing the proportion of sea transportation and enhancing the pulling effect of the port economy can effectively increase the contribution of Shanghai Port’s contribution to urban economic development. However, this will simultaneously cause environmental pollution and resource occupation to a certain extent, which will hinder the long-term green construction of the port. In addition, it should be taken into consideration that the growth of port cargo throughput will be constrained by port throughput in the port economic pulling mode. When port construction lags, the quantity of cargo throughput will change from throughput demand to supply, which will slow down the growth rate of the port and even that of the urban economy. Therefore, a forward-looking vision and timeliness of investment should be guaranteed in the process of port construction. Through large data and internet technology, building effective information feedback channels, and understanding the changes in demand and supply of port cargo handling in a timely manner, it is possible to reasonably grasp the investment in port construction.
- From the simulation results of Schemes 3, 4, and 5, it was verified that reducing solid waste, gas, energy, the water discharge multiplier, and water resources’ occupancy multiplier can greatly reduce the cost of environmental treatment and resource consumption, can effectively enhance the green GDP ratio of ports, and can promote green development. Energy-saving and emission-reduction measures can form a positive accumulation effect on core variables, such as urban GDP, port cargo throughput, and port-driven GDP through the feedback mechanism of the port–city system, realizing a virtuous cycle interaction among various subsystems. Therefore, the government and enterprises should pay attention to the introduction of advanced production technology, the promotion of the use of clean energy in port production processes, and the refinement and scale of port energy use, in order to achieve savings in energy consumption. At the same time, attention should also be paid to increasing R&D investment and technological development, optimizing and upgrading existing waste treatment and reuse technologies, improving environmental governance’s efficiency, and reducing costs, in order to reduce environmental governance losses and weaken the negative effect on the development of hinterland cities.
Author Contributions
Conceptualization, Y.L.; data curation, methodology and software, X.Z.; validation, K.L.; funding acquisition, Q.H. All authors contributed to the writing process, and read and approved the final manuscript.
Funding
This research was funded by the Fundamental Research Funds for the Central Universities (number 3132018293); the Philosophy and Social Science Program of Shenzhen, China (number SZ2019B013); and the Innovation Team Program of Liaoning Province Education Department, China (number WT2016002).
Conflicts of Interest
The authors declare no conflict of interest.
Appendix A
Table A1.
Determination of Model Parameters.
Table A1.
Determination of Model Parameters.
| Parameter | Determination | Range |
|---|---|---|
| Trade Dependence Ratio | Trade/Urban GDP, linear regression | (0, +) |
| Investment Ratio | Investment/Urban GDP, linear regression | (0,1) |
| Throughput Coefficient | Port Cargo Handling Demand/Trade (In practice, we use the value of Port Cargo Throughput instead of Port Cargo Handling Demand), value = 0.00026 | (0, +) |
| Rates | Port Revenue/Port Cargo Throughput, linear regression | (0, +) |
| Profit Margin | Changes over time, table function | (0,1) |
| Port Profit Coefficient | Varies with Port Profit, table function | (0,1) |
| Port Pressure Coefficient | Varies with Port Pressure, table function | (0,1) |
| Port Efficiency | Experience from practical investigation, value = 1.7 | (0, +) |
| Investment Contribution Rate | Experience from practical investigation, value = 0.004 | (0,1) |
| Contribution Period | Experience from practical investigation, value = 1 | (0, +) |
| Shoreline Occupation Coefficient | Shoreline Occupation Increment/Capacity Increment, value = 1-15*PULSE (2015, 1) 1 | (0,1) |
| Waste Solid Multiplier | Industrial Waste Solid Discharge/Industrial GDP, linear regression | (0, +) |
| Waste Gas Multiplier | Industrial Waste Gas Discharge/Industrial GDP, linear regression | (0, +) |
| Waste Water Multiplier | Industrial Waste Water Discharge/Industrial GDP, linear regression | (0, +) |
| Energy Multiplier | Industrial Energy Occupation/Industrial GDP, linear regression | (0, +) |
| Water Multiplier | Industrial Water Occupation/Industrial GDP, linear regression | (0, +) |
| Waste Solid Governance Price | Industrial Waste Solid Governance Investment/Industrial Waste Solid Discharge, arithmetic average | (0, +) |
| Waste Gas Governance Price | Industrial Waste Gas Governance Investment/Industrial Waste Gas Discharge, arithmetic average | (0, +) |
| Waste Water Governance Price | Industrial Waste Water Governance Investment/Industrial Waste Water Discharge, arithmetic average | (0, +) |
| Energy Price | Table function | (0, +) |
| Water Price | Value = 2 | (0, +) |
| Direct Multiplier | GDP Direct Pulled/Port Cargo Throughput, value = 75.68 | (0, +) |
| Indirect Multiplier | GDP Indirect Pulled/Port Cargo Throughput, value = 67.83 | (0, +) |
| Consumption Multiplier | GDP Induced/(GDP Direct Pulled+ GDP Indirect Pulled), value = 0.786 | (0, +) |
1 PULSE () is an impulse function, representing the starting year and duration (years), respectively.
Appendix B
Table A2.
Data Resources.
Table A2.
Data Resources.
| Index | Data Resource |
|---|---|
| Urban GDP | Shanghai Statistical Yearbook/Table 4.1 |
| Trade | Shanghai Statistical Yearbook/Table 8.5 |
| Investment | Shanghai Statistical Yearbook/Table 7.1 |
| Port Cargo Throughput | Shanghai Statistical Yearbook/Table 15.8 |
| Port Revenue | China Ports Yearbook/Provincial Ports |
| Port Profit | China Ports Yearbook/Provincial Ports |
| Port Throughput Capacity | China Ports Yearbook/Provincial Ports |
| Shoreline Occupation | Shanghai Statistical Yearbook/Table 15.7 |
| Industrial Waste Solid Discharge | Shanghai Statistical Yearbook/Table 6.13 |
| Industrial Waste Water Discharge | Shanghai Statistical Yearbook/Table 6.14 |
| Industrial Waste Gas Discharge | Shanghai Statistical Yearbook/Table 6.15 |
| Industrial Energy Occupation | Shanghai Statistical Yearbook/Table 6.1 |
| Industrial Water Occupation | China Statistical Yearbook/Table 8.9 |
| Industrial GDP | Shanghai Statistical Yearbook/Table 4.1 |
| Industrial Waste Solid Governance Investment | China Statistical Yearbook/Table 8.36 |
| Industrial Waste Water Governance Investment | China Statistical Yearbook/Table 8.36 |
| Industrial Waste Gas Governance Investment | China Statistical Yearbook/Table 8.36 |
| Energy Price | BP Statistical Review of World Energy |
Appendix C
Table A3.
Simulation Values of Major Variables.
Table A3.
Simulation Values of Major Variables.
| Year | Scheme 0 | Scheme 1 | Scheme 2 | Scheme 3 | Scheme 4 | Scheme 5 |
|---|---|---|---|---|---|---|
| Urban GDP (100 million yuan) | ||||||
| 2017 | 29,518.9 | 30,810.1 | 30,630.7 | 29,518.9 | 30,810.1 | 30,630.7 |
| 2018 | 31,403.1 | 32,943.4 | 32,728.8 | 31,420.5 | 32,963.1 | 32,748.2 |
| 2019 | 33,414.3 | 35,211.2 | 34,978.2 | 33,451.3 | 35,251.7 | 35,019.6 |
| 2020 | 35,561.4 | 37,562.7 | 37,390.1 | 35,620.5 | 37,625.1 | 37,456.5 |
| 2021 | 37,854.0 | 40,008.9 | 39,951.5 | 37,938.0 | 40,094.2 | 40,041.9 |
| 2022 | 40,302.6 | 42,560.7 | 42,616.9 | 40,410.6 | 42,670.2 | 42,732.8 |
| 2023 | 42,850.9 | 45,229.6 | 45,399.4 | 42,983.6 | 45,365.1 | 45,542.3 |
| 2024 | 45,509.8 | 48,027.9 | 48,312.1 | 45,668.8 | 48,191.1 | 48,484.0 |
| 2025 | 48,290.8 | 50,968.3 | 51,369.0 | 48,478.1 | 51,161.4 | 51,572.1 |
| Port-driven GDP (100 million yuan) | ||||||
| 2017 | 2010.6 | 2276.3 | 2238.9 | 2010.6 | 2276.3 | 2238.9 |
| 2018 | 2138.9 | 2411.8 | 2392.2 | 2140.1 | 2411.8 | 2393.6 |
| 2019 | 2275.9 | 2492.6 | 2556.6 | 2278.4 | 2492.8 | 2559.7 |
| 2020 | 2422.1 | 2584.3 | 2706.0 | 2426.2 | 2584.9 | 2706.6 |
| 2021 | 2578.3 | 2687.0 | 2806.7 | 2580.1 | 2688.1 | 2807.9 |
| 2022 | 2674.5 | 2801.1 | 2920.3 | 2676.2 | 2802.8 | 2922.2 |
| 2023 | 2781.4 | 2927.2 | 3046.9 | 2783.8 | 2929.7 | 3049.7 |
| 2024 | 2899.8 | 3065.9 | 3187.3 | 2903.0 | 3069.4 | 3191.1 |
| 2025 | 3030.1 | 3218.0 | 3342.2 | 3034.4 | 3222.6 | 3347.2 |
| GDP Obstacles related to Environment and Resources (100 million yuan) | ||||||
| 2017 | 126.4 | 143.1 | 140.7 | 109.0 | 123.4 | 121.3 |
| 2018 | 127.7 | 144.0 | 142.9 | 109.3 | 123.2 | 122.2 |
| 2019 | 128.8 | 141.0 | 144.7 | 109.2 | 119.5 | 122.7 |
| 2020 | 129.5 | 138.1 | 144.6 | 108.7 | 115.8 | 121.3 |
| 2021 | 129.7 | 135.2 | 141.2 | 107.5 | 112.0 | 117.0 |
| 2022 | 126.2 | 132.2 | 137.8 | 103.1 | 108.0 | 112.6 |
| 2023 | 122.5 | 129.0 | 134.2 | 98.6 | 103.7 | 108.0 |
| 2024 | 118.7 | 125.5 | 130.4 | 93.7 | 99.1 | 103.0 |
| 2025 | 114.5 | 121.6 | 126.3 | 88.4 | 93.9 | 97.5 |
| Port Throughput Capacity (100 million tons) | ||||||
| 2017 | 5.3 | 5.4 | 5.3 | 5.3 | 5.4 | 5.3 |
| 2018 | 5.4 | 5.5 | 5.4 | 5.4 | 5.5 | 5.4 |
| 2019 | 5.6 | 5.7 | 5.6 | 5.6 | 5.7 | 5.6 |
| 2020 | 5.7 | 5.9 | 5.8 | 5.7 | 5.9 | 5.8 |
| 2021 | 5.9 | 6.2 | 6.0 | 5.9 | 6.2 | 6.0 |
| 2022 | 6.1 | 6.4 | 6.2 | 6.1 | 6.4 | 6.2 |
| 2023 | 6.4 | 6.7 | 6.5 | 6.4 | 6.7 | 6.5 |
| 2024 | 6.7 | 7.0 | 6.8 | 6.7 | 7.0 | 6.8 |
| 2025 | 7.0 | 7.4 | 7.1 | 7.0 | 7.4 | 7.2 |
| Port Cargo Throughput (100 million tons) | ||||||
| 2017 | 7.8 | 8.9 | 8.1 | 7.8 | 8.9 | 8.1 |
| 2018 | 8.3 | 9.4 | 8.7 | 8.3 | 9.4 | 8.7 |
| 2019 | 8.9 | 9.7 | 9.3 | 8.9 | 9.7 | 9.3 |
| 2020 | 9.5 | 10.1 | 9.8 | 9.5 | 10.1 | 9.8 |
| 2021 | 10.1 | 10.5 | 10.2 | 10.1 | 10.5 | 10.2 |
| 2022 | 10.4 | 10.9 | 10.6 | 10.4 | 10.9 | 10.6 |
| 2023 | 10.9 | 11.4 | 11.1 | 10.9 | 11.4 | 11.1 |
| 2024 | 11.3 | 12.0 | 11.6 | 11.3 | 12.0 | 11.6 |
| 2025 | 11.8 | 12.6 | 12.2 | 11.8 | 12.6 | 12.2 |
| Shoreline Occupation (10 thousand meters) | ||||||
| 2017 | 10.9 | 10.7 | 10.9 | 10.9 | 10.7 | 10.9 |
| 2018 | 11.0 | 10.9 | 11.0 | 11.0 | 10.9 | 11.0 |
| 2019 | 11.2 | 11.1 | 11.1 | 11.2 | 11.1 | 11.1 |
| 2020 | 11.4 | 11.3 | 11.3 | 11.4 | 11.3 | 11.3 |
| 2021 | 11.6 | 11.5 | 11.6 | 11.6 | 11.5 | 11.6 |
| 2022 | 11.8 | 11.8 | 11.8 | 11.8 | 11.8 | 11.8 |
| 2023 | 12.0 | 12.1 | 12.1 | 12.0 | 12.1 | 12.1 |
| 2024 | 12.3 | 12.4 | 12.4 | 12.3 | 12.4 | 12.4 |
| 2025 | 12.6 | 12.7 | 12.7 | 12.6 | 12.7 | 12.7 |
References
- Yochum, G.R.; Agarwa, V.B. Static and changing port economic impacts. Marit. Policy Manag. 1988, 15, 157–171. [Google Scholar] [CrossRef]
- Tan, T.Y. Port cities and hinterlands: A comparative study of Singapore and Calcutta. Polit. Geogr. 2007, 26, 851–865. [Google Scholar] [CrossRef]
- China National Bureau of Statistics. Available online: http://data.stats.gov.cn/easyquery.htm?cn=E0105 (accessed on 4 September 2019). (In Chinese)
- Kourtit, K.; Nijkamp, P. The use of visual decision support tools in an interactive stakeholder analysis—Old ports as new magnets for creative urban development. Sustainability 2013, 5, 4379–4405. [Google Scholar] [CrossRef]
- Karimpour, R.; Ballini, F.; Ölcer, A.I. Circular economy approach to facilitate the transition of the port cities into self-sustainable energy ports—A case study in Copenhagen-Malmö Port (CMP). WMU J. Marit. Aff. 2019, 18, 225–247. [Google Scholar] [CrossRef]
- Li, J.; Liu, X.; Jiang, B. An exploratory study on low-carbon ports development strategy in China. Asian J. Shipp. Logist. 2011, 27, 91–111. [Google Scholar] [CrossRef]
- Feliciano, M.; Prosperi, D.C. Planning for low carbon cities: Reflection on the case of Broward County, Florida, USA. Cities 2011, 28, 505–516. [Google Scholar] [CrossRef]
- Hwang, S. The Development of Chinese Port Cities. Acta Geogr. Sin. 1951, Z1, 21–40. (In Chinese) [Google Scholar]
- Hoyle, B.; Charlier, J. Inter-port competition in developing countries: An East African case study. J. Transp. Geogr. 1995, 3, 87–103. [Google Scholar] [CrossRef]
- Omiunu, F.G. The port factor in the growth and decline of Warri and Sapele townships in the western Niger Delta region of Nigeria. Appl. Geogr. 1989, 9, 57–69. [Google Scholar] [CrossRef]
- Seabrooke, W.; Hui, E.C.; Lam, W.H.; Wong, G.K. Forecasting cargo growth and regional role of the port of Hong Kong. Cities 2003, 20, 51–64. [Google Scholar] [CrossRef]
- Delaware River Port Authority. The Value of a Ton of Cargo to the Area Economy; Delaware River Port Authority: Philadelphia, PA, USA, 1953. [Google Scholar]
- Port of New York Authority. Economic impact of the U.S Port Industry: Input-Output Analysis of Waterborne Transportation; Port of New York Authority: New York, NY, USA, 1978. [Google Scholar]
- Yochum, G.R.; Agarwal, V.B. Economic impact of a port on a regional economy: Note. Growth Chang. 1987, 18, 74–87. [Google Scholar] [CrossRef]
- Coto-Millán, P.; Mateo-Mantecón, I.; Castro, J.V. The economic impact of ports: Its importance for the region and also the Hinterland. In Essays on Port Economics; Physica: Heidelberg, Germany, 2010; pp. 167–200. [Google Scholar]
- Jung, B.M. Economic contribution of ports to the local economies in Korea. Asian J. Shipp. Logist. 2011, 27, 1–30. [Google Scholar] [CrossRef]
- Jun, W.K.; Lee, M.K.; Choi, J.Y. Impact of the smart port industry on the Korean national economy using input-output analysis. Transp. Res. Part A-Policy Pract. 2018, 118, 480–493. [Google Scholar] [CrossRef]
- Wang, Y.; Wang, N. The role of the port industry in China’s national economy: An input–output analysis. Transp. Policy 2019, 78, 1–7. [Google Scholar] [CrossRef]
- Wang, G. Interaction Between Port Development and Urban Development. China Water Transp. 2015, 2, 22–23. (In Chinese) [Google Scholar]
- Xiong, Y.; Xu, Z. Research of Interactive Relationship between Port Development and Urban Economic Development Based on the Key Port City of Maritime Silk Road. Theory Pract. Financ. Econ. 2017, 38, 128–133. (In Chinese) [Google Scholar]
- Wen, Y.; Pan, Y. Establishment of Shanghai Port-City Relations Coordination Evaluation Model. Ocean Dev. Manag. 2015, 32, 41–43. (In Chinese) [Google Scholar]
- Feng, L.; Wu, L. Evaluation of Indicators and Suggestions on Harmonious Development of Tianjin Port City. J. Int. Econ. Coop. 2019, 2, 134–142. (In Chinese) [Google Scholar]
- Fan, H.; Ma, M.; Wen, W.; Qu, L. Research on the Relationship between the Synergy Degree of Port-City System and Urban Economic Growth. China Soft Sci. 2015, 9, 96–105. (In Chinese) [Google Scholar]
- Guo, J.; Du, X.; Sun, C.; Wang, Z. Research on Dynamic Measurement and Driving Mode of Harbor-City Relationship in the Bohai Rim in China. Geogr. Res. 2015, 34, 740–750. (In Chinese) [Google Scholar]
- Gao, T.; Gao, J.M.; Qu, L. Relevant Effects of Port-City Development Based on DEA and Partial Correlation Analysis. Navig. China 2017, 40, 129–134. (In Chinese) [Google Scholar]
- Coto-Millán, P.; Pino, J.B.; Mateo-Mantecón, I. The effect of port infrastructures on regional production. In Essays on Port Economics; Physica: Heidelberg, Germany, 2010; pp. 201–234. [Google Scholar]
- Akhavan, M. Development dynamics of port-cities interface in the Arab Middle Eastern world-The case of Dubai global hub port-city. Cities 2017, 60, 343–352. [Google Scholar] [CrossRef]
- Schipper, C.A.; Vreugdenhil, H.; De Jong, M.P.C. A sustainability assessment of ports and port-city plans: Comparing ambitions with achievements. Transp. Res. Part D-Transp. Environ. 2017, 57, 84–111. [Google Scholar] [CrossRef]
- Lam, J.S.L.; Yap, W.Y. A stakeholder perspective of port city sustainable development. Sustainability 2019, 11, 447. [Google Scholar] [CrossRef]
- Zuo, T.; Cha, Y.; Nie, X.; Li, R.; Qi, Y.; Dong, M. Research on Planning Concept of Ecological Port. Port Waterw. Eng. 2017, 5, 56–61. (In Chinese) [Google Scholar]
- Brooke, J. Environmental appraisal for ports and harbors. Dock Harb. Auth. 1990, 71, 820. [Google Scholar]
- Leonardi, J.; Browne, M. A method for assessing the carbon footprint of maritime freight transport: European case study and results. Int. J. Logist. Res. Appl. 2010, 13, 349–358. [Google Scholar] [CrossRef]
- Grifoll, M.; Jordà, G.; Espino, M.; Romo, J.; García-Sotillo, M. A management system for accidental water pollution risk in a harbor: The Barcelona case study. J. Mar. Syst. 2011, 88, 60–73. [Google Scholar] [CrossRef]
- Shiau, T.A.; Chuang, C.C. Social construction of port sustainability indicators: A case study of Keelung Port. Marit. Policy Manag. 2015, 42, 26–42. [Google Scholar] [CrossRef]
- Asgari, N.; Hassani, A.; Jones, D.; Nguye, H.H. Sustainability ranking of the UK major ports: Methodology and case study. Transp. Res. Part E-Logist. Transp. Rev. 2015, 78, 19–39. [Google Scholar] [CrossRef]
- Mamatok, Y.; Huang, Y.; Jin, C.; Cheng, X. A System Dynamics Model for CO2 Mitigation Strategies at a Container Seaport. Sustainability 2019, 11, 2806. [Google Scholar] [CrossRef]
- Geng, X.; Wen, Y.; Zhou, C.; Xiao, C. Establishment of the sustainable ecosystem for the regional shipping industry based on system dynamics. Sustainability 2017, 9, 742. [Google Scholar] [CrossRef]
- Liu, X.; Zhao, B.; Li, B.; Wang, N. A system dynamics model of the interaction between port and city based on the green concept. In ICLEM 2010: Logistics for Sustained Economic Development: Infrastructure, Information, Integration; American Society of Civil Engineers: New York, NY, USA, 2010; pp. 681–688. [Google Scholar]
- Zhao, L.; Xiao, L. Port Impact Studies on Regional Economic Development Based on System Dynamics. J. Chongqing Univ. Technol. 2014, 7, 25. (In Chinese) [Google Scholar]
- Hou, L.; Geerlings, H. Dynamics in sustainable port and hinterland operations: A conceptual framework and simulation of sustainability measures and their effectiveness, based on an application to the Port of Shanghai. J. Clean Prod. 2016, 135, 449–456. [Google Scholar] [CrossRef]
- Shi, J.; Guo, X.; Hu, X. Engaging Stakeholders in Urban Traffic Restriction Policy Assessment Using System Dynamics: The Case Study of Xi’an City, China. Sustainability 2019, 11, 3930. [Google Scholar] [CrossRef]
- Fan, H.; Li, Y.; Wen, W.; Ma, M. System Simulation Research on Interaction Development of Port and Urban Economy with Occupation of Land Resources in Shenzhen. Resour. Sci. 2015, 37, 398–407. (In Chinese) [Google Scholar]
- Guo, Z.; Fan, H.; Cui, W.; Li, Y. Dynamic Simulation of Green and Low-Carbon Port City System Co-Built by Port and City. Ecol. Econ. 2016, 32, 98–102. (In Chinese) [Google Scholar]
- Qiao, W.; Guan, W.; Wang, X.; Wang, X. Study on the Dynamics of Port-City Coupling System Based on Green Concept-A Case Study of Lianyungang City. J. Nanjing Normal Univ. 2018, 41, 140–148. (In Chinese) [Google Scholar]
- Shanghai Municipal Bureau of Statistics. Available online: http://www.stats-sh.gov.cn/ (accessed on 9 October 2019). (In Chinese)
- China Ports Yearbook. Available online: http://navi.cnki.net/KNavi/YearbookDetail?pcode=CYFD&pykm=YZGAW&bh (accessed on 9 October 2019). (In Chinese).
- Shanghai Statistical Yearbook. Available online: http://navi.cnki.net/knavi/YearbookDetail?pcode=CYFD&pykm=YSHTJ (accessed on 9 October 2019). (In Chinese).
- Jiang, C.; Zhen, H. The Multiplier Model for Port Economic Contribution Analysis. Navig. China 2012, 4, 100–103+118. (In Chinese) [Google Scholar]


© 2019 by the authors. Licensee MDPI, Basel, Switzerland. This article is an open access article distributed under the terms and conditions of the Creative Commons Attribution (CC BY) license (http://creativecommons.org/licenses/by/4.0/).