Abstract
Understanding the primary mechanisms for plant promotion under salt stress with plant growth promoting rhizobacteria (PGPR) inoculation of different salt-tolerant plant groups would be conducive to using PGPR efficiently. We conducted a meta-analysis to evaluate plant growth promotion and uncover its underlying mechanisms in salt-sensitive plants (SSP) and salt-tolerant plants (STP) with PGPR inoculation under salt stress. PGPR inoculation decreased proline, sodium ion (Na+) and malondialdehyde but increased plant biomass, nutrient acquisition (nitrogen, phosphorus, potassium ion (K+), calcium ion (Ca2+), and magnesium ion (Mg2+)), ion homeostasis (K+/Na+ ratio, Ca2+/Na+ ratio, and Mg2+/Na+ ratio), osmolytes accumulation (soluble sugar and soluble protein), antioxidants (superoxide dismutase), and photosynthesis (chlorophyll, carotenoid, and photosynthetic rate) in both SSP and STP. The effect size of total biomass positively correlated with the effect sizes of nutrient acquisition and the homeostasis of K+/Na+, and negatively correlated with the effect size of malondialdehyde in both SSP and STP. The effect size of total biomass also positively correlated with the effect sizes of carotenoid and the homeostasis in Ca2+/Na+ and Mg2+/Na+ and negatively correlated with the effect size of Na+ in SSP, but it only negatively correlated with the effect size of Ca2+ in STP. Our results suggest that the plant growth improvement depends on the nutrient acquisition enhancement in both SSP and STP, while ion homeostasis plays an important role and carotenoid may promote plant growth through protecting photosynthesis, reducing oxidative damage and promoting nutrient acquisition only in SSP after PGPR inoculation under salt stress.
1. Introduction
Soil salinity severely challenges plant growth on more than 6% of land globally [1]. Salinization marginalizes arable land and could lead to the abandonment of one-third of irrigated land worldwide [2,3,4]. By 2050, soil salinization will threaten more than 50% of arable land owing to climate change, irrational irrigation practices, wrong fertilizer application, and poor drainage systems [5,6,7,8]. Soil salinity inhibits plant productivity via direct or indirect adverse effects. For instance, the salt-induced osmotic stress on the root surface can result in physiological drought via regulating the production of plant hormones and hindering water acquisition [4,9]; and toxic ionic stress, such as the accumulation of sodium and chloride ions in cells, can lead to nutrient deficiency and the growth retardance [1,10]. These two direct stresses destroy the dynamic equilibrium of reactive oxygen species (ROS) in cell and indirectly result in plant oxidative stress [11,12,13]. In addition, soil salinity could limit plant growth indirectly by hampering activities of beneficial microbes residing in the rhizosphere and by decreasing organic matter accumulation [14].
Soil remediations, such as bioremediation, phytoremediation, physical remediation, and chemical remediation, are practiced to address the salinity-induced plant growth retardation [15]. Bioremediation, with plant growth promoting rhizobacteria (PGPR) [16], could provide a sustainable and cost-effective solution [17,18]. PGPR can help plants tolerate salinity by several synergistic mechanisms [19]. The first one is to overcome osmotic stress by inducing osmolyte accumulation and phytohormone signaling [3]. The second one is to alleviate ion stress and nutrient deficiency by achieving ion homeostasis and enhancing nutrient uptake [2]. The third one is to dampen the oxidative stress by increasing the antioxidant capacity and photosynthesis [2,20].
Plant growth response to PGPR inoculation may vary with the experimental conditions and settings [21], PGPR identity and diversity [22,23], plant functional groups [6], etc. Within cultivars, when barley [24,25] and maize [17,26] were inoculated with PGPR, the growth of salt-sensitive cultivars increased more than the salt-tolerant cultivars under saline conditions, while, when rice was inoculated with PGPR, different cultivars exhibited a similar response under salt stress [22]. The inconsistent results of the PGPR inoculation within cultivars suggest an uncertain response of different plant groups to PGPR inoculation.
Halophytes have advantages over glycophytes in salt exclusion and salt compartmentalization [27,28]. PGPR play a crucial role in promoting plant growth in halophytes and glycophytes under salt stress [29,30,31,32]. A clear understanding of responses of two salt-tolerant plant groups and the underlying mechanisms would expand the use of PGPR as bioremediation. Thus, our objective was to determine whether salt-sensitive plants (similar to glycophytes) and salt-tolerant plants (similar to halophytes) respond similarly to PGPR inoculation and the mechanisms that regulate their responses.
2. Materials and Methods
2.1. Literature Search and Selection Criteria
We used two approaches to select articles and build a database for this meta-analysis. The first one was to search for relevant articles by keywords in the Web of Science. The keywords used were “PGPR and salt stress/or under salinity stress”, “rhizosphere bacteri* and salinity stress/or under salt stress”, and “rhizobacteri* and salinity stress/or under salt stress”. The Boolean truncation (*) character was used to ensure that word variations (such as bacteria, bacterium, rhizobacteria, and rhizobacterium) were also included in the search. The second one was to search articles in a “retrospective” way from references in review articles. English articles spanning 15 years (from 2003 to 2017) were retrieved subject to the following criteria:
- (1)
- Plants had to be exposed to saline conditions or imposed to salt treatments through irrigation.
- (2)
- A pair-wise experimental design with a control and a PGPR treatment was used.
- (3)
- Only extracellular PGPR taxa were included in this meta-analysis. If articles reported any PGPR interaction with other microbes, such as mycorrhizal fungi or intracellular PGPR, data were exclusively collected for extracellular PGPR to avoid any interactions.
- (4)
- Plants had to be grown in pots, and the growth substrate had to be soil or a mixture of soil and another substrate.
Results from different experiments in one article were considered independent studies and were not a violation of independence in this meta-analysis. For example, responses of the same host plant using different PGPRs under either different or identical salt stress conditions was compared in a single article, or responses of different host plants using the same PGPR under either different or identical salt stresses were considered as independent results. In total, 561 experimental results were extracted from 102 articles (Files S1 and S2).
2.2. Data Category and Collection
The definition of halophytes is still somewhat blurred [33], and there also exists significant variation in salt tolerance among glycophytes [1,34]. Thus, to better define salt tolerance, the plants included in this meta-analysis were classified into salt-sensitive plants (SSP) and salt-tolerant plants (STP) according to the salt tolerance information in the original publications (File S2). We recorded 21 physiological indicators in this meta-analysis (Table 1). Plant fresh weight or dry weight was the most reported measures of plant biomass. We used dry weight as biomass when it was available and otherwise used fresh weight. When indicators were reported in root and shoot biomass, total biomass was calculated as the sum of them. Chl contents were calculated as the sum of Chl a and Chl b when total Chl was not reported. When data were only provided for leaves and not provided for shoots, leaf data were used as a proxy of the shoot.

Table 1.
Rank correlation tests for publication bias and fail-safe numbers.
Indicators were often reported in different units. However, we did not consider such unit difference given that response ratios are dimensionless. We had no prior expectation that certain PGPRs would differ from other species. Thus, PGPR species were not grouped into different classes for analysis. In addition, we assumed that authors made appropriate choices of PGPR strains that were likely naturally associated with host plants.
For each study, the meta-analysis database required the mean, standard deviation (SD), and replicate number/sample size (n) for the control as well as the PGPR inoculation treatment under salt stress condition. Only n ≥ 3 were included in this meta-analysis. In articles where means and errors are presented graphically, the data were extracted from graphs or figures using the WebPlotDigitizer software. If standard errors (SE) were reported, all were transformed to SD according to the equation: SE =SD (n−1/2). If SD was not provided, it was estimated as the mean divided by the square root of the sample size [35].
2.3. Meta-Analysis
Our meta-analysis was conducted in MetaWin software version 2.1 [36], based on a random effects model, and we assumed that there were random variations in PGPR effects on plant growth among the studies [5,37]. The confidence intervals (CIs) were estimated through a bootstrap procedure that performed bias-correction using 4999 iterations (designated as 95% CI) [38]. We used effect size as a metric for the response of PGPR inoculation in plants under salt stress conditions. Effect size was calculated as the natural log of the response ratio (lnR) using Formula (1) [5,37]:
where R is the response ratio, and XT and XC are the means of indicators in PGPR inoculation treatments and the control, respectively. Variance estimations for each study are represented as V, using the following formula in their calculation [37]:
where ST and SC are the standard deviations of indicators in the PGPR treatment and the control, respectively. NT and NC are the replication numbers. If 95% CIs did not overlap the zero-line, inoculation effects were considered significant. Zero effect size means there is no difference between the experimental and control groups [39]. Positive value indicates an increase in indicators inoculated with PGPR and negative value indicates a decrease in indicators inoculated with PGPR. Significant differences between SSP and STP were tested by examining the Pbetween and Qbetween statistics [40].
Generally, journals tend to publish studies with statistically significant information, which will lead to an overestimation of results and cause publication bias [36]. There is also a potential bias in our study because we used the n to estimate variance in comparisons, which can cause an overestimation of within-study variance [35]. For the reasons mentioned above, we tested for potential publication bias by conducting Spearman’s rank correlation analysis and calculating Rosenthal’s fail-safe number. The Spearman’s rank correlation test was used to search for the relationships between the standardized effect size and sample size [36]. If they did not show correlation, metadata have no publication bias [40]. Otherwise, we needed to calculate Rosenthal’s fail-safe number further to quantify the potential bias. If Rosenthal’s fail-safe number was considerably greater than 5S + 10 (where S is the study numbers of indicators), it meant that the existing publication bias would not negate the reported effect size [35,40].
2.4. Linear Regression Analyses
PGPR can facilitate the growth of many plants, but there are many indicators that directly or indirectly modify the growth response to PGPR inoculation. Linear regression models were used to test relationships between the effect size of total biomass and the effect sizes of osmotic balance indicators (Pro, SS, and SP), nutrient uptake and ion homeostasis indicators (N, P, K+, Ca2+, Mg2+, Na+, K+/Na+ ratio, Ca2+/Na+ ratio, and Mg2+/Na+ ratio), antioxidant indicators (SOD, CAT, and MDA), and photosynthetic indicators (Chl, Car, and Pn) in both SSP and STP, respectively. All linear regression analyses were conducted using SPSS software 17.0.
3. Results
3.1. PGPR Inoculation Effects on Plant Biomass
PGPR inoculation significantly increased total, shoot and root biomass across studies (Figure 1). Although the trends of inoculation about the biomass were consistent in both SSP and STP, the effect sizes of total biomass and shoot biomass were significantly higher in SSP than that in STP (Figure 2a,b).
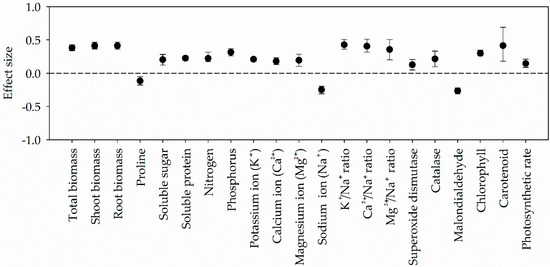
Figure 1.
Responses of PGPR-inoculated plants to salt stress. Error bars represent 95% confidence intervals (CIs). The inoculation effects were considered significant if the 95% CIs did not overlap the zero line.
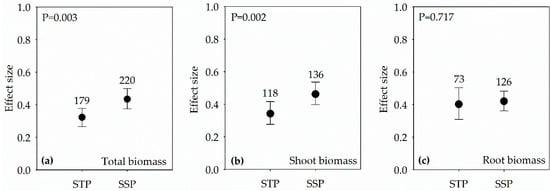
Figure 2.
Effect sizes of PGPR in both salt-sensitive plants (SSP) and salt-tolerant plants (STP) under salt stress condition on: total biomass (a); shoot biomass (b); and root biomass (c). Error bars represent 95% confidence intervals (CIs). The inoculation effects were considered significant if the 95% CIs did not overlap the zero line. The numbers of studies are shown above the error bars. p values show the significant differences between SSP and STP.
3.2. PGPR Inoculation Effects on Osmolytes
Effect sizes of Pro accumulation were significantly negative for SSP and STP, and it had no difference between the two groups (Figure 3a). SS and SP accumulation were positively stimulated after PGPR inoculation in the STP, while they had no change in the SSP as the 95% CI overlapped zero (Figure 3b,c).
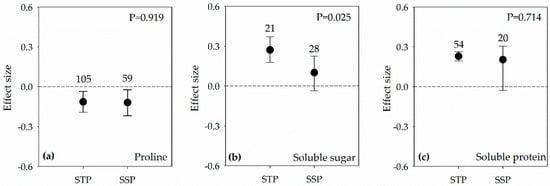
Figure 3.
Effect sizes in both salt-sensitive plants (SSP) and salt-tolerant plants (STP) under salt stress condition of PGPR on: proline (a); soluble sugar (b); and soluble protein (c). Error bars represent 95% confidence intervals (CIs). The inoculation effects were considered significant if the 95% CIs did not overlap the zero line. The numbers of studies are shown above the error bars. p values show the significant differences between SSP and STP.
3.3. PGPR Inoculation Effects on Plant Nutrient Uptake and Ion Homeostasis
PGPR inoculation significantly increased N uptake, P uptake, K+ uptake, Ca2+ uptake, Mg2+ uptake, K+/Na+ ratio, Ca2+/Na+ ratio, and Mg2+/Na+ ratio, while decreased Na+ uptake across all studies (Figure 1). The effect sizes of these indicators had no difference between SSP and STP (Figure 4).
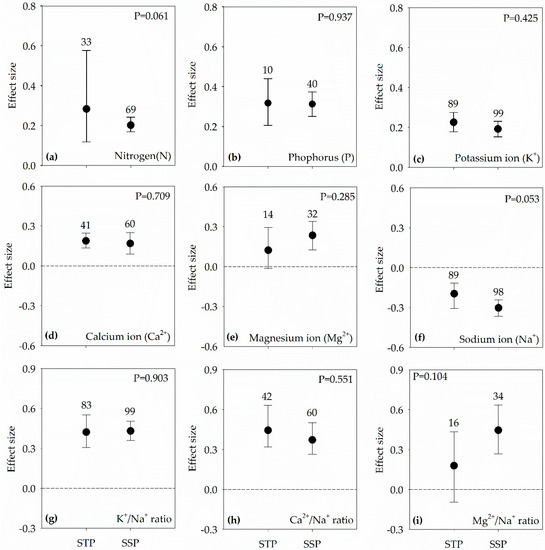
Figure 4.
Effect sizes in both salt-sensitive plants (SSP) and salt-tolerant plants (STP) under salt stress condition of PGPR on: nitrogen (a); phosphorus (b); potassium ion (c); calcium ion (d); magnesium (e); sodium ion (f); K+/Na+ ratio (g); Ca2+/Na+ ratio (h); and Mg2+/Na+ ratio (i). Error bars represent 95% confidence intervals (CIs). The inoculation effects were considered significant if the 95% CIs did not overlap the zero line. The numbers of studies are shown above the error bars. p values show the significant differences between SSP and STP.
3.4. PGPR Inoculation Effects on Antioxidants, MDA and Photosynthesis
Although 95% CI overlapped zero in SSP, effect sizes of SOD activities increased in both SSP and STP, respectively (Figure 5a). The effect sizes of CAT activities were significantly different between the two groups, which decreased in STP but markedly increased in SSP (Figure 5b). Contrary to SOD and CAT, the effect sizes of MDA contents markedly decreased in both SSP and STP (Figure 5c). The effect sizes of Chl, Car and Pn were all positive, and they had no difference in the two groups (Figure 5d–f).
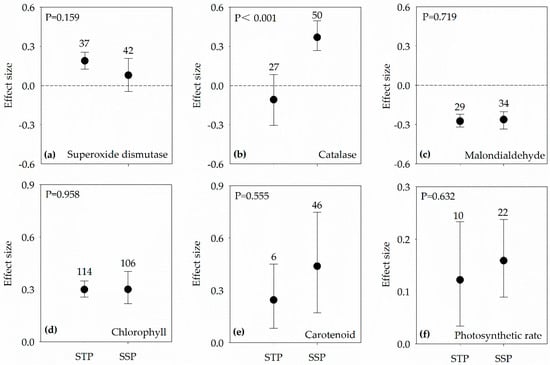
Figure 5.
Effect sizes in both salt-sensitive plants (SSP) and salt-tolerant plants (STP) under salt stress condition of PGPR on: superoxide dismutase (a); catalase (b); malondialdehyde (c); chlorophyll (d); carotenoid (e); and photosynthetic rate (f). Error bars represent 95% confidence intervals (CIs). The inoculation effects were considered significant if the 95% CIs did not overlap the zero line. The numbers of studies are shown above the error bars. p values show the significant differences between SSP and STP.
3.5. Contributions of the Physiological Indicators to Biomass Promotion between SSP and STP
The effect size of total biomass correlated positively with that of Pro, N, P, K+, and K+/Na+ ratio, while it had a significant negative correlation with that of MDA in both SSP and STP (Figure 6). The effect size of total biomass in SSP also positively correlated with that of Ca2+, Ca2+/Na+ ratio, Mg2+/Na+ ratio, and Car and negatively correlated with that of Na+. However, the effect size of total biomass in STP only negatively correlated with the effect size of Ca2+ (Figure 6).
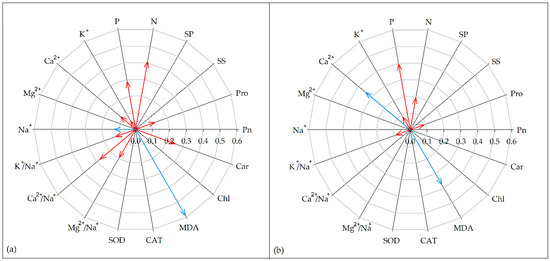
Figure 6.
Relationships between the effect sizes of total biomass and the effect sizes of proline (Pro), soluble sugar (SS), soluble protein (SP), nitrogen (N), phosphorus (P), potassium ion (K+), calcium ion (Ca2+), magnesium ion (Mg2+), sodium ion (Na+), K+/Na+ ratio (K+/Na+), Ca2+/Na+ ratio (Ca2+/Na+), Mg2+/Na+ ratio (Mg2+/Na+), superoxide dismutase (SOD), catalase (CAT), malondialdehyde (MDA), chlorophyll (Chl), carotenoid (Car), and photosynthetic rate (Pn) under salt stress conditions for: salt-sensitive plants (a); and salt-tolerant plants (b). The significance of the relationships between the effect size of total biomass and other indicators is presented with an arrow. The length of the arrow indicates the size of R2. Red arrows indicate positive relationships and blue arrows indicate negative relationships.
4. Discussion
4.1. Publication Bias Test
We examined the publication bias for the dataset of 21 indicators. The results of Spearman’s rank correlation analysis showed that no significant correlation between effect size and sample size for most indicators except the total biomass (Spearman’s r = 0.131, p = 0.008), Ca2+ (Spearman’s r = −0.282, p = 0.004), Mg2+ (Spearman’s r = −0.542, p < 0.001), Na+ (Spearman’s r = 0.203, p = 0.005), Ca2+/Na+ ratio (Spearman’s r = −0.373, p < 0.001), CAT (Spearman’s r = −0.323, p = 0.004), and MDA (Spearman’s r = −0.266, p = 0.035). Statistics suggested that large effect size were more likely to be published than small effects and that publication bias existed for these indicators [36]. However, fail-safe numbers of the above indicators were much larger than 5S + 10 (Table 1). These results indicate that slight publication bias exists for these indicators, but such existing publication bias would not change the overall results [40].
4.2. PGPR Responsiveness on Biomass between SSP and STP
Salt tolerance is generally quantified as the plant biomass production [9]. The significant increases in the total, shoot and root biomass with the PGPR inoculation (Figure 1) align with previous findings [18,41,42]. The higher effect size of total biomass in SSP than that in STP (Figure 2a) is consistent with results of crop cultivars with contrasting salt tolerance [17,24,26]. The difference in total biomass accumulation between SSP and STP after PGPR inoculation can be ascribed to the changes of the physiological process such as osmoregulation, nutrient acquisition, ion homeostasis, antioxidant capacity, and photosynthesis, which would alleviate the salt stress [43,44]. Hence, the different responses of plant promotion in SSP and STP are discussed in terms of the physiological processes and indicators as follows.
4.3. Osmotic Adjustment Responding to PGPR Inoculation between SSP and STP
High salinity lowers soil osmotic potentials, which inhibits absorption of water by root [4,45]. Osmoregulation is an essential mechanism for a plant to tolerate the osmotic stress induced by soil salinity [46]. Plants often consume a substantial amount of energy to accumulate organic osmolytes (such as Pro, SS, and SP) for osmoregulation at the cost of biomass penalty [27,43,47,48].
Both SS and SP are typically non-injurious at a high cellular concentration and play a fundamental role in osmotic adjustment [39,44,47,49]. The positive changes of SS and SP in both SSP and STP indicate PGPR could biosynthesize osmolytes thus facilitate host plants to absorb more compatible solutes to maintain osmotic balance [3]. However, the 95% CIs of SS and SP overlapped zero in the SSP, but the effect sizes of them significantly increased in the STP (Figure 3b,c), which imply a relative weak improvement of the biosynthesis of SS and SP in SSP than in STP. However, no correlation between the effect size of total biomass with the effect sizes of SS and SP (Figure 6) suggest the indirect effect of SS and SP in biomass accumulation.
Pro is the most frequently examined organic osmolyte for plants under abiotic stress [39,44]. Some studies demonstrate that Pro accumulation signals injury caused by water deficiency under salt stress [50,51], while others report that Pro acts as a compatible solute for osmoregulation and an indicator of salt stress [12]. Both elevations and reductions in Pro have been ascribed to PGPR inoculation under salt stress [26,52,53]. Although the Pro decreased markedly in both SSP and STP after PGPR inoculation (Figure 3a), it is risky to conclude that the decrease in Pro indicates the remediation of osmotic stress because of the weak positive correlations between the effect sizes of Pro and total biomass in both SSP and STP (Figure 6).
4.4. Nutrient Acquisition and Ion Homeostasis Responding to PGPR Inoculation between SSP and STP
Soil salinity imposes ionic stress on plants, which leads to ion imbalance and nutrient deficiency [48]. Na+ is the primary cause of ion stress for many plants, which not only competitively inhibits K+, Ca2+, and Mg2+ uptake thus disturbs the intracellular ion balance but also interferes with N and P acquisition and utilization [43,54,55]. The lower Na+ uptake and higher N, P, K+, Ca2+, and Mg2+ uptake and consequently the higher K+/Na+ ratio, Ca2+/Na+ ratio, and Mg2+/Na+ ratio in the PGPR-inoculated plants than the control under salt stress in both SSP and STP (Figure 4) support the mechanism that PGPR could decrease toxic ions acquisition and maintain the intracellular ionic equilibrium and increase nutrients availability in plants [2,3].
The positive relationships between the effect size of total biomass and the effect sizes of N, P, and K+ uptake in both SSP and STP support findings that PGPR can aid in the resumption of plant growth by retaining the nutrient acquisition of plants [3] (Figure 6) as PGPR could: (1) increase the nutrient availability by altering the root structure and root exudates and accelerating the nutrient cycling [56]; (2) promote the root nutrient absorption capacity by changing the root physiology; and (3) strengthen the capability of Na+ detoxification [3], hence leading to the increase in the biomass.
The opposite changes in Na+ uptake and other ions (Figure 4 and Figure S1) prove that PGPR could protect plants from the salt toxicity by maintaining ion homeostasis [3]. However, the specific ions that regulate the salt toxicity are different in SSP and STP. In the SSP, the effect size of total biomass correlated with that of Na+ uptake, K+/Na+ ratio, Ca2+/Na+ ratio, and Mg2+/Na+ ratio, while in the STP, the effect size of total biomass only correlated with that of K+/Na+ ratio (Figure 6). The intrinsic salt tolerant mechanisms of different plant species might explain the difference. SSP cannot control or regulate Na+ uptake and transportation and is thus “panic” into ionic damage in salinity condition [13,48]. Thus, the suppression of Na+ uptake with PGPR inoculation can resume plant growth by protecting plants from toxic effects of salt ions and keeping the homeostasis of ions in the SSP [3]. However, STP can remain relatively “calm” when compared to SSP because the ionic damage is no longer a major cause of biomass penalty [13], thereby the increase in plant biomass has no direct correlation with the decrease in Na+ (Figure 6). It is noteworthy that the correlation between the effect size of total biomass and that of Ca+ uptake was positive in SSP but negative in STP (albeit effect size of Ca+ is positive). This suggests that, although the Ca+ uptake can promote biomass accumulation, its promoting effect will be weakened and even inhibited when the Ca2+ concentration is too high.
4.5. Antioxidant System Responding to PGPR Inoculation between SSP and STP
Salt stress can destroy the dynamic equilibrium of ROS and cause oxidative damage in plants [11]. Oxidative stress can destabilize membranes, increase MDA content and inhibit photosynthesis [17,57,58]. Synthesizing and balancing the ROS scavenging enzymes, by increasing SOD and CAT, can protect cells from oxidative damage induced by ROS [59]. The higher SOD and CAT activities in PGPR-inoculated plants under salt stress across all studies (Figure 1) could reflect expression of genes that encode for ROS scavenging enzymes [60]. The different responses of SOD and CAT to the PGPR inoculation between the SSP and STP and no correlation between the effect sizes of antioxidant enzymes and total biomass in both SSP and STP let us speculate that changes in activation of antioxidant enzymes may not be the mechanism to regulate the biomass increase under PGPR inoculation.
Higher salt tolerance leads to lower MDA content in plants [61]. The non-significant difference in the reduction of MDA content and the negative relationships between the effect sizes of MDA and that of total biomass in both SSP and STP (Figure 5c and Figure 6) suggest that PGPR inoculation can promote biomass accumulation by alleviating or eliminating salt-induced oxidative damage (measured by MDA). Higher antioxidant activities lower MDA content, which in turn inhibits membrane damage of ROS, thus enhancing plant salt tolerance [61]. However, the decrease in MDA had no correlation with the increase of antioxidant enzymes but had a positive correlation with the decrease in Na+ uptake in our study (Figure S2 and Figure S3). It suggests that PGPR helps host plants to alleviate oxidative stress mainly through reducing the generation of ROS formed on the onset of ionic stress not via scavenging ROS by accumulating antioxidant enzymes in host plants [27].
Generally, the oxidative stress induced by salinity reduces the photosynthetic capacity via changing photosynthetic pigments and reducing the photosynthetic rate [62,63,64]. An improvement in the antioxidative capacity, in turn, will contribute to the promotion of Chl and Car content, and Pn [3,59]. The significant increase in Chl and Car contents, and Pn in both SSP and STP under salt stress indicate that plants inoculated with PGPR can increase photosynthetic pigments, elevate photosynthetic capacity and prevent oxidative damage to photosystem [12,65] (Figure 5d–f).
The positive relationship between the effect size of N uptake and that of Chl content and the negative relationship between the effect size of Na+ uptake and that of Chl content (Figure S4) suggest the N uptake and Na+ exclusion might elevate Chl concentration in PGPR-inoculated plants. However, there is no correlation between the effect size of total biomass and that of Pn and Chl content in both SSP and STP (Figure 6). However, cause–effect relationship between photosynthesis and growth is difficult to disentangle [1]. Thus, it is risky to deny the contribution of Chl and Pn in salt tolerance of plants after PGPR inoculation. Car has multiple roles in the protection of photosynthesis, reduction of oxidative damage and reinforcement of plant nutritional quality [59,64]. The increase in Car content had a positive effect on the promotion of total biomass in SSP but not in STP. This difference may depend on the antioxidant capacity associated with salt tolerance in different plant species [59]. Future research is required to identify the underlying mechanisms of photosynthesis with PGPR inoculation.
5. Conclusions
Meta-analysis of 561 studies suggests that PGPR inoculation generally induces plant growth and changes plant metabolism, such as increasing partial osmolytes accumulation (SS and SP), nutrient acquisition (N, P, K+, Ca2+, and Mg2+), Na+ exclusion, ion homeostasis (K+/Na+ ratio, Ca2+/Na+ ratio, and Mg2+/Na+ ratio), SOD activity, and photosynthetic capacity (Chl, Car, and Pn) but decreasing Pro accumulation and MDA content in SSP and STP. However, the biomass improvement in SSP was higher than that in STP after PGPR inoculation under salt stress, and mechanisms regulating the growth promotion share some consistency but SSP and STP have their unique mechanisms. The nutrient acquisition enhancement is the common mechanism to improve the plant growth in both SSP and STP, while ion homeostasis plays an important role and carotenoid may promote plant growth through protecting the photosynthesis, reducing the oxidative damage and promoting the nutrient acquisition only in SSP after PGPR inoculation under salt stress.
Supplementary Materials
The following are available online at http://www.mdpi.com/2071-1050/11/2/378/s1, File S1: References included in the meta-analysis, File S2: the salt tolerance information in the original publications, Figure S1: Relationships between effect size of Na+ content in plants after PGPR inoculation under salt stress conditions and effect sizes of: K+ content (a); Ca2+ content (b); and Mg2+ content(c)., Figure S2: Relationships between effect size of MDA content and effect size of Na+ content in plants after PGPR inoculation under salt stress conditions., Figure S3: Relationships between effect size of MDA content in plants after PGPR inoculation under salt stress conditions and effect sizes of: SOD (a); and CAT content (b)., Figure S4 Relationships between effect size of chlorophyll content in plants after PGPR inoculation under salt stress conditions and effect sizes of: N content (a); and Na+ content (b).
Author Contributions
All authors contributed to the experiment design. J.P., F.P., X.X., and C.H. together designed the research and wrote the paper, W.Z. collected part of the data used in this research, Q.Y. and T.W. advised in the process of paper writing. All authors have read and approved the final manuscript.
Funding
This research was funded by the National Key Research and Development Program of China (No. 2016YFC0500909), the National Key Research and Development Program of China (No. 2017YFE0119100), and the International Partnership Program of Chinese Academy of Sciences (No. 131B62KYSB20170031).
Acknowledgments
We would like to thank Shaoxiu Ma for his valuable suggestions and for helping us to polish the English.
Conflicts of Interest
The authors declare no conflict of interest.
References
- Munns, R.; Tester, M. Mechanisms of salinity tolerance. Annu. Rev. Plant Biol. 2008, 59, 651–681. [Google Scholar] [CrossRef] [PubMed]
- Dodd, I.C.; Perez-Alfocea, F. Microbial amelioration of crop salinity stress. J. Exp. Bot. 2012, 63, 3415–3428. [Google Scholar] [CrossRef] [PubMed]
- Ilangumaran, G.; Smith, D.L. Plant growth promoting rhizobacteria in amelioration of salinity stress: A systems biology perspective. Front. Plant Sci. 2017, 8, 1768. [Google Scholar] [CrossRef] [PubMed]
- Ruiz-Lozano, J.M.; Porcel, R.; Azcon, C.; Aroca, R. Regulation by arbuscular mycorrhizae of the integrated physiological response to salinity in plants: New challenges in physiological and molecular studies. J. Exp. Bot. 2012, 63, 4033–4044. [Google Scholar] [CrossRef] [PubMed]
- Chandrasekaran, M.; Boughattas, S.; Hu, S.; Oh, S.-H.; Sa, T. A meta-analysis of arbuscular mycorrhizal effects on plants grown under salt stress. Mycorrhiza 2014, 24, 611–625. [Google Scholar] [CrossRef]
- Rubin, R.L.; van Groenigen, K.J.; Hungate, B.A. Plant growth promoting rhizobacteria are more effective under drought: A meta-analysis. Plant Soil 2017, 416, 309–323. [Google Scholar] [CrossRef]
- Maduraimuthu, D.; Vara, P.P.V. Effects of salinity on ion transport, water relations and oxidative damage. In Ecophysiology and Responses of Plant Under Salt Stress; Ahmad, P., Prasad, M.N.V., Eds.; Springer: New York, NY, USA, 2013; pp. 89–114. [Google Scholar]
- Ciftci, V.; Turkmen, O.; Erdinc, C.; Sensoy, S. Effects of different arbuscular mycorrhizal fungi (AMF) species on some bean (Phaseolus vulgaris L.) cultivars grown in salty conditions. Afr. J. Agric. Res. 2010, 5, 3408–3416. [Google Scholar]
- Munns, R. Comparative physiology of salt and water stress. Plant Cell Environ. 2002, 25, 239–250. [Google Scholar] [CrossRef]
- Assaha, D.V.M.; Ueda, A.; Saneoka, H.; Al-Yahyai, R.; Yaish, M.W. The role of Na+ and K+ transporters in salt stress adaptation in glycophytes. Front. Physiol. 2017, 8, 509. [Google Scholar] [CrossRef]
- Egamberdieva, D.; Wirth, S.; Jabborova, D.; Räsänen, L.A.; Liao, H. Coordination between Bradyrhizobium and Pseudomonas alleviates salt stress in soybean through altering root system architecture. J. Plant Interact. 2017, 12, 100–107. [Google Scholar] [CrossRef]
- Islam, F.; Yasmeen, T.; Arif, M.S.; Ali, S.; Ali, B.; Hameed, S.; Zhou, W. Plant growth promoting bacteria confer salt tolerance in Vigna radiata by up-regulating antioxidant defense and biological soil fertility. Plant Growth Regul. 2016, 80, 23–36. [Google Scholar] [CrossRef]
- Zhu, J.-K. Plant salt tolerance. Trends Plant Sci. 2001, 6, 66–71. [Google Scholar] [CrossRef]
- Waśkiewicz, A.; Beszterda, M.; Goliński, P. ABA: Role in plant signaling under salt stress. In Salt Stress in Plants; Ahmad, P., Azooz, M.M., Prasad, M.N.V., Eds.; Springer: New York, NY, USA, 2013; pp. 175–196. [Google Scholar]
- Nouri, H.; Chavoshi Borujeni, S.; Nirola, R.; Hassanli, A.; Beecham, S.; Alaghmand, S.; Saint, C.; Mulcahy, D. Application of green remediation on soil salinity treatment: A review on halophytoremediation. Process Saf. Environ. Prot. 2017, 107, 94–107. [Google Scholar] [CrossRef]
- De-Bashan, L.E.; Hernandez, J.P.; Bashan, Y. The potential contribution of plant growth-promoting bacteria to reduce environmental degradation—A comprehensive evaluation. Appl. Soil Ecol. 2012, 61, 171–189. [Google Scholar] [CrossRef]
- Bano, A.; Fatima, M. Salt tolerance in Zea mays L. following inoculation with Rhizobium and Pseudomonas. Biol. Fertil. Soils 2009, 45, 405–413. [Google Scholar] [CrossRef]
- Bharti, N.; Barnawal, D.; Awasthi, A.; Yadav, A.; Kalra, A. Plant growth promoting rhizobacteria alleviate salinity induced negative effects on growth, oil content and physiological status in Mentha arvensis. Acta Physiol. Plant. 2014, 36, 45–60. [Google Scholar] [CrossRef]
- Ruppel, S.; Franken, P.; Witzel, K. Properties of the halophyte microbiome and their implications for plant salt tolerance. Funct. Plant Biol. 2013, 40, 940–951. [Google Scholar] [CrossRef]
- Bharti, N.; Pandey, S.S.; Barnawal, D.; Patel, V.K.; Kalra, A. Plant growth promoting rhizobacteria Dietzia natronolimnaea modulates the expression of stress responsive genes providing protection of wheat from salinity stress. Sci. Rep. 2016, 6, 34768. [Google Scholar] [CrossRef]
- Chang, P.; Gerhardt, K.E.; Huang, X.-D.; Yu, X.-M.; Glick, B.R.; Gerwing, P.D.; Greenberg, B.M. Plant growth-promoting bacteria facilitate the growth of barley and oats in salt-impacted soil: Implications for phytoremediation of saline soils. Int. J. Phytoremediation 2014, 16, 1133–1147. [Google Scholar] [CrossRef]
- Jha, Y.; Subramanian, R.B. Reduced cell death and improved cell membrane integrity in rice under salinity by root associated bacteria. Theor. Exp. Plant Physiol. 2015, 27, 227–235. [Google Scholar] [CrossRef]
- Jha, Y.; Subramanian, R.B.; Patel, S. Combination of endophytic and rhizospheric plant growth promoting rhizobacteria in Oryza sativa shows higher accumulation of osmoprotectant against saline stress. Acta Physiol. Plant. 2010, 33, 797–802. [Google Scholar] [CrossRef]
- Mahmoud, O.M.-B.; Slimene, I.B.; Zribi, O.T.; Abdelly, C.; Djébali, N. Response to salt stress is modulated by growth-promoting rhizobacteria inoculation in two contrasting barley cultivars. Acta Physiol. Plant. 2017, 39, 120. [Google Scholar] [CrossRef]
- Omar, M.N.A.; Osman, M.E.H.; Kasim, W.A.; Abd El-Daim, I.A. Improvement of salt tolerance mechanisms of barley cultivated under salt stress using Azospirillum brasilense. In Salinity and Water Stress; Ashraf, M., Ozturk, M., Athar, H.R., Eds.; Springer: Dordrecht, The Netherlands, 2009; Volume 44, pp. 133–147. [Google Scholar]
- Hamdia, M.A.E.-S.; Shaddad, M.A.K.; Doaa, M.M. Mechanisms of salt tolerance and interactive effects of Azospirillum brasilense inoculation on maize cultivars grown under salt stress conditions. Plant Growth Regul. 2004, 44, 165–174. [Google Scholar] [CrossRef]
- Himabindu, Y.; Chakradhar, T.; Reddy, M.C.; Kanygin, A.; Redding, K.E.; Chandrasekhar, T. Salt-tolerant genes from halophytes are potential key players of salt tolerance in glycophytes. Environ. Exp. Bot. 2016, 124, 39–63. [Google Scholar] [CrossRef]
- Jithesh, M.N.; Prashanth, S.R.; Sivaprakash, K.R.; Parida, A.K. Antioxidative response mechanisms in halophytes: Their role in stress defence. J. Genet. 2006, 85, 237–254. [Google Scholar] [CrossRef] [PubMed]
- Rueda-Puente, E.O.; García-Hernández, J.L.; Preciado-Rangel, P.; Murillo-Amador, B.; Tarazón-Herrera, M.A.; Flores-Hernández, A.; Holguin-Peña, J.; Aybar, A.N.; Barrón Hoyos, J.M.; Weimers, D.; et al. Germination of Salicornia bigelovii ecotypes under stressing conditions of temperature and salinity and ameliorative effects of plant growth-promoting bacteria. J. Agron. Crop Sci. 2007, 193, 167–176. [Google Scholar] [CrossRef]
- Niu, S.-Q.; Li, H.-R.; Paré, P.W.; Aziz, M.; Wang, S.-M.; Shi, H.; Li, J.; Han, Q.-Q.; Guo, S.-Q.; Li, J.; et al. Induced growth promotion and higher salt tolerance in the halophyte grass Puccinellia tenuiflora by beneficial rhizobacteria. Plant Soil 2016, 407, 217–230. [Google Scholar] [CrossRef]
- Kumar, K.; Amaresan, N.; Madhuri, K. Alleviation of the adverse effect of salinity stress by inoculation of plant growth promoting rhizobacteria isolated from hot humid tropical climate. Ecol. Eng. 2017, 102, 361–366. [Google Scholar] [CrossRef]
- Bacilio, M.; Rodriguez, H.; Moreno, M.; Hernandez, J.-P.; Bashan, Y. Mitigation of salt stress in wheat seedlings by a gfp-tagged Azospirillum lipoferum. Biol. Fertil. Soils 2004, 40, 188–193. [Google Scholar] [CrossRef]
- Flowers, T.; Colmer, T.D. Salinity tolerance in halophytes. New Phytol. 2008, 179, 945–963. [Google Scholar] [CrossRef]
- Galvan-Ampudia, C.S.; Testerink, C. Salt stress signals shape the plant root. Curr. Opin. Plant Biol. 2011, 14, 296–302. [Google Scholar] [CrossRef] [PubMed]
- Worchel, E.R.; Giauque, H.E.; Kivlin, S.N. Fungal symbionts alter plant drought response. Microb. Ecol. 2013, 65, 671–678. [Google Scholar] [CrossRef] [PubMed]
- Rosenberg, M.S.; Adams, D.C.; Gurevitch, J. MetaWin: Statistical Software for Meta-Analysis Version 2.0; Sinauer Associates: Sunderland, MA, USA, 2000. [Google Scholar]
- Hedges, L.V.; Gurevitch, J.; Curtis, P.S. The meta-analysis of response ratios in experimental ecology. Ecology 1999, 80, 1150–1156. [Google Scholar] [CrossRef]
- Leifheit, E.F.; Veresoglou, S.D.; Lehmann, A.; Morris, E.K.; Rillig, M.C. Multiple factors influence the role of arbuscular mycorrhizal fungi in soil aggregation—A meta-analysis. Plant Soil 2014, 374, 523–537. [Google Scholar] [CrossRef]
- Auge, R.M.; Toler, H.D.; Saxton, A.M. Arbuscular mycorrhizal symbiosis and osmotic adjustment in response to NaCl stress: A meta-analysis. Front. Plant Sci. 2014, 5, 562. [Google Scholar] [PubMed]
- Yang, H.; Zhang, Q.; Dai, Y.; Liu, Q.; Tang, J.; Bian, X.; Chen, X. Effects of arbuscular mycorrhizal fungi on plant growth depend on root system: A meta-analysis. Plant Soil 2014, 389, 361–374. [Google Scholar] [CrossRef]
- Singh, R.P.; Jha, P.N. Mitigation of salt stress in wheat plant (Triticum aestivum) by ACC deaminase bacterium Enterobacter sp. SBP-6 isolated from Sorghum bicolor. Acta Physiol. Plant. 2016, 38, 110. [Google Scholar] [CrossRef]
- Siddikee, M.A.; Glick, B.R.; Chauhan, P.S.; Yim, W.; Sa, T. Enhancement of growth and salt tolerance of red pepper seedlings (Capsicum annuum L.) by regulating stress ethylene synthesis with halotolerant bacteria containing 1-aminocyclopropane-1-carboxylic acid deaminase activity. Plant Physiol. Biochem. PPB 2011, 49, 427–434. [Google Scholar] [CrossRef]
- Ashraf, M. Some important physiological selection criteria for salt tolerance in plants. Flora Morphol. Distrib. Funct. Ecol. Plants 2004, 199, 361–376. [Google Scholar] [CrossRef]
- Ashraf, M.; Harris, P.J.C. Potential biochemical indicators of salinity tolerance in plants. Plant Sci. 2004, 166, 3–16. [Google Scholar] [CrossRef]
- Numan, M.; Bashir, S.; Khan, Y.; Mumtaz, R.; Shinwari, Z.K.; Khan, A.L.; Khan, A.; Al-Harrasi, A. Plant growth promoting bacteria as an alternative strategy for salt tolerance in plants: A review. Microbiol. Res. 2018, 209, 21–32. [Google Scholar] [CrossRef] [PubMed]
- Munns, R.; James, R.A.; Gilliham, M.; Flowers, T.J.; Colmer, T.D. Tissue tolerance: An essential but elusive trait for salt-tolerant crops. Funct. Plant Biol. 2016, 43, 1103–1113. [Google Scholar] [CrossRef]
- Kosová, K.; VítámvásA, P.; UrbanA, M.O.; PrášilA, I.T. Plant proteome responses to salinity stress-comparison of glycophytes and halophytes. Funct. Plant Biol. 2013, 40, 775–786. [Google Scholar] [CrossRef]
- Tester, M. Na+ tolerance and Na+ transport in higher plants. Ann. Bot. 2003, 91, 503–527. [Google Scholar] [CrossRef] [PubMed]
- Deinlein, U.; Stephan, A.B.; Horie, T.; Luo, W.; Xu, G.; Schroeder, J.I. Plant salt-tolerance mechanisms. Trends Plant Sci. 2014, 19, 371–379. [Google Scholar] [CrossRef] [PubMed]
- Rai, S.; Luthra, R.; Kumar, S. Salt-tolerant mutants in glycophytic salinity response (GSR) genes in Catharanthus roseus. Theor. Appl. Genet. 2003, 106, 221–230. [Google Scholar] [CrossRef] [PubMed]
- Lutts, S.; Kinet, J.M.; Bouharmont, J. Effects of salt stress on growth, mineral nutrition and proline accumulation in relation to osmotic adjustment in rice (Oryza sativa L.) cultivars differing in salinity resistance. Plant Growth Regul. 1996, 19, 207–218. [Google Scholar] [CrossRef]
- Younesi, O.; Moradi, A. Effects of plant growth-promoting rhizobacterium (PGPR) and arbuscular mycorrhizal fungus (AMF) on antioxidant enzyme activities in salt-stressed bean (Phaseolus vulgaris L.). Agriculture 2014, 60, 10–21. [Google Scholar] [CrossRef]
- Nadeem, S.M.; Zahir, Z.A.; Naveed, M.; Arshad, M. Preliminary investigations on inducing salt tolerance in maize through inoculation with rhizobacteria containing ACC deaminase activity. Can. J. Microbiol. 2007, 53, 1141–1149. [Google Scholar] [CrossRef]
- Evelin, H.; Kapoor, R.; Giri, B. Arbuscular mycorrhizal fungi in alleviation of salt stress: A review. Ann. Bot. 2009, 104, 1263–1280. [Google Scholar] [CrossRef]
- Hameed, M.; Ashraf, M.; Ahmad, M.S.A.; Naz, N. Structural and functional adaptations in plants for salinity tolerance. In Plant Adaptation and Phytoremediation; Ashraf, M., Ozturk, M., Ahmad, M.S.A., Eds.; Springer Science+Business Media: New York, NY, USA, 2010; pp. 151–170. [Google Scholar]
- Arora, N.K.; Tewari, S.; Singh, S.; Lal, N.; Maheshwari, D.K. PGPR for protection of plant health under saline conditions. In Bacteria in Agrobiology: Stress Management; Maheshwari, D.K., Ed.; Springer: Berlin/Heidelberg, Germany, 2012; pp. 239–258. [Google Scholar]
- Han, Q.; Lu, X.; Bai, J.; Qiao, Y.; Paré, P.W.; Wang, S.; Zhang, J.; Wu, Y.; Pang, X.; Xu, W.; et al. Beneficial soil bacterium Bacillus subtilis (GB03) augments salt tolerance of white clover. Front. Plant Sci. 2014, 5, 525. [Google Scholar] [CrossRef] [PubMed]
- Bharti, N.; Yadav, D.; Barnawal, D.; Maji, D.; Kalra, A. Exiguobacterium oxidotolerans, a halotolerant plant growth promoting rhizobacteria, improves yield and content of secondary metabolites in Bacopa monnieri (L.) Pennell under primary and secondary salt stress. World J. Microbiol. Biotechnol. 2013, 29, 379–387. [Google Scholar] [CrossRef] [PubMed]
- Bose, J.; Rodrigo-Moreno, A.; Shabala, S. ROS homeostasis in halophytes in the context of salinity stress tolerance. J. Exp. Bot. 2014, 65, 1241–1257. [Google Scholar] [CrossRef] [PubMed]
- Gururani, M.A.; Upadhyaya, C.P.; Baskar, V.; Venkatesh, J.; Nookaraju, A.; Park, S.W. Plant growth-promoting rhizobacteria enhance abiotic stress tolerance in Solanum tuberosum through inducing changes in the expression of ROS-scavenging enzymes and improved photosynthetic performance. J. Plant Growth Regul. 2012, 32, 245–258. [Google Scholar] [CrossRef]
- Kaur, N.; Dhawan, M.; Sharma, I.; Pati, P.K. Interdependency of reactive oxygen species generating and scavenging system in salt sensitive and salt tolerant cultivars of rice. BMC Plant Biol. 2016, 16, 131. [Google Scholar] [CrossRef] [PubMed]
- Khan, M.H.U.; Khattak, J.Z.K.; Jamil, M.; Malook, I.; Khan, S.U.; Jan, M.; Din, I.; Saud, S.; Kamran, M.; Alharby, H.; et al. Bacillus safensis with plant-derived smoke stimulates rice growth under saline conditions. Environ. Sci. Pollut. Res. 2017, 24, 23850–23863. [Google Scholar] [CrossRef] [PubMed]
- Parida, A.K.; Das, A.B. Salt tolerance and salinity effects on plants: A review. Ecotoxicol. Environ. Saf. 2005, 60, 324–349. [Google Scholar] [CrossRef]
- Ashraf, M.; Harris, P.J.C. Photosynthesis under stressful environments: An overview. Photosynthetica 2013, 51, 163–190. [Google Scholar] [CrossRef]
- Jha, Y.; Subramanian, R. Under saline stress plant growth promoting bacteria affect growth, photosynthesis and antioxidant activities in paddy. Int. J. Agric. Environ. Biotechnol. 2014, 7, 489–497. [Google Scholar]
© 2019 by the authors. Licensee MDPI, Basel, Switzerland. This article is an open access article distributed under the terms and conditions of the Creative Commons Attribution (CC BY) license (http://creativecommons.org/licenses/by/4.0/).