Abstract
In any public service development decision, it is essential to reach the stakeholders’ agreement to gain a sustainable result, which is accepted by all involved groups. In case this criterion is violated, the impact of the development will be less than expected due to the resistance of one group or another. Concerning public urban transport decisions, the lack of consensus might cause lower utilisation of public vehicles, thus more severe environmental damage, traffic problems and negative economic impacts. This paper aims to introduce a decision support procedure (applying the current MCDM techniques; Fuzzy and Interval AHP) which is capable of analysing and creating consensus among different stakeholder participants in a transport development problem. The combined application of FAHP and IAHP ensures that the consensus creation is not only based on an automated computation process (just as in IAHP) but also on the consideration of specific group interests. Thus, the decision makers have the liberty to express their preferences in urban planning, along with the consideration of numerical results. The procedure has been tested in a real public transport improvement decision as a follow-up project, in an emerging city, Mersin, Turkey. Results show that by the application of the proposed techniques, decision-makers can be more aware of the conflicts of interests among the involved groups, and they can pay more attention to possible violations.
1. Introduction
Cities worldwide suffer from population growth and rapid urbanisation, which makes utilising public transportation the right solution to reduce traffic, environmental and public health problems. Public participation in decision making is a crucial issue-on the one hand, the people ought to have the opportunity to influence decisions that affect their lives, and on the other hand, the implementations will only be practical if they meet citizens’ need. The achievement of public participation relies upon how far the public is permitted to be involved [1]. Engaging the public in such a decision that is related to their lives, especially in public transportation decisions, will make a kind of motivation also which might lead to attracting more users [2,3,4]. In the United States of America, the public participates in transportation development project decisions directly through the law called, “Safe, Accountable, Flexible, Efficient Transportation Equity Act—a Legacy for Users” [5]. It was signed into law by President George W. Bush on 10 August 2005. Additionally, in the European Union, the public participates in decision making indirectly through the creation process of the Sustainable Urban Mobility Plan (SUMP). It has to be stressed, however, that it is still not obligatory to involve citizens in the SUMP creation directly. Sometimes the referred passenger data is out of date, and public survey participation is skipped during the creation process, so there is space to improve the SUMP theory and practice; hopefully, our paper can contribute to this. For the case of emerging countries, some research from Turkey and India show that their legal structures have placed a barrier between the residents and the local authority [6]. Decision making in a public bus transportation system is a complex issue related to economic, environmental, and socio-political matters [7], with many influential factors that characterise transport decisions [8,9]. Consequently, transportation experts have started using multi-criteria decision making (MCDM) applications for solving the problems and improving public transport projects [2,10,11,12,13].
As clearly attested to in the recent research, the analytical hierarchy process (AHP) is a well-proven MCDM method, and it has been widely discussed and used in broad range applications since its official appearance [14,15,16,17,18].
The AHP approach is subjective and consistent and is considered as expert knowledge estimation, thus, involving a large sample in the analysis is not necessary [19], and statistical representativeness cannot be claimed. However, the AHP method deals with a very unbalanced scale of judgment, and it does not take into account the uncertainty associated with the mapping of human judgment to a number by natural language [20]. The ranking of the AHP is somewhat imprecise; the subjective judgment by perception, evaluation, improvement and selection based on the preference of decision-makers have a significant influence on the results. Moreover, the dependencies between variables of the AHP usually result in some inconsistencies in the weighting of criteria and create a rank reversal [21]. Duleba and Moslem, [2] tested Pareto optimality of the AHP weight vectors resulted from the pairwise comparison matrices in a real case study and modified the calculation of the AHP eigenvectors. This current study proved that the results of the AHP method could be improved by integrating with appropriate models [22,23]. The efficiency of the combined model with the AHP is mostly dependent on the case used of this method and the type of study for which it is more suitable. Therefore, several mathematical and optimisation techniques have been used to analyse and improve the AHP outputs in terms of resulting accuracy. The statistical approaches of the sensitivity and uncertainty analyses have been integrated with the AHP by using the Monte Carlo simulation (MCS) [24,25]. Meena et al. [26] applied the frequency ratio (FR) with the integration of the AHP method in a hybrid spatial multi-criteria evaluation (SMCE) model, and they got more accurate results from the hybrid model. Both the MCS and FR methods require an inventory dataset to train the model, and that is the main reason for getting higher accuracy in the resulting integrated model outputs. However, usually, such an inventory dataset as this is not available for all decision problems. In another integration model, Ha et al. [27] used the AHP method integrated with fuzzy-TOPSIS for the prioritisation of their methodology performance. The fuzzy theory is supportive in most of the MCDM applications as it has the capability of representing vague measures within mathematical operators to make decisions in the fuzzy domain. The fuzzy theory itself has been combined with the AHP (FAHP) to evolve its outcomes in several studies [28,29,30,31,32]. The analytical network process (ANP) is an extended version that is suitable for complex decision problems which the criteria have specific interrelations [25,33]. The ANP also has been combined with fuzzy theory to minimise the chance of error and inherent uncertainty associated with the decision-making system [34,35,36] using the interval calculus of the AHP (IAHP), which is a more practical method when a significant number of experts with a high variation of preferences and interests are asked about Eigenvalues of the AHP in complex decisions [37]. Based on the literature review, a research gap can be clearly indicated. The dominance of the applied models in urban transport planning suggests numerical computation, or negotiation/voting in order to create consensus among the stakeholders. However, numerical results along with the possibility for decision makers to the further consideration of stakeholder group interest are missing in the decision procedure.
As the literature review indicated, a variety of methods have been successfully integrated with knowledge-based models for optimisation of the model for transportation improvement projects. The present paper aims to introduce a combined model for supporting consensual decision making concerning sustainability in urban transport development. The current research is a follow-up project of the previous, already published work, [36]. In the last case, consensus creation could be gained by an automated computational process (IAHP) considering the lowest and highest evaluation values of the three different stakeholder group respondents. Thus, the extreme interest of one group or another could distort the final, consensual results.
Moreover, in the final result, the stakeholder perspectives could not be separated; merely aggregated preferences could be detected. From the local authority, the question arose, how it would be possible to obtain more knowledge on the violation or consideration of different interests of the involved groups and further, to compare their situation from the development decision point of view. Sustainability aspect requires this knowledge in order to avoid the opposition of one involved group or another. Since public evaluators have been involved in both projects, avoiding uncertainty has remained among the objectives. Thus, two appropriate methods recommended generally by the scientific literature: FAHP and IAHP have been applied. By using both techniques, the opportunity has been given to better analyse the consensual results from the aspect of different stakeholder groups: Passengers, non-passenger citizens and representatives of the local governance.
Sustainability considerations are twofold in the model. On the one hand, environmental aspects can be expressed indirectly by the scoring of one decision element (mental comfort). On the other hand, the consensus creation among stakeholders itself is due to the factor of long-term sustainability. Further, the selection of the evaluator group: Non-users, also reflects the motivation to reduce urban CO2 emissions. The citizens not using public vehicles also have their preferences related to urban transport development, and the more this demand is considered, the more people can be attracted from private car use to public transport. A summary of the literature review is represented in Table 1.

Table 1.
A summary of the literature review and contributions.
2. Materials and Methods
The analytic hierarchy process is one of the most robust decision-making methodologies, which was enhanced by Saaty in the 1980s to simplify complex decision problems [38]. The AHP method is based on an additive weighting process, in which several relevant criteria are represented through their relative importance. The AHP approach was extensively applied by academics and professionals in many areas and problems, mainly in engineering fields like transport engineering [2,3,13,39,40,41,42], in construction engineering and accuracy assessment [43,44], in architecture [45,46] and in many different engineering fields [18,47,48,49,50].
The AHP approach has some restrictions. To overcome these problems, many researchers integrate fuzzy theories with the AHP to improve its results [29,30,31].
2.1. Overall Methodology
The preferences of our different target groups of regular passengers, potential passengers and decision makers were obtained and used for weighting the conditioning criteria of the SUMP in the Mersin metropolitan area. We incorporated the AHP as a central part of MCDA and used this approach along with interval calculus and the fuzzy set theory for this aim. The overall methodology of this study is as follows:
- Conducting a questionnaire-based survey among the target groups and obtaining their preferences via comparison matrices of conditioning criteria.
- Structuring the FAHP based on the linguistic variables and obtaining the final fuzzy weight scores for all groups.
- Applying the IAHP for obtaining the weight scores for all groups based on the interval pairwise comparison matrices.
- Estimating the agreement degree among the target groups using the Kendall’s coefficient of concordance (W) based on the results of the FAHP and IAHP approaches.
The descriptions and the resulting experimental outputs of this methodology are organized in the following sections. Supplementary explanations and discussions regarding the impact of using each approach can be found in the discussion and conclusion sections.
2.2. Fuzzy AHP
Fuzzy logic and fuzzy set theory mimic human reasoning; this logic deals with uncertainty and comparative information to make decisions [51]. Against the Boolean logic where every element is either true or false, the fuzzy logic elements are both true and false by different degrees. Therefore, it makes it possible for each component of a set to also belong to its complement to a specific degree [52]. Zadeh [53] introduced the “Fuzzy Sets” to handle vague concepts in a certain way. From that time so far, it has been successfully used to deal with the complex problems posed to conventional set and logic theory by vagueness. Since most of the geographic phenomena tend to be described by vague terms, the fuzzy set theory is widely integrated with different MCDA and machine learning models for mapping the spatial problems [54,55]. The hybrid approach of fuzzy logic and the AHP have been commonly used in natural hazard modelling and mapping goals [56].
Judgments of decision makers are the primary source to weigh the criteria based on their importance regarding the spatial problem. These judgments are represented qualitatively by some linguistic variables. In this stage, a fuzzy set is required to quantify the judgments by using the respective membership function. A triangular fuzzy set (see Figure 1) was used for converting the linguistic variables to the quantitative values in this study. The relationship between quantitative values and linguistic variables are shown in Table 2.
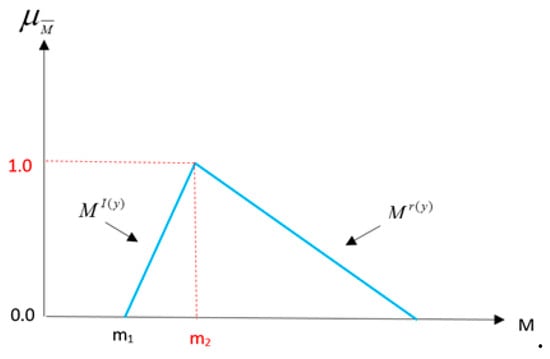
Figure 1.
The triangular fuzzy set.
Table 2.
Triangular fuzzy numbers of linguistic variables.
The authors of the recent research employed this model for Mersin city; however, as a methodology, the FAHP approach was used to ‘fuzzify’ the hierarchical analysis by allowing fuzzy numbers for the pairwise comparisons (PCs) of the stakeholders (users, potential users and decision makers). The decision makers were experts in the related field, and at the same time, they are the officials in the transportation department of the Merin municipality. The hierarchy tree is subject to establish a PC between the main three criteria and twenty-one criteria-sub-criteria. After collecting the data, the geometric mean approach used for aggregating the evaluators’ responses and the final scores were conducted and prioritised. In order to ensure the supply quality and trustability of the collected data, the consistency check was accomplished.
The study aims to enumerate the most crucial public bus transport supply quality criteria and to detect the agreement level between different evaluator groups based on the FAHP and IAHP methods. For this, a case study in the Mersin metropolitan area (Turkey) was chosen. As a commencement study, the ensuing hierarchical structural model (see Figure 2) has been integrated and employed for elaborating the public transport situation of Yurihonjo city (Japan), in 2012 [3].
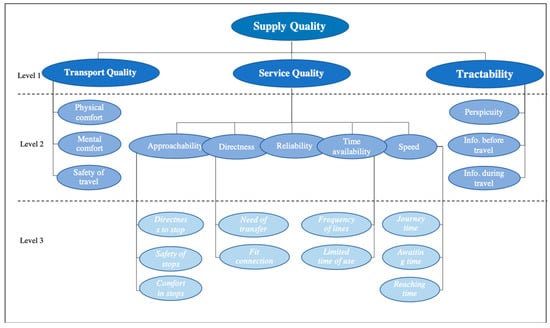
Figure 2.
The hierarchical structure of the supply quality criteria related to public bus transport [3].
As can be seen, the sustainability issue is not explicit; however, the element of “mental comfort” includes this aspect. The usage of public transportation contributes to the mental welfare of passengers by the knowledge of reducing environmental damage by avoiding private car use. Although this aspect was not expressed in a direct way, all evaluators were aware during the evaluation process that sustainability is included in the “mental comfort” element of the decision structure. For more explanation, we provide Table 3.
Table 3.
The public transport supply quality criteria, level and description.
Then the pairwise comparison matrices of the AHP combined with the fuzzy set theory for further calculations for reducing the subjectivity in the criteria weightings. In this regard, fuzzy numbers were defined to make a comparative pairwise and structuring of the corresponding matrices. By considering the matrix of as our pairwise comparison matrix that was structured with the fuzzy numbers, we have (1):
where each component has the condition that if then for 1, j, …, n and .
Therefore, all components of the matrix can be defined from the fuzzy numbers. For the normalised summation of the rows in the matrix by using the triangular fuzzy numbers, we used the following Equation (2):
where i and j were the number of rows and columns respectively and is the extended multiplication of two fuzzy triangular numbers. is the triangular fuzzy numbers in pairwise matrices. The values of and can be calculated from the following formulas:
and
where , and are the first to third components in fuzzy numbers.
If and are considered as two triangular fuzzy numbers (see Figure 3), then the degree of possibility in comparison with was defined as Equation (8) [15]:
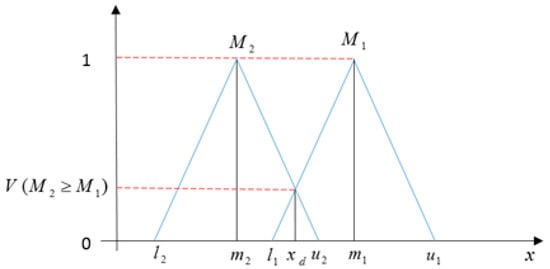
Figure 3.
The degree of possibility .
On the other hand, the possibility of a triangular number is obtained from a fuzzy number of the following equation:
For calculating the weight of criteria and options in the paired comparative matrices, equation number 8 can be used:
Therefore, the normalised vector will be as follows:
The final weight vector was calculated through the Equation (10):
2.3. Interval AHP
In this subsection, we describe the suitability of the AHP method using the interval calculus for our study and also its calculation process. The IAHP is considered as an operational method in the case that the decision problem related to a wide range of fields of knowledge or experts have different preferences [57]. As we deal with diverse groups associated with the public bus transport system, the IAHP method was selected to obtain a better understanding of the expert’s interests. The complexity of public transportation in Mersin city, like in any city in Turkey, can be defined as the diversity of different stakeholders interrelated to the system. The degree of diversity in any complex system is demonstrated by the number of emergent properties [58]. In the present study, if we use the comments of our target stakeholders as the Eigenvalues for the pairwise comparison matrices of the conventional AHP, it will be challenging to get an acceptable CR and the weights representing the preferences of all stakeholders [59]. Even if only one group of stakeholders is considered, we can rarely get similar Eigenvalues for the pairwise comparison matrices. Thus, conventional AHP has some limitations to covering all preferences regarding the decision problem.
To overcome these limitations of the conventional AHP, we used interval pairwise comparison matrices in the AHP calculation process. Therefore, any pairwise comparison matrix was carried out using numerical intervals. The lower value of an interval was considered as the lower bound, and the higher value was considered as the upper bound. Let a be the lower bound, and b be the upper bound; then . The set is considered as the interval that is used in the pairwise comparison matrices. The set of all intervals is denoted as . In this case, the binary operations such as multiplication can easily be defined on . Let A be the pairwise comparison matrix including intervals, then as (11):
is consistent if the following (12) transitivity is satisfied [60]:
For an instance interval of means that the criterion is between and times as preferable to the criterion . Therefore, the interval pairwise comparison matrix can be defined as (13):
Since the matrix of A is a reciprocal and definite matrix by explanations in (14):
For evaluation of the CR of this matrix and further calculations of the AHP, matrix A should be a reciprocal matrix. In this case, we can easily separate it into two crisp mutual comparison matrices of, and . The matrix can be defined based on the P and Q (see Equation (15):
All elements of matrix are convex combinations of corresponding elements of the two matrices, P and Q. More importantly, is a monotonic continuous function matrix constructed based on . Therefore, we have D(1) = P and D(0) = Q [61]. For each there is and can be easily defined as an interval pairwise comparison reciprocal matrix for any . Then matrix A is a reciprocal matrix, and and , are non-negative values such that To make an interval reciprocal pairwise comparison matrix A be acceptably consistent, there are four cases, i.e., (i) = 0 and = 0; (ii) = 0 and 0 < < 0.1; (iii) 0 < < 0.1 and = 0 and (iv) 0 < < 0.1 and 0 < < 0.1, where and are CRS of P and Q, respectively otherwise, matrix is not consistent [20].
For calculating the relative interval weightings, suppose is the vector containing the weightings of matrix that is derived from the geometric mean method (see Equation (16)).
This applies if: . Equation (2) can be used in the definition of . Then
where and are considered as weighting vectors for matrices and , respectively. The weighting vector of is used to make the interval weighting as below:
As for any the and can be defined as follows [16,20]:
Then a simple statistical sampling method of the MCS was used to calculate final weightings. The MCS was used to calculate the final weightings based on the . The MCS is a widely used statistical sampling method for complex systems. In the following, an average value of each resulting interval weight was calculated and considered as the final weight using the MCS between the .
2.4. Kendall’s Coefficient of Concordance (W)
As previously mentioned, this paper intends to gain preference scores from different stakeholder groups related to public transport advancement and to analyse the distinction among the opinions of the three distinct evaluator groups. To estimate the agreement degree or concordant degree among the user, potential user and decision maker groups, Kendall’s coefficient of concordance (W) was implemented [62,63]. The applied technique is a non-parametric technique for three or more different rankings (see Equation (17)):
where “i” is the individual rated criteria, “m” is the number of rater groups rating “n” factors (see Equations (18) and (19)):
where S is a sum-of-squares statistic deviation over the row cumulates of ranks Ri.
R is the mean of the Ri values.
Following that, Kendall’s W statistic is limited between one and zero, and it can be attained from the following formula (20):
After implementing the formula, the outcome will be a number that determines the concordance degree among the different groups, as illustrated in Table 4.
Table 4.
Kendall’s W concordance degree scale.
3. Results of the Conducted Survey
The introduced case study, the urban bus transport development problem in a big Turkish city, Mersin, is appropriate to demonstrate the suitability of the proposed model. As many emerging cities, Mersin is also suffering from severe environmental damage. According to the prepared Turkish air pollution report, (by the Chamber of Environmental Engineers’ 2017) Mersin has critical complications with air pollution. The most essential justifications are the steady increase in population over several years, the expansion of industrial investments, inadequate inspections and controls in in-registry or outsourced enterprises, a severe increase in the number of vehicles used, energy production from fossil fuels, uncontrolled destruction of forests, forest fires, the poor quality of fuels that are used for heating in homes and workplaces. The air pollution that affects the atmosphere directly has an essential influence on increasing diseases and decreasing living standards. Despite the temperate climatic conditions, according to the World Health Organization (WHO) limit values, the number of days of polluted air in Mersin is 242, while the allowed number of days of polluted air is merely 127 according to Turkish national legislation, which is very thought-provoking and seems to be a vital issue to be addressed at the local level.
As a possible solution, the local government initiated a project to develop public transportation in order to attract citizens away from private car use to take public transport instead. Their objective was clear: Improving the supply quality of urban transport by considering all involved stakeholder groups (i.e., people who use the current system, potential citizens who can be attracted to use it and transportation and government experts who have technical and policy knowledge related to transport). Consequently, they decided to launch a survey with the participation of these three groups.
The characteristics of the conducted questionnaire-based survey on the hierarchical model were the following:
- One hundred evaluators (10 government official workers in the relevant field + 45 regular users + 45 potential users) were asked among the total population of 1,773,852. The citizens were randomly selected at nearby bus stops in different districts of the city. The government experts are all members of the local municipality transportation department and have more than five years of experience in transport planning and policy. The number of evaluators is not statically representative; however, the MCDM provides a more in-depth insight based on PCs than a simple statistical survey [64]. Moreover, experiments proved [65] that in expressing preferences, a group consisting of over 20 randomly selected members behaves according to the phenomenon known as, “the wisdom of the crowd”. Thus, extreme opinions are filtered out, and the final decision becomes very reliable at this number of membership.
- The dynamic questionnaire was evaluated between October and December 2018 and analysed at the end of February 2019. Regular passengers, potential passengers and decision makers participated.
- For the computation, MS Excel was applied. We note that there are other possibilities for software such as MATLAB, Expert Choice, Super Decisions.
The consistency ratio (CR) for all matrices in all groups was smaller than 0.1, which is acceptable to complete the AHP analysis, as Saaty suggested [64]. Sensitivity analysis has been performed by changing the weight of each main criterion to test the stability of the rank, and it was robust without change. In the case of some criteria, a significant conflict could be detected among the different evaluator groups. Considering the separation of the three different sides of public bus transportation, the scores of the proper eigenvectors provide the opportunity to set up a rank order of preferences among the participants of public bus transport on the issues of the system, also considering the weights of the previous levels by using the following Equation (21):
where j = 1, …, m and ; wj > 0 (j = 1, …, m) represents the related weight coordinate from the previous level; > 0 (i = 1, …, n) is the eigenvector computed from the matrix in the current level, (i = 1, …, n) is the calculated weight score of the current level’s elements. Sensitivity analysis enables us to follow the effects of changes in the main criteria on the sub criteria, disaggregating and helping decision makers to check the robustness throughout the process.
3.1. Results of Fuzzy AHP
The priority order of different elements in public bus transportation systems is presented in Table 5, Table 6 and Table 7 in terms of their development by the fuzzy AHP.
Table 5.
Fuzzy weight scores of the criteria for Level 1.
Table 6.
Final fuzzy weight scores of the criteria for Level 2, considering branch connections.
Table 7.
Final fuzzy scores of the criteria for Level 3, considering branch connections.
In the first level, all different participant groups of the analysed public transportation system indicated the development of the “Tractability” criteria as the most significant related issue, as shown in Table 5. However, there were differences of preferences between passenger groups and the groups in the second and third rank, in which the passenger side ranked “Service quality” as the second most important issue followed by “Transport quality”, while the other participated groups evaluated “Transport quality” as the second most important issue followed by “Service quality”.
The situation was slightly different in Level 2, where passenger groups ranked “Information during travel” as the most critical criteria followed by “Perspicuity” and “Information before travel”; however, potential passenger groups evaluated “Physical comfort” as the most essential criteria, which was not that important in regular users’ and the government’s point of view. For the government side, the most important criteria were “Perspicuity” followed by “Information during travel” and “Mental comfort”.
It can be counted on positively that all evaluator groups agreed on ranking “Reliability” as the lowest insignificant criteria in this level, which reflects almost the same points of view toward “Approachability”. In the last level, more disagreement could be detected, where for the user side, the “Time to reach stops” criteria was the most crucial one, followed by “Need of transfer” and “Awaiting time”, while the potential user side ranked “Fit connection” as the most crucial issue to be enhanced followed by “Frequency of lines” and “Directness to stops”. “Limited time of use” was estimated as the most substantial criteria followed by “Need of transfer”. Table 8, Table 9 and Table 10 represent the final fuzzy weight scores for all groups at each level.
Table 8.
Fuzzy aggregated weight scores for all groups for Level 1.
Table 9.
Final fuzzy weight scores for all groups for Level 2, considering branch connections.
Table 10.
Final fuzzy weight scores for all groups for Level 3, considering branch connections.
3.2. Results of the Interval AHP
The resulting weights based on the interval pairwise comparison matrices for each level were represented in Table 11, Table 12 and Table 13.
Table 11.
Final scores for all evaluator groups for Level 1.
Table 12.
Final scores for all evaluator groups for Level 2.
Table 13.
Final scores for all evaluator groups for Level 3.
3.3. Results of Kendall’s Coefficient of Agreement (W)
The disagreement was not only about rating the most important criteria but also about the least important one, where the most valued criteria for the government side was the last valuable criteria for the regular user side. In order to prove the agreement and disagreement points of view among the various rater groups, Kendall’s coefficient of agreement (W) was implemented. In the first and second level and based on Table 4, there was a “strong agreement” between the different rater groups; however, in the last level, the situation was variegated where a “moderate agreement” was detected. The Kendall’s coefficient of agreement (W) for different levels of 1, 2 and 3 are represented in Table 14, Table 15 and Table 16 respectively.
Table 14.
Kendall’s coefficient of agreement (W) for Level 1.
Table 15.
Kendall’s coefficient of agreement (W) for Level 2.
Table 16.
Kendall’s coefficient of agreement (W) for Level 3.
As can be seen in the results, the current users of the public transport system indicated tractability and its related issues as the most critical elements of the supply quality. Their aspect is considered both in the FAHP and IAHP final results. Nevertheless, physical comfort plays a more prominent role in the IAHP aggregated scores, which is rather the potential users’ preference. Based on this, ameliorating the physical conditions still can be a proposed measurement for the decision makers because it might attract more new passengers to contribute to more sustainable system operation. This result could not have been achieved by applying the FAHP methodology solely. In addition, the IAHP shed light on the demand of potential users for more frequent lines; in the FAHP it cannot be detected, but in the IAHP final scores, this preference is transparent even in the consensual ranking.
On the other hand, the FAHP performed very well in highlighting the need for more tractable operations; in the IAHP, it is not so dominating. However, this could be the most crucial problem with the current urban bus transport operation.
Moreover, the FAHP indicated the limited time of use as the most severe problem in the third most specific level. In practice, this means that if users and potential users are not satisfied with the current time frame of the lines; the local government can manage the population who need to the public transportation system by launching earlier lines in the morning hours. Moreover, adding extra lines in the evening will help manage the higher population during this period. This matter might attract more citizens to use public transport in this time of the day (maybe because of early or late working hours in the city) so the utilisation of the public transport system as a whole could be increased.
4. Discussion
Based on the results, it can be stated that the model combining the FAHP and IAHP is suitable for a deeper more in-depth analysis, thus providing more in-depth insight to the decision makers for a consensual development problem such as the SUMP than the individual application of either the FAHP or IAHP. To demonstrate this statement, we show the graphical figure of the first level scoring for all three groups in the FAHP and also in the IAHP.
The FAHP showed the different preference of regular users (passengers) in ranking service quality and transport quality compared with the other two groups (Figure 4) while the IAHP indicated absolute consensus in ranking for all three evaluator groups (Figure 5).
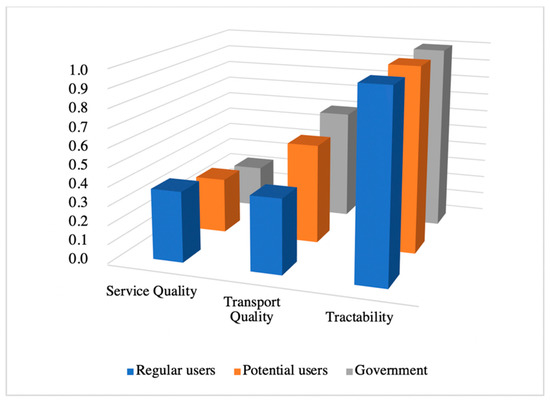
Figure 4.
The comparison of scores resulting from the fuzzy analytic hierarchy process (FAHP) for the first level of decision elements.
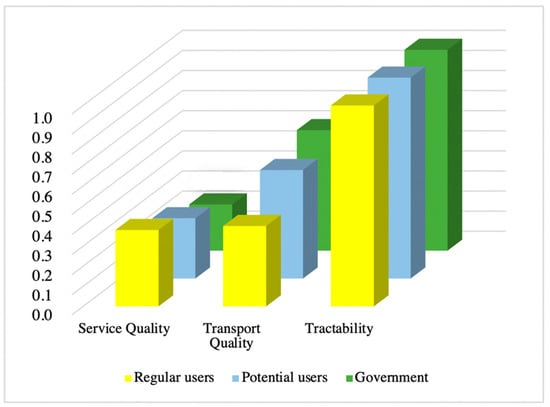
Figure 5.
The comparison of scores resulting from the interval analytic hierarchy process (IAHP) for the first level of decision elements.
For Levels 2 and 3, the degree of consensus and the ranking are also different, and we cannot detect dominancy for either of the two approaches. Consequently, the best decision support could be reached by the numerical application of both methods, followed by the managerial decision on the sustainable and consensual results. The computational results provide the fundamentals of the final decision, but it is necessary to turn to the transport department of the municipality to create the ultimate development strategy considering the conflict of interest of the stakeholders (see Figure 6, Figure 7, Figure 8 and Figure 9).
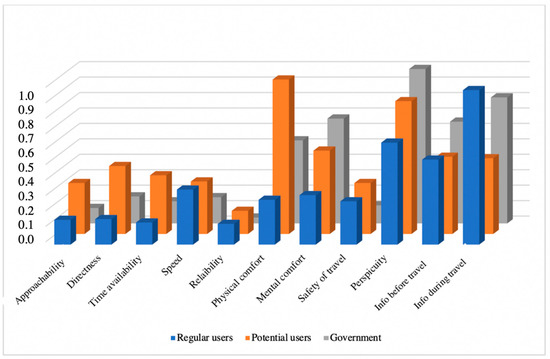
Figure 6.
The comparison of scores resulting from the FAHP for Level 2 of decision elements.
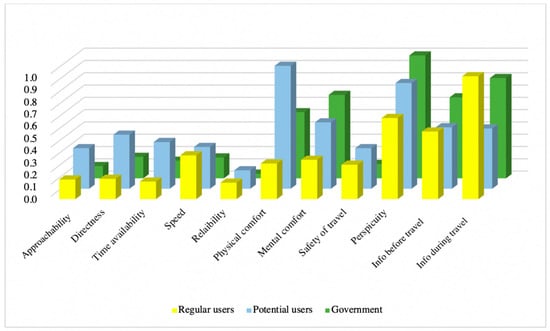
Figure 7.
The comparison of scores resulting from the IAHP for Level 2 of decision elements.
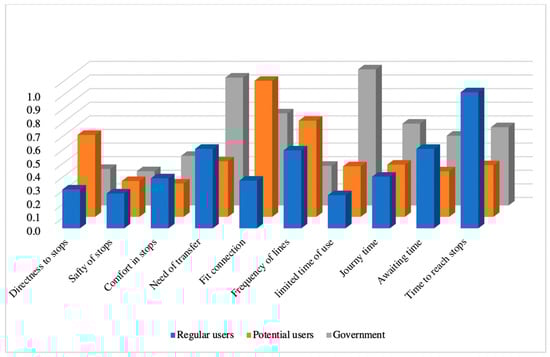
Figure 8.
The comparison of scores resulting from the FAHP for Level 3 of decision elements.
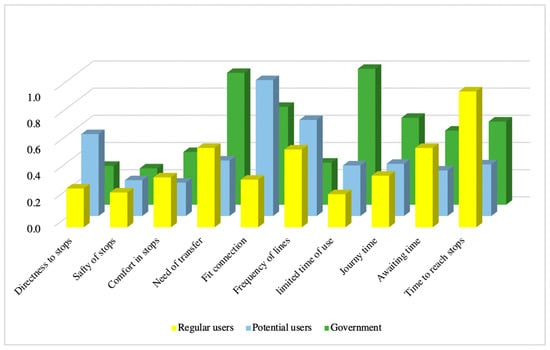
Figure 9.
The comparison of scores resulting from the IAHP for Level 3 of decision elements.
5. Conclusions
Attaining consensus in complex decision problems with various involved stakeholder groups operating along different interests is a tough task in the field of decision support theory and practice. However, this is the suggested approach to gain final, integrated and sustainable results for a high impact public problem.
A prevalent option for consensual decision making is the Multi-Actor, Multi-Criteria Decision Analysis (MAMCA) created by Macharis et al. [66]. In this approach, firstly the different stakeholder groups select their objectives and afterwards a consensual final ranking, and scoring is created. Our advanced procedure follows a reverse logic-the numerical evaluation is supported by the final consensus creation. As introduced, in this model, all participatory groups evaluate precisely the same criteria. They can express their interests by different scoring, and by the Kendall method, it is clear to see that they have different preferences on the same transport system. Although the distance of the opinions is measured in the proposed methodology, the procedure goes further. Applying the FAHP and IAHP, the condition of uncertain judgments is fulfilled, and the requirement for synthesis of the opinion can be completed. In the Results section, it was highlighted that alone, each technique had its problems, but the combination of the two methods has led to more rational and consensual final results.
Thus, for general application, we suggest conducting the introduced FAHP-IAHP procedure for the three involved stakeholder groups, and after gaining the numerical results, the decision makers (local authority or transport company managers) themselves decide on the SUMP. Concerning public transport development decisions, this approach might contribute to more efficient public transport system improvement and by this, to higher utilisation of public vehicles, less air pollution, fewer traffic problems and ultimately more satisfied citizens. The introduced model applies to problems of urban transportation development, and mainly, it focused on the sentiment of the citizens involved in it.
Author Contributions
Conceptualization, S.M., O.G. and S.D.; methodology, S.M., O.G. and S.D.; validation, S.D.; formal analysis, S.M. and O.G.; data curation, S.M.; writing—original draft preparation, O.G. and S.D.; writing—review and editing, T.B.; visualization, S.M.; supervision, T.B. and S.D.; funding acquisition, T.B.
Funding
Austrian Science Fund: DK W 1237-N23.
Acknowledgments
Open Access Funding by the Austrian Science Fund (FWF) through the GIScience Doctoral College (DK W 1237-N23).
Conflicts of Interest
The authors declare no conflict of interest.
References
- Hashim, H. Grassroots Participation in Local Planning Process. Master’s Thesis, Iowa State University, Ames, IA, USA, 1986, unpublished. [Google Scholar]
- Duleba, S.; Moslem, S. Examining Pareto optimality in analytic hierarchy process on real data: An application in public transport service development. Expert Syst. Appl. 2019, 116, 21–30. [Google Scholar] [CrossRef]
- Duleba, S.; Mishina, T.; Shimazaki, Y. A dynamic analysis on public bus transport’s supply quality by using AHP. Transport 2012, 27, 268–275. [Google Scholar] [CrossRef]
- Pérez, J. Some comments on Saaty’s AHP. Manag. Sci. 1995, 41, 1091–1095. [Google Scholar] [CrossRef]
- Fischer, J.W. Resources, Science, and Industry Division. Safe, Accountable, Flexible, Efficient Transportation Equity Act—A Legacy for Users (SAFETEA-LU Or SAFETEA): Selected Major Provisions. Libr. Congr. Congr. Res. Serv. 2005, 14, 59–109. [Google Scholar]
- Tosun, C. The roots of unsustainable tourism development at the local level: The case of Urgup in Turkey. Tour. Manag. 1998, 19, 595–610. [Google Scholar] [CrossRef]
- Benítez, J.; Delgado-Galván, X.; Izquierdo, J.; Pérez-García, R. Consistent completion of incomplete judgments in decision making using AHP. J. Comput. Appl. Math. 2015, 290, 412–422. [Google Scholar] [CrossRef]
- Shafabakhsh, G.; Hadjihoseinlou, M.; Taghizadeh, S.A. Selecting the appropriate public transportation system to access the Sari International Airport by fuzzy decision making. Eur. Transp. Res. Rev. 2014, 6, 277–285. [Google Scholar] [CrossRef]
- Mikusova, M. Proposal of benchmarking methodology for the area of public passenger transport. Period. Polytech. Transp. Eng. 2019, 47, 166–170. [Google Scholar] [CrossRef]
- Ha, M.H.; Yang, Z.; Lam, J.S.L. Port performance in container transport logistics: A multi-stakeholder perspective. Transp. Policy 2019, 73, 25–40. [Google Scholar] [CrossRef]
- Wang, H.; Jiang, Z.; Zhang, H.; Wang, Y.; Yang, Y.; Li, Y. An integrated MCDM approach considering demands-matching for reverse logistics. J. Clean. Prod. 2019, 208, 199–210. [Google Scholar] [CrossRef]
- Tripathy, P.; Khambete, A.K.; Chauhan, K.A. An Innovative Approach to Assess Sustainability of Urban Mobility—Using Fuzzy MCDM Method. In Innovative Research in Transportation Infrastructure; Springer: Singapore, 2019; pp. 55–63. [Google Scholar]
- Balaji, M.; Santhanakrishnan, S.; Dinesh, S.N. An Application of Analytic Hierarchy Process in Vehicle Routing Problem. Period. Polytech. Transp. Eng. 2018, 47, 196–205. [Google Scholar] [CrossRef]
- Shafiei, S.; Vaelizadeh, R.; Bertrand, F.; Ansari, M. Evaluating and Ranking of Travel Mode in Metropolitan. A Transportation Economic Approach. Civ. Eng. J. 2018, 4, 1303–1314. [Google Scholar] [CrossRef]
- Dudek, M.; Solecka, K.; Richter, M. A multi-criteria appraisal of the selection of means of urban user transport using the Electre and AHP methods. Czas. Tech. 2018, 6, 79–93. [Google Scholar]
- Moslem, S.; Duleba, S. Application of AHP for evaluating user demand for public transport improvements in Mersin, Turkey. Pollack Period. 2018, 13, 67–76. [Google Scholar] [CrossRef]
- Ma, F.; He, J.; Ma, J.; Xia, S. Evaluation of urban green transportation planning based on central point triangle whiten weight function and entropy-AHP. Transp. Res. Procedia 2017, 25, 3634–3644. [Google Scholar] [CrossRef]
- Murat, Y.S.; Arslan, T.; Cakici, Z.; Akçam, C. Analytical Hierarchy Process (AHP) based Decision Support System for Urban Intersections in Transportation Planning. In Using Decision Support Systems for Transportation Planning Efficiency; IGI Global, Gazi University: Ankara, Turkey, 2016; pp. 203–222. [Google Scholar]
- Wong, J.K.W.; Li, H. Application of the analytic hierarchy process (AHP) in multi-criteria analysis of the selection of intelligent building systems. Build. Environ. 2008, 43, 108–125. [Google Scholar] [CrossRef]
- Ghorbanzadeh, O.; Feizizadeh, B.; Blaschke, T.; Khosravi, R. Spatially Explicit Sensitivity and Uncertainty Analysis for the landslide risk assessment of the Gas Pipeline Networks. In Proceedings of the 21st AGILE conference on Geo-information science, Lund, Sweden, 12–15 June 2018; pp. 1–7. [Google Scholar]
- De Brito, M.M.; Evers, M.; Almoradie, A.D.S. Participatory flood vulnerability assessment: A multi-criteria approach. Hydrol. Earth Syst. Sci. 2018, 22, 373. [Google Scholar] [CrossRef]
- Jin, H.; Zhang, M.; Yuan, Y. Analytic network process-based multi-criteria decision approach and sensitivity analysis for temporary facility layout planning in construction projects. Appl. Sci. 2018, 8, 2434. [Google Scholar] [CrossRef]
- Hervás-Peralta, M.; Poveda-Reyes, S.; Molero, G.D.; Santarremigia, F.E.; Pastor-Ferrando, J.-P. Improving the performance of dry and maritime ports by increasing knowledge about the most relevant functionalities of the terminal operating system (TOS). Sustainability 2019, 11, 1648. [Google Scholar] [CrossRef]
- Ligmann-Zielinska, A.; Jankowski, P. Spatially-explicit integrated uncertainty and sensitivity analysis of criteria weights in multicriteria land suitability evaluation. Environ. Model. Softw. 2014, 57, 235–247. [Google Scholar] [CrossRef]
- Ghorbanzadeh, O.; Feizizadeh, B.; Blaschke, T. Multi-criteria risk evaluation by integrating an analytical network process approach into GIS-based sensitivity and uncertainty analyses. Geomat. Nat. Hazards Risk 2018, 9, 127–151. [Google Scholar] [CrossRef]
- Meena, S.R.; Ghorbanzadeh, O.; Blaschke, T. A comparative study of statistics-based landslide susceptibility models: A case study of the region affected by the Gorkha earthquake in Nepal. ISPRS Int. J. Geo-Inf. 2019, 8, 94. [Google Scholar] [CrossRef]
- Ha, M.H.; Yang, Z.; Heo, M.W. A new hybrid decision making framework for prioritising port performance improvement strategies. Asian J. Shipp. Logist. 2017, 33, 105–116. [Google Scholar] [CrossRef]
- Prasetyo, D.H.; Mohamad, J.; Fauzi, R. A GIS-based multi-criteria decision analysis approach for public school site selection in Surabaya, Indonesia. Geomatica 2018, 72, 69–84. [Google Scholar] [CrossRef]
- Chen, Y.; Wang, S.; Yao, J.; Li, Y.; Yang, S. Socially responsible supplier selection and sustainable supply chain development: A combined approach of total interpretive structural modeling and fuzzy analytic network process. Bus. Strategy Environ. 2018, 27, 1708–1719. [Google Scholar] [CrossRef]
- Grošelj, P.; Zadnik Stirn, L. Evaluation of several approaches for deriving weights in fuzzy group analytic hierarchy process. J. Decis. Syst. 2018, 27, 217–226. [Google Scholar] [CrossRef]
- Pourghasemi, H.R.; Pradhan, B.; Gokceoglu, C. Application of fuzzy logic and analytical hierarchy process (AHP) to landslide susceptibility mapping at Haraz watershed, Iran. Nat. Hazards 2012, 63, 965–996. [Google Scholar] [CrossRef]
- Fan, G.; Zhong, D.; Yan, F.; Yue, P. A hybrid fuzzy evaluation method for curtain grouting efficiency assessment based on an AHP method extended by D numbers. Expert Syst. Appl. 2016, 44, 289–303. [Google Scholar] [CrossRef]
- Pirnazar, M.; Karimi, A.Z.; Feizizadeh, B.; Ostad-Ali-Askari, K.; Eslamian, S.; Hasheminasab, H.; Ghorbanzadeh, O.; Hamedani, M.H. Assessing flood hazard using GIS based multi-criteria decision making approach; study area: East-Azerbaijan province (Kaleybar Chay basin). J. Flood Eng. 2017, 8, 203–223. [Google Scholar]
- Nazmfar, H.; Saredeh, A.; Eshgi, A.; Feizizadeh, B. Vulnerability evaluation of urban buildings to various earthquake intensities: A case study of the municipal zone 9 of Tehran. Hum. Ecol. Risk Assess. Int. J. 2019, 3, 1–20. [Google Scholar] [CrossRef]
- Razandi, Y.; Pourghasemi, H.R.; Neisani, N.S.; Rahmati, O. Application of analytical hierarchy process, frequency ratio, and certainty factor models for groundwater potential mapping using GIS. Earth Sci. Inform. 2015, 8, 867–883. [Google Scholar] [CrossRef]
- Ghorbanzadeh, O.; Moslem, S.; Blaschke, T.; Duleba, S. Sustainable urban transport planning considering different stakeholder groups by an interval-AHP decision support model. Sustainability 2019, 11, 9. [Google Scholar] [CrossRef]
- Cabrera-Barona, P.; Ghorbanzadeh, O. Comparing classic and interval analytical hierarchy process methodologies for measuring area-level deprivation to analyze health inequalities. Int. J. Environ. Res. Public Health 2018, 15, 140. [Google Scholar] [CrossRef] [PubMed]
- Saaty, T.L. The Analytic Hierarchy Process; McGraw-Hill: New York, NY, USA, 1980. [Google Scholar]
- Duleba, S.; Moslem, S. Sustainable Urban Transport Development with Stakeholder Participation, an AHP-Kendall Model: A Case Study for Mersin. Sustainability 2018, 10, 3647. [Google Scholar] [CrossRef]
- Duleba, S. An AHP-ISM approach for considering public preferences in a public transport development decision. Transport 2019, 17, 1–10. [Google Scholar] [CrossRef]
- Farooq, D.; Moslem, S. Evaluation and Ranking of Driver Behavior Factors Related to Road Safety by Applying The Analytic Network Process. Period. Polytech. Transp. Eng. 2019, in press. [Google Scholar]
- Chowdhury, S.; Hadas, Y.; Gonzalez, V.A.; Schot, B. Public transport users’ and policy makers’ perceptions of integrated public transport systems. Transp. Policy 2018, 61, 75–83. [Google Scholar] [CrossRef]
- Kumar, A.; Pal, A.; Vohra, A.; Gupta, S.; Manchanda, S.; Dash, M.K. Construction of Capital Procurement Decision Making Models to Optimize Supplier Selection Using Fuzzy Delphi and AHP-DEMATEL. Benchmarking Int. J. 2018, 25, 1528–1547. [Google Scholar] [CrossRef]
- Feizizadeh, B. A Novel Approach of Fuzzy Dempster–Shafer Theory for Spatial Uncertainty Analysis and Accuracy Assessment of Object-Based Image Classification. IEEE Geosci. Remote Sens. Lett. 2018, 15, 18–22. [Google Scholar] [CrossRef]
- Abastante, F.; Corrente, S.; Greco, S.; Ishizaka, A.; Lami, I.M. Choice architecture for architecture choices: Evaluating social housing initiatives putting together a parsimonious AHP methodology and the Choquet integral. Land Use Policy 2018, 78, 748–762. [Google Scholar] [CrossRef]
- Haghighathoseini, A.; Bobarshad, H.; Saghafi, F.; Rezaei, M.S.; Bagherzadeh, N. Hospital enterprise Architecture Framework (Study of Iranian University Hospital Organization). Int. J. Med. Inform. 2018, 114, 88–100. [Google Scholar] [CrossRef] [PubMed]
- Gupta, V. Comparative performance of contradictory and non-contradictory judgement matrices in AHP under qualitative and quantitative metrics. Int. J. Decis. Support Syst. Technol. (IJDSST) 2018, 10, 21–38. [Google Scholar] [CrossRef]
- Tan, R.R.; Aviso, K.B.; Huelgas, A.P.; Promentilla, M.A.B. Fuzzy AHP approach to selection problems in process engineering involving quantitative and qualitative aspects. Process Saf. Environ. Prot. 2014, 92, 467–475. [Google Scholar] [CrossRef]
- Saaty, T.L. Transport planning with multiple criteria: The analytic hierarchy process applications and progress review. J. Adv. Transp. 1995, 29, 81–126. [Google Scholar] [CrossRef]
- Triantaphyllou, E.; Mann, S.H. Using the analytic hierarchy process for decision making in engineering applications: Some challenges. Int. J. Ind. Eng. Appl. Pract. 1995, 2, 35–44. [Google Scholar]
- Bandler, W.; Kohout, L. Fuzzy power sets and fuzzy implication operators. Fuzzy Sets Syst. 1980, 4, 13–30. [Google Scholar] [CrossRef]
- Turner Ii, B.L. Response to Thrift’s “The future of geography”. Geoforum 2002, 33, 427–429. [Google Scholar] [CrossRef]
- Zadeh, L.A. Fuzzy sets. Inf. Control 1965, 8, 338–353. [Google Scholar] [CrossRef]
- Balezentiene, L.; Streimikiene, D.; Balezentis, T. Fuzzy decision support methodology for sustainable energy crop selection. Renew. Sustain. Energy Rev. 2013, 17, 83–93. [Google Scholar] [CrossRef]
- Bui, K.T.; Bui, D.T.; Zou, J.; Van Doan, C.; Revhaug, I. A novel hybrid artificial intelligent approach based on neural fuzzy inference model and particle swarm optimization for horizontal displacement modeling of hydropower dam. Neural Comput. Appl. 2018, 29, 1495–1506. [Google Scholar] [CrossRef]
- Feizizadeh, B.; Blaschke, T.; Roodposhti, M.S. Integrating GIS Based Fuzzy Set Theory in Multicriteria Evaluation Methods for Landslide Susceptibility Mapping. Int. J. GeoInform. 2013, 9, 49–57. [Google Scholar]
- Ghorbanzadeh, O.; Feizizadeh, B.; Blaschke, T. An interval matrix method used to optimize the decision matrix in AHP technique for land subsidence susceptibility mapping. Environ. Earth Sci. 2018, 77, 584. [Google Scholar] [CrossRef]
- Vidal, L.-A.; Marle, F.; Bocquet, J.-C. Using a Delphi process and the analytic hierarchy process (AHP) to evaluate the complexity of projects. Expert Syst. Appl. 2011, 38, 5388–5405. [Google Scholar] [CrossRef]
- Lehner, A.; Erlacher, C.; Schlögl, M.; Wegerer, J.; Blaschke, T.; Steinnocher, K. Can iso-defined urban sustainability indicators be derived from remote sensing: An expert weighting approach. Sustainability 2018, 10, 1268. [Google Scholar] [CrossRef]
- Fu, S.; Yan, X.; Zhang, D.; Zhang, M. Risk influencing factors analysis of arctic maritime transportation systems: A Chinese perspective. Marit. Policy Manag. 2018, 45, 439–455. [Google Scholar] [CrossRef]
- Liu, F. Acceptable consistency analysis of interval reciprocal comparison matrices. Fuzzy Sets Syst. 2009, 160, 2686–2700. [Google Scholar] [CrossRef]
- Kendall, M.G.; Smith, B.B. The problem of m rankings. Ann. Math. Stat. 1939, 10, 275–287. [Google Scholar] [CrossRef]
- Siegel, S. Nonparametric Statistics for the Behavioral Sciences; McGraw-Hill: New York, NY, USA, 1956. [Google Scholar]
- Saaty, T.L. A scaling method for priorities in hierarchical structures. J. Math. Psychol. 1977, 15, 234–281. [Google Scholar] [CrossRef]
- Solomon, M. Groupthink versus “The wisdom of crowds”: The social epistemology of deliberation and dissent. South. J. Philos. 2006, 44, 28–42. [Google Scholar] [CrossRef]
- Macharis, C.; De Witte, A.; Ampe, J. The Multi-Actor, Multi-Criteria Analysis Methodology (MAMCA) for the evaluation of transport projects: Theory and practice. J. Adv. Transp. 2008, 43, 183–202. [Google Scholar] [CrossRef]
© 2019 by the authors. Licensee MDPI, Basel, Switzerland. This article is an open access article distributed under the terms and conditions of the Creative Commons Attribution (CC BY) license (http://creativecommons.org/licenses/by/4.0/).