Compound Droughts and Heat Waves in China


Abstract
1. Introduction
2. Material and Methodology
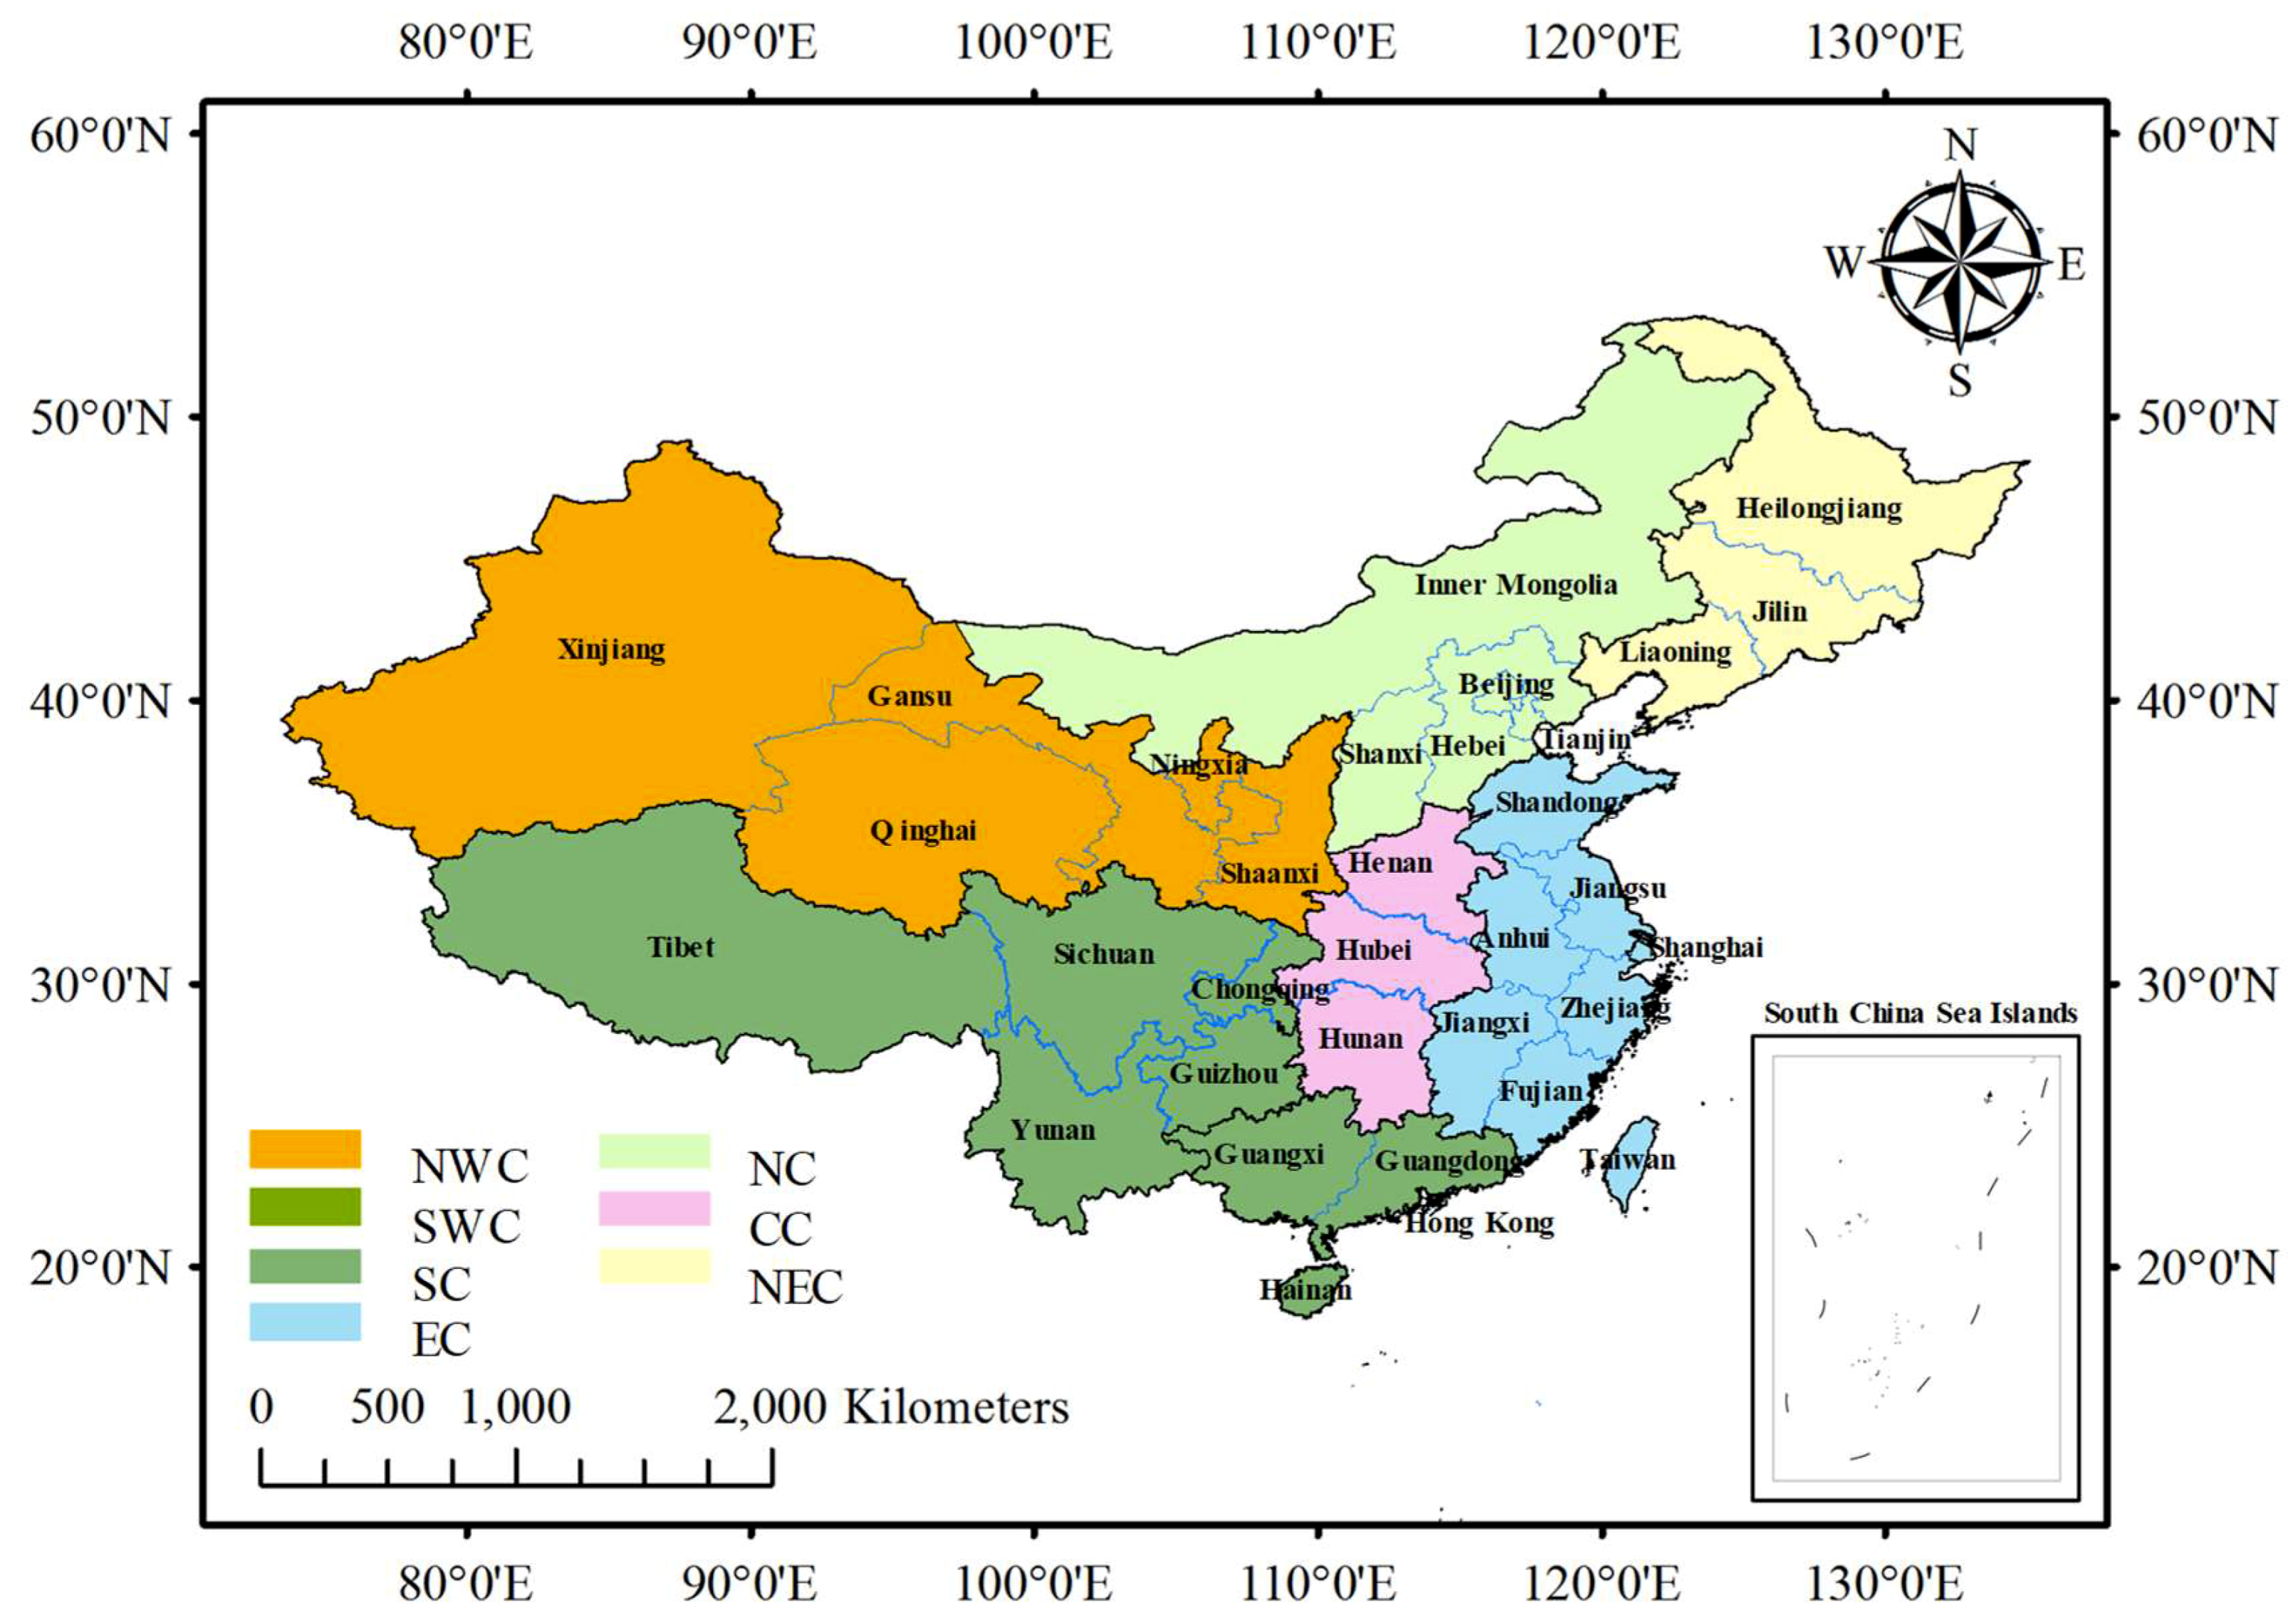
2.1. Study Area and Data Sources
2.2. Evaluation of Heat Waves
2.3. Analysis of Compound Droughts and Heat Waves
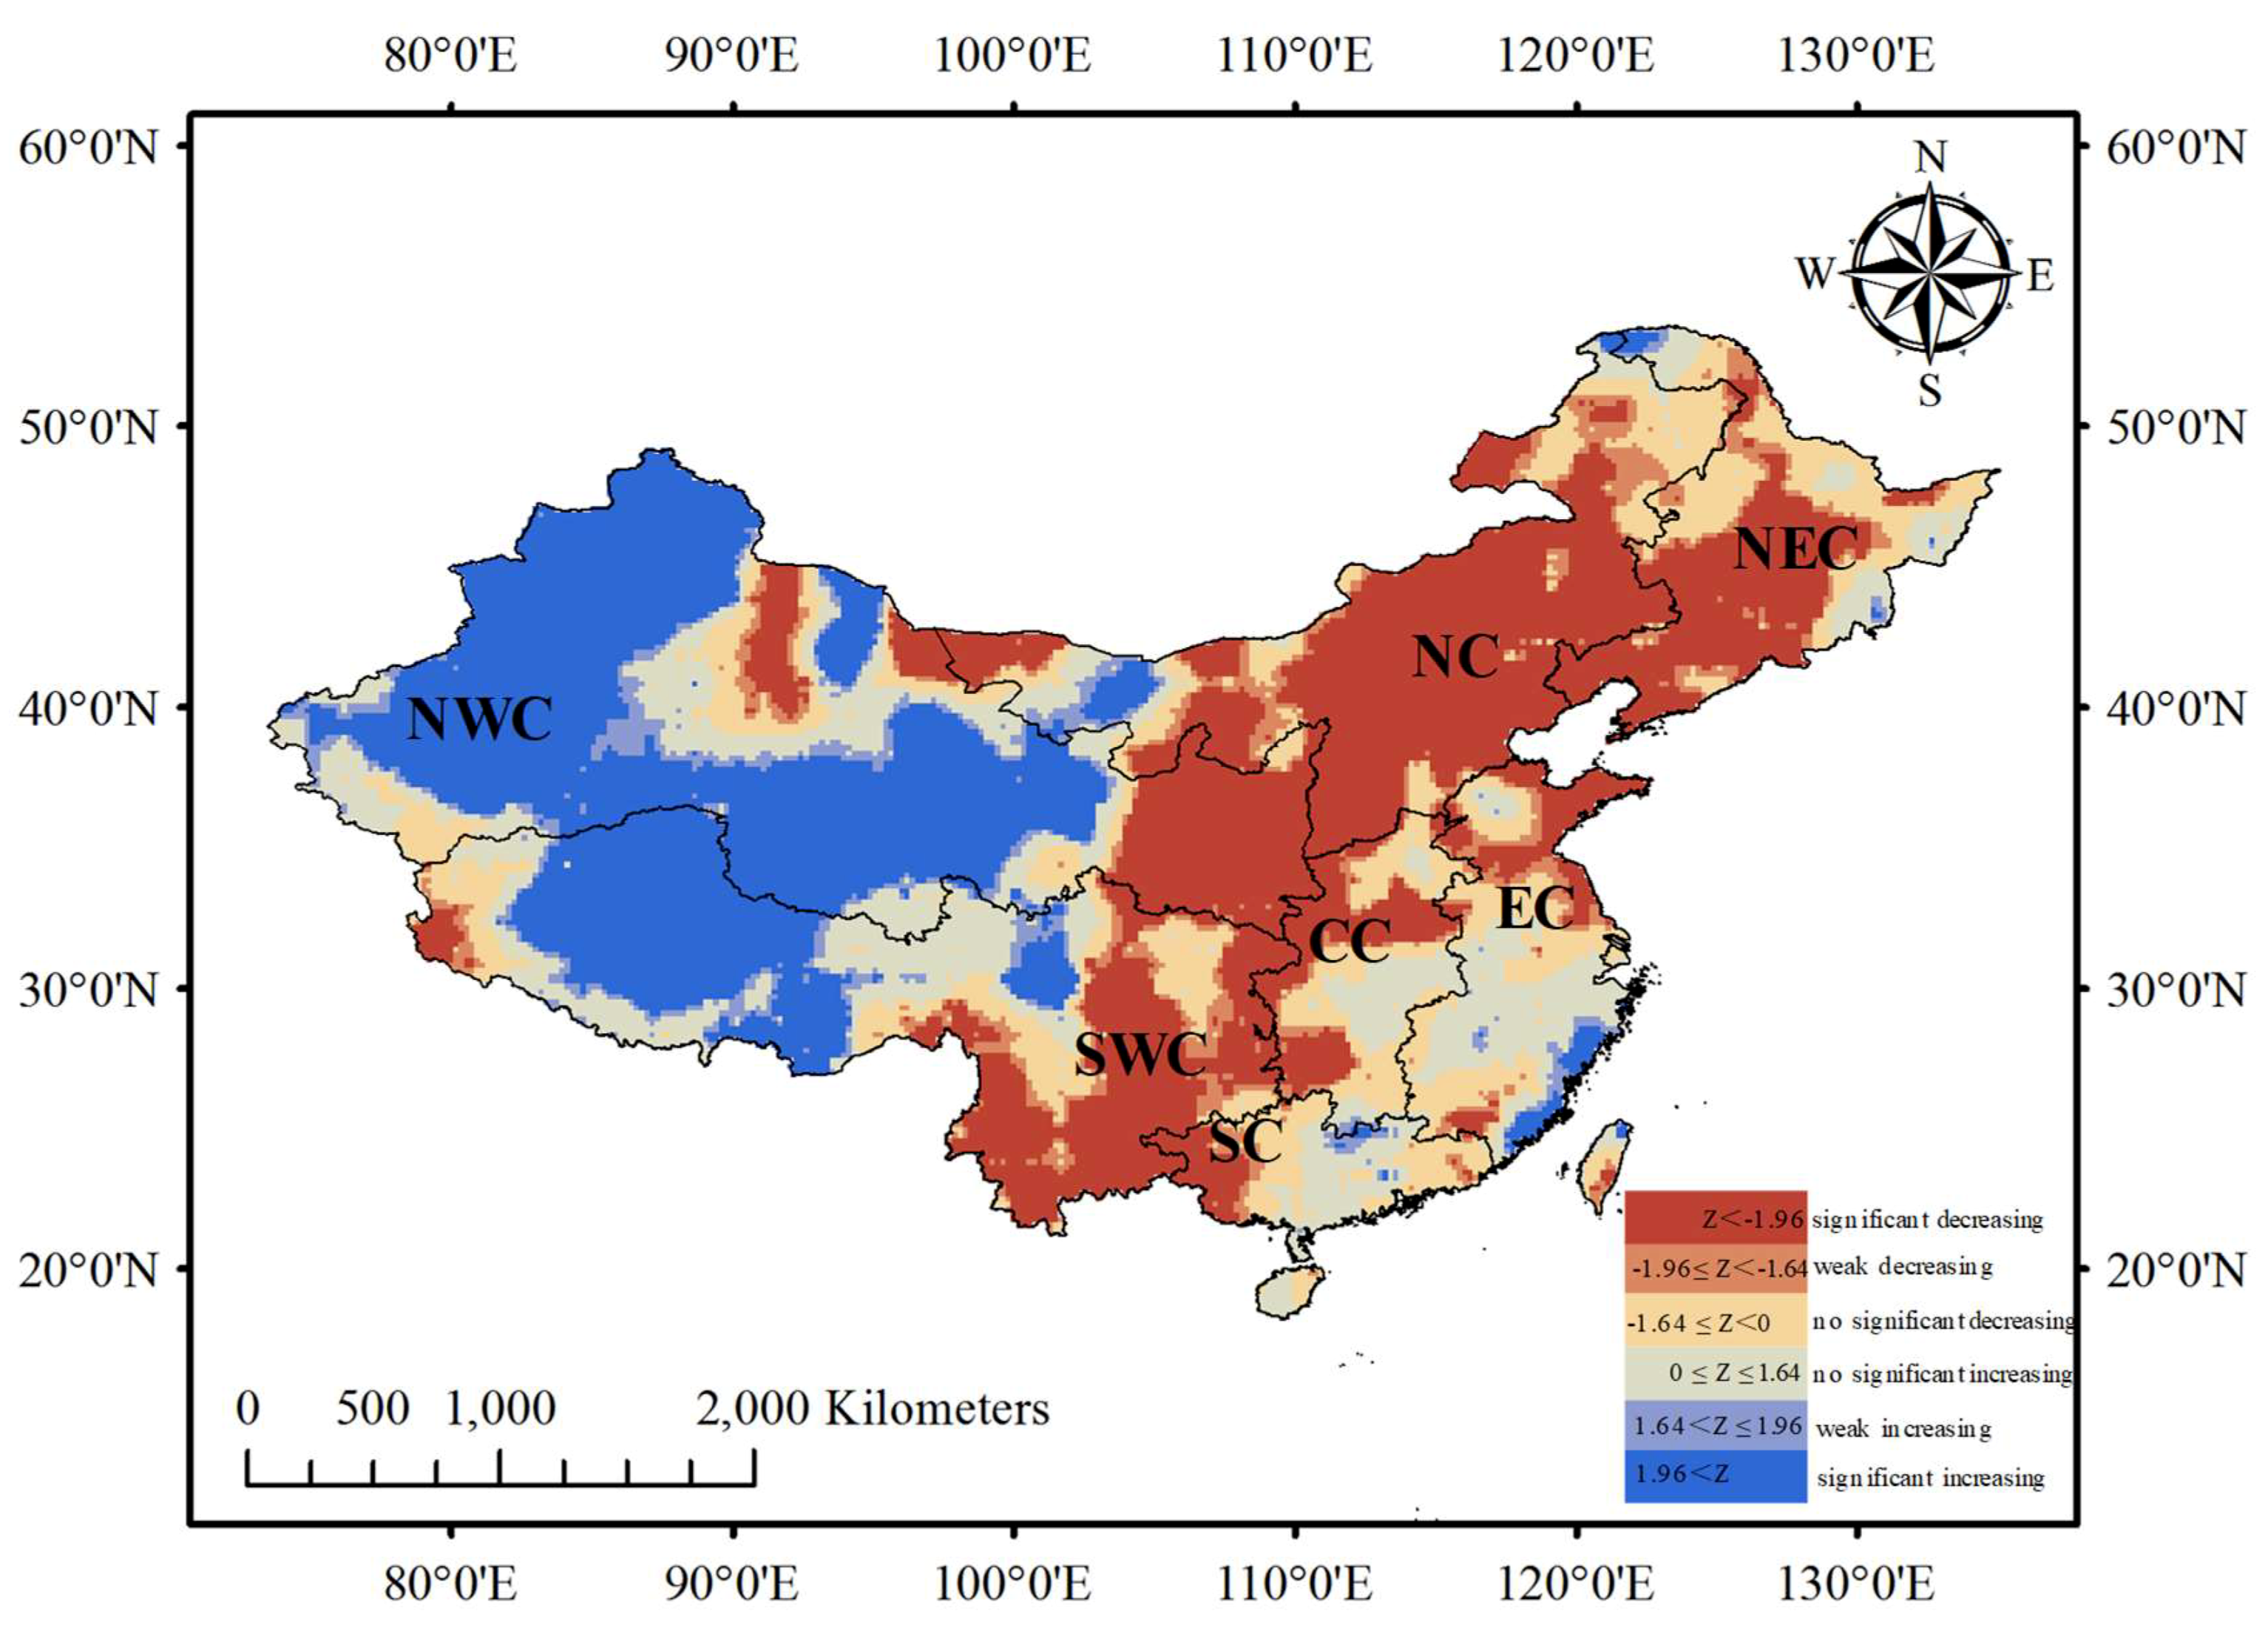
2.4. Trend Free Prewhitening Mann–Kendall Nonparametric Test
3. Results
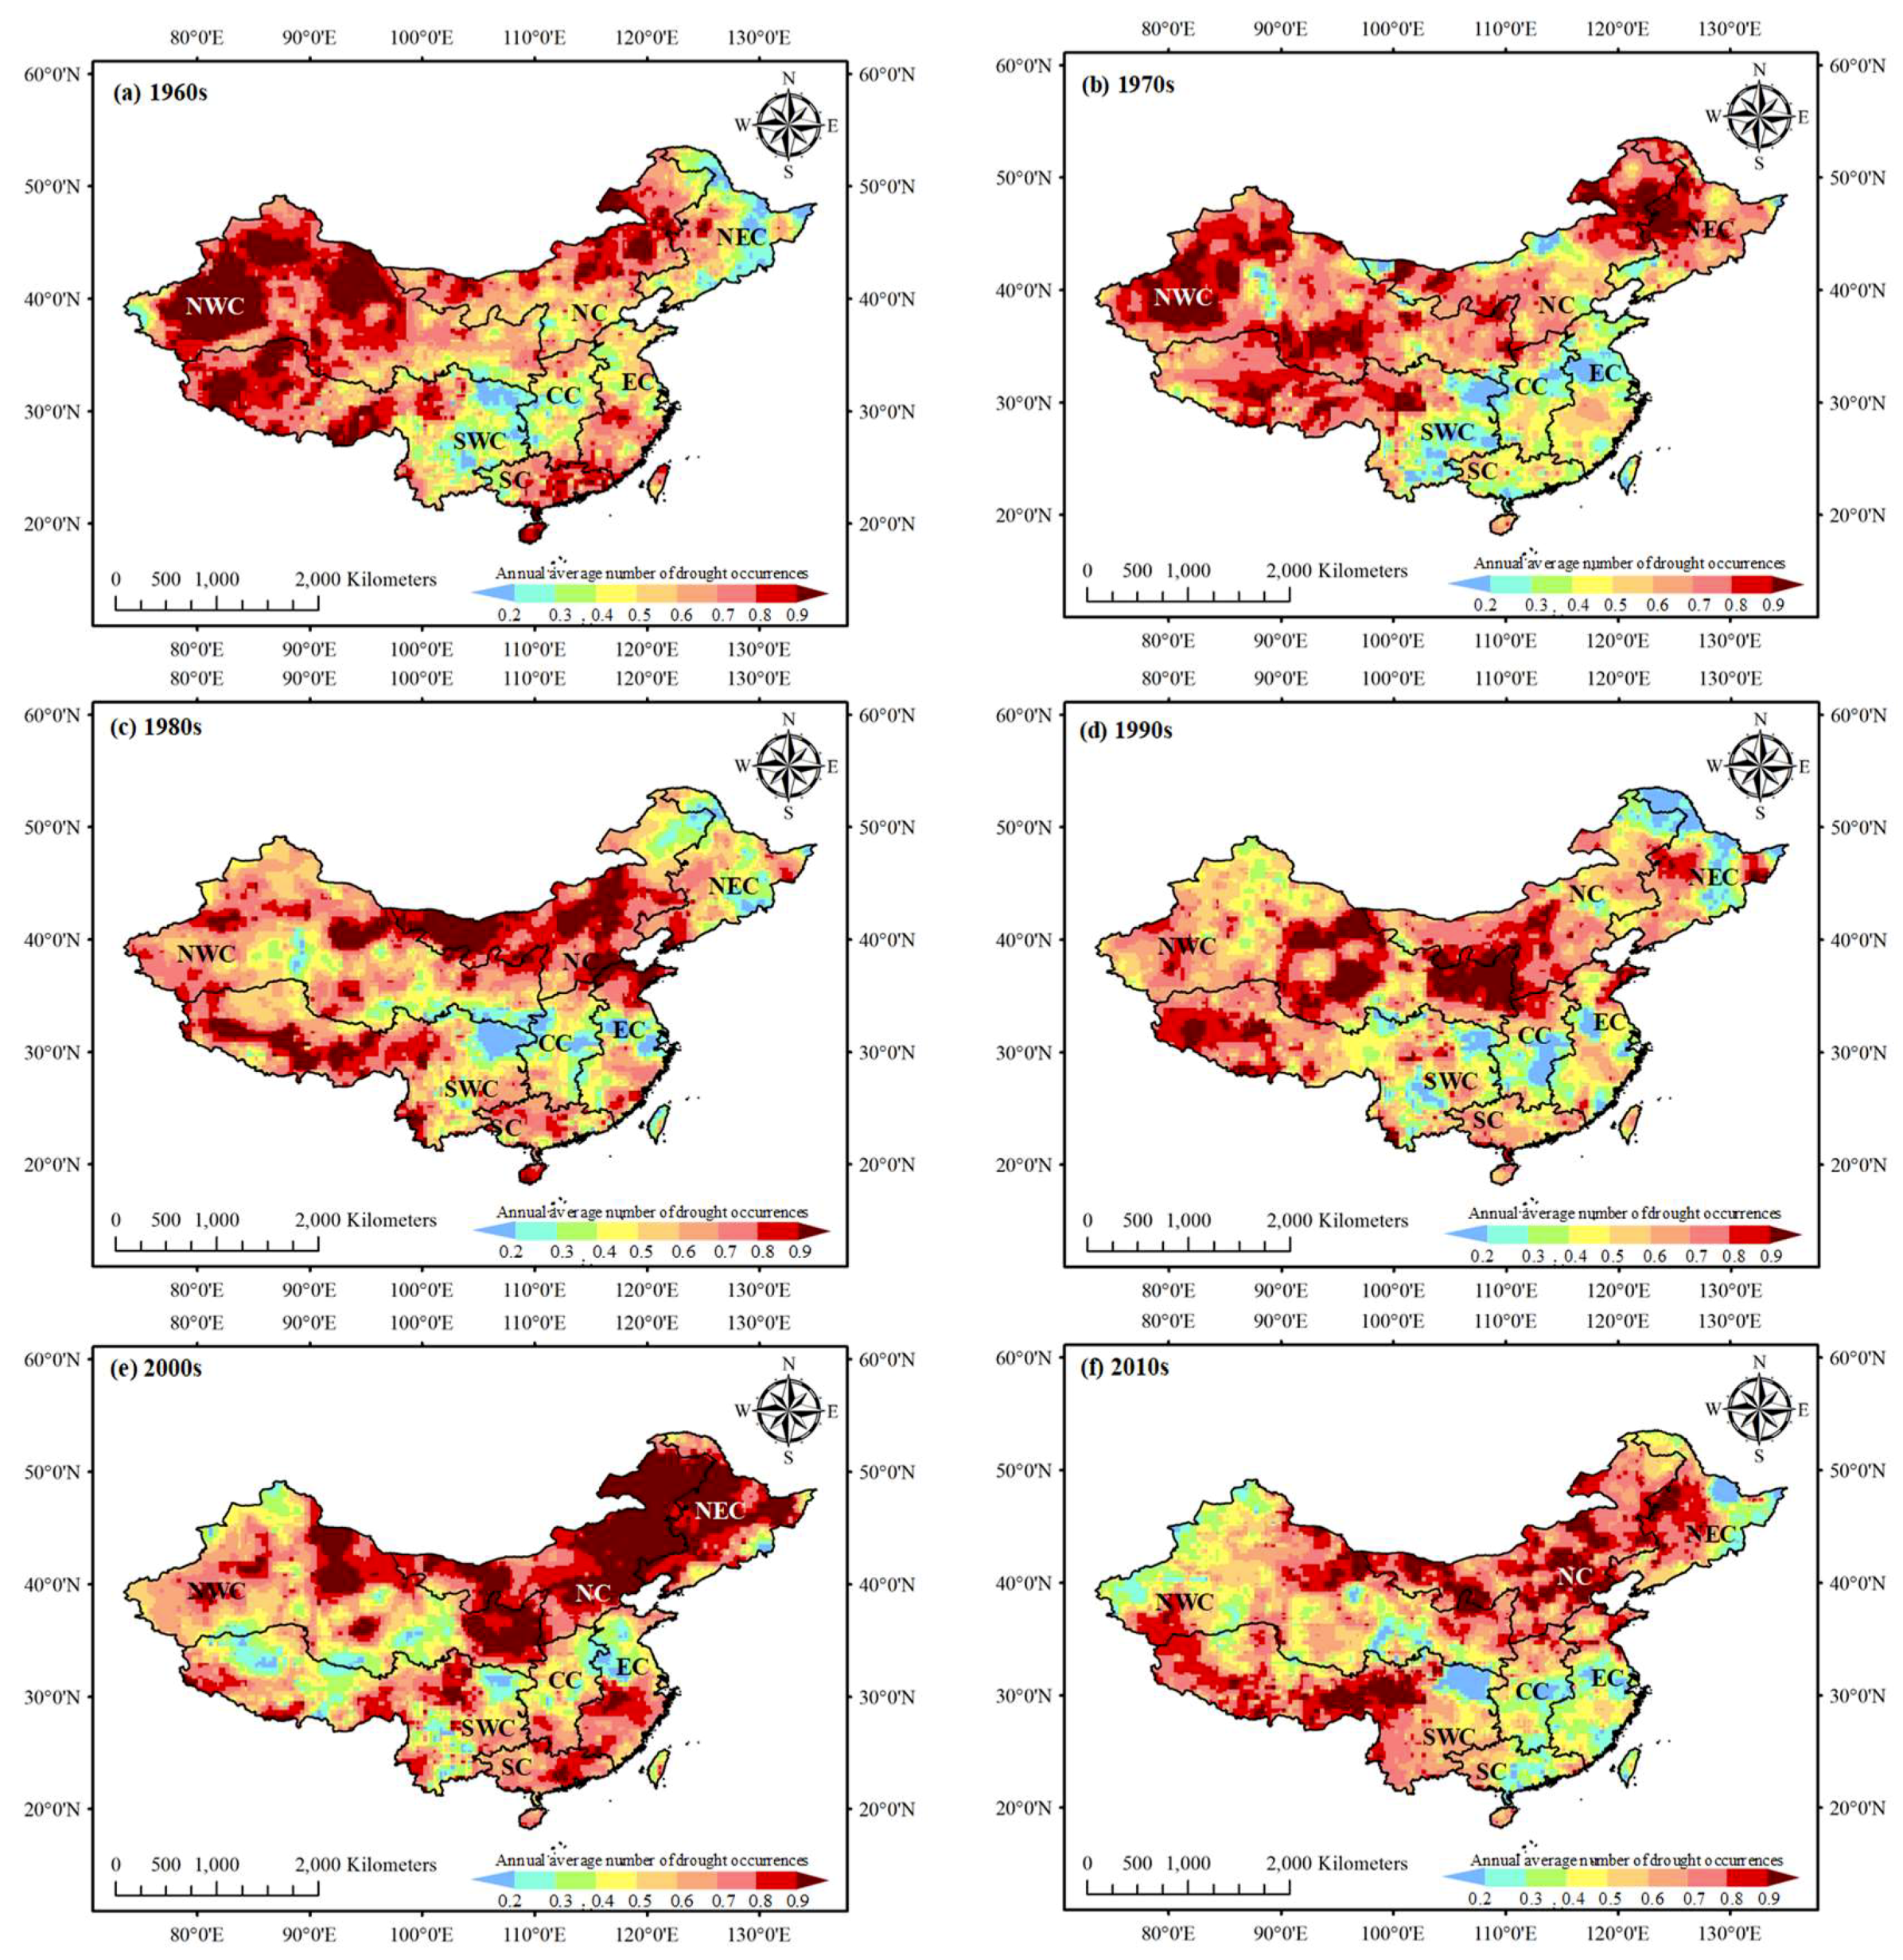
3.1. Droughts
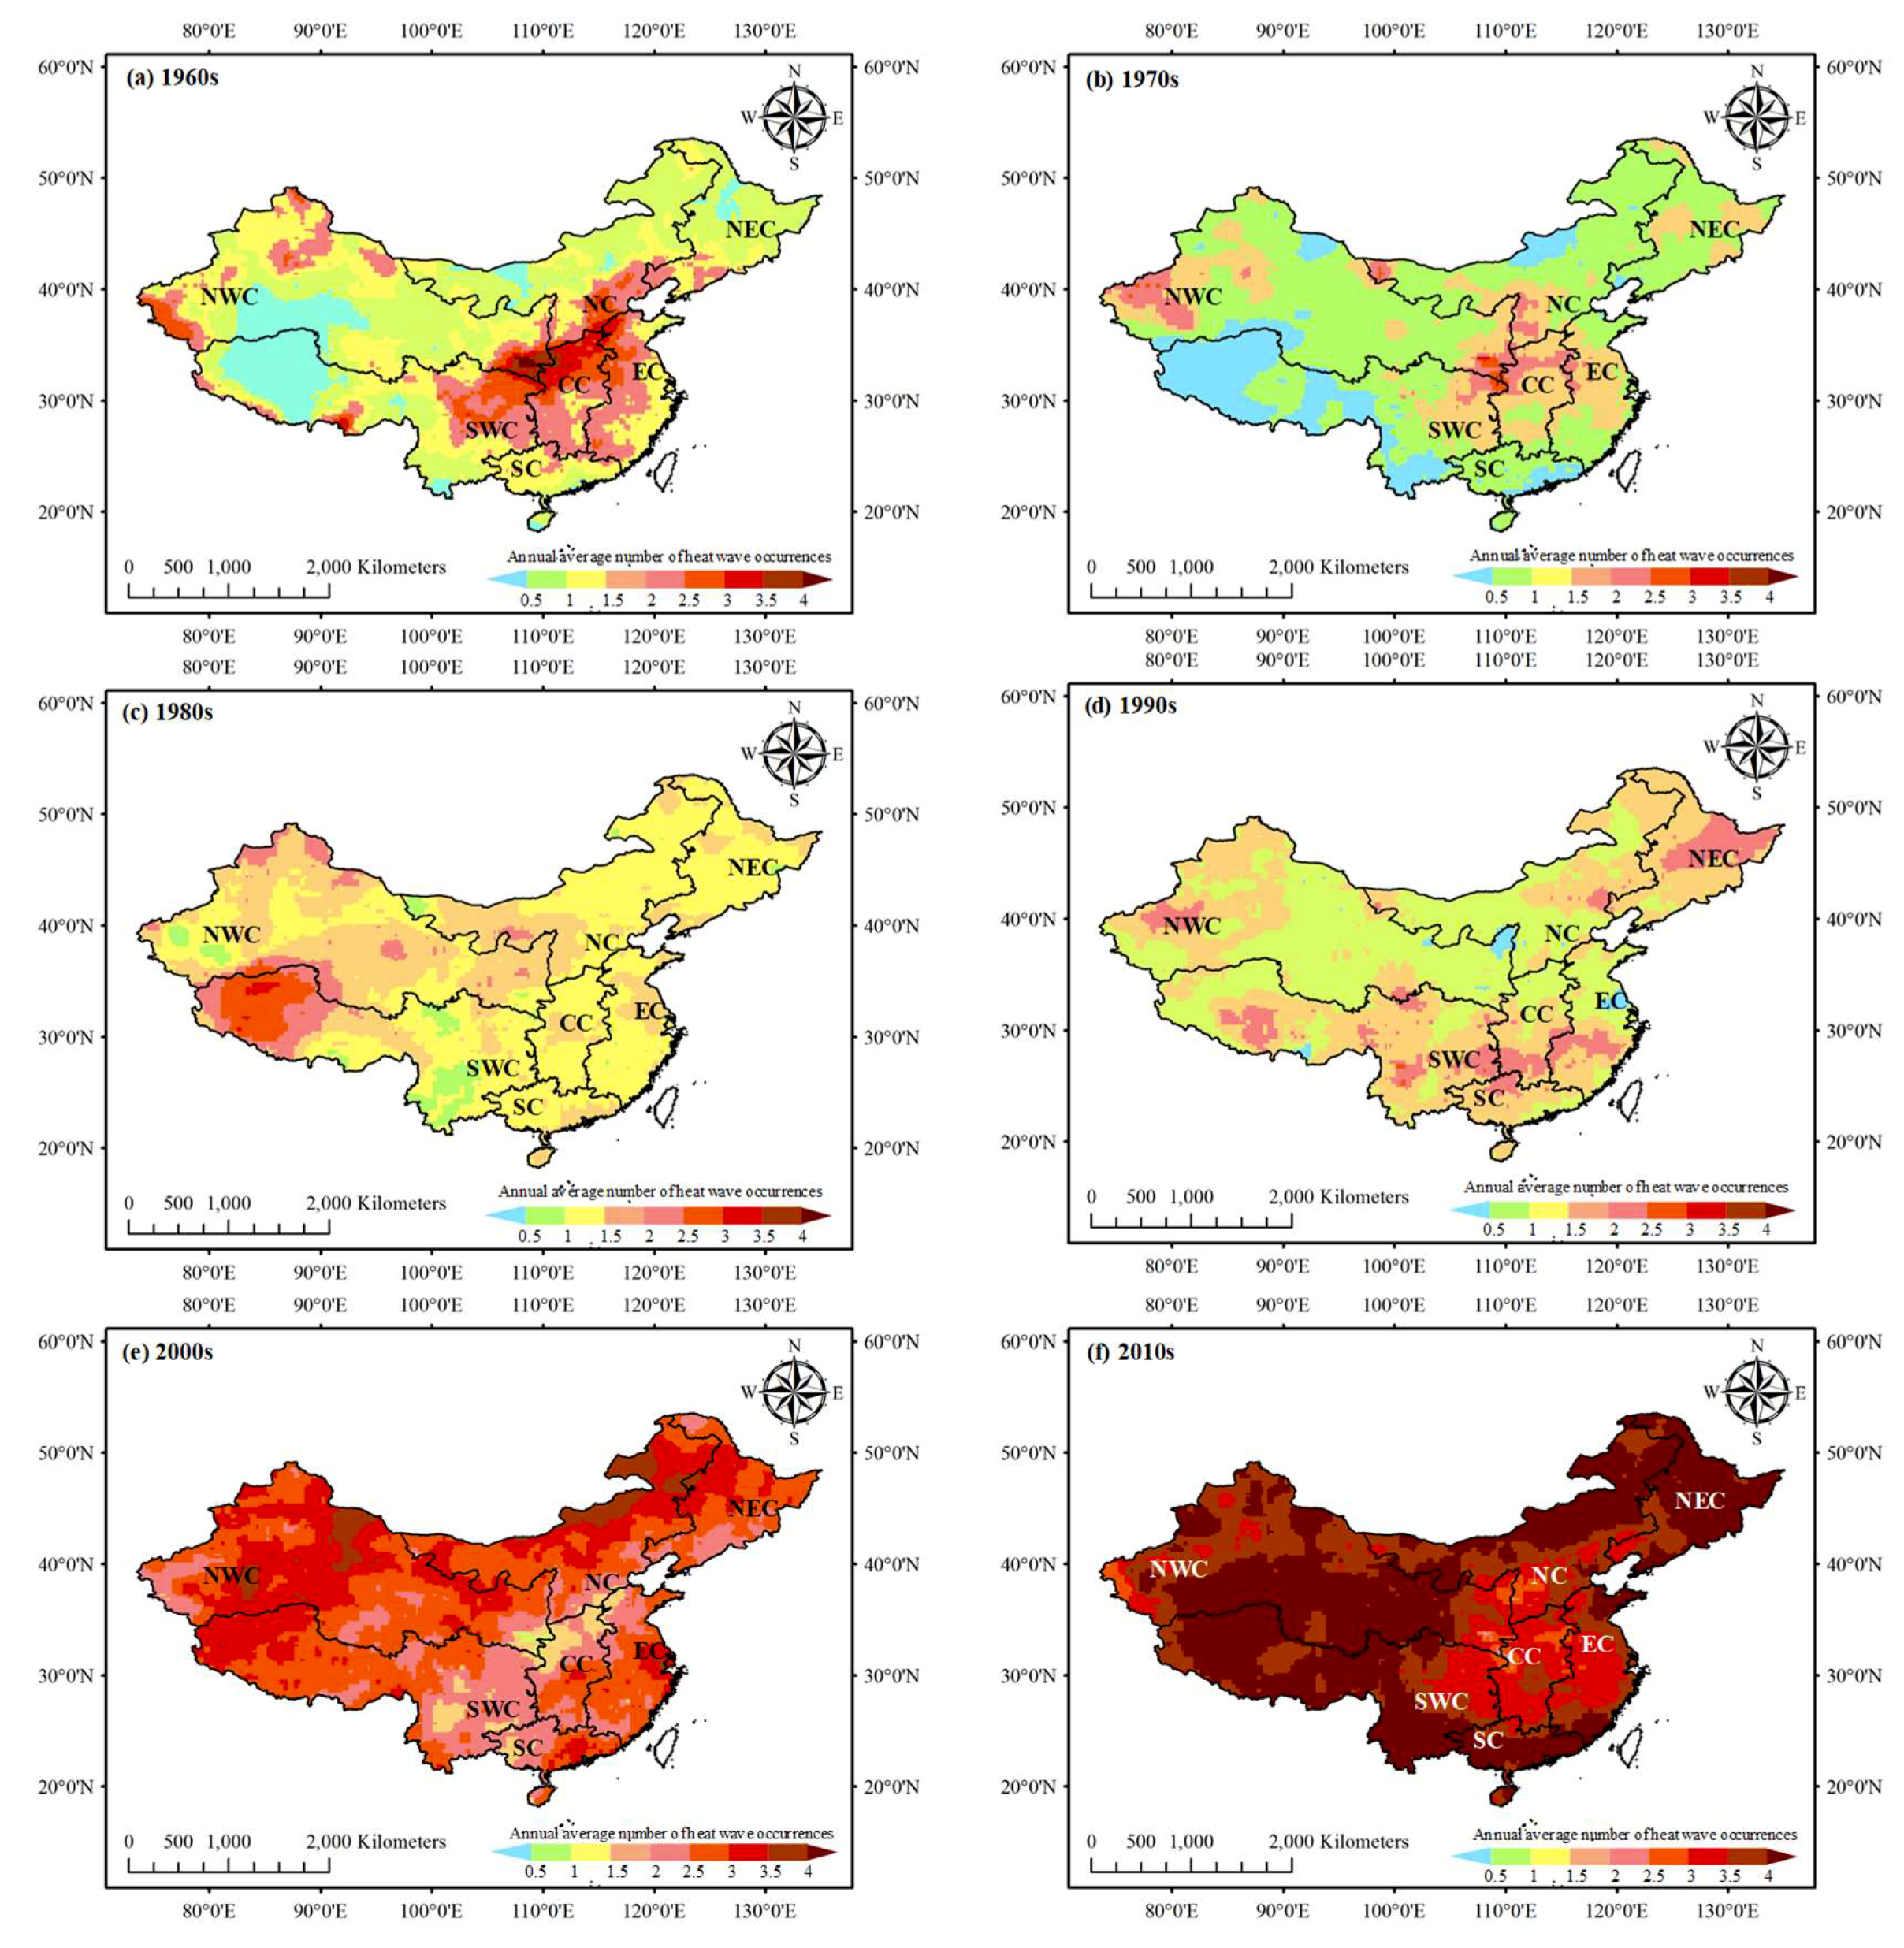
3.2. Heat Waves
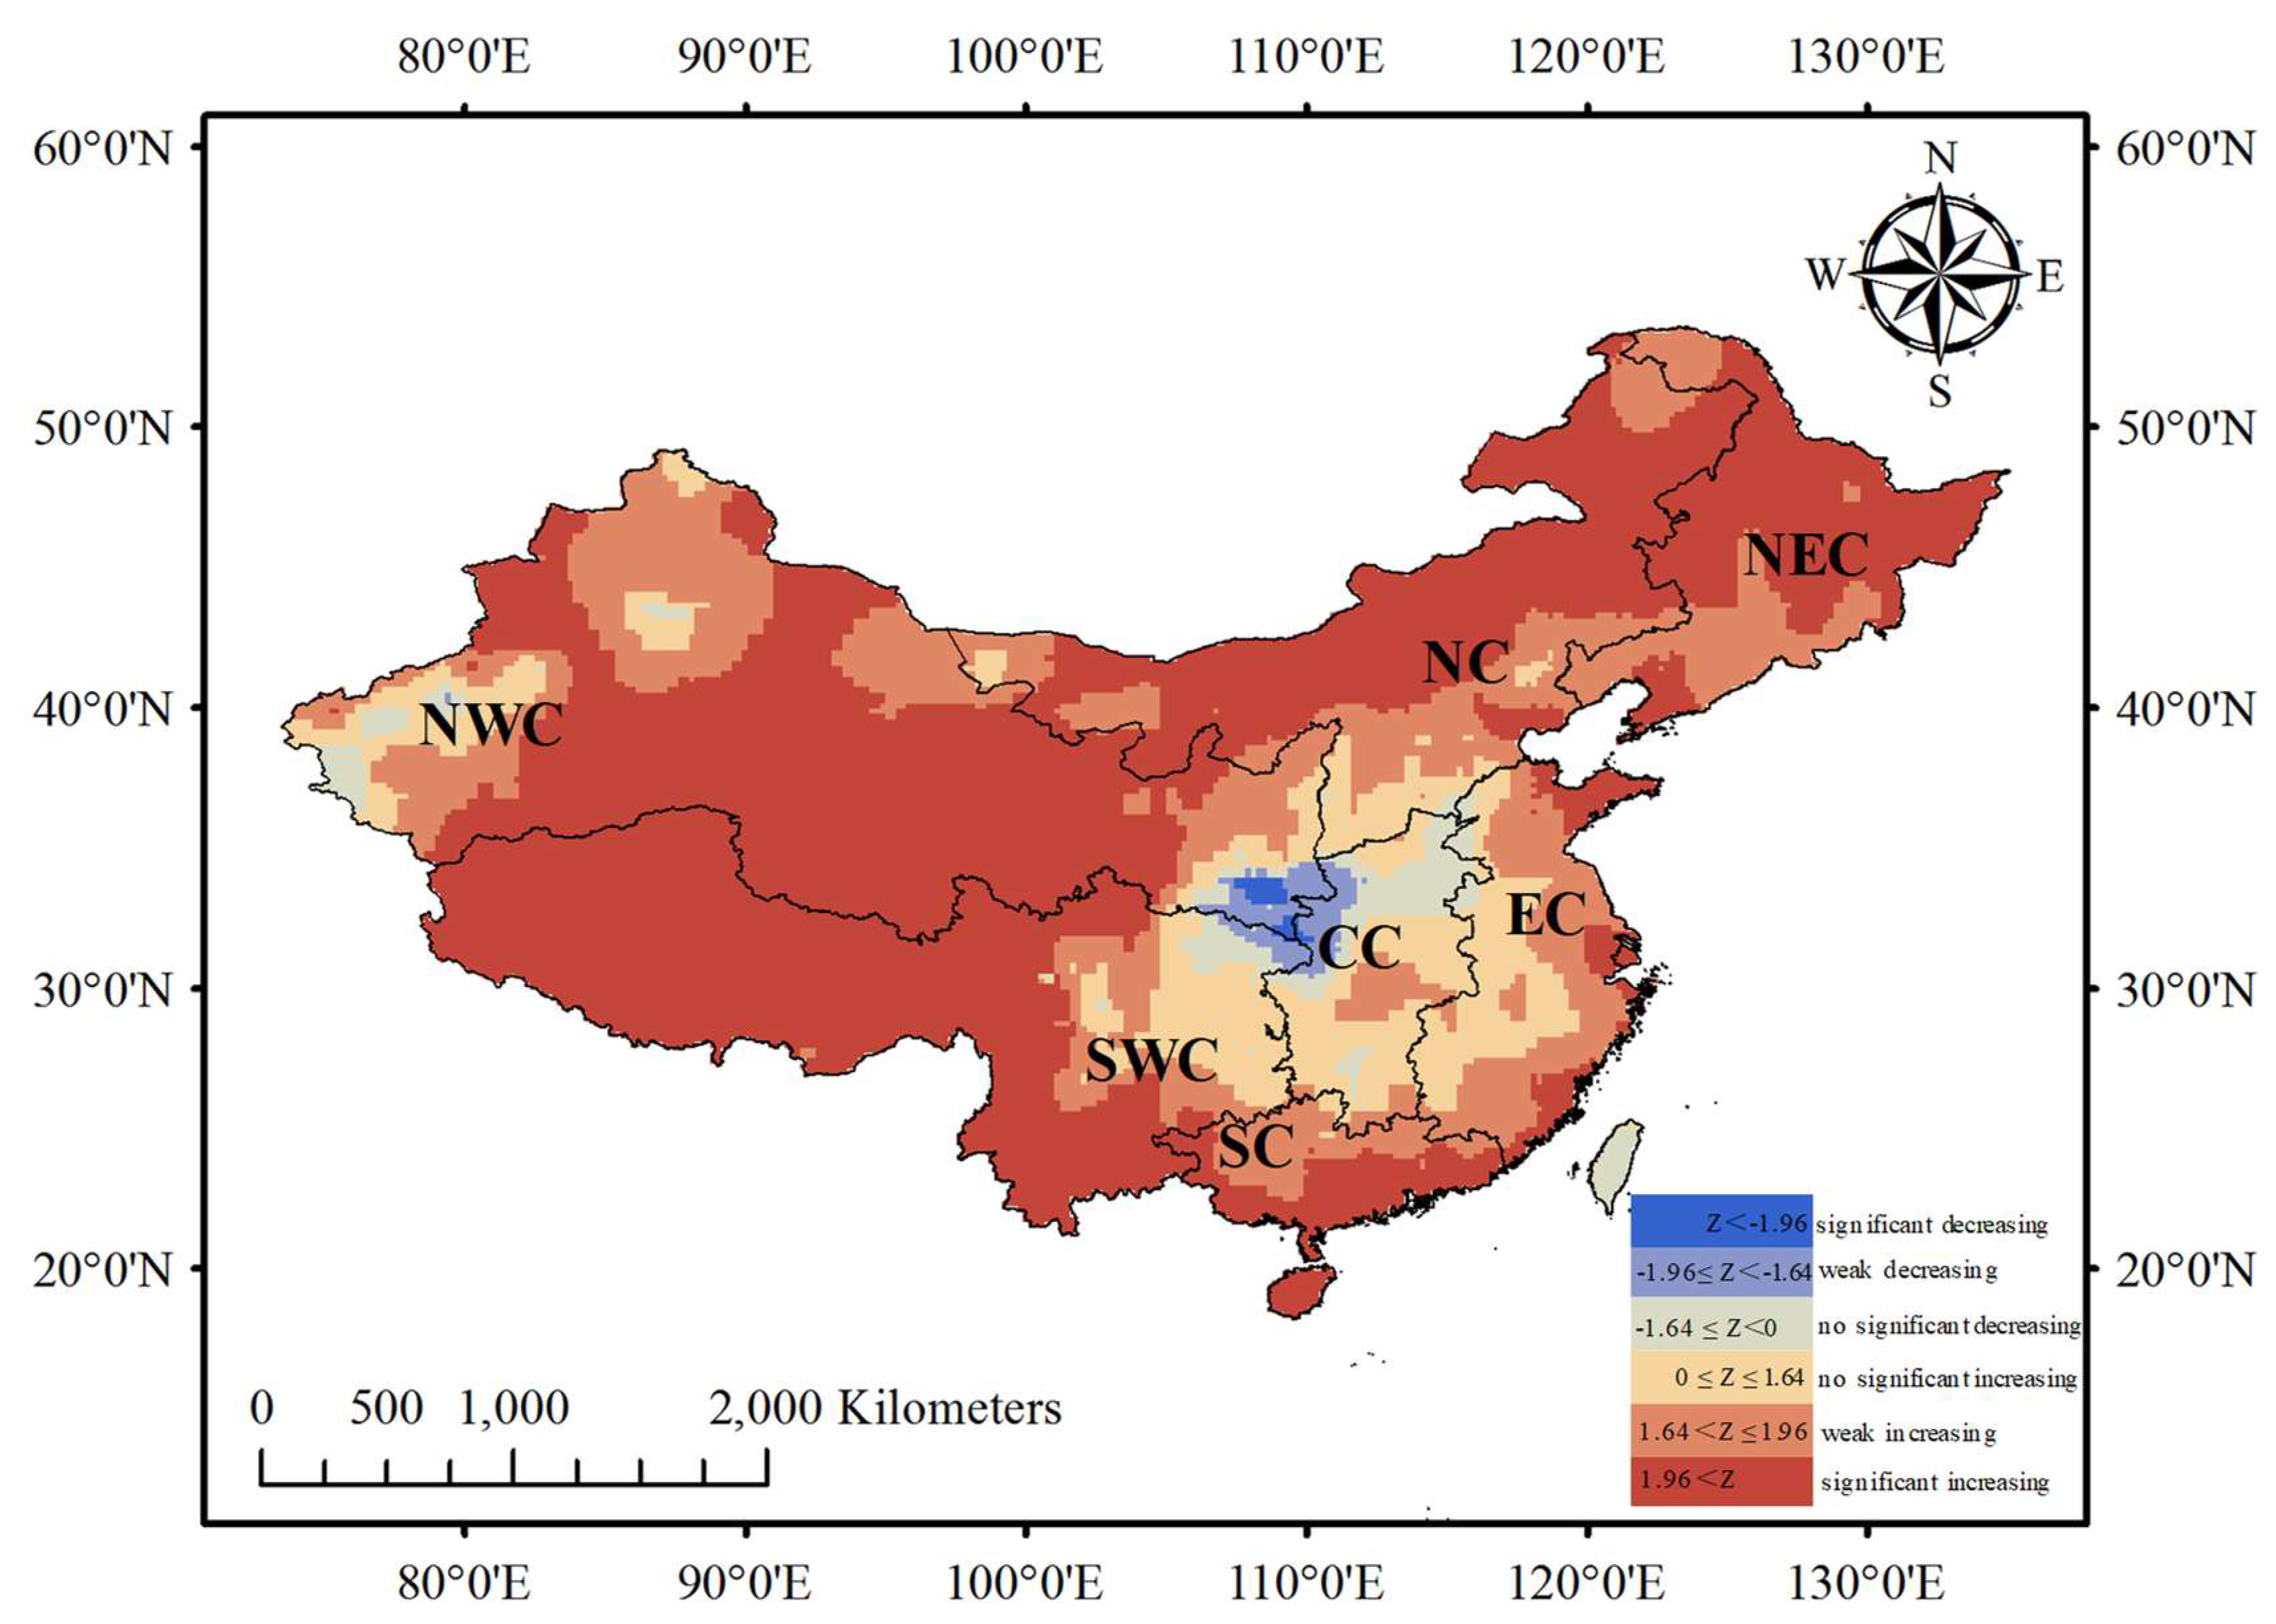
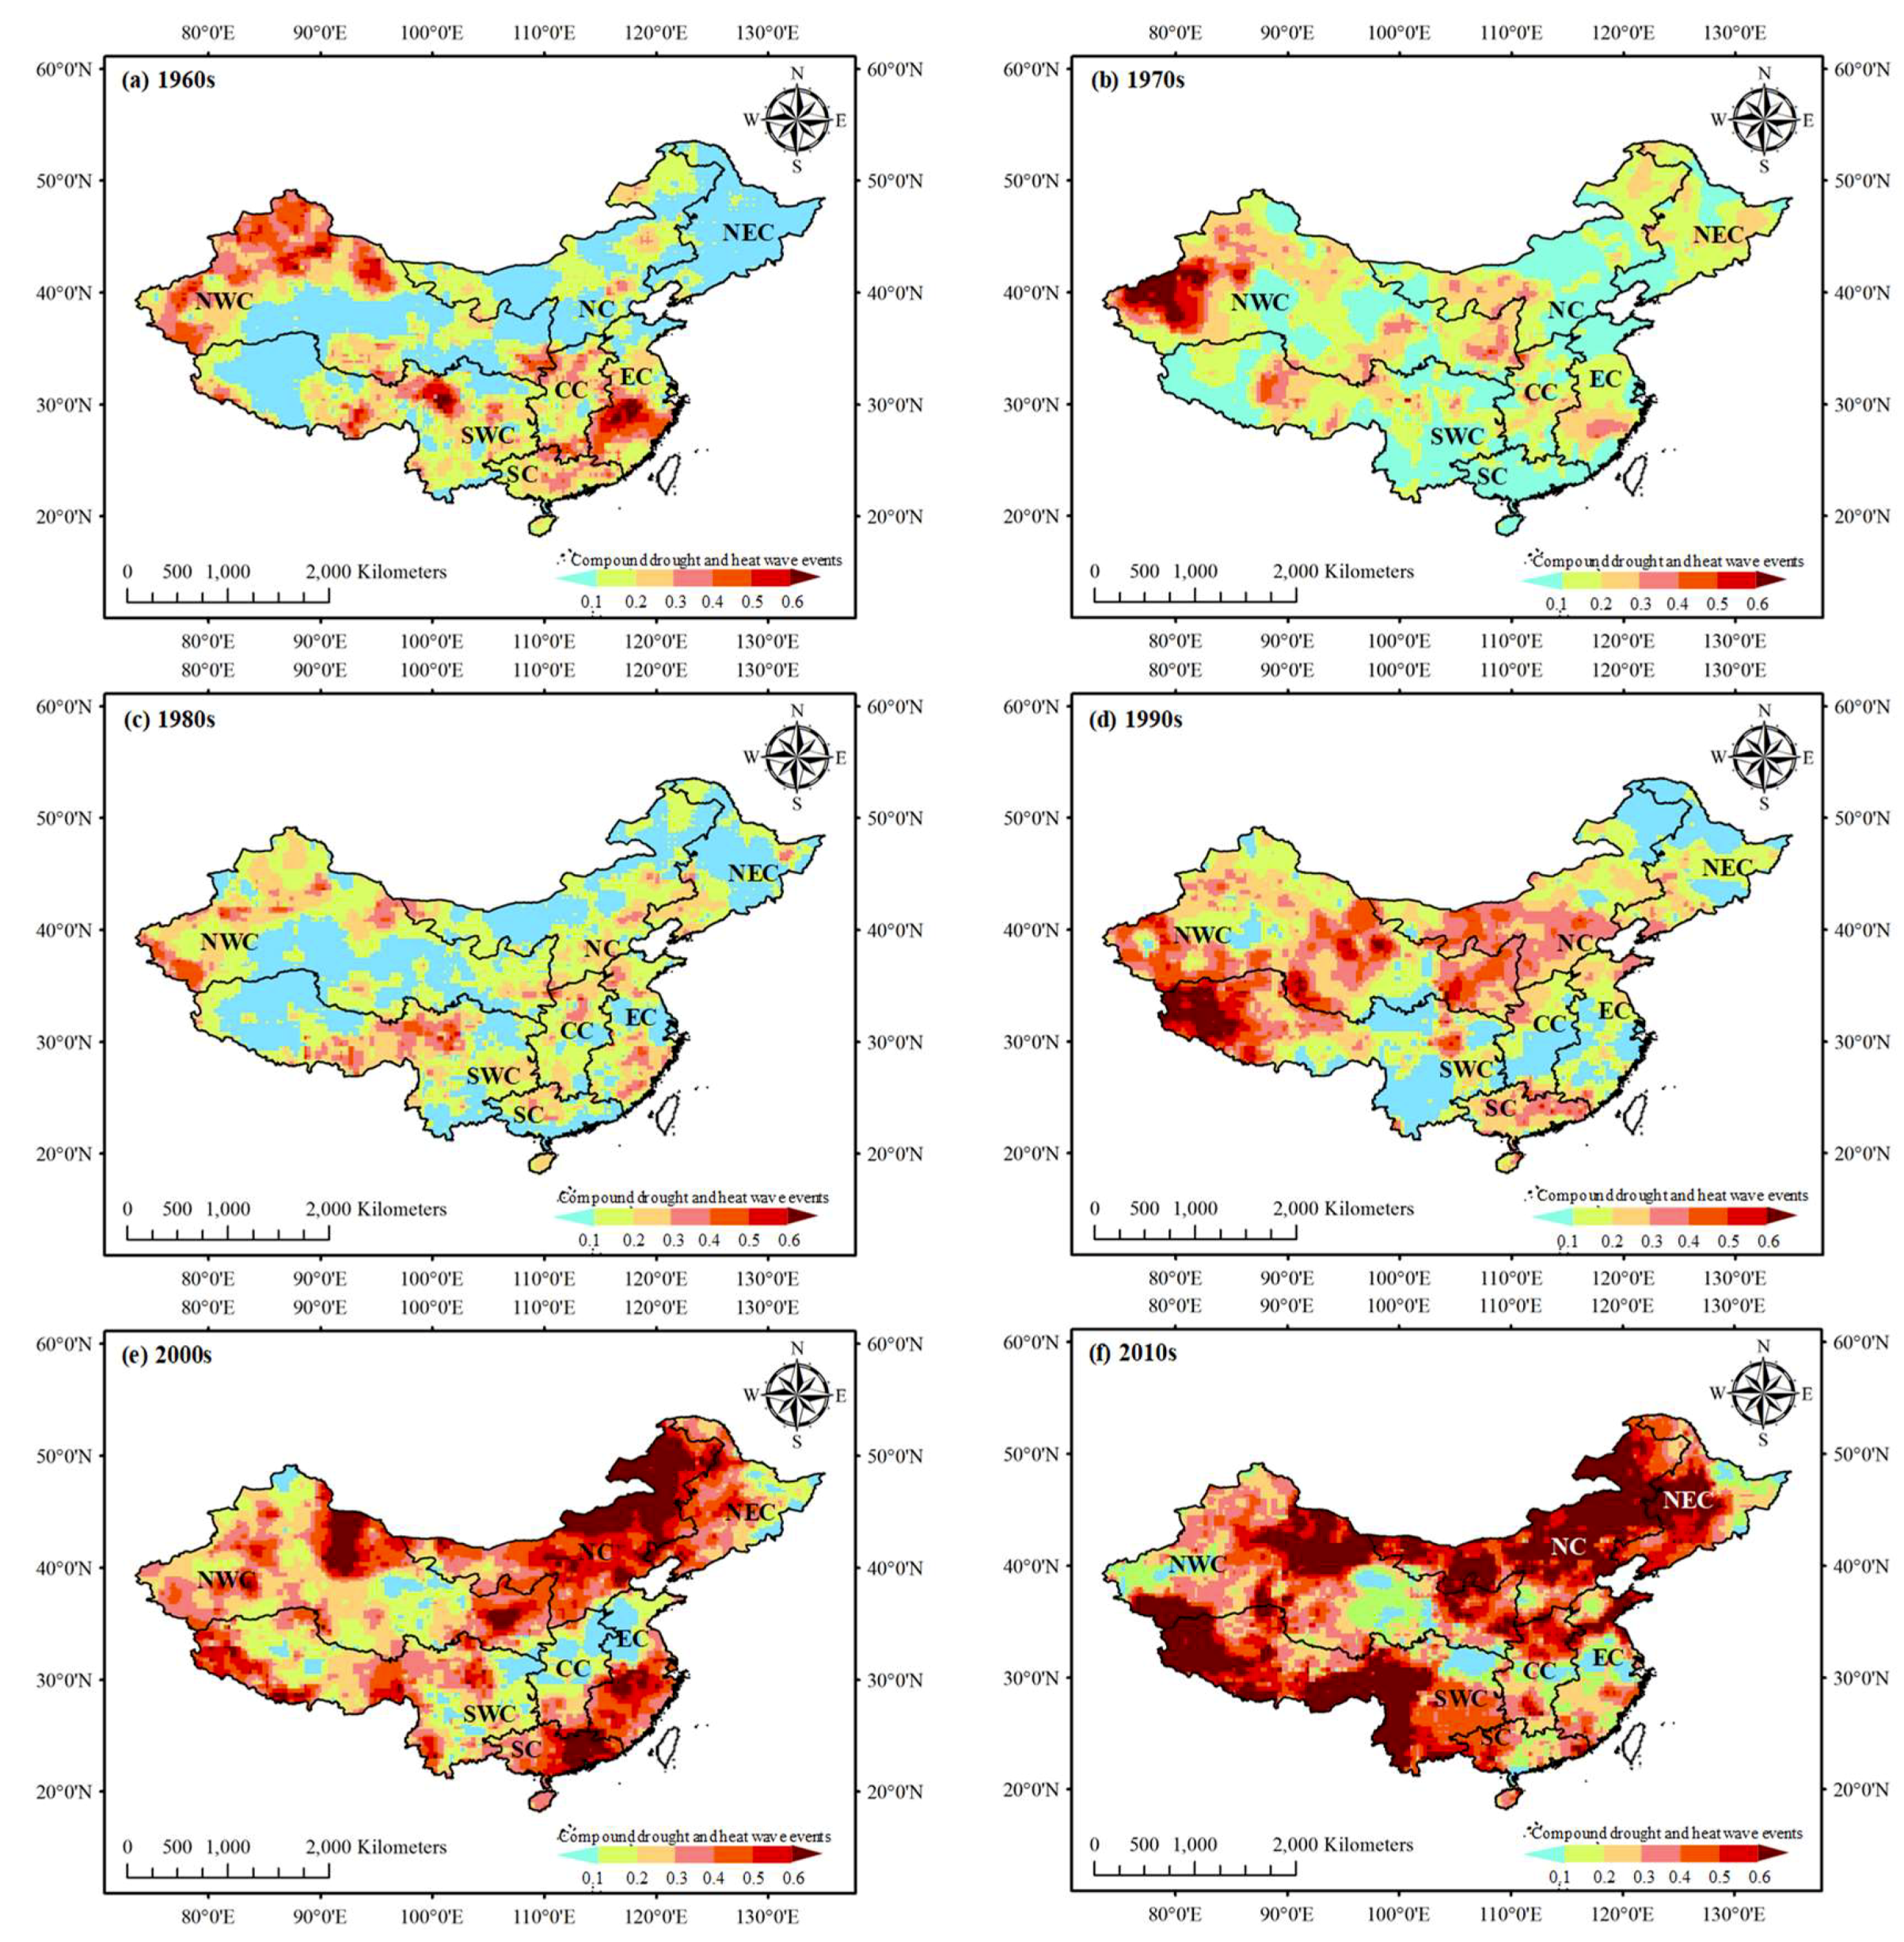
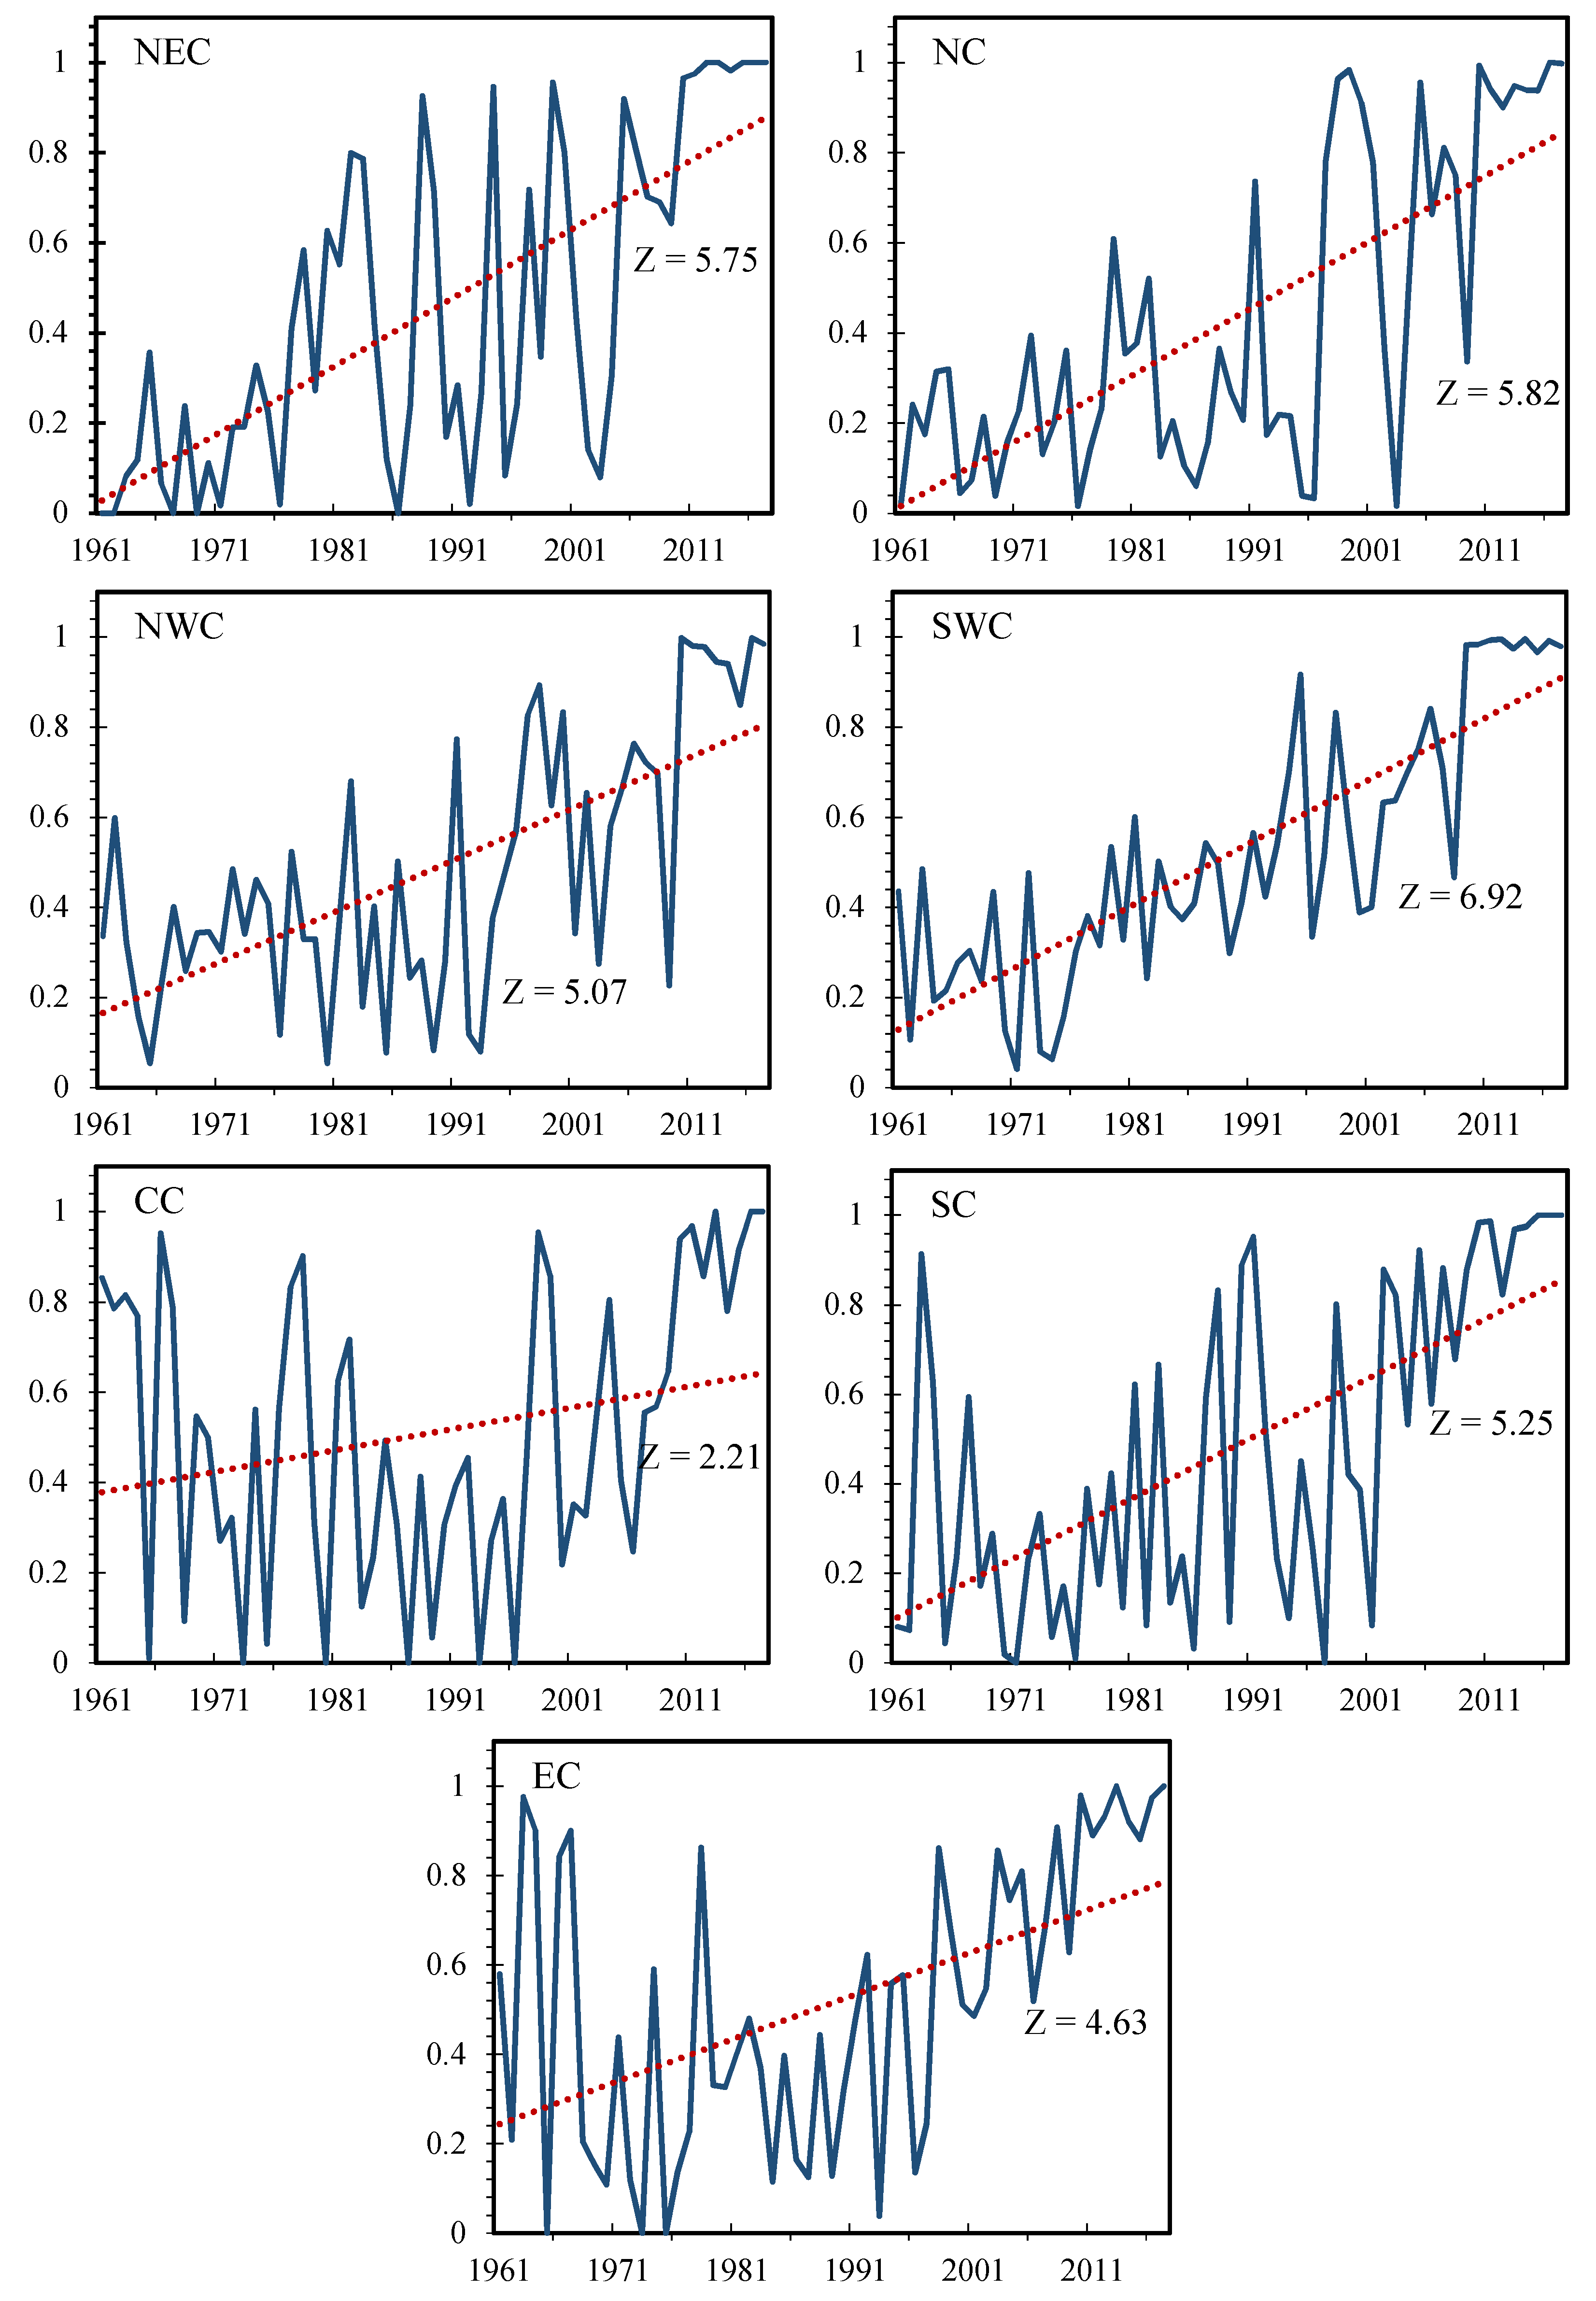
3.3. Compound Drought and Heat Wave Events
4. Discussion
5. Summary and Conclusions
Author Contributions
Funding
Acknowledgments
Conflicts of Interest
References
- Seneviratne, S.I.; Nicholls, N.; Easterling, D.; Goodess, C.M.; Kanae, S.; Kossin, J.; Luo, Y.; Marengo, J.; McInnes, K.; Rahimi, M. Managing the Risks of Extreme Events and Disasters to Advance Climate Change Adaptation: Special Report of the Intergovernmental Panel on Climate Change; Cambridge University Press: Cambridge, NY, USA, 2012. [Google Scholar]
- Mishra, A.K.; Singh, V.P. Changes in extreme precipitation in Texas. J. Geophys. Res. Atmos. 2010, 115. [Google Scholar] [CrossRef]
- Horton, R.M.; Mankin, J.S.; Lesk, C.; Coffel, E.; Raymond, C. A review of recent advances in research on extreme heat events. Curr. Clim. Chang. Rep. 2016, 2, 242–259. [Google Scholar] [CrossRef]
- Alfieri, L.; Bisselink, B.; Dottori, F.; Naumann, G.; de Roo, A.; Salamon, P.; Wyser, K.; Feyen, L. Global projections of river flood risk in a warmer world. Earths Future 2017, 5, 171–182. [Google Scholar] [CrossRef]
- Dosio, A.; Mentaschi, L.; Fischer, E.M.; Wyser, K. Extreme heat waves under 1.5 °C and 2 °C global warming. Environ. Res. Lett. 2018, 13, 054006. [Google Scholar] [CrossRef]
- Slootweg, R.; Jones, M. Resilience thinking improves SEA: A discussion paper. Impact Assess. Proj. Apprais. 2011, 29, 263–276. [Google Scholar]
- Szewrański, S.; Świąder, M.; Kazak, J.K.; Tokarczyk-Dorociak, K.; van Hoof, J. Socio-Environmental Vulnerability Mapping for Environmental and Flood Resilience Assessment: The Case of Ageing and Poverty in the City of Wrocław, Poland. Integr. Environ. Assess. Manag. 2018, 14, 592–597. [Google Scholar] [CrossRef] [PubMed]
- Mazdiyasni, O.; AghaKouchak, A. Substantial increase in concurrent droughts and heatwaves in the United States. Proc. Natl. Acad. Sci. USA 2015, 112, 11484–11489. [Google Scholar] [CrossRef]
- Hao, Z.; AghaKouchak, A.; Phillips, T.J. Changes in concurrent monthly precipitation and temperature extremes. Environ. Res. Lett. 2013, 8, 034014. [Google Scholar] [CrossRef]
- Sharma, S.; Mujumdar, P. Increasing frequency and spatial extent of concurrent meteorological droughts and heatwaves in India. Sci. Rep. 2017, 7, 15582. [Google Scholar] [CrossRef]
- Hao, Z.; Hao, F.; Singh, V.P.; Xia, Y.; Shi, C.; Zhang, X. A multivariate approach for statistical assessments of compound extremes. J. Hydrol. 2018, 565, 87–94. [Google Scholar] [CrossRef]
- Seneviratne, S.I.; Nicholls, N.; Easterling, D.; Goodess, C.M.; Kanae, S.; Kossin, J.; Luo, Y.; Marengo, J.; McInnes, K.; Rahimi, M. Changes in climate extremes and their impacts on the natural physical environment: An overview of the IPCC SREX report. In Proceedings of the EGU General Assembly Conference Abstracts, Vienna, Austria, 22–27 April 2012; Volume 14, p. 12566. [Google Scholar]
- Leonard, M.; Westra, S.; Phatak, A.; Lambert, M.; van den Hurk, B.; McInnes, K.; Risbey, J.; Schuster, S.; Jakob, D.; Stafford-Smith, M. A compound event framework for understanding extreme impacts. Wiley Interdiscip. Rev. Clim. Chang. 2014, 5, 113–128. [Google Scholar] [CrossRef]
- Zscheischler, J.; Westra, S.; Hurk, B.J.; Seneviratne, S.I.; Ward, P.J.; Pitman, A.; AghaKouchak, A.; Bresch, D.N.; Leonard, M.; Wahl, T. Future climate risk from compound events. Nat. Clim. Chang. 2018, 1, 469–477. [Google Scholar] [CrossRef]
- Dai, A. Drought under global warming: A review. Wiley Interdiscip. Rev. Clim. Chang. 2011, 2, 45–65. [Google Scholar] [CrossRef]
- Stocker, T.; Qin, D.; Plattner, G.; Tignor, M.; Allen, S.; Boschung, J.; Nauels, A.; Xia, Y.; Bex, V.; Midgley, P. IPCC, 2013: Climate Change 2013: The Physical Science Basis. In Contribution of Working Group I to the Fifth Assessment Report of the Intergovernmental Panel on Climate Change; Cambridge University Press: Cambridge, UK; New York, NY, USA, 2013; 1535p. [Google Scholar]
- Sternberg, T. Regional drought has a global impact. Nature 2011, 472, 169. [Google Scholar] [CrossRef]
- Kenney, W.L.; Craighead, D.H.; Alexander, L.M. Heat waves, aging, and human cardiovascular health. Med. Sci. Sports Exerc. 2014, 46, 1891. [Google Scholar] [CrossRef] [PubMed]
- Ciais, P.; Reichstein, M.; Viovy, N.; Granier, A.; Ogée, J.; Allard, V.; Aubinet, M.; Buchmann, N.; Bernhofer, C.; Carrara, A. Europe-wide reduction in primary productivity caused by the heat and drought in 2003. Nature 2005, 437, 529. [Google Scholar] [CrossRef] [PubMed]
- Vautard, R.; Honore, C.; Beekmann, M.; Rouil, L. Simulation of ozone during the August 2003 heat wave and emission control scenarios. Atmos. Environ. 2005, 39, 2957–2967. [Google Scholar] [CrossRef]
- Mueller, B.; Seneviratne, S.I. Hot days induced by precipitation deficits at the global scale. Proc. Natl. Acad. Sci. USA 2012, 109, 12398–12403. [Google Scholar] [CrossRef]
- Stéfanon, M.; Drobinski, P.; D’Andrea, F.; Lebeaupin-Brossier, C.; Bastin, S. Soil moisture-temperature feedbacks at meso-scale during summer heat waves over Western Europe. Clim. Dyn. 2014, 42, 1309–1324. [Google Scholar] [CrossRef]
- Teskey, R.; Wertin, T.; Bauweraerts, I.; Ameye, M.; McGuire, M.A.; Steppe, K. Responses of tree species to heat waves and extreme heat events. Plant Cell Environ. 2015, 38, 1699–1712. [Google Scholar] [CrossRef]
- Seneviratne, S.I.; Corti, T.; Davin, E.L.; Hirschi, M.; Jaeger, E.B.; Lehner, I.; Orlowsky, B.; Teuling, A.J. Investigating soil moisture–climate interactions in a changing climate: A review. Earth Sci. Rev. 2010, 99, 125–161. [Google Scholar] [CrossRef]
- Miralles, D.G.; Gentine, P.; Seneviratne, S.I.; Teuling, A.J. Land–atmospheric feedbacks during droughts and heatwaves: State of the science and current challenges. Ann. N. Y. Acad. Sci. 2018, 1436, 19–35. [Google Scholar] [CrossRef] [PubMed]
- Cong, Z.; Yang, D.; Gao, B.; Yang, H.; Hu, H. Hydrological trend analysis in the Yellow River basin using a distributed hydrological model. Water Resour. Res. 2009, 45. [Google Scholar] [CrossRef]
- Lin, W.; Wen, C.; Wen, Z.; Gang, H. Drought in Southwest China: A review. Atmos. Ocean. Sci. Lett. 2015, 8, 339–344. [Google Scholar]
- Sun, Y.; Zhang, X.; Zwiers, F.W.; Song, L.; Wan, H.; Hu, T.; Yin, H.; Ren, G. Rapid increase in the risk of extreme summer heat in Eastern China. Nat. Clim. Chang. 2014, 4, 1082. [Google Scholar] [CrossRef]
- Bai, L.; Ding, G.; Gu, S.; Bi, P.; Su, B.; Qin, D.; Xu, G.; Liu, Q. The effects of summer temperature and heat waves on heat-related illness in a coastal city of China, 2011–2013. Environ. Res. 2014, 132, 212–219. [Google Scholar] [CrossRef] [PubMed]
- Gu, S.; Huang, C.; Bai, L.; Chu, C.; Liu, Q. Heat-related illness in China, summer of 2013. Int. J. Biometeorol. 2016, 60, 131–137. [Google Scholar] [CrossRef] [PubMed]
- Lipiec, J.; Doussan, C.; Nosalewicz, A.; Kondracka, K. Effect of drought and heat stresses on plant growth and yield: A review. Int. Agrophys. 2013, 27, 463–477. [Google Scholar] [CrossRef]
- Zhang, Y.; Li, G.; Ge, J.; Li, Y.; Yu, Z.; Niu, H. sc_PDSI is more sensitive to precipitation than to reference evapotranspiration in China during the time period 1951–2015. Ecol. Indic. 2019, 96, 448–457. [Google Scholar] [CrossRef]
- Lu, H.; Mo, X.; Liu, S. Intercomparison of three indices for addressing drought variability in North China Plain during 1962–2012. Proc. Int. Assoc. Hydrol. Sci. 2015, 366, 141–142. [Google Scholar] [CrossRef][Green Version]
- Wei, J.; Ma, Z. Comparison of Palmer drought severity index, percentage of precipitation anomaly and surface humid index. Acta Geogr. Sin. 2003, 58, 117–124. [Google Scholar]
- Wu, X.; Hao, Z.; Hao, F.; Li, C.; Zhang, X. Spatial and Temporal Variations of Compound Droughts and Hot Extremes in China. Atmosphere 2019, 10, 95. [Google Scholar] [CrossRef]
- Easterling, D.R.; Evans, J.; Groisman, P.Y.; Karl, T.R.; Kunkel, K.E.; Ambenje, P. Observed variability and trends in extreme climate events: A brief review. Bull. Am. Meteorol. Soc. 2000, 81, 417–426. [Google Scholar] [CrossRef]
- Li, X.; You, Q.; Ren, G.; Wang, S.; Zhang, Y.; Yang, J.; Zheng, G. Concurrent droughts and hot extremes in Northwest China from 1961 to 2017. Int. J. Climatol. 2018. [Google Scholar] [CrossRef]
- Perkins, S.E.; Alexander, L.V. On the measurement of heat waves. J. Clim. 2013, 26, 4500–4517. [Google Scholar] [CrossRef]
- Data, C. Guidelines on Analysis of Extremes in A Changing Climate in Support of Informed Decisions for Adaptation; World Meteorological Organization: Geneve, Switzerland, 2009. [Google Scholar]
- Mann, H.B. Nonparametric tests against trend. Econom. J. Econom. Soc. 1945, 13, 245–259. [Google Scholar] [CrossRef]
- Kendall, M.G. Rank Correlation Methods; Springer: Berlin/Heidelberg, Germany, 1955. [Google Scholar]
- Serrano, A.; Mateos, V.; Garcia, J. Trend analysis of monthly precipitation over the Iberian Peninsula for the period 1921–1995. Phys. Chem. Earth Part B Hydrol. Ocean. Atmos. 1999, 24, 85–90. [Google Scholar] [CrossRef]
- Yue, S.; Pilon, P.; Phinney, B.; Cavadias, G. The influence of autocorrelation on the ability to detect trend in hydrological series. Hydrol. Process. 2002, 16, 1807–1829. [Google Scholar] [CrossRef]
- Serinaldi, F.; Kilsby, C.G.; Lombardo, F. Untenable nonstationarity: An assessment of the fitness for purpose of trend tests in hydrology. Adv. Water Resour. 2018, 111, 132–155. [Google Scholar] [CrossRef]
- Clarke, R.T. On the (mis)use of statistical methods in hydro-climatological research. Hydrol. Sci. J. 2010, 55, 139–144. [Google Scholar] [CrossRef]
- Poppick, A.; Moyer, E.J.; Stein, M.L. Estimating trends in the global mean temperature record. Adv. Stat. Climatol. Meteorol. Oceanogr. 2017, 3, 33–53. [Google Scholar] [CrossRef]
- Wang, W.; Zhu, Y.; Xu, R.; Liu, J. Drought severity change in China during 1961–2012 indicated by SPI and SPEI. Nat. Hazards 2014, 75, 2437–2451. [Google Scholar] [CrossRef]
- Chen, H.-P.; Sun, J.-Q. Drought response to air temperature change over China on the centennial scale. Atmos. Ocean. Sci. Lett. 2015, 8, 113–119. [Google Scholar]
- He, J.; Yang, X.; Li, Z.; Zhang, X.; Tang, Q. Spatiotemporal Variations of Meteorological Droughts in China During 1961–2014: An Investigation Based on Multi-Threshold Identification. Int. J. Disaster Risk Sci. 2016, 7, 63–76. [Google Scholar] [CrossRef]
- Smith, T.T.; Zaitchik, B.F.; Gohlke, J.M. Heat waves in the United States: Definitions, patterns and trends. Clim. Chang. 2013, 118, 811–825. [Google Scholar] [CrossRef] [PubMed]
- Sun, Y.; Hu, T.; Zhang, X. Substantial Increase in Heat Wave Risks in China in a Future Warmer World. Earths Future 2018, 6, 1528–1538. [Google Scholar] [CrossRef]
- Sun, Z.; Ouyang, Z.; Zhao, J.; Li, S.; Zhang, X.; Ren, W. Recent rebound in observational large-pan evaporation driven by heat wave and droughts by the Lower Yellow River. J. Hydrol. 2018, 565, 237–247. [Google Scholar] [CrossRef]
- Wang, P.; Tang, J.; Sun, X.; Wang, S.; Wu, J.; Dong, X.; Fang, J. Heat Waves in China: Definitions, Leading Patterns, and Connections to Large-Scale Atmospheric Circulation and SSTs. J. Geophys. Res. Atmos. 2017, 122, 10679–10699. [Google Scholar] [CrossRef]
- Kelly, M.G. Temperature and Drought, A Science Assessment By A Subgroup Of The Drought Task Force; California Department of Water Resources: Sacramento, CA, USA, 2015.
- Colglazier, W. Sustainable development agenda: 2030. Science 2015, 349, 1048–1050. [Google Scholar] [CrossRef]


| Period | 1960s | 1970s | 1980s | 1990s | 2000s | 2010s | 1960s–2010s | |
|---|---|---|---|---|---|---|---|---|
| Region | ||||||||
| NEC | 0.45 | 0.70 | 0.54 | 0.50 | 0.84 | 0.61 | 0.61 | |
| NC | 0.70 | 0.67 | 0.76 | 0.66 | 0.90 | 0.79 | 0.75 | |
| NWC | 0.78 | 0.76 | 0.63 | 0.69 | 0.65 | 0.57 | 0.68 | |
| SWC | 0.64 | 0.62 | 0.64 | 0.60 | 0.56 | 0.68 | 0.62 | |
| CC | 0.48 | 0.42 | 0.44 | 0.45 | 0.54 | 0.48 | 0.47 | |
| SC | 0.73 | 0.45 | 0.68 | 0.62 | 0.74 | 0.48 | 0.62 | |
| EC | 0.60 | 0.42 | 0.57 | 0.50 | 0.62 | 0.48 | 0.53 | |
| Period | 1960s | 1970s | 1980s | 1990s | 2000s | 2010s | 1960s–2010s | |
|---|---|---|---|---|---|---|---|---|
| Region | ||||||||
| NEC | 0.92 | 0.91 | 1.37 | 1.40 | 2.29 | 4.19 | 1.85 | |
| NC | 1.04 | 0.86 | 0.97 | 1.44 | 2.50 | 3.95 | 1.79 | |
| NWC | 1.12 | 0.94 | 0.96 | 1.64 | 2.38 | 3.97 | 1.84 | |
| SWC | 1.03 | 0.62 | 1.17 | 1.69 | 2.14 | 4.07 | 1.79 | |
| CC | 2.07 | 1.28 | 1.15 | 1.35 | 1.79 | 3.26 | 1.82 | |
| SC | 1.15 | 0.62 | 1.26 | 1.42 | 1.95 | 4.18 | 1.76 | |
| EC | 1.61 | 1.01 | 1.08 | 1.40 | 2.14 | 3.60 | 1.81 | |
| Period | 1960s | 1970s | 1980s | 1990s | 2000s | 2010s | 1960s–2010s | |
|---|---|---|---|---|---|---|---|---|
| Region | ||||||||
| NEC | 0.03 | 0.14 | 0.10 | 0.13 | 0.34 | 0.45 | 0.20 | |
| NC | 0.09 | 0.12 | 0.11 | 0.23 | 0.52 | 0.61 | 0.28 | |
| NWC | 0.21 | 0.23 | 0.15 | 0.28 | 0.30 | 0.38 | 0.26 | |
| SWC | 0.16 | 0.13 | 0.14 | 0.25 | 0.29 | 0.53 | 0.25 | |
| CC | 0.22 | 0.15 | 0.17 | 0.14 | 0.19 | 0.34 | 0.20 | |
| SC | 0.27 | 0.14 | 0.17 | 0.15 | 0.34 | 0.31 | 0.23 | |
| EC | 0.22 | 0.06 | 0.13 | 0.27 | 0.48 | 0.35 | 0.25 | |
© 2019 by the authors. Licensee MDPI, Basel, Switzerland. This article is an open access article distributed under the terms and conditions of the Creative Commons Attribution (CC BY) license (http://creativecommons.org/licenses/by/4.0/).
Share and Cite
Ye, L.; Shi, K.; Xin, Z.; Wang, C.; Zhang, C. Compound Droughts and Heat Waves in China. Sustainability 2019, 11, 3270. https://doi.org/10.3390/su11123270
Ye L, Shi K, Xin Z, Wang C, Zhang C. Compound Droughts and Heat Waves in China. Sustainability. 2019; 11(12):3270. https://doi.org/10.3390/su11123270
Chicago/Turabian StyleYe, Lei, Ke Shi, Zhuohang Xin, Chao Wang, and Chi Zhang. 2019. "Compound Droughts and Heat Waves in China" Sustainability 11, no. 12: 3270. https://doi.org/10.3390/su11123270
APA StyleYe, L., Shi, K., Xin, Z., Wang, C., & Zhang, C. (2019). Compound Droughts and Heat Waves in China. Sustainability, 11(12), 3270. https://doi.org/10.3390/su11123270