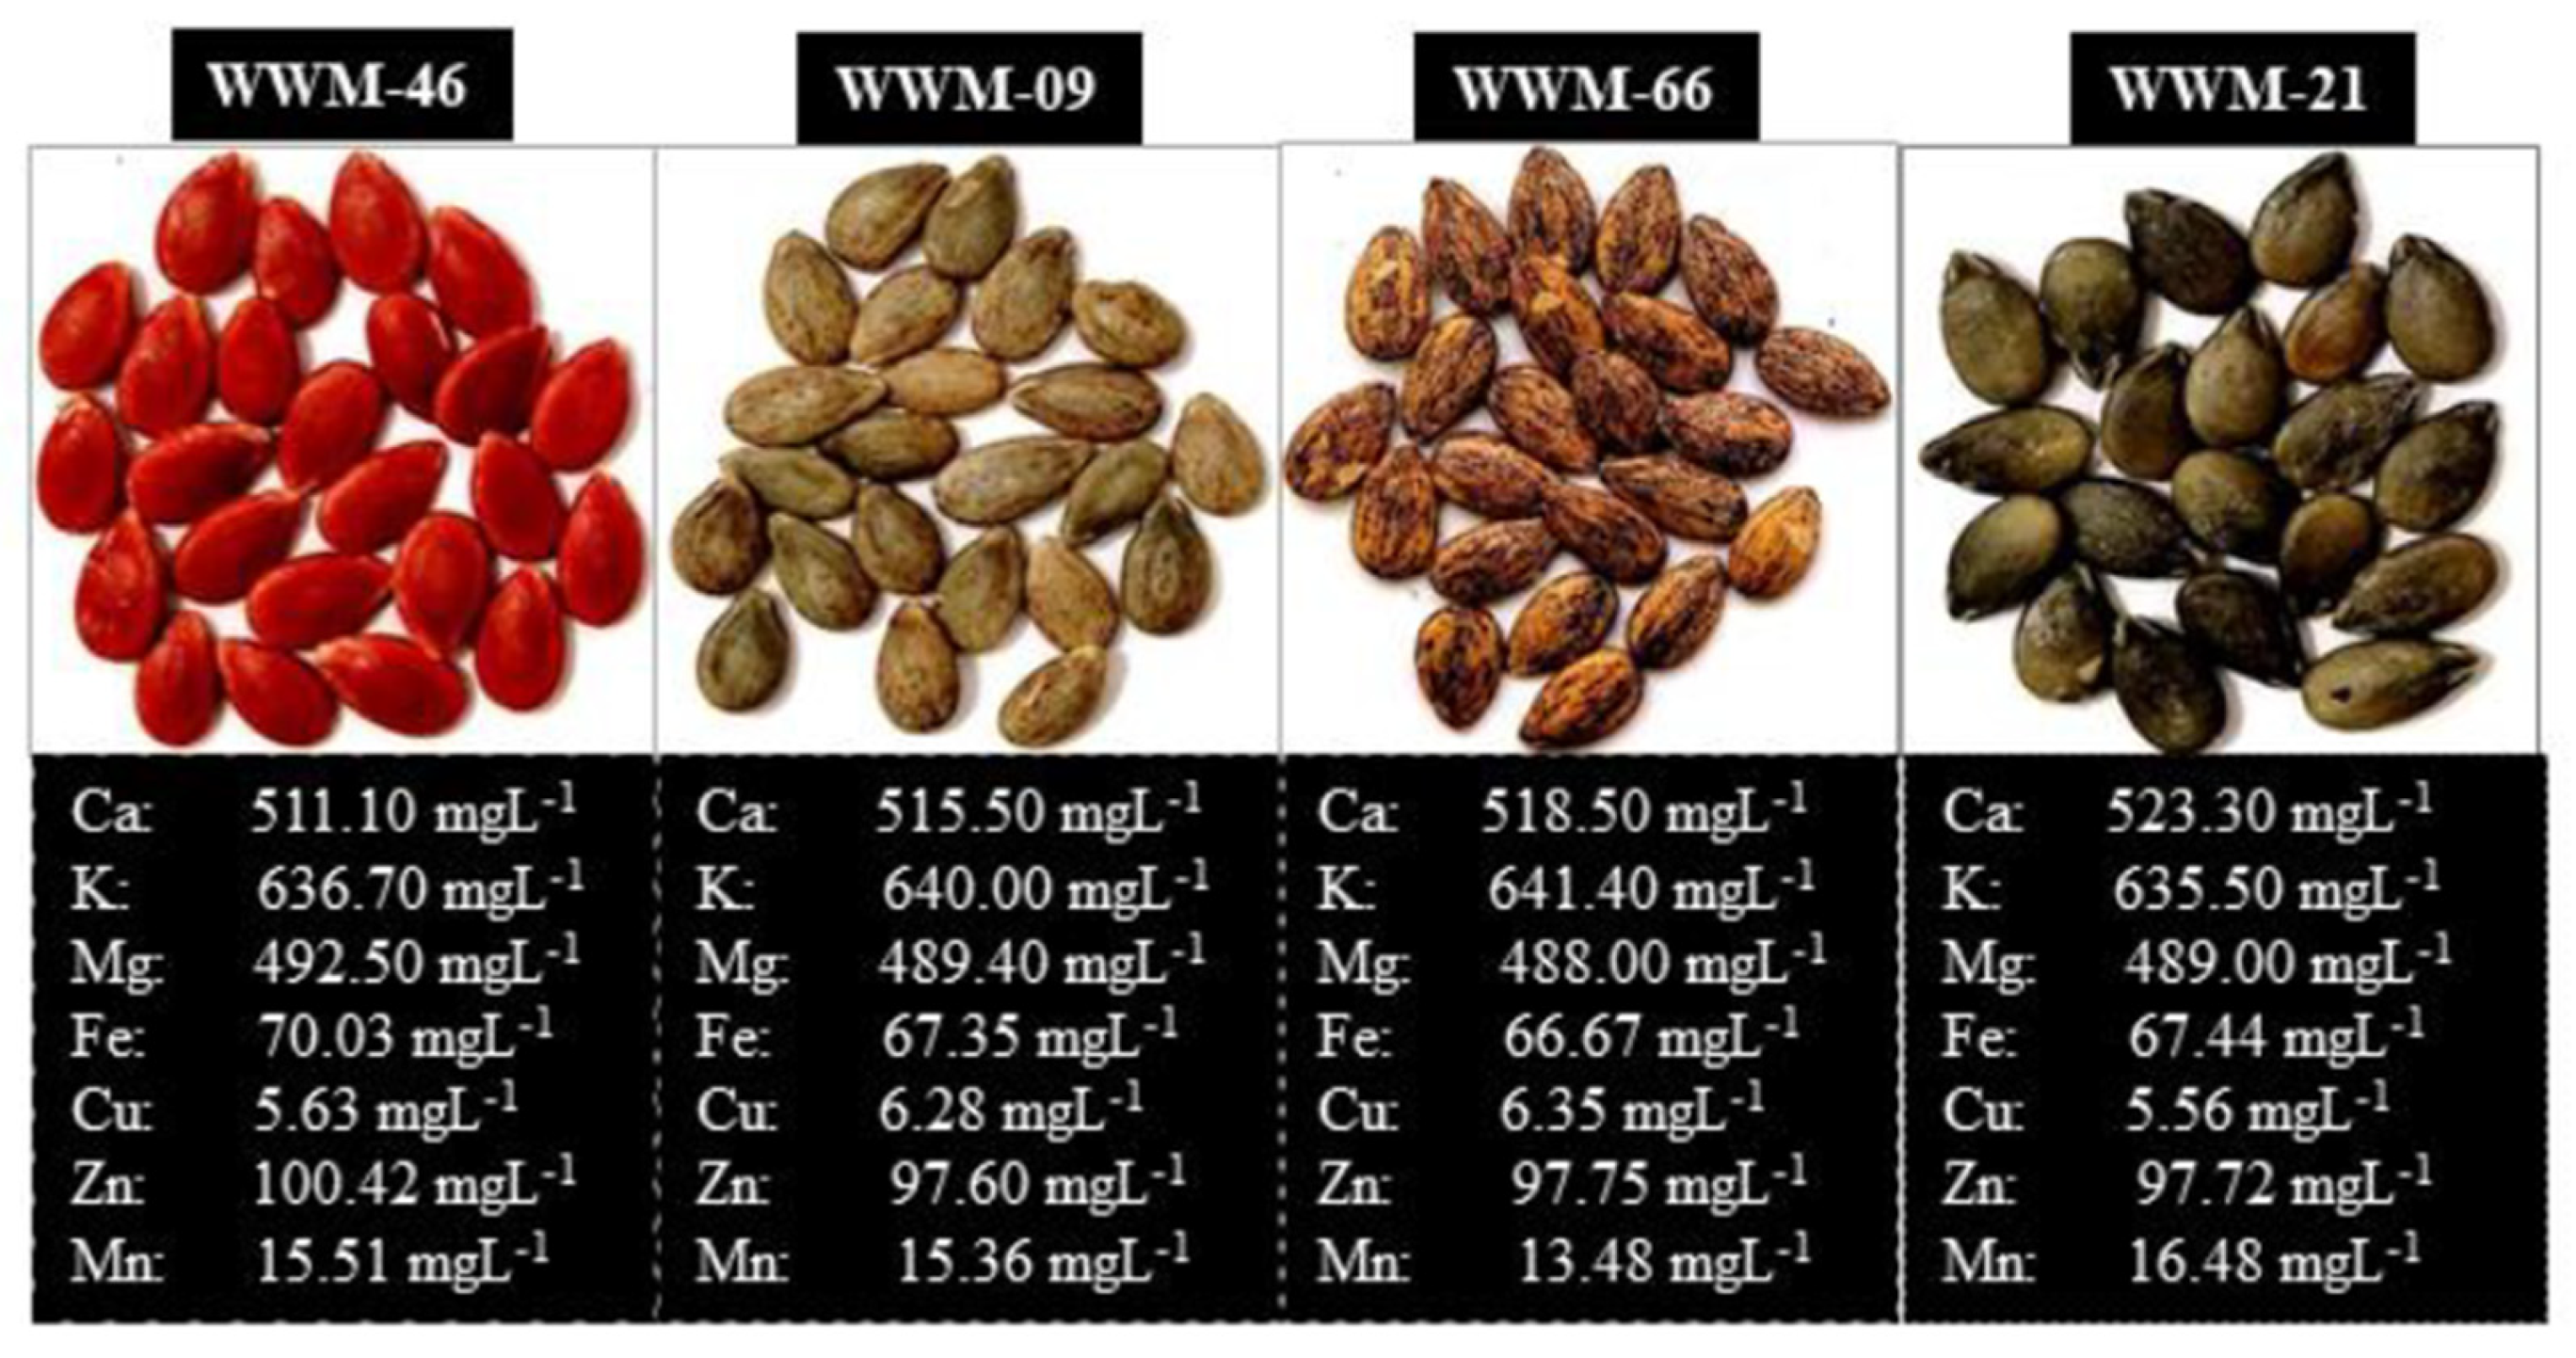
Figure 1.
Citron watermelon genotypes used for the study and their estimated mineral element composition from fast atomic absorption spectrometry (FAAS).
Figure 1.
Citron watermelon genotypes used for the study and their estimated mineral element composition from fast atomic absorption spectrometry (FAAS).
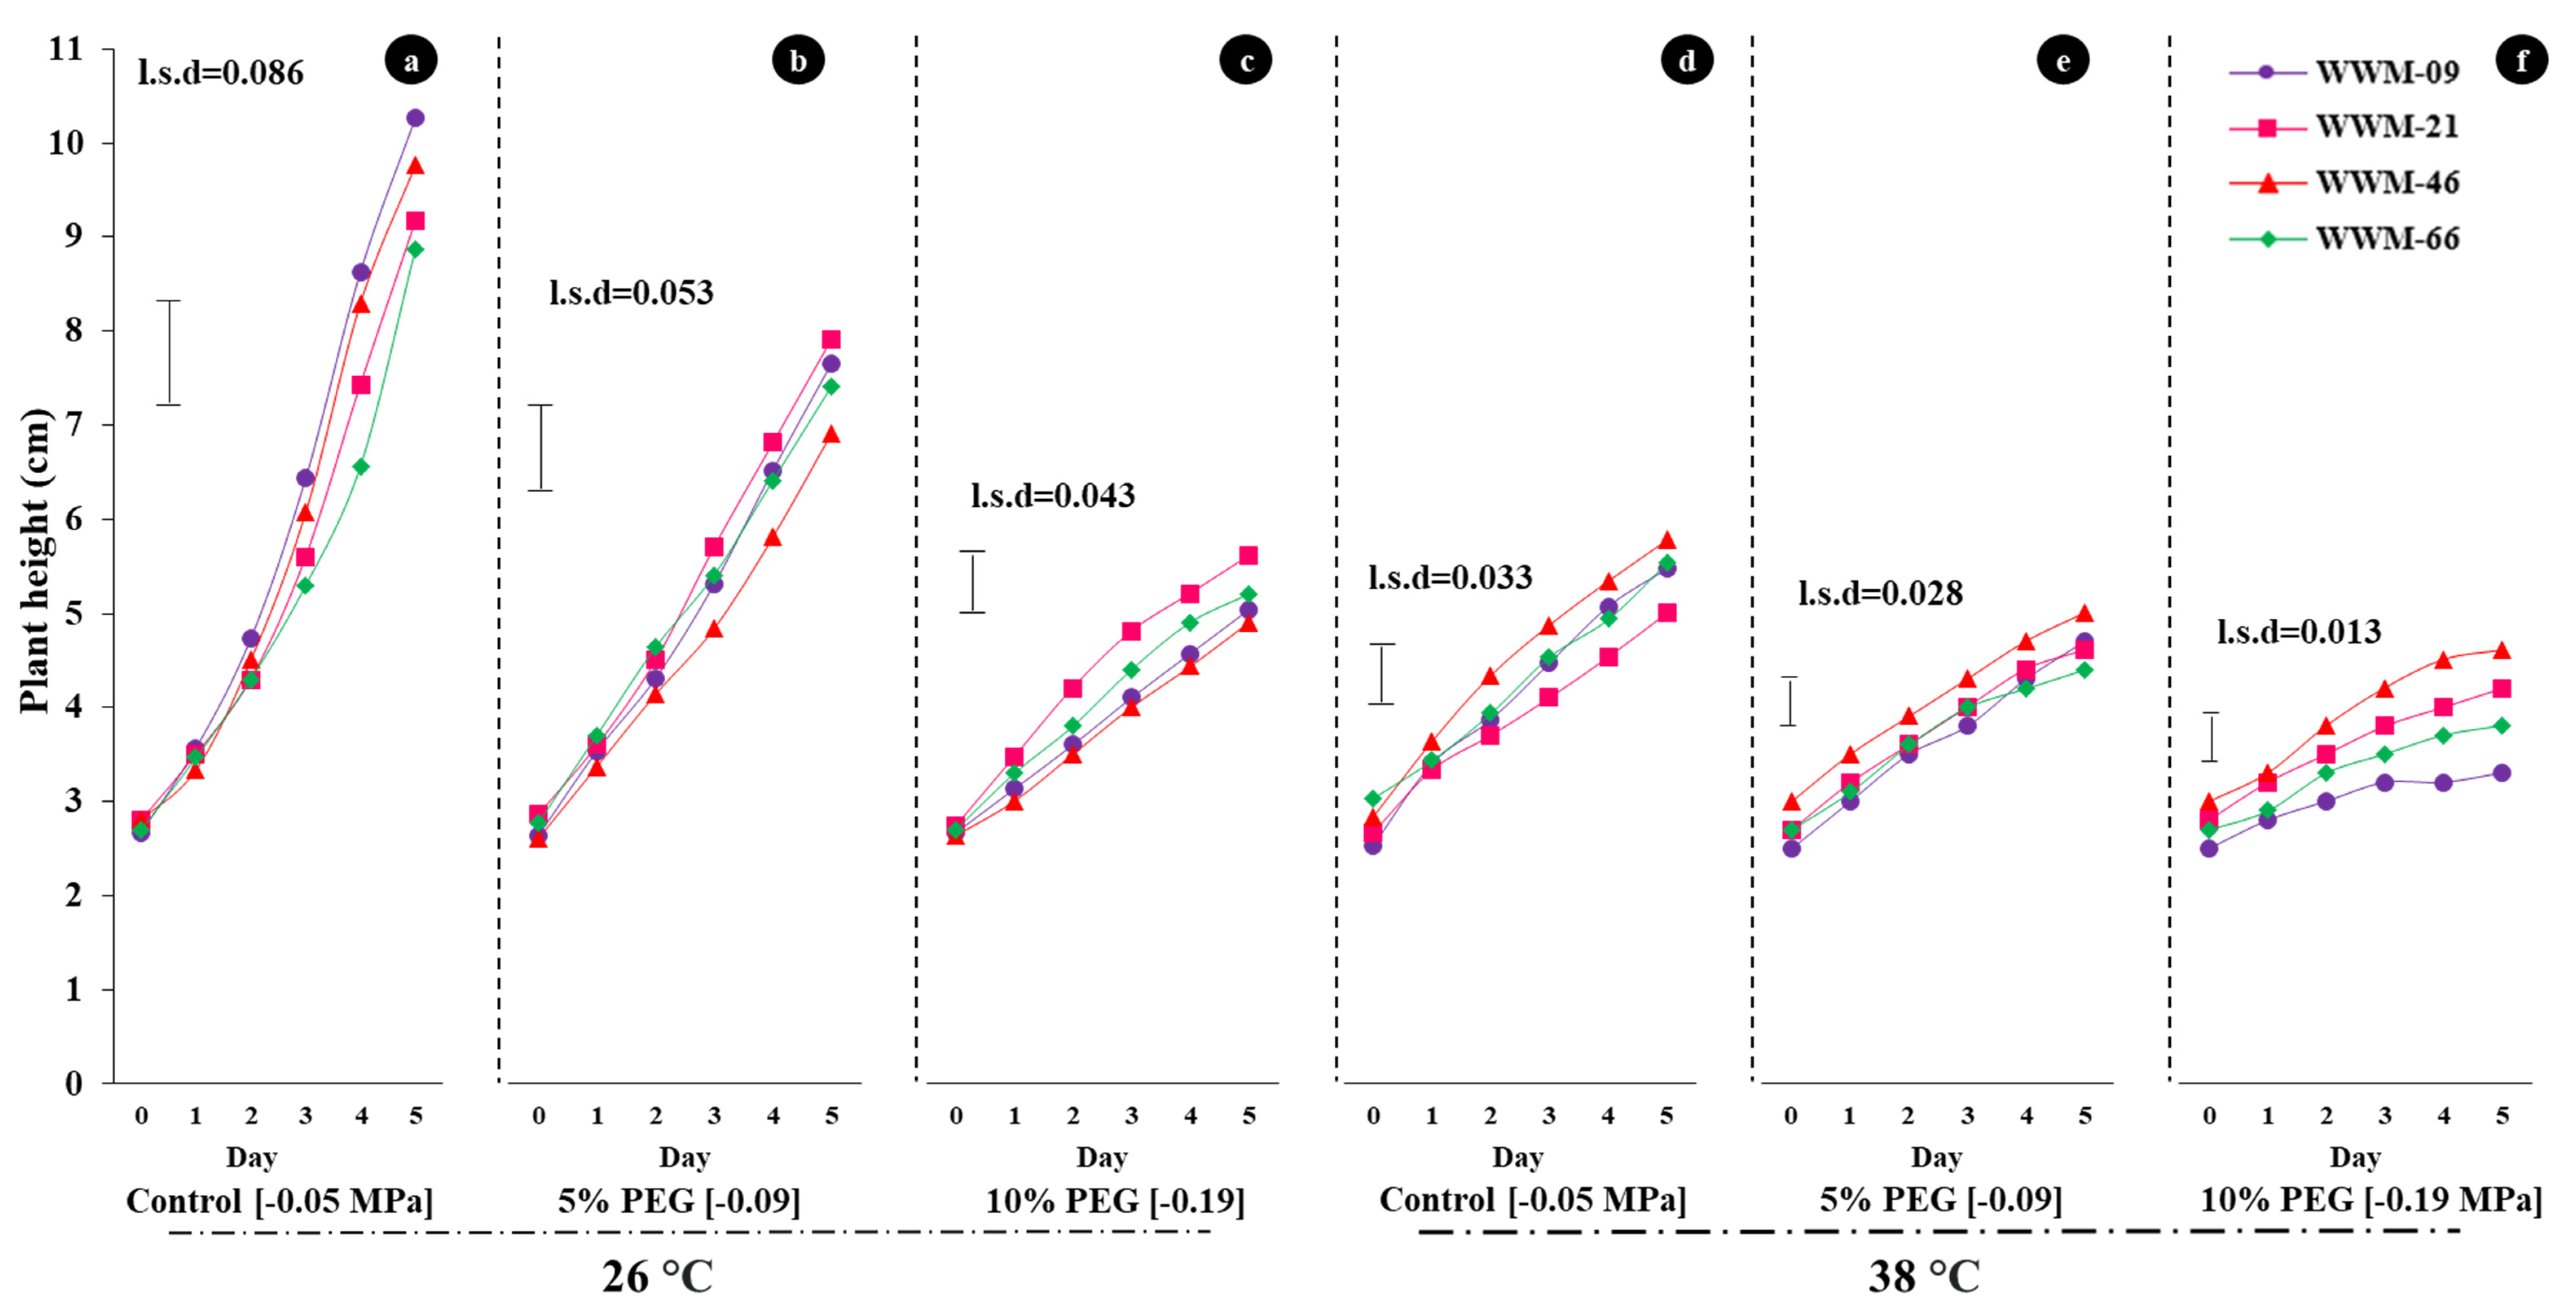
Figure 2.
Effect of heat and water stress on hypocotyl growth of four citron watermelon landrace accession over five days after exposure to combined stress (water and heat) treatment; (a) [−0.05 MPa; 26 °C], (b) [−0.09 MPa; 26 °C], (c) [−0.19 MPa; 26 °C], (d) [−0.05 MPa; 38 °C], (e) [−0.09 MPa; 38 °C], and (f) [−0.19 MPa; 38 °C].
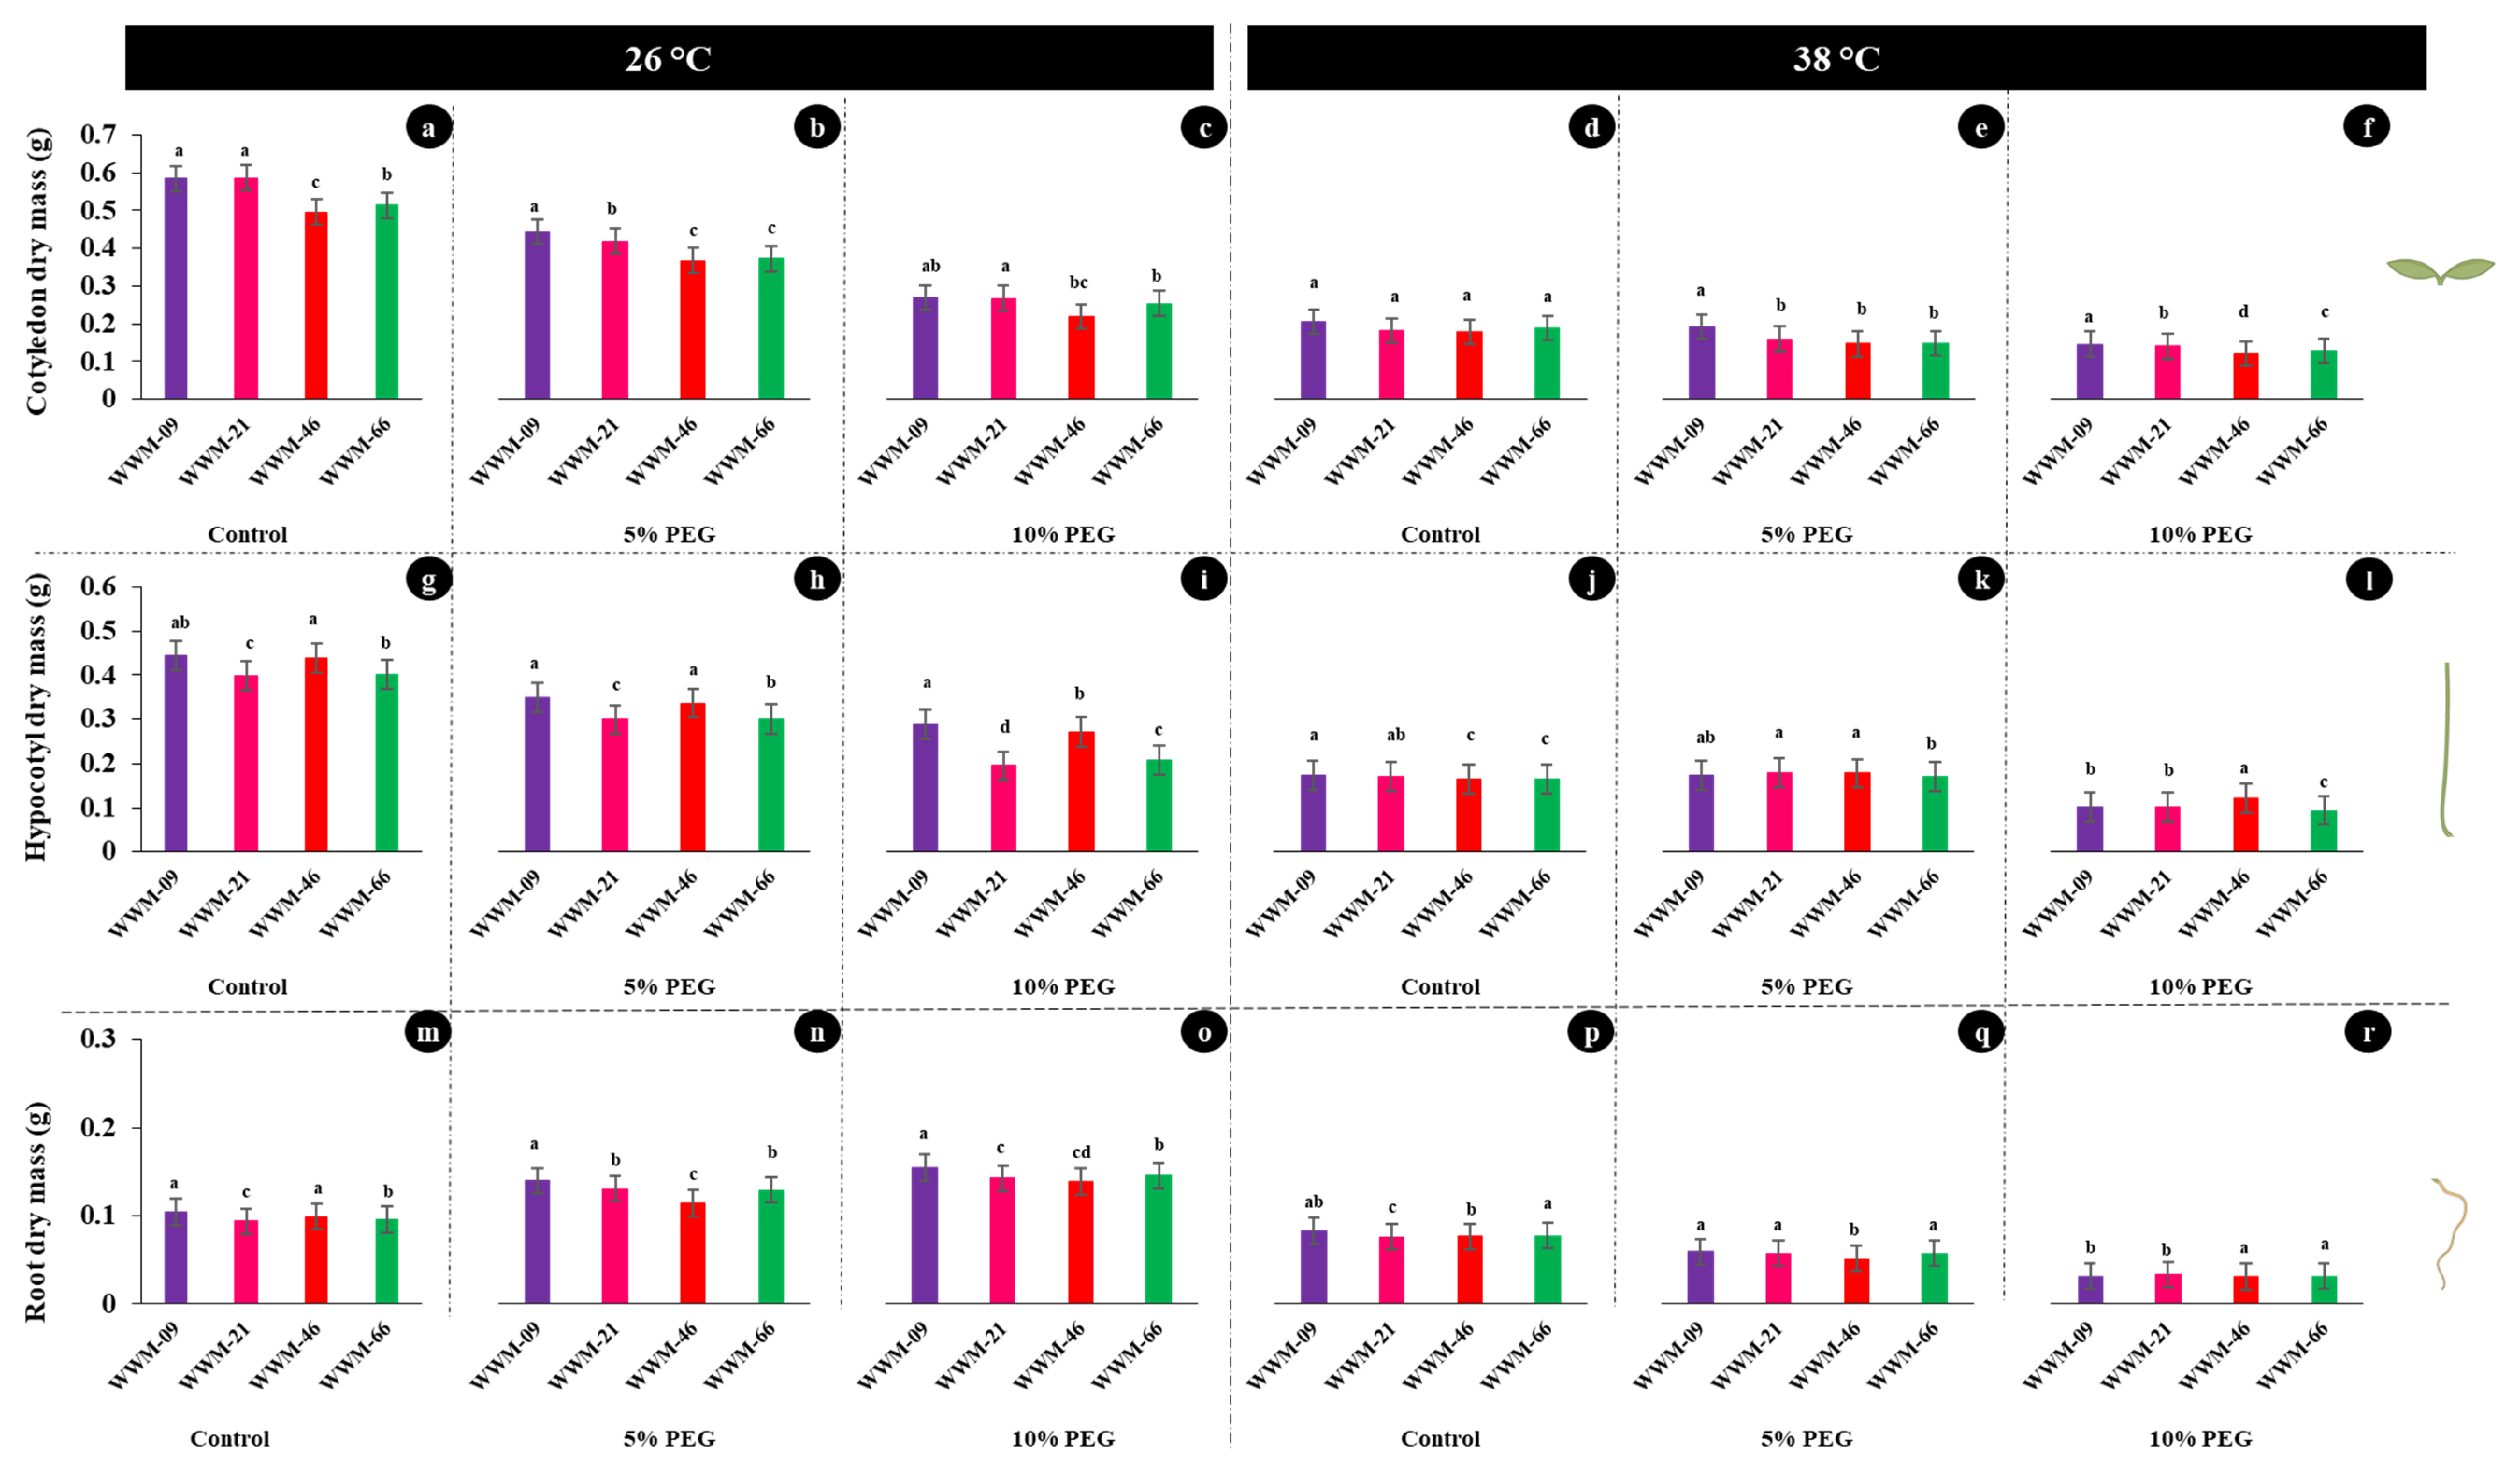
Figure 3.
Dry mass of citron watermelon seedling axis (cotyledon, hypocotyl, and roots) at day five after exposure to osmotic stress and heat stress. (a) [−0.05 MPa; 26 °C], (b) [−0.09 MPa; 26 °C], (c) [−0.19 MPa; 26 °C], (d) [−0.05 MPa; 38 °C], (e) [−0.09 MPa; 38 °C], and (f) [−0.19 MPa; 38 °C], (g) [−0.05 MPa; 26 °C], (h) [−0.09 MPa; 26 °C], (i) [−0.19 MPa; 26 °C], (j) [−0.05 MPa; 38 °C], (k) [−0.09 MPa; 38 °C], and (l) [−0.19 MPa; 38 °C]. (m) [−0.05 MPa; 26 °C], (n) [−0.09 MPa; 26 °C], (o) [−0.19 MPa; 26 °C], (p) [−0.05 MPa; 38 °C], (q) [−0.09 MPa; 38 °C], and (r) [−0.19 MPa; 38 °C]. Means with the same letters are statistically similar, while those with different letters are significantly distinct.
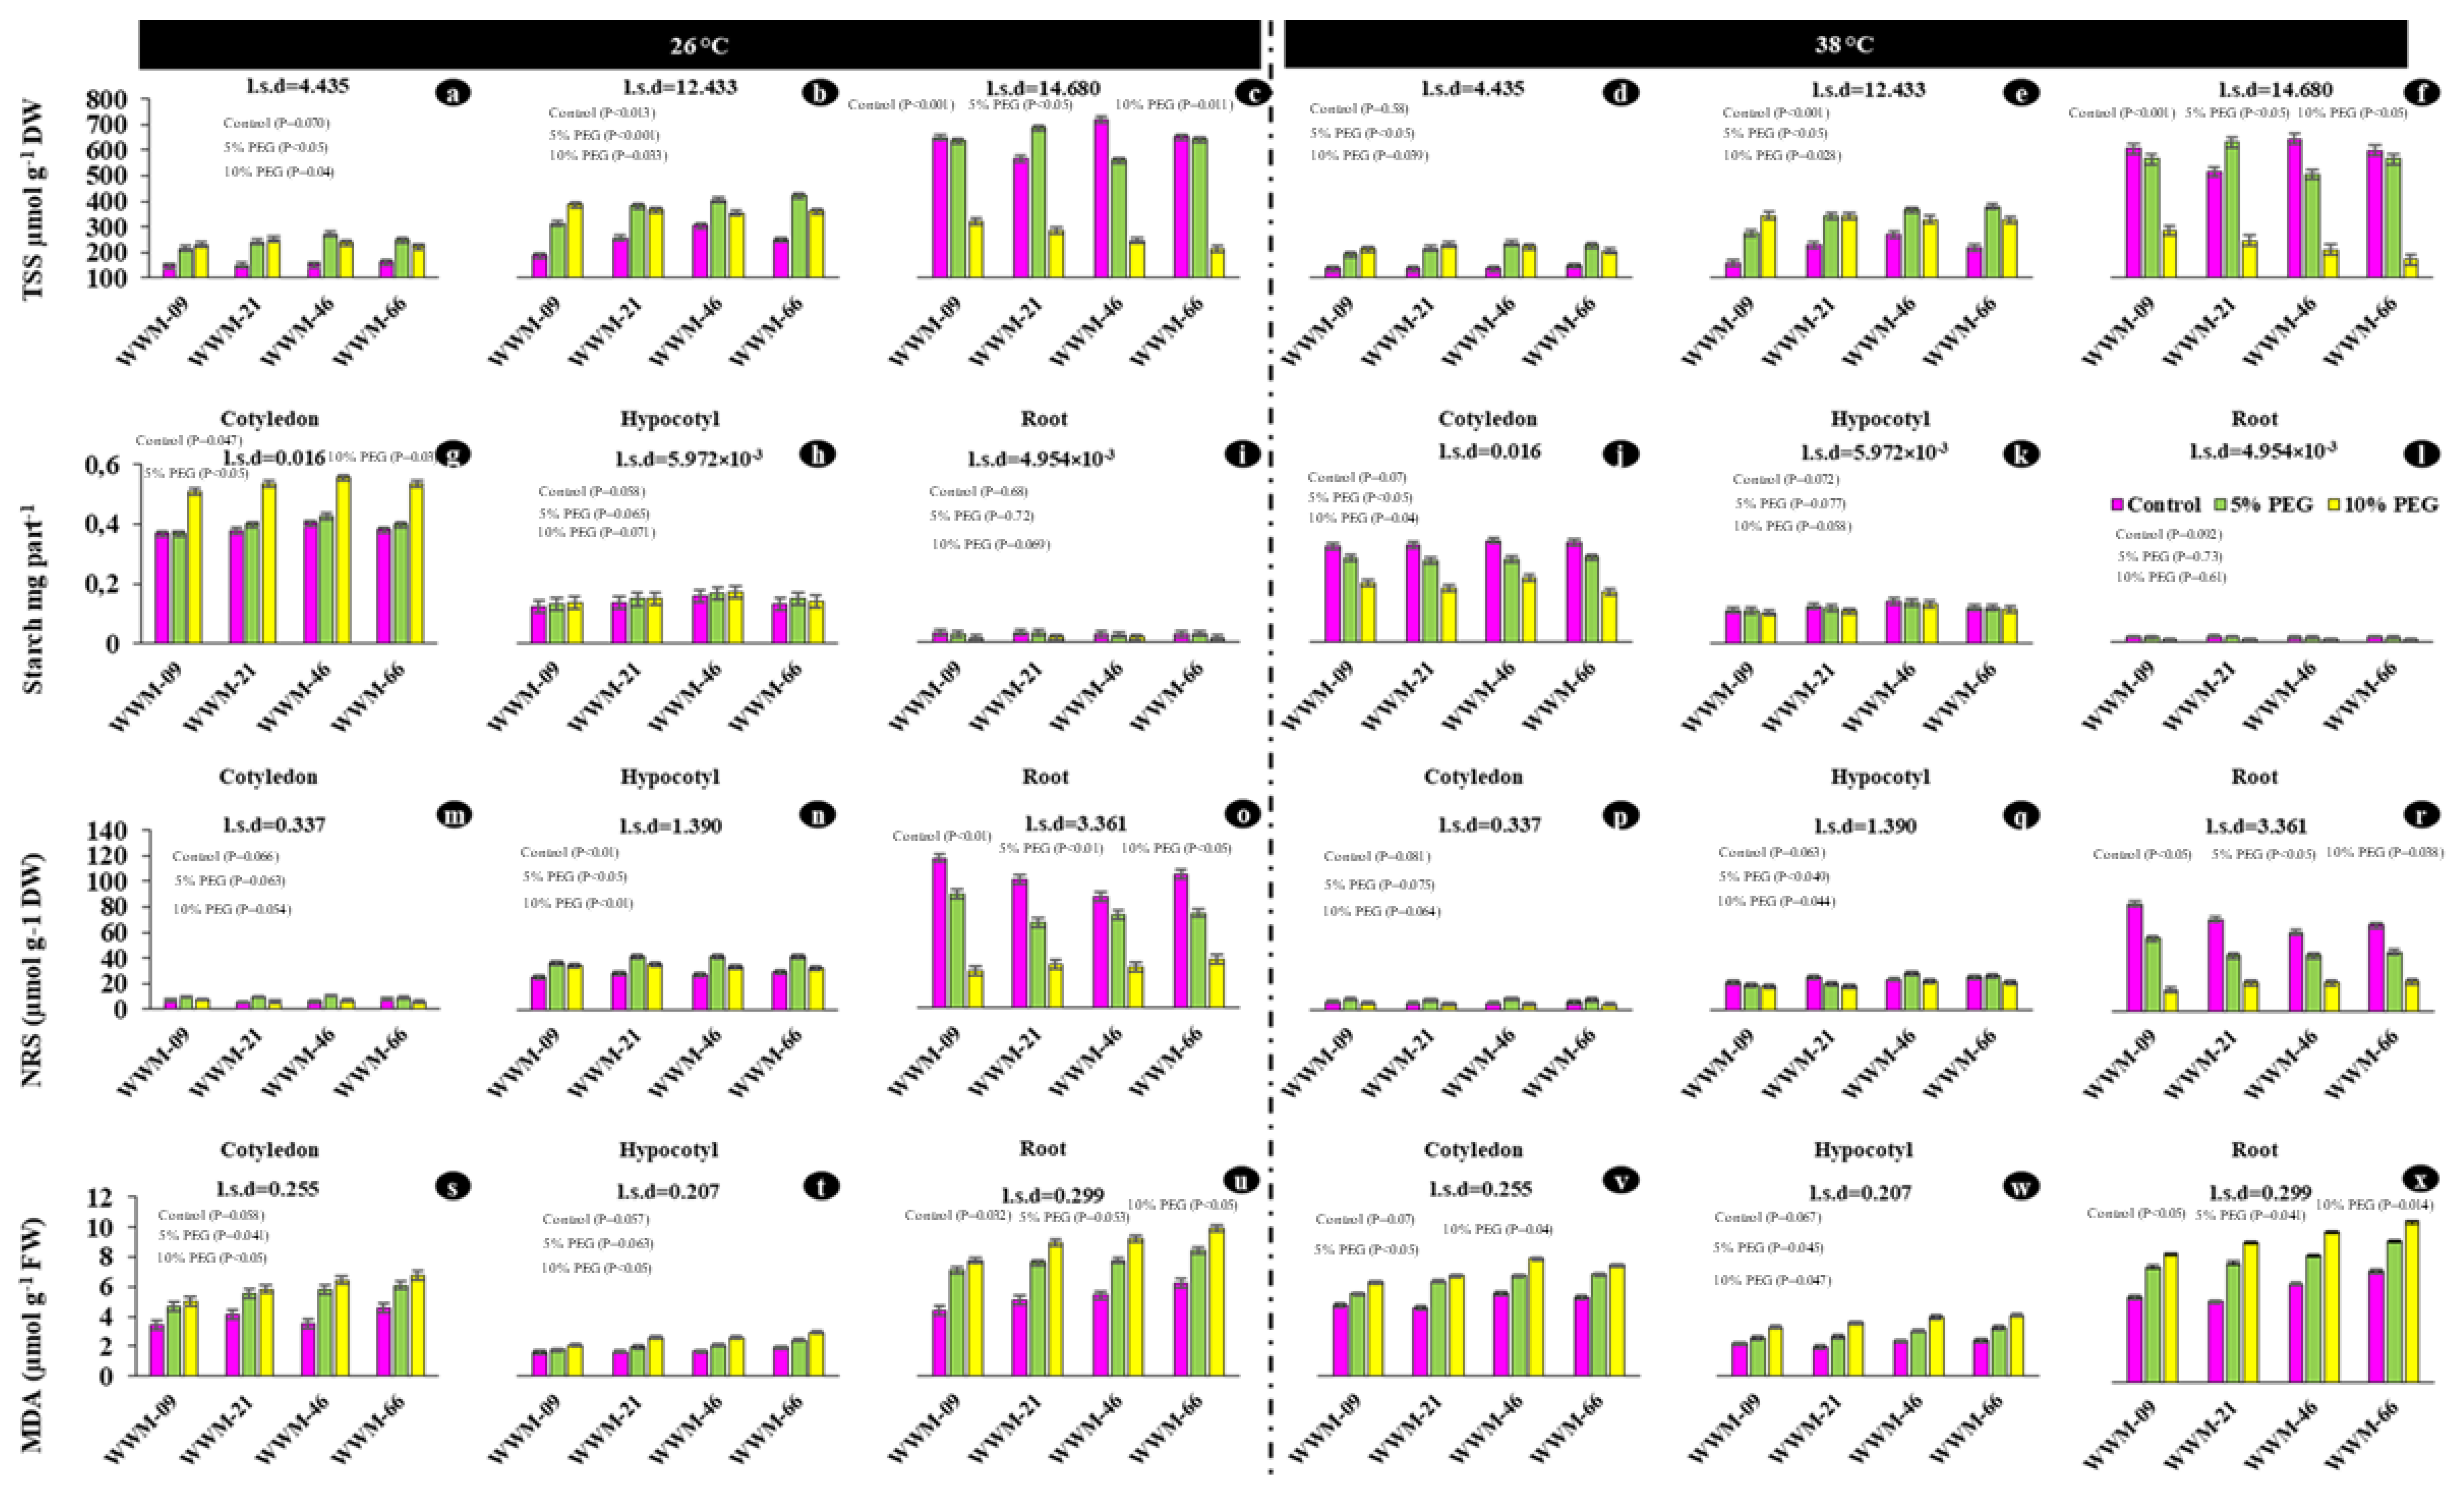
Figure 4.
Total soluble solutes (a–f), starch (g–l), non-reducing sugars (m–r), and malondialdehyde (s–x) of citron watermelon seedling axis (cotyledon, hypocotyl and roots) at day five after exposure to osmotic and heat stress.
Figure 4.
Total soluble solutes (a–f), starch (g–l), non-reducing sugars (m–r), and malondialdehyde (s–x) of citron watermelon seedling axis (cotyledon, hypocotyl and roots) at day five after exposure to osmotic and heat stress.
Figure 5.
The electron impact ionization mass spectra of phytosterols (campesterol, stigmasterol, and sitosterol) in samples of (a) cotyledon [−0.09 MPa; 26 °C], (b) roots [−0.09 MPa; 26 °C], (c) cotyledon [−0.19 MPa; 38 °C], and (d) roots [−0.19 MPa; 38 °C].
Figure 5.
The electron impact ionization mass spectra of phytosterols (campesterol, stigmasterol, and sitosterol) in samples of (a) cotyledon [−0.09 MPa; 26 °C], (b) roots [−0.09 MPa; 26 °C], (c) cotyledon [−0.19 MPa; 38 °C], and (d) roots [−0.19 MPa; 38 °C].
Figure 6.
Principal component (PC) biplot of PC 1 vs. PC 2 demonstrating the relationships among dry matter, pigments, non-structural carbohydrates, malondialdehyde and phytosterols of 4 citron watermelon accessions evaluated under (a) [−0.05 MPa; 26 °C], (b) [−0.09 MPa; 26 °C], (c) [−0.19 MPa; 26 °C], (d) [−0.05 MPa; 38 °C], (e) [−0.09 MPa; 38 °C], and (f) [−0.19 MPa; 38 °C].
Table 1.
Osmotic potential of polyethylene glycol (PEG-6000) solutions.
Table 1.
Osmotic potential of polyethylene glycol (PEG-6000) solutions.
| PEG-6000 Concentration (%) | Osmotic Potential (MPa) |
|---|
| 0 (control) | −0.05 |
| 5 | −0.09 |
| 10 | −0.19 |
Table 2.
Mathematical representation (y = mx + c) of average daily growth rate (cm day−1) of citron watermelon accessions under heat and water stress.
Table 2.
Mathematical representation (y = mx + c) of average daily growth rate (cm day−1) of citron watermelon accessions under heat and water stress.
| Genotype | Average Daily Growth Rate (cm Day−1) |
|---|
| Temperature (26 °C) | Temperature (38 °C) |
|---|
| Control | 5% PEG | 10% PEG | Control | 5% PEG | 10% PEG |
|---|
| WWM-09 | 1.569 a | 0.997 a | 0.475 ab | 0.579 a | 0.434 a | 0.154 d |
| WWM-21 | 1.284 c | 1.028 a | 0.575 a | 0.448 c | 0.386 c | 0.277 b |
| WWM-46 | 1.466 b | 0.843 b | 0.461 b | 0.580 a | 0.400 b | 0.343 a |
| WWM-66 | 1.175 c | 0.997 a | 0.511 a | 0.503 b | 0.349 d | 0.231 c |
| LSD | 0.086 | 0.053 | 0.043 | 0.033 | 0.028 | 0.013 |
| CV% | 3.300 | 4.200 | 3.900 | 5.900 | 3.400 | 4.500 |
| p-value | 0.044 | <0.001 | <0.001 | <0.001 | <0.001 | <0.001 |
Table 3.
Analysis of variance with mean squares and significant tests of relative water content and photosynthetic pigments of four citron watermelon genotypes under varying temperatures and osmotic potential after five days of treatment exposure.
Table 3.
Analysis of variance with mean squares and significant tests of relative water content and photosynthetic pigments of four citron watermelon genotypes under varying temperatures and osmotic potential after five days of treatment exposure.
| Source of Variation | d.f | RWC | Chl (a) | Chl (b) | Chl (a+b) | Chl (a/b) | Carotenoids |
|---|
| Genotype (G) | 3 | 316.979 ** | 0.854 ** | 0.009 | 1.014 ** | 0.532 ** | 0.029 ** |
| Osmotic potential (OP) | 2 | 1662.182 ** | 8.241 ** | 1.084 ** | 15.299 ** | 0.024 ** | 0.808 ** |
| Temperature (T) | 1 | 1152.240 ** | 29.022 ** | 3.680 ** | 53.371 ** | 0.079 | 1.199 ** |
| G × OP | 6 | 9.820 | 0.006 | 0.007 | 0.005 | 0.082 | 0.008 ** |
| G × T | 3 | 48.277 * | 0.401 ** | 0.014 | 0.523 ** | 0.142 * | 0.006 ** |
| OP × T | 2 | 25.636 * | 0.007 | 0.011 | 0.034 | 0.040 | 0.072 ** |
| G × O × T | 6 | 16.933 | 0.003 * | 0.006 * | 0.010 * | 0.087 * | 0.003 ** |
| Residual | 48 | 8.176 | 0.019 | 0.006 | 0.035 | 0.038 | 0.017 |
Table 4.
Means for percentage relative water content of citron watermelon embryonic leaf under varying temperatures and osmotic potential.
Table 4.
Means for percentage relative water content of citron watermelon embryonic leaf under varying temperatures and osmotic potential.
| Relative Water Content (%) |
|---|
| Genotype | Temperature (26 °C) | Temperature (38 °C) |
|---|
| Control | 5% PEG | 10% PEG | Control | 5% PEG | 10% PEG |
|---|
| WWM-09 | 90.03 a | 82.98 a | 73.72 a | 84.05 a | 75.36 a | 67.21 a |
| WWM-21 | 84.14 b | 74.12 b | 65.18 b | 79.04 b | 70.74 b | 61.13 b |
| WWM-46 | 81.19 c | 76.70 b | 67.99 b | 74.12 c | 67.61 c | 55.99 c |
| WWM-66 | 83.49 bc | 70.89 c | 71.80 a | 73.04 c | 65.00 c | 52.93 d |
| cv% | 3.900 | 4.800 | 6.300 | 4.100 | 7.400 | 5.300 |
| p-value | <0.001 | 0.031 | 0.024 | 0.017 | 0.011 | <0.001 |
Table 5.
Mean values for photosynthetic pigments (chlorophyll and carotenoids) under varying temperatures and osmotic potential.
Table 5.
Mean values for photosynthetic pigments (chlorophyll and carotenoids) under varying temperatures and osmotic potential.
| Chlorophyll (a) (mg g−1 DW) | Chlorophyll (b) (mg g−1 DW) | Chlorophyll (a+b) (mg g−1 DW) | Chlorophyll (a/b) | Carotenoids (mg g−1) |
|---|
| Temp (°C) | Genotype | Control | 5% PEG | 10% PEG | Control | 5% PEG | 10% PEG | Control | 5% PEG | 10% PEG | Control | 5% PEG | 10% PEG | Control | 5% PEG | 10% PEG |
|---|
| | WWM-09 | 4.159 a | 3.508 a | 2.875 a | 1.285 a | 1.120 a | 0.827 a | 5.444 a | 4.628 a | 3.702 a | 3.237 a | 3.158 a | 3.480 a | 0.946 a | 0.908 a | 0.637 a |
| | WWM-21 | 3.580 b | 2.912 ab | 2.363 b | 1.238 c | 1.040 a | 0.769 b | 4.819 b | 3.951 b | 3.132 b | 2.897 b | 2.802 b | 3.073 b | 0.938 a | 0.893 ab | 0.543 b |
| 26 | WWM-46 | 3.299 c | 2.800 b | 2.114 b | 1.266 b | 1.001 ab | 0.782 b | 4.565 cd | 3.810 c | 2.897 c | 2.635 c | 2.775 bc | 2.707 c | 0.955 a | 0.851 b | 0.600 ab |
| WWM-66 | 3.374 c | 2.827 b | 2.246 b | 1.298 a | 0.912 b | 0.839 a | 4.673 c | 3.738 d | 3.084 b | 2.632 c | 3.108 ab | 2.681 d | 0.914 a | 0.895 a | 0.499 c |
| | cv% | 32.100 | 19.400 | 11.900 | 22.800 | 30.200 | 20.000 | 21.100 | 8.200 | 11.700 | 25.800 | 17.700 | 22.300 | 7.100 | 13.500 | 15.400 |
| | p-value | 0.027 | 0.016 | 0.041 | 0.028 | 0.045 | 0.017 | 0.011 | 0.018 | 0.031 | 0.040 | 0.035 | 0.019 | 0.087 | 0.022 | 0.037 |
| | WWM-09 | 2.407 a | 1.773 b | 1.222 b | 0.726 b | 0.576 b | 0.407 ab | 3.132 b | 2.349 b | 1.629 b | 3.325 a | 3.078 a | 3.000 a | 0.749 a | 0.594 a | 0.529 a |
| | WWM-21 | 2.427 a | 1.869 a | 1.344 a | 0.840 a | 0.614 a | 0.452 a | 3.267 a | 2.483 a | 1.797 a | 2.912 c | 3.045 a | 2.974 ab | 0.735 a | 0.478 b | 0.346 b |
| 38 | WWM-46 | 2.204 b | 1.592 d | 1.022 d | 0.717 b | 0.541 bc | 0.351 b | 2.921 d | 2.133 d | 1.373 d | 3.079 b | 2.944 b | 2.918 b | 0.755 a | 0.476 b | 0.325 b |
| WWM-66 | 2.200 b | 1.671 c | 1.088 c | 0.814 a | 0.565 b | 0.358 b | 3.014 c | 2.236 c | 1.447 c | 2.711 d | 2.960 b | 3.037 a | 0.718 b | 0.460 b | 0.316 b |
| | cv% | 24.600 | 13.400 | 17.400 | 27.000 | 16.800 | 29.600 | 17.230 | 13.600 | 9.000 | 12.300 | 18.720 | 9.200 | 11.600 | 32.000 | 16.300 |
| | p-value | 0.044 | <0.001 | 0.036 | 0.048 | 0.038 | 0.040 | <0.001 | <0.001 | <0.001 | 0.013 | 0.048 | 0.028 | 0.050 | 0.035 | 0.048 |
Table 6.
Analysis of variance with mean squares and significant tests of non-structural carbohydrates of four citron watermelon genotypes under varying temperatures and osmotic potential after five days of treatment exposure.
Table 6.
Analysis of variance with mean squares and significant tests of non-structural carbohydrates of four citron watermelon genotypes under varying temperatures and osmotic potential after five days of treatment exposure.
| Source of Variation | d.f. | TSS Cotyledon | TSS Hypocotyl | TSS Roots | Starch Cotyledon | Starch Hypocotyl | Starch Roots | NRS Cotyledon | NRS Hypocotyl | NRS Roots | MDA Cotyledon | MDA Hypocotyl | MDA Roots |
|---|
| Genotype (G) | 3 | 1394.566 ** | 12,424.07 ** | 4548.730 ** | 2.617 × 10⁻³ ** | 3.172 × 10⁻³ ** | 5.071 × 10⁻⁵ * | 2.071 ** | 48.684 ** | 490.234 ** | 5.253 ** | 1.194 ** | 10.685 ** |
| Osmotic potential (OP) | 2 | 5.592 × 10⁴ ** | 118,489.79 ** | 1.047 × 10⁶ ** | 3.792 × 10⁻³ ** | 1.282 × 10⁻⁴ | 1.366 × 10⁻³ ** | 76.060 ** | 261.225 ** | 21,380.618 ** | 27.553 ** | 8.372 ** | 77.109 ** |
| Temperature (T) | 1 | 6387.359 ** | 20,749.19 ** | 49,957.650 ** | 0.530 ** | 9.844 × 10⁻³ ** | 5.163 × 10⁻⁴ ** | 40.690 ** | 2180.426 ** | 10,713.530 ** | 16.044 ** | 11.595 ** | 12.405 ** |
| G × OP | 6 | 1174.187 ** | 7359.55 ** | 22,848.410 ** | 1.837 × 10⁻⁴ | 1.690 × 10⁻⁵ | 1.102 × 10⁻⁵ | 2.357 ** | 14.794 ** | 322.430 ** | 0.343 ** | 0.109 ** | 0.284 ** |
| G × T | 3 | 14.858 | 31.72 | 71.640 | 1.184 × 10⁻³ ** | 5.175 × 10⁻⁵ | 3.374 × 10⁻⁷ | 0.061 | 19.759 ** | 35.503 ** | 0.624 ** | 0.087 * | 0.401 ** |
| OP × T | 2 | 245.297 ** | 120.47 | 1050.970 ** | 0.140 ** | 7.042 × 10⁻⁴ ** | 2.136 × 10⁻⁶ | 1.302 ** | 304.044 ** | 625.448 ** | 0.130 * | 0.631 ** | 0.158 * |
| G × OP ×T | 6 | 24.729 * | 57.62 | 193.340 * | 4.117 × 10⁻⁴ ** | 2.345 × 10⁻⁵ | 1.735 × 10⁻⁶ | 0.406 ** | 6.206 ** | 15.130 * | 0.179 ** | 0.002 | 0.053 |
| Residual | 48 | 7.299 | 57.36 | 79.990 | 9.115 × 10⁻⁵ | 5.349 × 10⁻⁵ | 9.105 × 10⁻⁶ | 0.042 | 0.717 | 4.892 | 0.024 | 0.016 | 0.033 |
Table 7.
Analysis of variance showing mean squares and significant tests for phytosterols (stigmasterol, sitosterol, and campesterol) of 4 citron watermelon landrace accessions evaluated under combined stress (heat and osmotic stress).
Table 7.
Analysis of variance showing mean squares and significant tests for phytosterols (stigmasterol, sitosterol, and campesterol) of 4 citron watermelon landrace accessions evaluated under combined stress (heat and osmotic stress).
| Source of Variation | d.f. | Stigmasterol | Sitosterol | Campesterol | Total Phytosterol |
|---|
| Genotype (G) | 3 | 0.014 ns | 0.002 ns | 0.016 * | 0.082 ns |
| Temperature (T) | 1 | 7.835 ** | 7.882 ** | 5.581 ** | 63.507 ** |
| Osmotic potential (OP) | 2 | 0.634 ** | 0.389 ** | 0.788 ** | 5.249 ** |
| Seedling axis (SA) | 1 | 4.929 ** | 1.679 ** | 3.453 ** | 28.882 ** |
| G × T | 3 | 0.003 * | 0.004 ** | 0.003 ns | 0.013 ns |
| G × OP | 6 | 0.003 ns | 0.003 ns | 0.003 ns | 0.006 ns |
| T × OP | 2 | 0.237 ** | 0.172 ** | 0.039 * | 1.185 ** |
| G × SA | 3 | 0.002 ns | 0.001 ns | 0.004 * | 0.007 ns |
| T × SA | 1 | 0.767 ** | 0.935 ** | 0.488 ** | 6.460 ** |
| OP × SA | 2 | 0.163 ** | 0.188 ** | 0.024 * | 0.752 |
| G × T × OP | 6 | 0.005 ns | 0.003 ns | 0.006 * | 0.022 ns |
| G × T × SA | 3 | 0.005 ns | 0.004 | 0.003 * | 0.020 ns |
| G × OP × SA | 6 | 0.004 ns | 0.009 ns | 0.003 * | 0.030 ns |
| T × OP × SA | 2 | 0.296 ** | 0.130 ** | 0.148 ** | 1.471 ** |
| G × T × OP × SA | 6 | 0.003 * | 0.004 * | 0.008 * | 0.020 ns |
| Residual | 96 | 0.013 | 0.010 | 0.017 | 0.067 |
Table 8.
Mean values for stigmasterol, sitosterol, and campesterol in citron watermelon seedling axis (cotyledon and roots) under different temperatures and osmotic potential.
Table 8.
Mean values for stigmasterol, sitosterol, and campesterol in citron watermelon seedling axis (cotyledon and roots) under different temperatures and osmotic potential.
| Cotyledon | | | | | Root | | | | |
|---|
| | | [−0.05 MPa] | [−0.09 MPa] | [−0.19 MPa] | [−0.05 MPa] | [−0.09 MPa] | [−0.19 MPa] |
|---|
| Temperature | Genotype | Stig | Sito | Camp | Stig | Sito | Camp | Stig | Sito | Camp | Stig | Sito | Camp | Stig | Sito | Camp | Stig | Sito | Camp |
|---|
| | WWM-09 | 0.103 a | 0.123 b | 0.075 a | 0.180 a | 0.143 a | 0.201 b | 0.205 c | 0.160 c | 0.241 b | 0.340 b | 0.109 c | 0.281 a | 0.375 a | 0.223 a | 0.305 c | 0.535 a | 0.258 a | 0.617 a |
| 26 °C | WWM-21 | 0.080 bc | 0.115 c | 0.063 b | 0.160 bc | 0.113 c | 0.196 c | 0.216 b | 0.183 a | 0.242 b | 0.309 c | 0.137 b | 0.242 b | 0.281 d | 0.207 b | 0.301 c | 0.434 c | 0.262 a | 0.488 c |
| WWM-46 | 0.095 b | 0.123 b | 0.078 a | 0.153 c | 0.125 b | 0.195 c | 0.193 d | 0.163 c | 0.238 c | 0.313 c | 0.145 b | 0.211 c | 0.348 bc | 0.227 a | 0.355 b | 0.461 b | 0.238 b | 0.414 d |
| | WWM-66 | 0.103 a | 0.135 a | 0.068 b | 0.173 ab | 0.138 ab | 0.216 a | 0.236 a | 0.173 b | 0.293 a | 0.410 a | 0.152 a | 0.250 b | 0.355 b | 0.148 c | 0.395 a | 0.422 d | 0.246 b | 0.563 b |
| | cv% | 22.600 | 12.400 | 19.300 | 14.200 | 11.900 | 19.40 | 17.400 | 11.400 | 34.300 | 32.900 | 22.800 | 20.000 | 18.400 | 22.400 | 13.700 | 23.400 | 10.600 | 14.500 |
| | p-value | 0.032 | <0.001 | 0.017 | <0.001 | 0.041 | 0.038 | 0.038 | 0.015 | 0.027 | <0.001 | 0.035 | 0.047 | 0.044 | 0.027 | 0.039 | 0.021 | 0.021 | <0.001 |
| | WWM-09 | 0.314 a | 0.424 a | 0.301 a | 0.479 b | 0.441 a | 0.488 a | 0.713 bc | 0.552 c | 0.658 b | 0.823 a | 0.505 d | 0.720 c | 1.240 b | 1.059 b | 1.059 a | 1.003 a | 0.886 a | 0.897 b |
| 38 °C | WWM-21 | 0.225 c | 0.331 c | 0.250b | 0.429 c | 0.407 b | 0.428 c | 0.725 b | 0.577 a | 0.666 b | 0.733 c | 0.567 b | 0.768 b | 1.335 a | 1.135 a | 0.969 b | 0.963 c | 0.775 c | 0.927 a |
| WWM-46 | 0.301 b | 0.369 b | 0.242 b | 0.390 a | 0.390 c | 0.454 b | 0.700 c | 0.539 d | 0.598 c | 0.740 c | 0.547 c | 0.720 c | 1.142 d | 0.976 c | 0.899 b | 0.969 c | 0.865 b | 0.899 b |
| | WWM-66 | 0.301 b | 0.339 c | 0.216 c | 0.424 c | 0.446 a | 0.454 b | 0.743 a | 0.560 b | 0.675 a | 0.789 b | 0.657 a | 0.775 a | 1.218 c | 1.052 b | 1.045 a | 0.976 b | 0.879 b | 0.865 c |
| | cv% | 19.900 | 15.400 | 8.200 | 18.600 | 12.800 | 23.100 | 9.900 | 19.200 | 18.200 | 32.400 | 22.600 | 21.100 | 17.300 | 32.100 | 13.400 | 9.500 | 16.400 | 11.000 |
| | p-value | 0.009 | 0.019 | 0.005 | 0.008 | <0.001 | 0.032 | 0.027 | <0.001 | 0.039 | 0.015 | <0.001 | <0.001 | 0.031 | <0.001 | 0.036 | 0.017 | 0.020 | <0.001 |
Table 9.
Summary of factor loadings, eigenvalue, percent, and cumulative variation for dry matter, pigments, non-structural carbohydrates, malondialdehyde, and phytosterols among 4 citron watermelon accessions under varying temperatures and osmotic potential.
Table 9.
Summary of factor loadings, eigenvalue, percent, and cumulative variation for dry matter, pigments, non-structural carbohydrates, malondialdehyde, and phytosterols among 4 citron watermelon accessions under varying temperatures and osmotic potential.
| | [−0.05 MPa; 26 °C] | [−0.09 MPa; 26 °C] | [−0.19 MPa; 26 °C] | [−0.05 MPa; 38 °C] | [−0.09 MPa; 38 °C] | [−0.19 MPa; 38 °C] |
|---|
| Traits | PC 1 | PC 2 | PC 3 | PC 1 | PC 2 | PC 3 | PC 1 | PC 2 | PC 3 | PC 1 | PC 2 | PC 3 | PC 1 | PC 2 | PC 3 | PC 1 | PC 2 | PC 3 |
|---|
| ADGR | 0.658 | 0.682 | 0.318 | 0.273 | 0.920 | −0.282 | −0.280 | 0.895 | −0.347 | −0.178 | −0.976 | 0.128 | 0.582 | −0.685 | −0.438 | −0.654 | 0.749 | −0.108 |
| CDM | 0.773 | −0123 | −0.623 | 0.870 | 0.269 | −0.414 | 0.603 | 0.795 | −0.067 | 0.715 | −0.457 | 0.529 | 0.885 | −0.460 | 0.070 | 0.984 | −0.149 | 0.096 |
| HDM | 0.506 | 0.631 | 0.588 | 0.717 | −0.633 | 0.292 | 0.584 | −0811 | −0.033 | −0.536 | −0.571 | −0.622 | 0.969 | −0.177 | −0.171 | 0.135 | 0.985 | 0.105 |
| RDM | 0.746 | 0.286 | 0.602 | 0.718 | 0.694 | −0.050 | 0.952 | 0.203 | 0.229 | 0.675 | −0.648 | 0.352 | 0.825 | 0.167 | 0.539 | 0.704 | 0.453 | −0.547 |
| RWC | 0.973 | −0.225 | 0.053 | 0.917 | −0.399 | −0.015 | 0.694 | −0.180 | 0.697 | 0.917 | −0.348 | −0.197 | 0.892 | −0.368 | −0.263 | 0.845 | 0.012 | 0.535 |
| Chl a | 0.999 | −0.052 | −0.008 | 0.992 | 0.108 | 0.061 | 0.983 | 0.156 | −0.096 | 0.909 | 0.088 | −0.408 | 0.839 | 0.526 | −0.141 | 0.925 | 0.282 | −0.256 |
| Chl b | 0.107 | −0.514 | 0.851 | 0.882 | −0.222 | −0.415 | 0.469 | 0.066 | 0.881 | 0.157 | 0.986 | 0.063 | 0.700 | 0.700 | −0.141 | 0.896 | 0.398 | −0.197 |
| Chl (a+b)
| 0.995 | −0.087 | 0.048 | 0.999 | 0.030 | −0.036 | 0.988 | 0.154 | −0.008 | 0.817 | 0.483 | −0.314 | 0.814 | 0.563 | −0.141 | 0.918 | 0.311 | −0.245 |
| Chl (a/b)
| 0.987 | 0.033 | −0.154 | 0.532 | 0.553 | 0.641 | 0.908 | 0.168 | −0.384 | 0.450 | −0.839 | −0.307 | 0.996 | −0.010 | −0.083 | 0.325 | −0.792 | −0.517 |
| Carotenoids | 0.283 | 0.959 | 0.012 | 0.560 | 0.829 | −0019 | 0.648 | −0.637 | −0.418 | 0.001 | −0.789 | −0.614 | 0.767 | −0.639 | 0.058 | 0.672 | −0.384 | 0.633 |
| TSS | −0.671 | 0.455 | 0.585 | −0.840 | 0.491 | −0.232 | 0.750 | 0.122 | −0.650 | −0.926 | −0.375 | 0.033 | −0.377 | 0.926 | 0.022 | 0.810 | 0.323 | 0.489 |
| Starch | −0.722 | 0.686 | 0.090 | −0.836 | −0.544 | −0072 | −0.853 | −0.466 | −0.234 | −0.913 | 0.018 | −0.407 | −0.979 | −0.157 | −0.129 | −0.548 | 0.427 | 0.719 |
| NRS | 0.728 | −0.684 | 0.051 | 0.795 | −0.144 | 0.589 | −0.661 | 0.693 | 0.287 | 0.962 | −0.153 | 0.227 | −0.035 | −0.893 | 0.449 | −0.871 | 0.202 | −0.448 |
| MDA | −0.748 | −0.663 | 0.031 | −0.917 | 0.203 | 0.345 | −0.885 | 0.097 | 0.456 | −0.809 | −0.108 | 0.578 | −0.868 | 0.305 | 0.391 | −0.912 | 0.007 | −0.409 |
| Stigmasterol | −0.067 | −0.795 | 0.602 | 0.520 | 0.001 | 0.854 | 0.986 | −0.156 | 0.064 | 0.172 | −0.655 | 0.735 | 0.876 | 0.476 | 0.079 | 0.471 | −0.826 | −0.309 |
| Sitosterol | −0.897 | −0.360 | 0.257 | 0.713 | −0.688 | 0.134 | 0.024 | 0.911 | −0.411 | −0.248 | 0.153 | 0.957 | 0.716 | 0.607 | 0.344 | −0.259 | −0.915 | 0.310 |
| Campesterol | 0.889 | −0.395 | 0.233 | −0.605 | 0.188 | 0.774 | 0.632 | 0.455 | 0.628 | 0.971 | 0.238 | 0.029 | 0.562 | −0.259 | 0.786 | 0.881 | 0.107 | −0.461 |
| Eigenvalue | 9.501 | 4.712 | 2.787 | 10.080 | 4.120 | 2.799 | 9.460 | 4.434 | 3.107 | 8.152 | 5.252 | 3.596 | 10.427 | 4.803 | 1.770 | 9.296 | 4.727 | 2.978 |
| Variability (%) | 55.891 | 27.718 | 16.392 | 59.296 | 24.237 | 16.467 | 55.646 | 26.080 | 18.274 | 47.955 | 30.893 | 21.152 | 61.337 | 28.253 | 10.410 | 54.680 | 27.805 | 17.515 |
| Cumulative (%) | 55.891 | 83.608 | 100 | 59.296 | 83.533 | 100 | 55.646 | 81.726 | 100 | 47.955 | 78.848 | 100 | 61.337 | 89.590 | 100 | 54.680 | 82.485 | 100 |


 ,
, 


