1. Introduction
The automotive industry is experiencing profound changes, driven by global trends and technological developments. For the purpose of this research, the important relevant trends are the growth [
1] and expansion of metropoles and megacities, presenting challenges in terms of urban mobility and parking. Traditional last-mile delivery systems face challenges such as: traffic congestion, limited parking spaces, the need for high-speed travel across town, and the need for sustainable transportation solutions. The trend toward more home working creates an increase in e-commerce, and increased demand for doorstep or close vicinity [
2] logistics delivery services. The initial response to the call for zero-emission transportation is through vehicle electrification. Solutions include new types of vehicles, the increasing demand for electric vehicles (EV), and the call for the design of a new, agile vehicle that has a small road and parking footprint and the ability to meet delivery logistics and personal transportation needs. In recent years, the industry is developing new types of vehicles (such as NURO, REE Automotive, Arrival, Mobilize Bento, and others, as well as mobility service solutions. M. Zhao et al. [
3] published a survey specific for autonomous delivery vehicles.
Megacities are typically composed of regional clusters, rather than being a continuous expanse of urban buildings. This architecture involves low-speed roads within the clusters and the neighborhoods on the one hand, and relatively high-speed travel between the clusters, forming a network of highways within the megacity. Most last-mile solutions and neighborhood electric vehicles (NEV) are not capable of driving safely on the interconnecting roads between the megacity clusters. To meet this challenge, there is a need for innovative vehicle architecture and design.
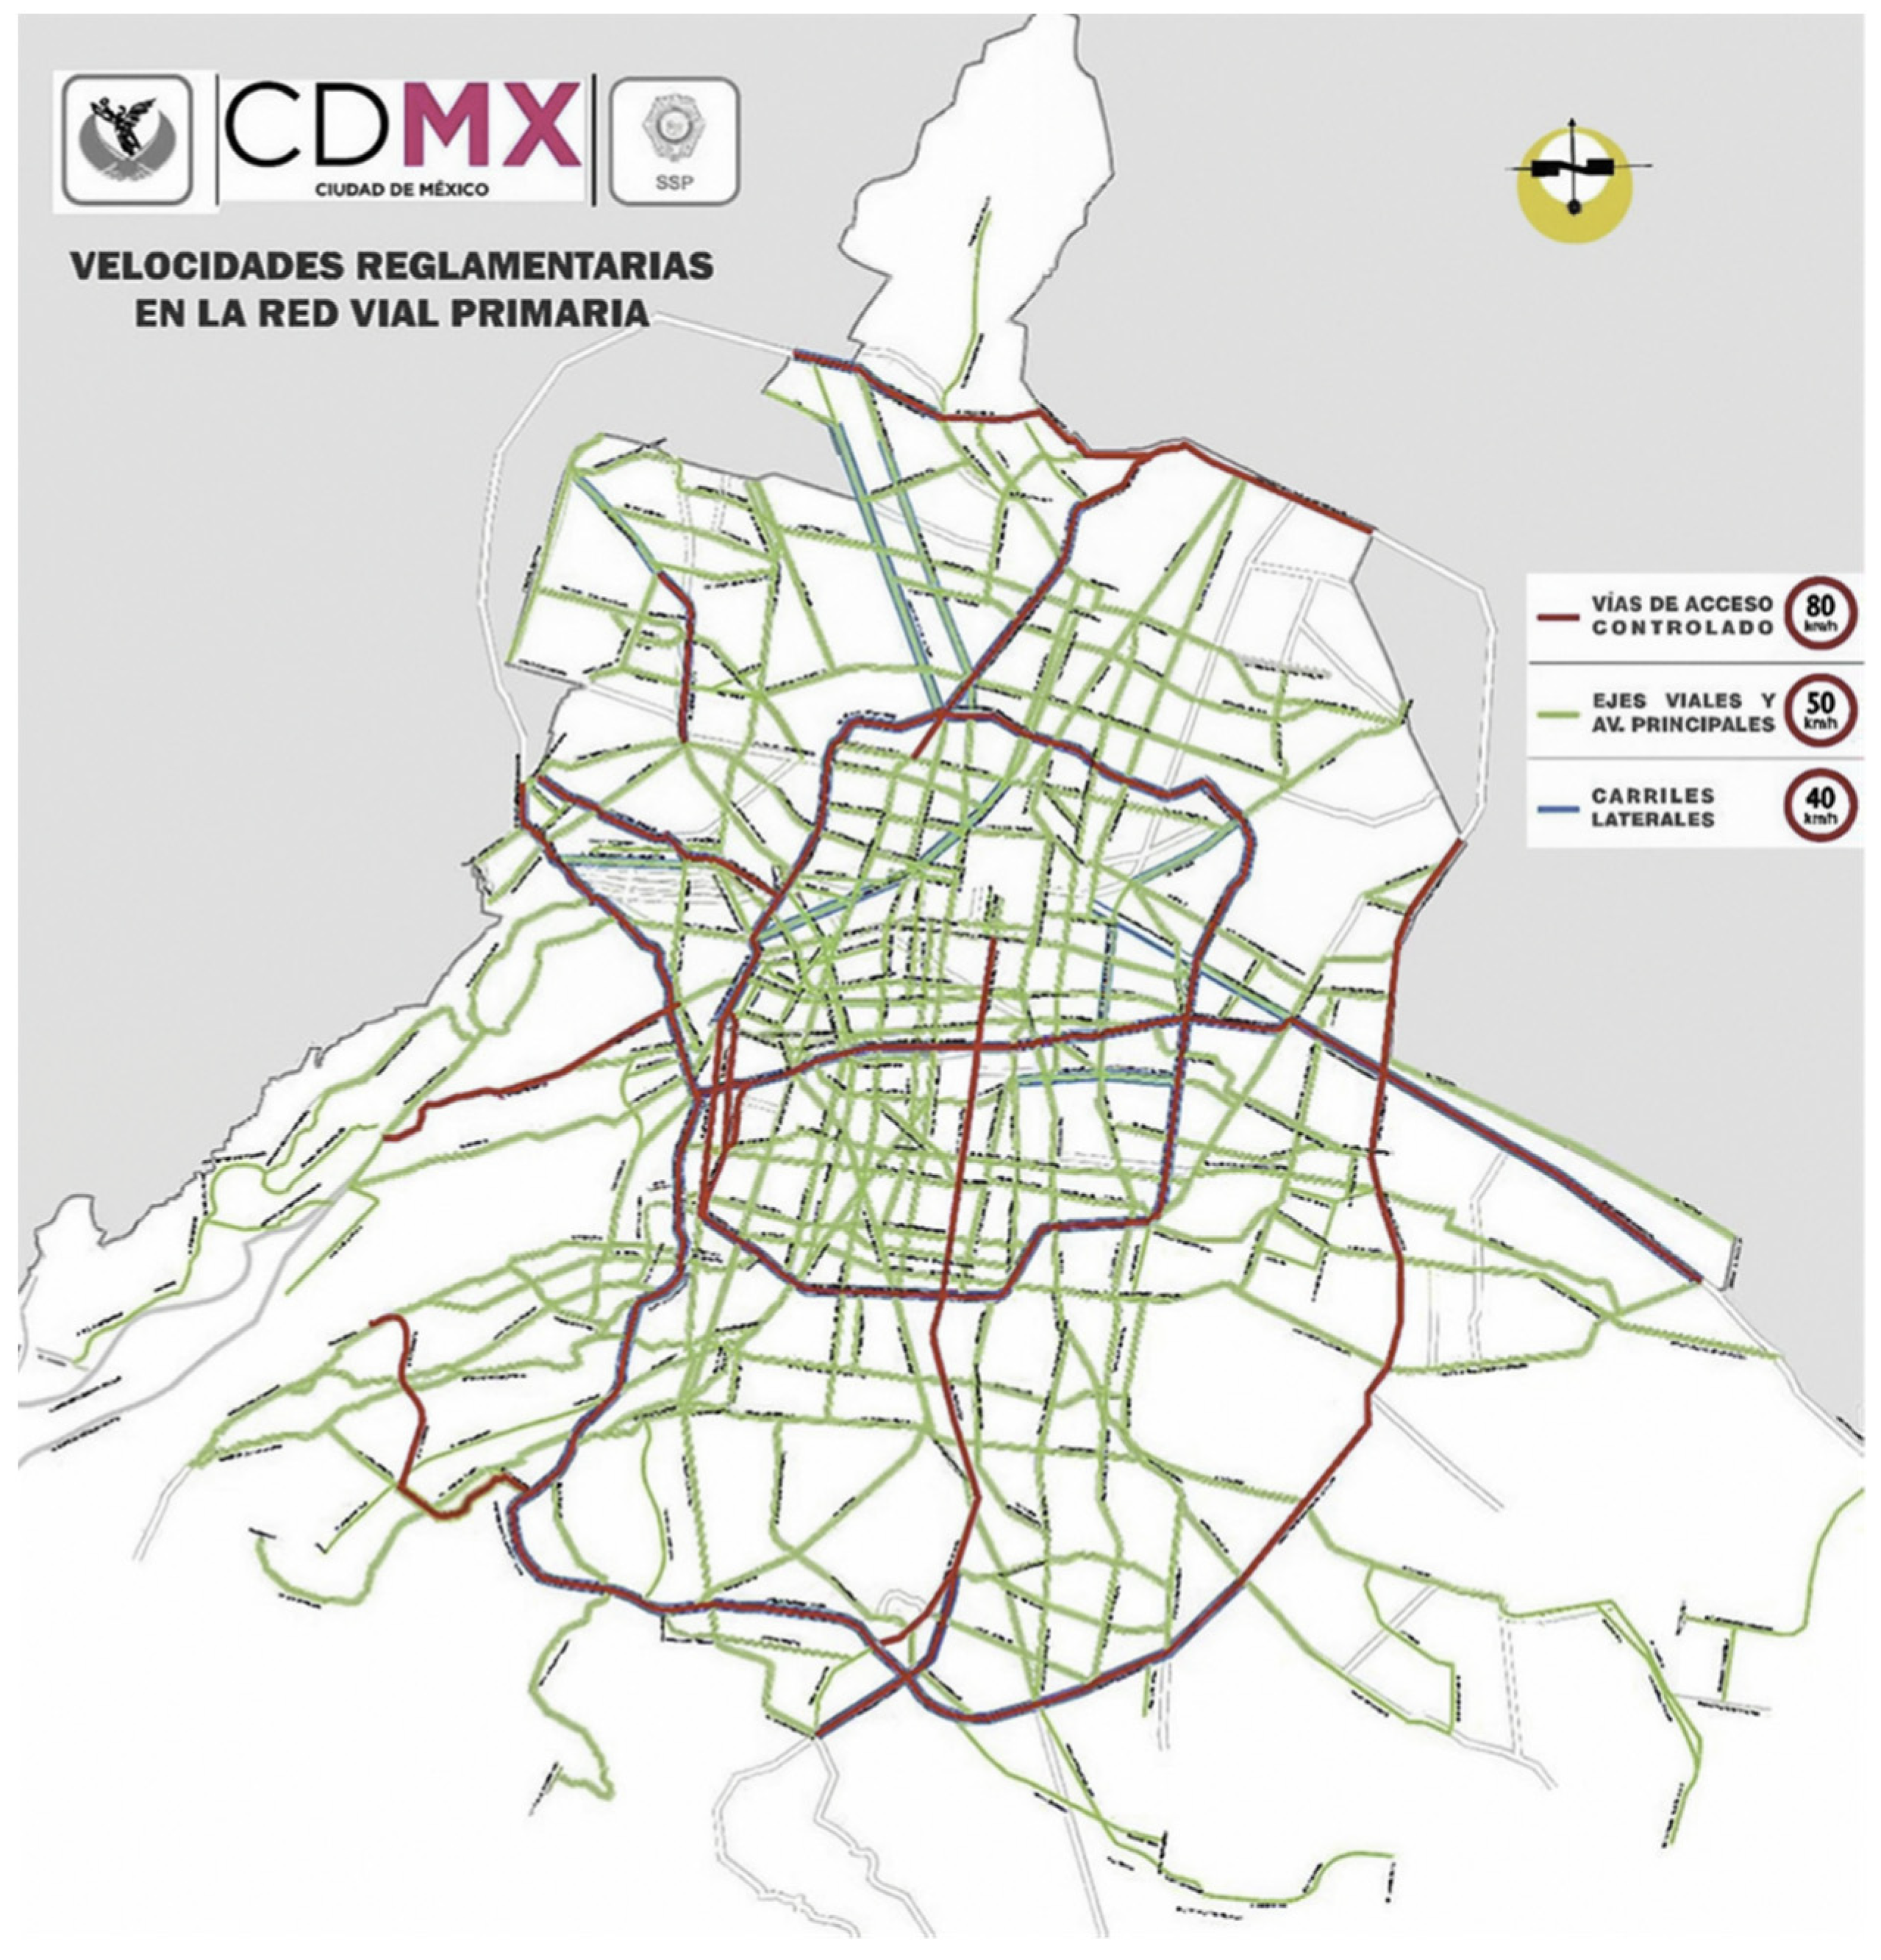
Figure 1 shows a speed limit map of Mexico City [
4] as an example of the road topology of such a city. The red lines on the map indicate the interconnecting roads which have a speed limit of 80 km/h; the other roads are limited to 50 km/h or less.
The speed difference between streets within neighborhoods and internal megacity highways is significant. To maintain stability at 80 km/h and more, especially when considering rollover sideways, a traditional vehicle needs to have a considerable width. This width allows two occupants to sit side by side. On the other hand, within the neighborhoods, especially in city centers, the transportation infrastructure presents quite different challenges and requirements, which a side-by-side vehicle will struggle to meet. The main issues here are traffic congestion and limited parking space. In this environment, more agile motorscooters and micromobility solutions have the advantage. To overcome these transportation challenges, infrastructure for micromobility occupies space formerly taken by cars on the streets, exacerbating the situation for traditional four-wheeled vehicles. Furthermore, there is a trend to restrict car traffic in city centers, transforming them into car-free zones [
5]. The neighborhoods and the highways of megacities demand two conflicting extremes of driving. To bridge the gap between road-going vehicles and light scooters, end-point distribution stations have become a common solution. A vehicle with a small road and parking footprint and zero-emission, which is capable of high speeds, can meet the requirements of both the neighborhoods and of the megacity highways.
The COVID-19 pandemic reduced the use of public transportation and shared mobility and increased the use of personal transportation. The pandemic strengthened the trend for people to work from home, making use of delivery logistics. The rapid development in autonomous vehicles technology and shift to mobility as a service creates new opportunities for novel solutions.
Currently, the most popular urban delivery solutions are motorscooters, low-speed electric vehicle (LSEVs), N1/M1 category vehicles, and N2 category vans. Motorscooters usually deliver a small number of packages, and occasionally just a single package, per trip. LSEVs N1/M1 category vehicles have the capability of carrying between 0.5 and 3 cubic meters (m3) of cargo, and N2 category vans can carry 1 to 4 tons of goods. These vehicle categories embody deeply established design concepts, having evolved over more than a century of development and deployment. However, the L-category enclosed vehicle, with a cargo capacity in the range exceeding 1 m3, still has significant scope for development.
Autonomous delivery vehicles emphasis the strong ties between Industry 4.0 and last-mile logistics (LML). LML can be defined as delivering to the doorstep of the end customer. LML is regarded as the most sensitive segment of any supply chain. Svetlana et al. considers three types of autonomous vehicles for LML: drones with cargo capacity limited to 50 kg, robotic vans with cargo capacity in the range of 2 to 5 tons, and droids with cargo capacity limited to 50 kg [
6]. The vehicle concept that we investigate in this paper fills that gap in the range from 50 kg up to 300 kg.
The solutions that are being developed are still loyal to the classic four-wheeled vehicle architecture layout, whose width can accommodate two occupants side by side. This design limits their potential impact on traffic, environmental issues, and economic efficiency. Our view is that a vehicle that combines both the agility of narrow vehicles, such as the abovementioned scooters, and the advantages of double-track vehicles—especially their high cargo capacity—would have great potential both for significantly reducing costs and for mitigating negative environmental impacts.
In this paper, we introduce the concept of a delivery vehicle which we refer to as the “narrow-track leaning vehicle”. This vehicle has the road signature of a motorscooter and the cargo capacity of a small, traditional four-wheeled vehicle. The vehicle also has the potential for completely autonomous operation.
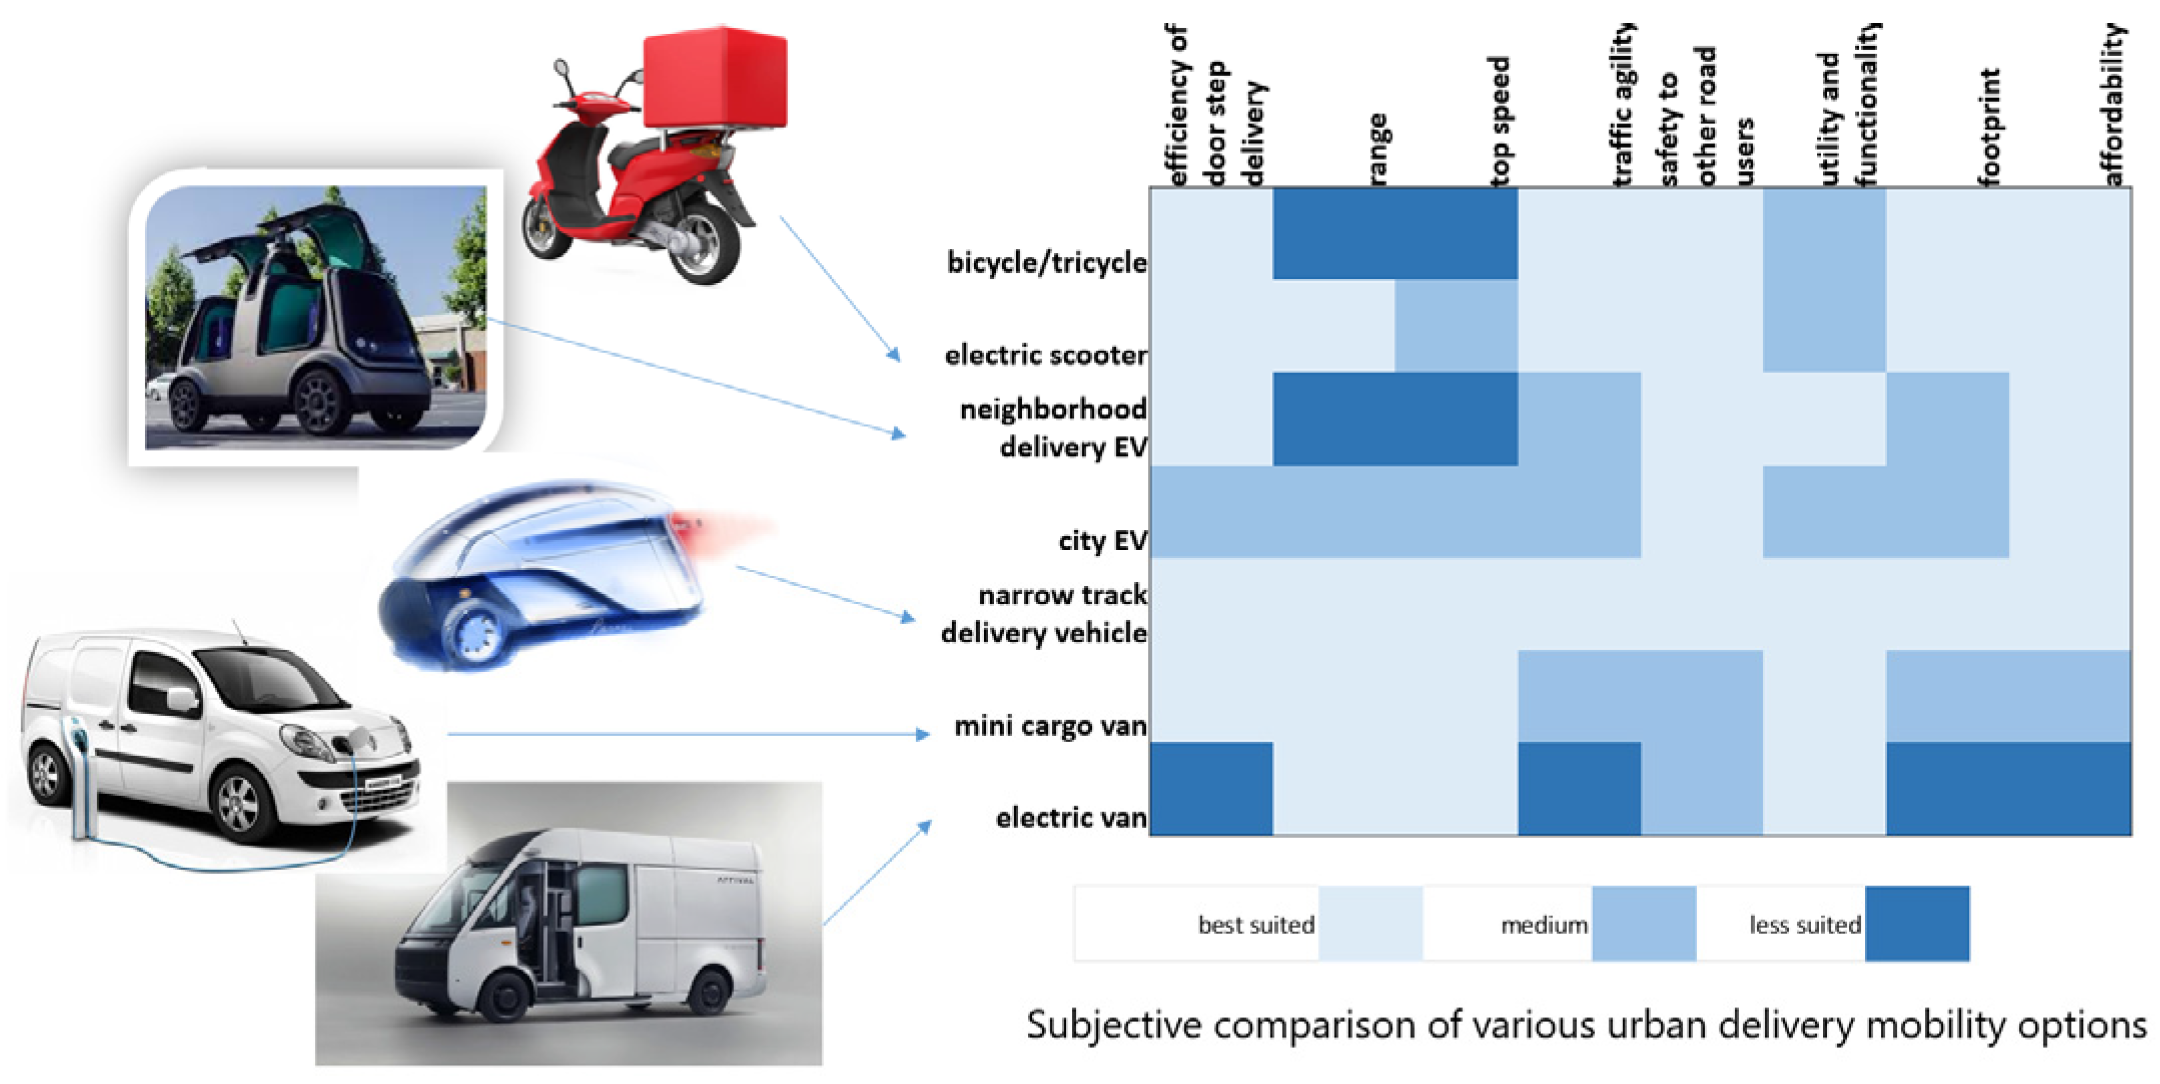
Figure 2 shows a subjective matrix of urban delivery vehicles, their attributes, and their level of suitability for meeting various requirements. We adopted the format of the matrix from the book “Reinventing the Automobile: Personal Urban Mobility for the 21st Century” [
7]. The levels in which the vehicle satisfies each attribute is based on the author’s understandings based on discussions with delivery operators while being a product manager, and discussions with colleagues and researchers. It supports the argument that a small narrow-track leaning vehicle meets the requirements for urban vehicles better than current alternatives.
The design of new vehicle concepts is significantly influenced by the requirements and constraints of society in the immediate future, as outlined above. In this context, we pose the following question: How can an aggregate method, comprising various design methodologies, be effectively utilized in the conceptual design of innovative vehicles to address specific challenges as perceived by end customers, with a demonstration using an urban delivery vehicle concept? The paper also suggests a specific solution for package delivery vehicles for metropolitan environments. In the course of presenting a flexible new concept, the study explores the packaging, energy, and financial optimization of the suggested vehicle concept. This provides the reader with an overview of the suggested solution compared to other currently available solutions.
2. Background
There is no explicit agreement on the definition and scope of last-mile delivery, mainly due to different perspectives. We adopted the definition of last-mile delivery as the final step of transiting orders to the right customers [
8]. Many last-mile vehicles, such as drones and droids, are limited in speed below 50 km/h and range up to 30 km, so they are mainly suitable for inner city clusters. One may confuse the definition of last-mile as low speed and range. In this paper, we named the use cases ”mid-mile” and ”metropole”. Both are within the above definition of last-mile delivery. The design goal of conceptual design is to meet the customer’s requirements. The potential customers of the vehicle discussed in this paper are usually logistics operators or third-party logistics (3PL) providers for last-mile delivery (LMD). Švadlenka et al. describe six evaluation criteria for 3PL service provider selection [
9]. Among these criteria, the following are vehicle-related: distribution cost—the cost that 3PL should require for the distribution process; on-time delivery—whether the 3PL respects the promised distribution timeframes; and flexibility of distribution—the ability to react faster to market turbulences. These criteria lead the focusing on defining the vehicle concept and setting the goals for the design method.
Additionally, concerning the customer’s criteria, there is the issue of environmental protection. It is important to note that last-mile delivery was already considered the most polluting, inefficient, and costly component of the supply chain, even before the boom of e-commerce [
10]. The importance of cost and pollution underlines the design goals of low energy consumption. In this paper, we suggest a new mode of urban delivery vehicle that fills the gap between the droids and the vans, not only in the cargo capacity. It does so while increasing the traffic agility of the vehicle, delivering more packages per day, and increasing the delivery range of the droids from being limited to within a neighborhood or city cluster to providing from a supplier or logistic center across the city to the end customer doorstep.
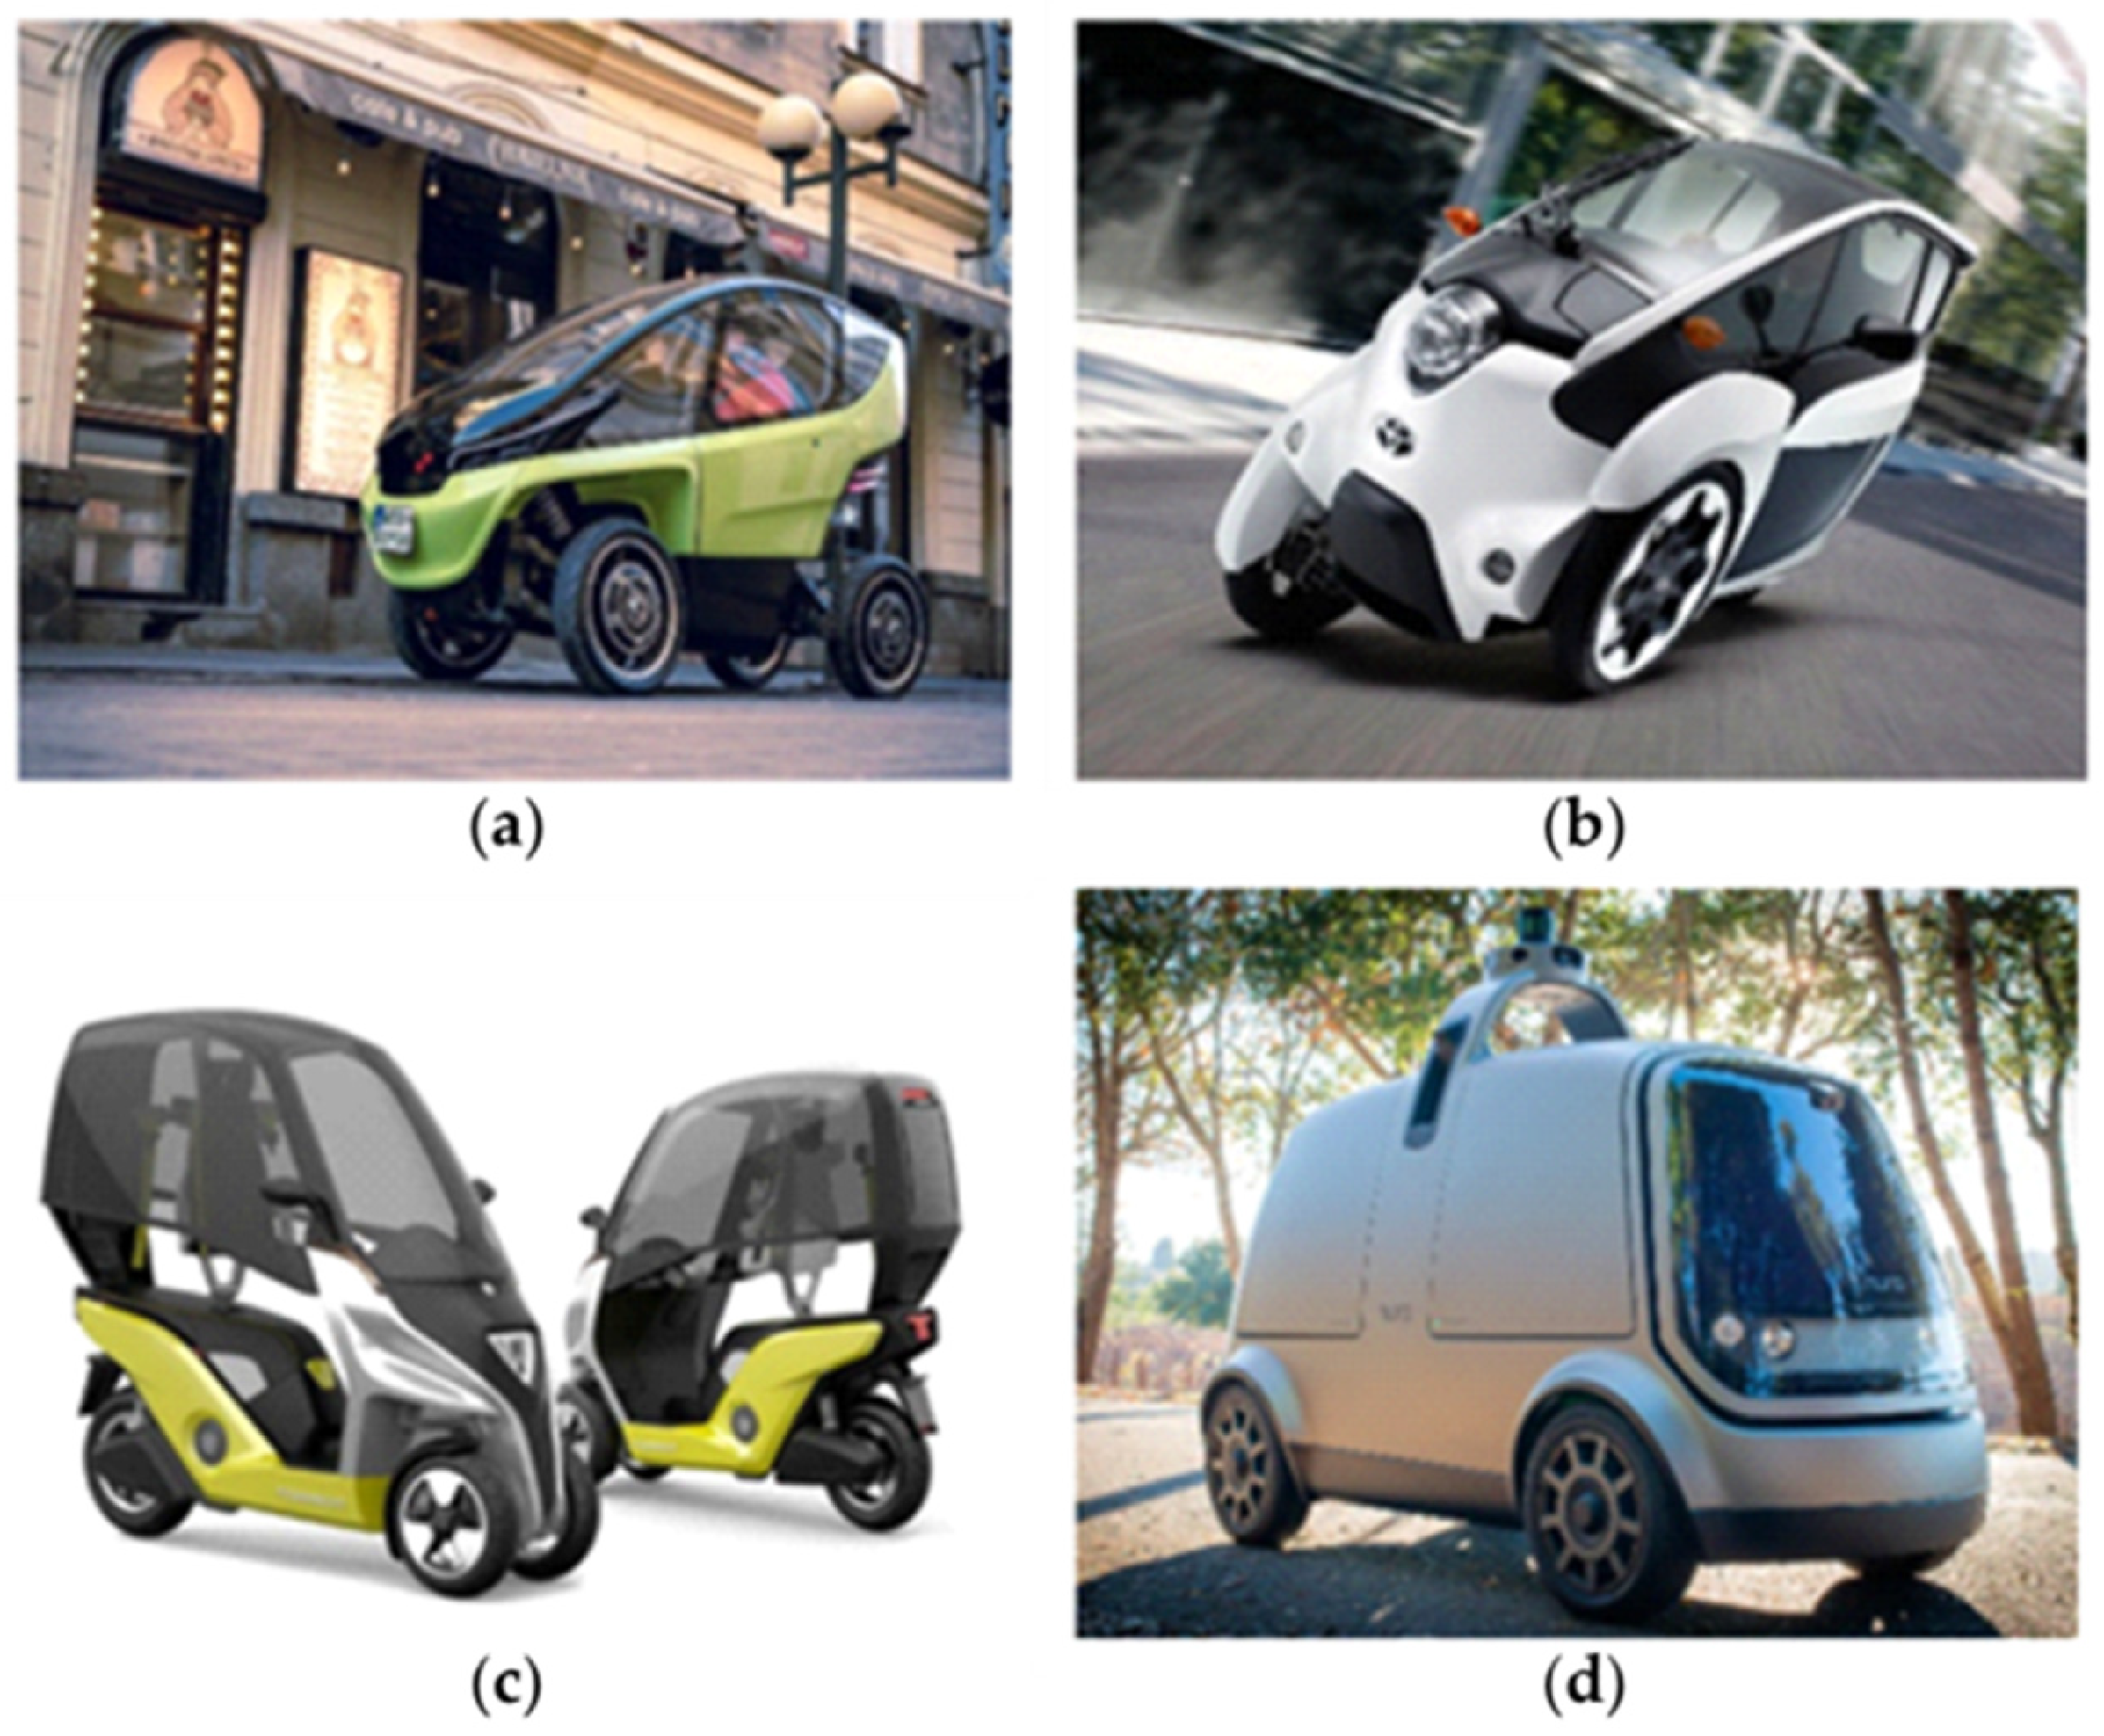
The search is ongoing for an efficient nonmotorcycle means of transportation that is superior to a vehicle with “side-by-side” seating arrangement. Toyota, the most significant player in this field, is attempting to develop a narrow tilting vehicle called the i-Road [
11]. This vehicle, with its low top speed, is designed for a last-mile passenger transportation solution. The i-Road is being used in pilot road trials in Tokyo and Grenoble. Toyota has not announced a launch date for general market availability.
An example of a narrow-track tilting vehicle already on the market is the Triggo [
12] manufactured in Poland. This vehicle’s unique feature is the adjustable width of the front axle.
Currently, all the solutions for autonomous delivery are based on four-wheeled vehicles. For example, Nuro has a vehicle based on a golf cart that is suitable for neighborhood conditions only. See
Figure 3 for examples of vehicles. Other companies, such as the Swedish company Einride, use bigger vehicles, ranging from minivans up to large trucks. Such four-wheeled vehicles are suitable for last-mile delivery with megacity range and speed and may be used for delivery between logistic providers and suppliers.
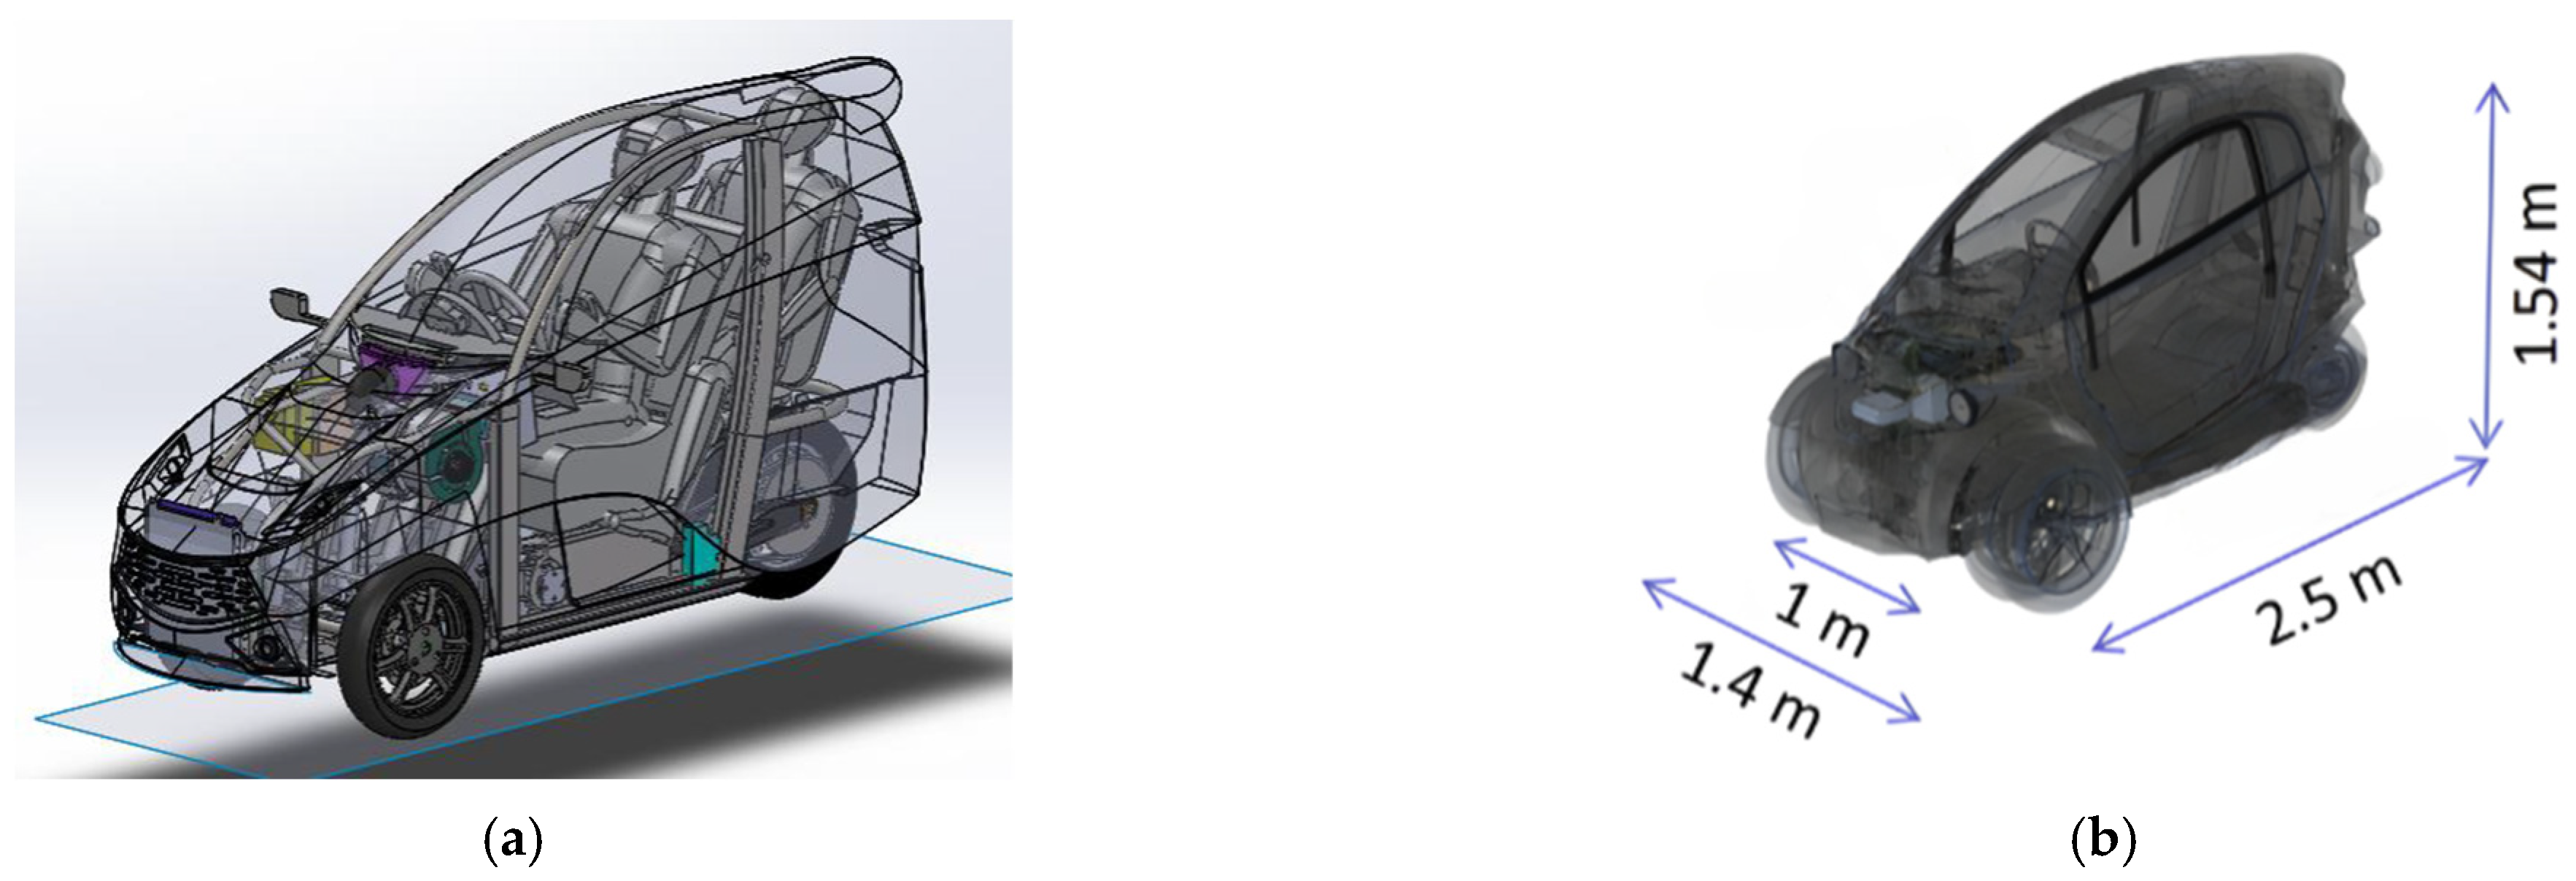
Two academic studies explored the possibility of offering safe and comfortable L5e-category vehicles for one or two passengers. The studies included prototype building and simulations. A consortium, working under Project RESOLVE [
13], within the framework of Horizon 2020 GV-2014, addressed many of the concepts and technological issues. The other study is Project Hagar [
14] under the aegis of Afeka Academic College, led by the first author of this paper. Both projects worked with similar concepts and reached similar conclusions. Concept previews are shown in
Figure 4.
Autonomous narrow-track leaning vehicles are uncommon and may give rise to some skepticism because of their inherent instability at low speeds. Nevertheless, much work has been invested in them, both by academic researchers and by industry. For example, motorcycle maker BMW demonstrated a fully self-driving motorcycle based on the BMW R 1200 GS [
15], Honda developed the Honda Riding Assist self-balancing motorcycle that can practically self-drive. Papers by Yi et al. [
16] and Hara et al. [
17] provide a good representation of developments so far. A narrow-track vehicle is stable when maneuvering at high speed, when driving in a straight line, and when it leans sideways toward the center of a turn, as do all motorcycles. However, at low speed a motorcycle is unstable, thus requiring constant control to maintain balance. This issue is satisfactorily resolved through the use of a narrow-track vehicle with two front wheels. The roll of the tilting motion of the vehicle can easily be restrained by a mechanical apparatus allowing the two front wheels to move vertically, in opposing directions to the other.
Design Methods Review
Methodologies for designing and evaluating different vehicle concepts for different purposes have a relatively long history of development. These approaches and methods aim at optimizing the performance of the resulting vehicle for specific purposes. This may be for future transport in general, or more specifically for heavy-duty vehicles, buses, or electric vehicles. The methodologies usually include environmental and economic evaluation of different vehicle concepts. They often also include evaluations of the operational characteristics and parameters of the vehicles.
As early as 2012, Wiedemann et al. published a paper [
18] asserting that electric vehicle concepts can be optimized based on customer-relevant characteristics. These characteristics include range, acceleration behavior, lateral dynamics, and cost-effectiveness. The authors showed that it is possible to determine the necessary and optimal performance levels by converting the technical values into standardized customer satisfaction performance metrics using correlation functions. The simulation model optimization process can then be used to find the solution best suited to cost constraints and customer requirements when the technical parameters are changed. This approach offers the possibility of “analytical prototyping”, with advantages such as cost and time reductions, and it can be applied to any vehicle and product. A paper by Fuchs and Lienkamp [
19] presented a mass model for battery-electric vehicles to optimize vehicle design and technology selections. The model considers the influence of design and technology on vehicle weight and energy consumption. The authors used this approach to analyze thermal protection glass and its impact on energy consumption. The model can be used to analyze the impact of design changes on vehicle weight, energy consumption, and the overall lifecycle impact on CO
2 emissions. Stocker et al. [
20] asserted that vehicle manufacturers are trying to strike a balance between highly individualized special vehicles and a high degree of standardization in their product portfolio. A critical aspect in the design of commercial vehicle concepts is the development of market-oriented architectural standards through standardized vehicle configurations. The paper, therefore, presented a wide range of architectural standards related to the specific modularization of chassis components. Felgenhauer et al. [
21] developed the “Parametric Automotive Concept Engineering” method, together with a software tool to automate the generation of vehicle architectures and the derivation of modular systems within the vehicle front end. Using analytical design procedures, Angerer et al. [
22] presented a model for determining electric vehicle weight, cost, and powertrain component dimensions.
Around 2019, considerations related to the development of autonomous driving started to become important issues in the exploration of methods and approaches for the design and development of vehicle concepts and architectures. Koenig et al. [
23] discuss the impact of autonomous driving on the mobility industry and the need to adapt the automotive product development process to achieve optimal autonomous vehicle concepts. The paper concludes that driving cycles, and consequently driver behavior, can significantly impact vehicle design. These insights can contribute to the formulation of autonomous vehicle concepts that meet the needs of different stakeholders. In a paper by Schockenhoff et al. [
24], the authors suggest that a method featuring identifiable consumer-relevant characteristics could potentially become the basis for adapting the automotive product development process for autonomous vehicles. In a review article by Nicoletti et al. [
25], the authors analyzed the current development process and its modifications in the field of vehicle concepts. The article highlights the change in the vehicle development process, mainly caused by the megatrends of sustainability and automation. Wolff et al. [
26] focused on the scalable lifecycle inventory (LCI) for heavy-duty trucks and powertrain components. They concluded that the lithium-ion battery should be considered as the most critical component within electrified powertrain concepts. Nicoletti et al. (2020) [
27] identified and published a minimum set of design parameters. This was derived from the current state of vehicle development, based on a structured comparative literature review, and can be used as a guide to define battery/electric vehicle architectures at an early stage of development. Pathak et al. 2021 [
28] introduced a framework for optimizing the design of autonomous electric buses in public transport into the problem of vehicle concept design. In the paper, the authors consider quality of service, operating costs, and stakeholder value. The study by Wolff et al. [
29] proposed a multidisciplinary approach to vehicle design optimization that combines ecological and economic evaluation to recommend environmentally efficient vehicle concepts suitable for future heavy-duty transport. Schockenhoff et al. [
30] presented a development process that focuses on autonomous vehicle concepts centered on the needs of 21st-century users. The authors updated the definition and the development process for autonomous vehicle concepts and incorporated a sharing model. König et al. [
31] presented a method for designing packaging for autonomous vehicles that considers different configurations and evaluates the efficiency of the resulting packaging. For reading ease,
Table 1 below summarizes the design methods review.
This overview highlights the considerable amount of work already invested in designing, developing, and optimizing vehicle concepts and architectures. The development of these various methods has crystallized into comprehensive approaches that take account of a combination of environmental, economic, and operational characteristics for vehicles. Package efficiency emerges as a crucial design parameter, especially in utility applications that include delivery services. Autonomous driving emerges as an essential parameter influencing the approach to vehicle design. In electric vehicles, two essential elements, the battery and the driver, are considered as strongly influencing the design of the vehicle. The novelty of this research is the integration of several methods mentioned above and applying them to a technoeconomic calculator that facilitates the optimization of the cost of delivery and energy consumption. Furthermore, the existing body of work has not explored the promising concept of the narrow-track leaning autonomous delivery vehicle, with its potential as a highly efficient and effective solution for delivery services in hyperfast developing urban agglomerations.
3. Materials and Methods
The study described in this paper focuses on a proposed vehicle whose characteristics aim to meet the following major customer requirements:
Main purpose—to deliver packages;
Total cargo volume—in a range from two to three cubic meters;
Driverless;
Road signature—narrow track, allowing two vehicles to fit a single road lane or a single car parking space;
Suitable for both midmile and metropolitan delivery requirements.
These criteria are used to determine the layout of the vehicle and its drive cycle, range, and maximum speed.
A narrow-track vehicle is chosen for several important reasons. The agility in traffic of the narrow-track vehicle and its ease in parking, are self-evident. Several key physical parameters influence the energy consumption of all vehicles: the mass of the vehicle, the air drag, and the tire rolling resistance. The air drag is predominantly determined by the vehicle’s frontal area—A, and the drag coefficient—Cd. A narrow-track vehicle inherently has about 50% less frontal area compared to a 4-wheeled vehicle with a “side-by-side” seat arrangement. Because the narrow-track vehicle is smaller, it also has significantly less mass. Additionally, when it leans, the load placed by the narrow-track vehicle on its chassis and suspension is almost solely along its longitudinal center plane. This reduces the need for complex suspension and high chassis torsional stiffness. It also contributes to reduced weight compared to traditional 4-wheeled vehicles. Reduction in weight directly translates into reductions in vehicle production costs and energy consumption.
3.1. General Layout of the Proposed Vehicle
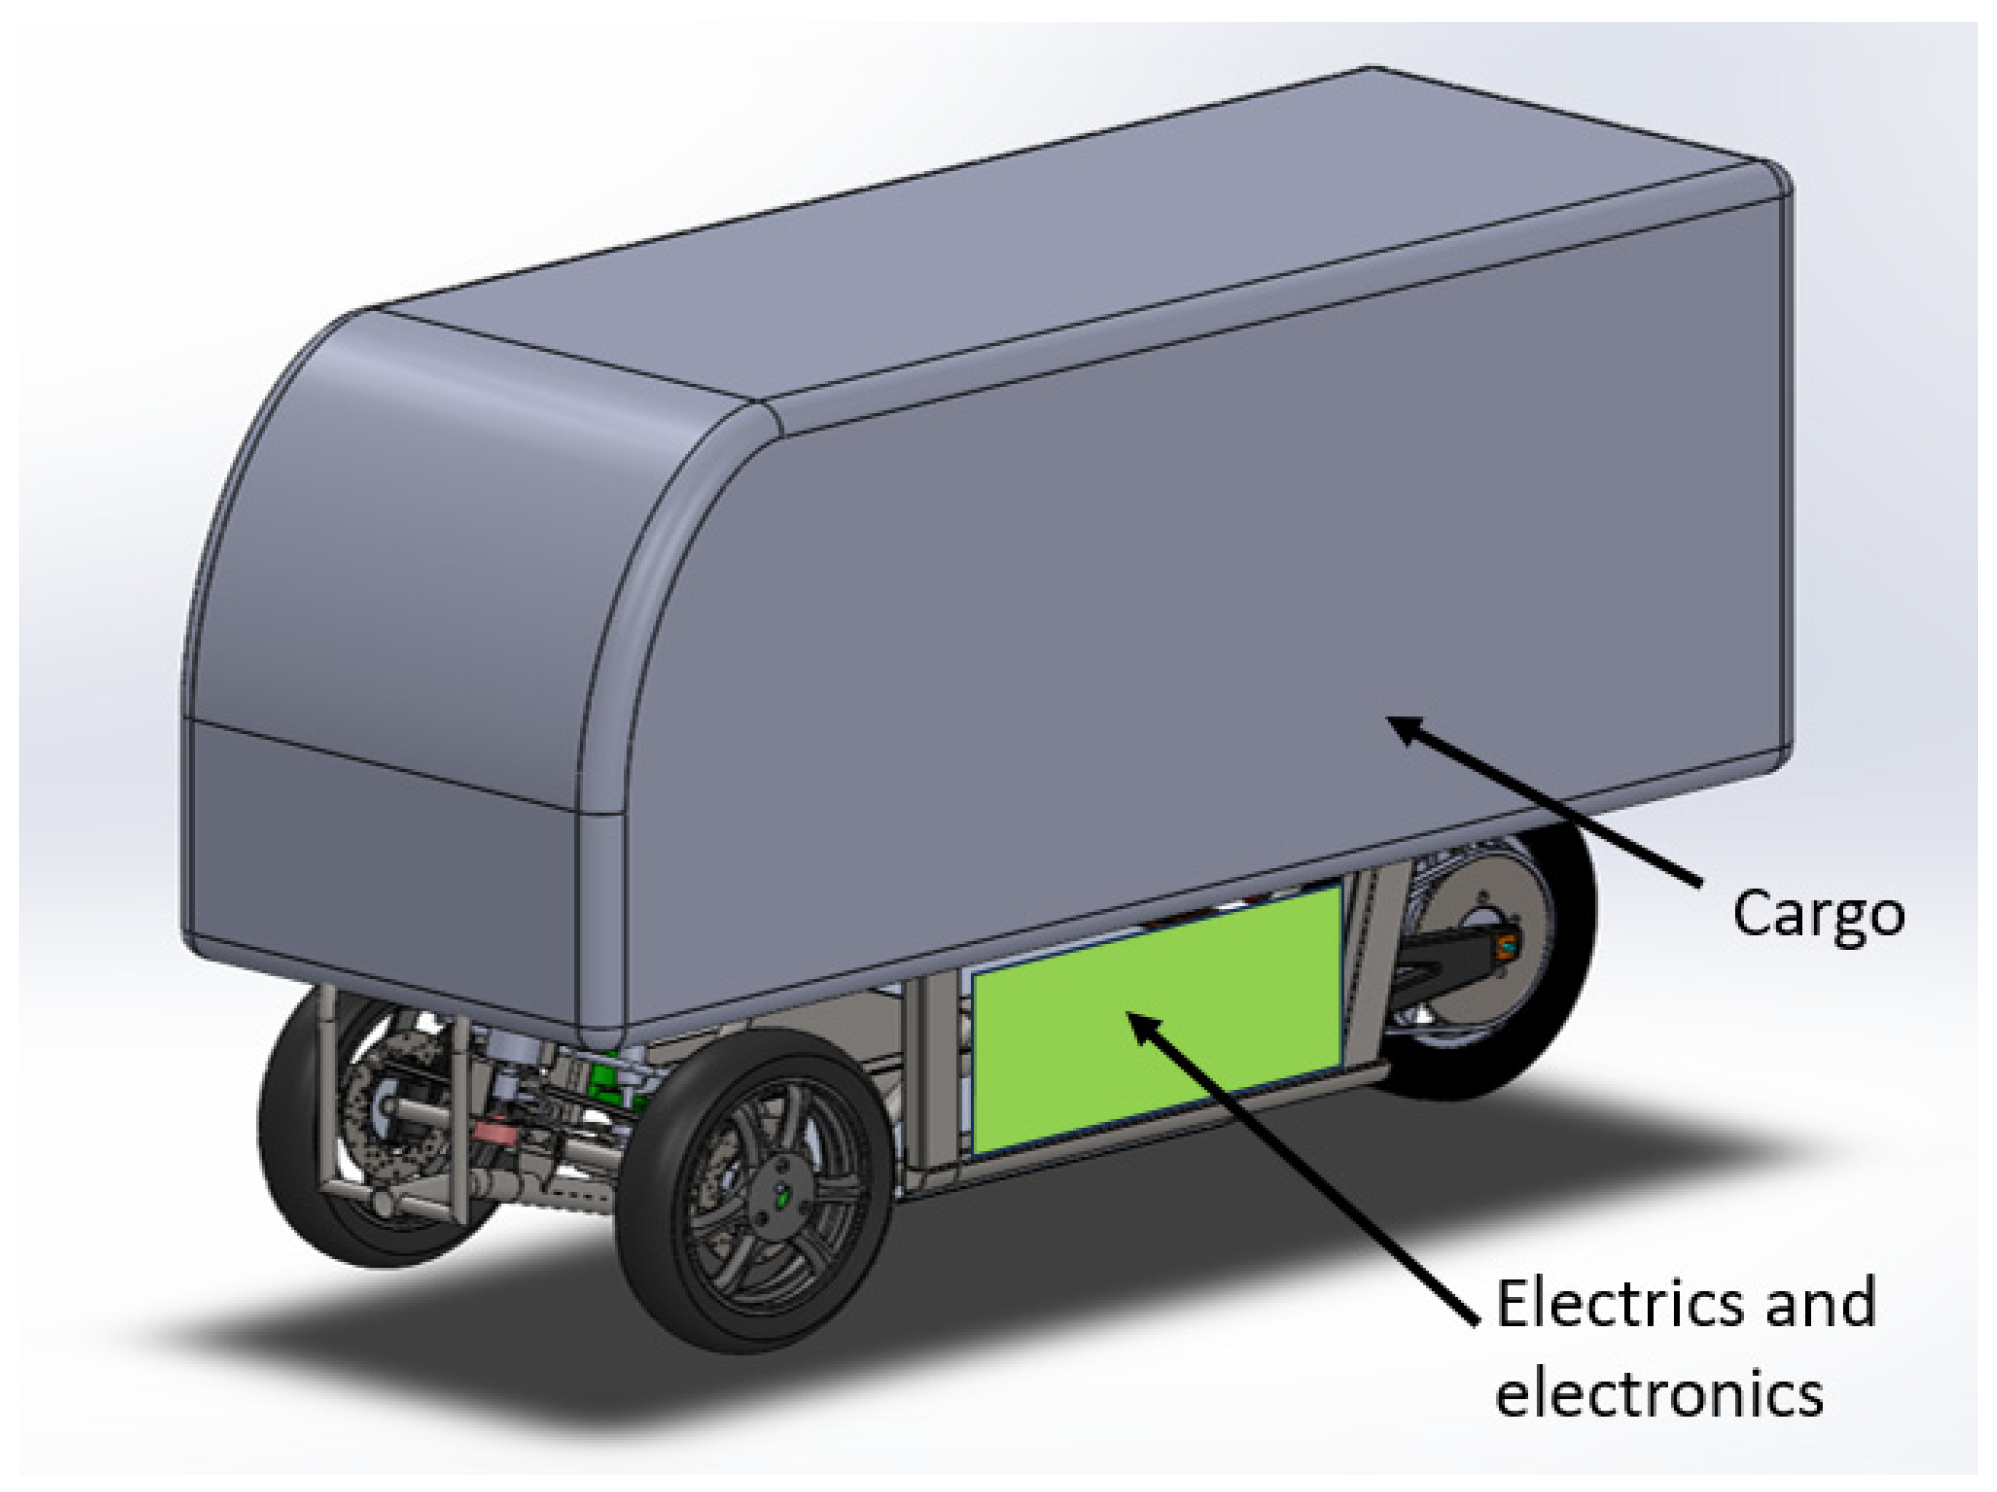
As shown in
Figure 5, the vehicle has three wheels, with a single wheel at the rear of the vehicle. The rear wheel is driven by an electric motor. There are two front wheels that can be steered sideways. The front wheels are suspended on a mechanism that allows the vehicle to tilt about a virtual axis on the road surface, which is parallel to the vehicle’s longitudinal axis (direction X). Such a mechanism is common in three-wheeled motorcycles and motorscooters, and can be found, for example, on the Piaggio MP3 [
32] and the Yamaha Tricity [
33]. The central area between the wheels is designated to house the traction battery, power electronics, AI computing hardware, and HVAC systems. The cargo deck is positioned above the wheels, leaving a free space above the wheels to accommodate suspension travel.
The objective of this methodology is to establish a workflow aimed at determining optimal vehicle parameters that will result in optimal performance from the perspective of the vehicle operator. For the operator, the most important performance metric is the delivery cost of a package throughout the lifecycle of the vehicle. The cost of package delivery must be defined in a manner that makes it possible to compare different types of vehicles with different cargo capacity and along different driving routes, as presented in a previous work [
34] by the first author of this paper. The first goal in the parameter optimization process is to minimize the annual vehicle-related cost of delivery (
AVRCoD). To enable meaningful comparisons, we normalize the annual total cost of ownership (
TCO) in euro currency by the total weight of packages that can be delivered, and the number of kilometers related to the use case of the vehicle. The
AVRCoD is measured in EUR/year × kg × km, as explained in more detail below. The second goal is to minimize the vehicle’s average energy consumption, measured in Wh/km. The optimized solution often depends on the specific use case of the vehicle. We defined several use cases to allow examination of the most relevant cases for a metropolitan delivery service.
This methodology is closely based on the work of Pathak et al. [
28] and Stocker et al. [
20], resulting in findings that allow the vehicle operator to measure the technoeconomic factors governing the efficiency of delivery vehicles. Both these studies start by defining vehicle parameters and drive cycles (representing use cases), then run a simulation to predict the energy consumption and lifecycle costing. The novelty of the research described in this paper is the comprehensive calculation method, achieved through a dedicated spreadsheet calculator. The calculator’s purpose is to guide the vehicle designer and decision-makers in making informed conceptual decisions regarding the architecture of the vehicle. The process starts by calculating the vehicle’s physical parameters and the predicted energy consumption. The results are then entered into the vehicle cost calculator. The cost of purchase is then fed into the final calculator to yield the total vehicle-related cost of delivery. This process offers an easy and reliable method for estimating and comparing the effect of vehicle specification on the technoeconomic viability of owning and operating the vehicle.
3.2. Methodology and Workflow
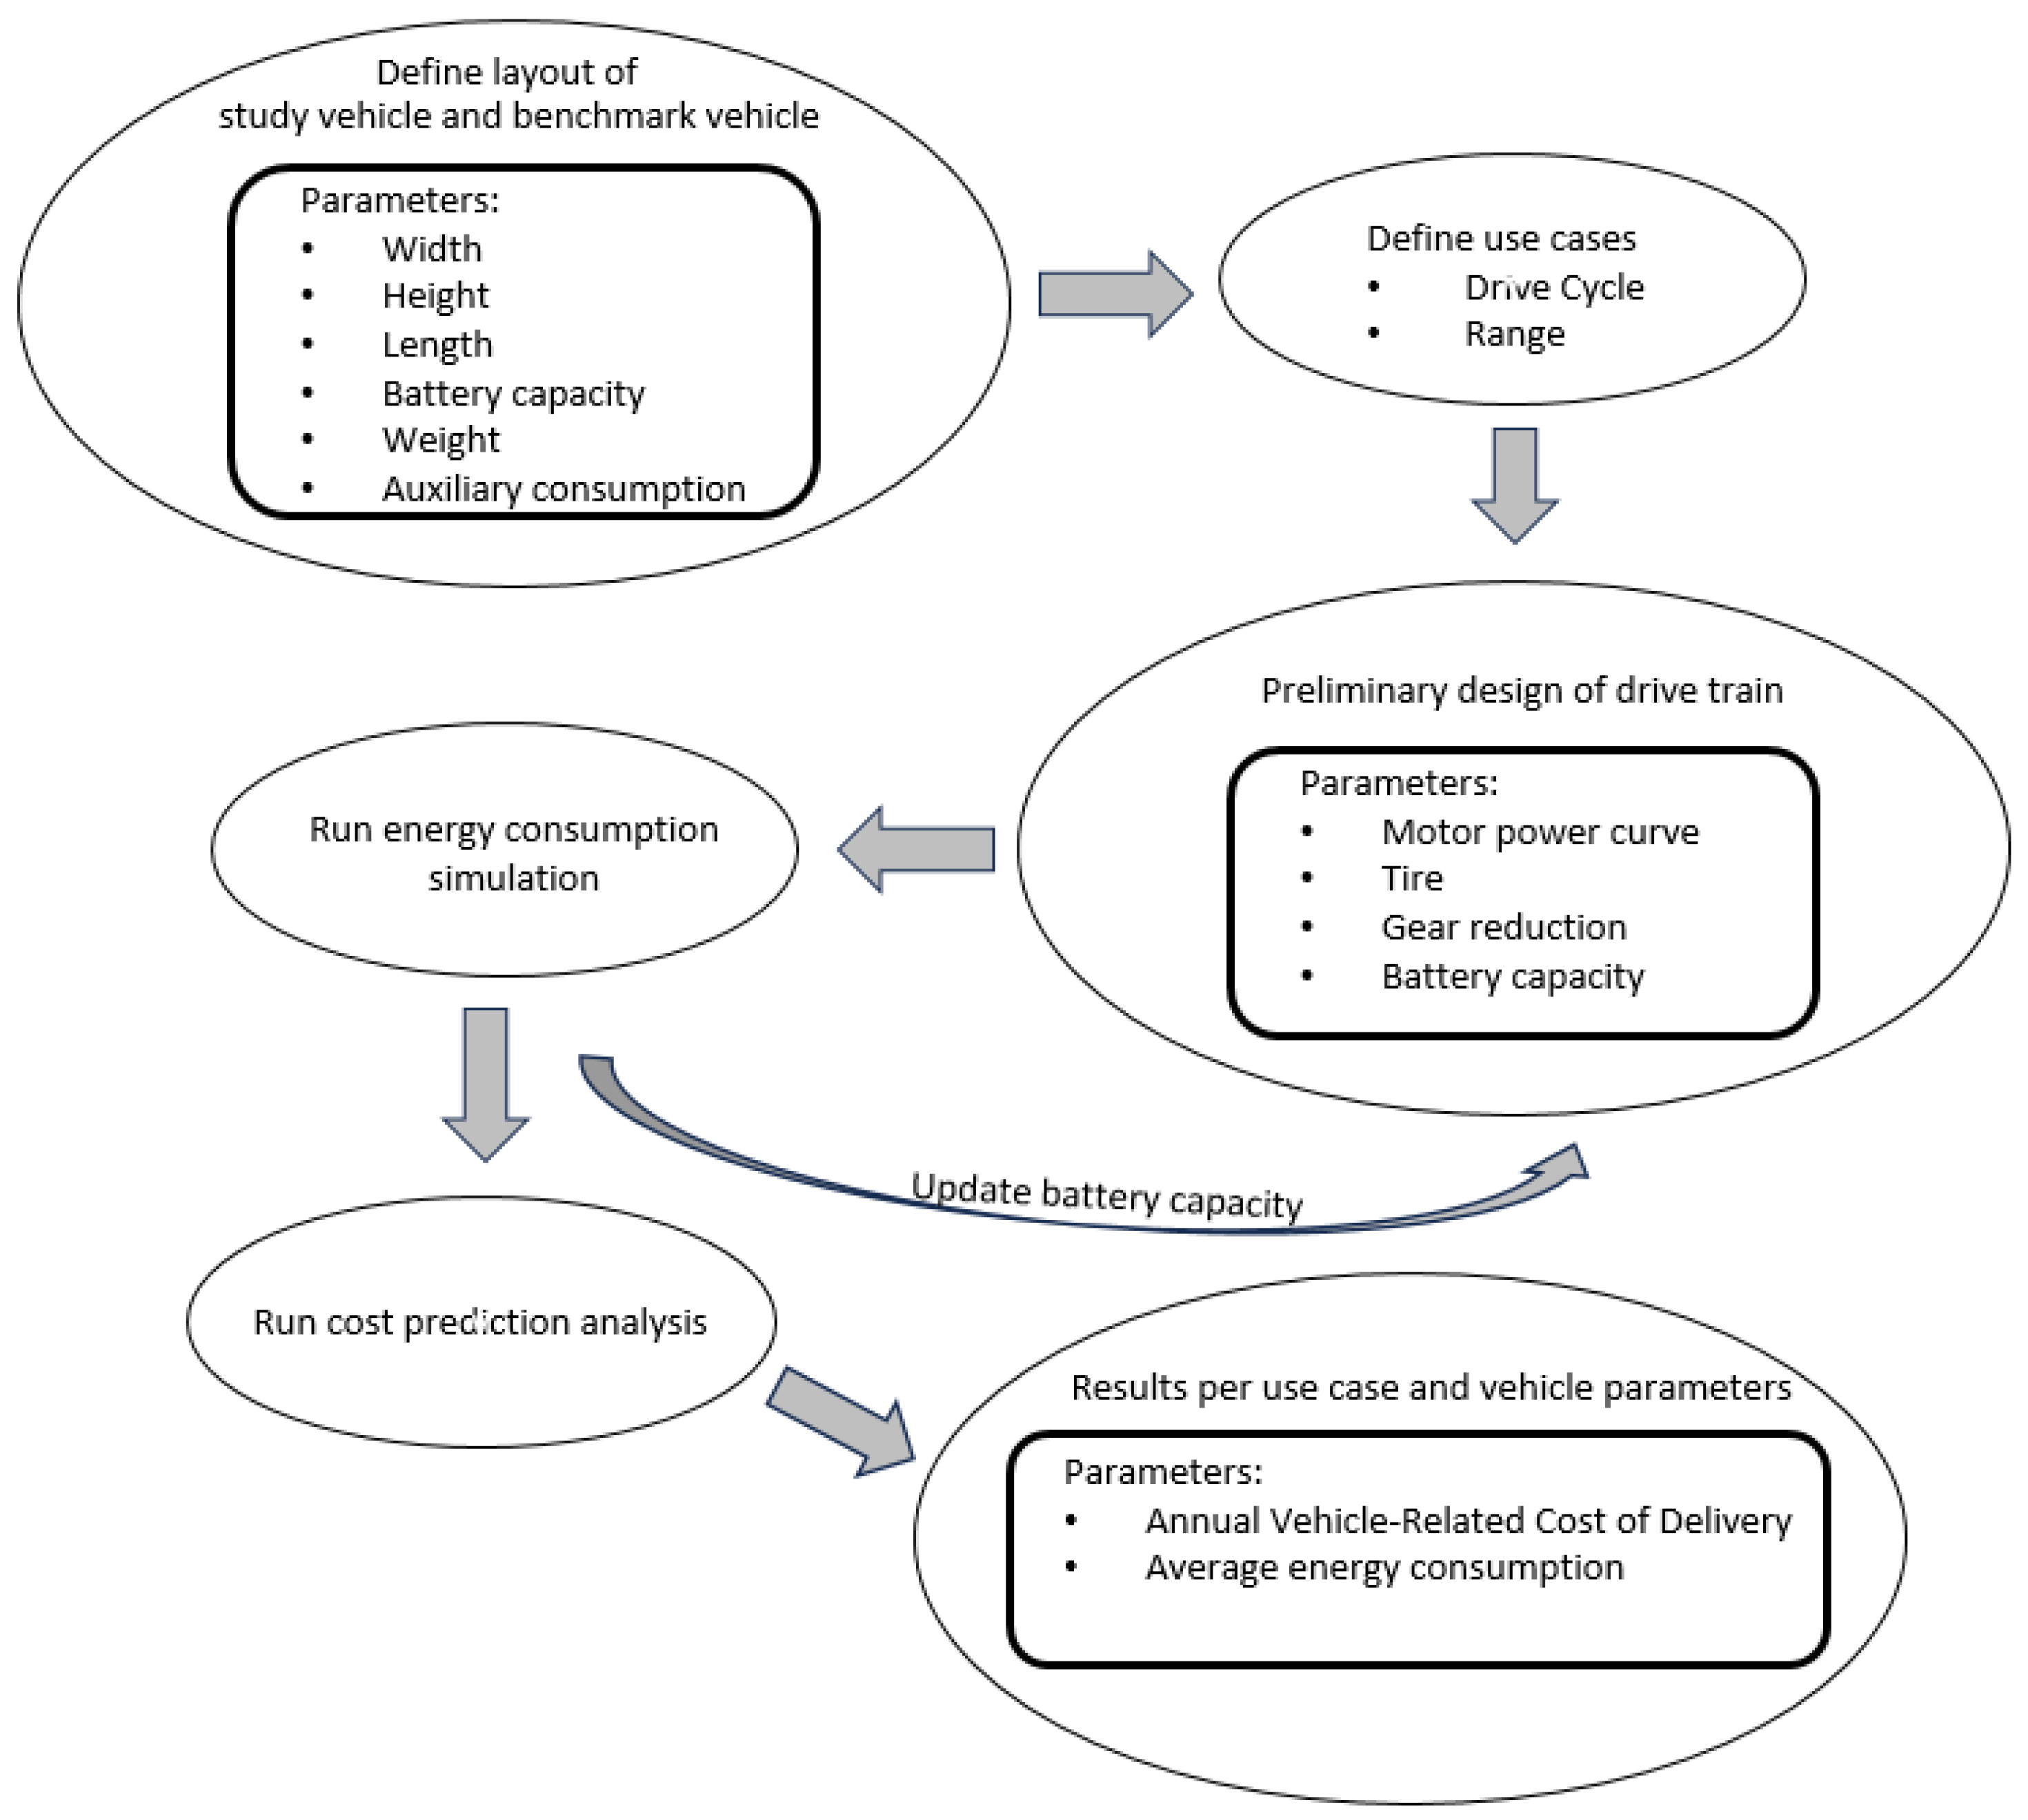
Figure 6 illustrates the methodology and workflow of the study. Initially, the vehicle geometric parameters are defined, as explained below: estimations are made of the Gross Vehicle Weight (
GVW), the battery capacity and the auxiliary energy required. We then defined the use case by setting the relevant drive cycles and the range between charges. Based upon the parameters defined above, we calculated and specified the motor rated power, tire dimensions, gear reduction ratio and battery capacity. We then ran an energy consumption simulation using Ricardo Software IGNITE (Ricardo Software IGNITE (Version 2018.1). Shoreham-by-Sea, England) [
35]. Based on the results predicted by the simulation, we optimized the battery size and reduction ratio. We reran the energy simulation using the reviewed parameters. When satisfied with the vehicle parameters, we entered them into a cost estimation calculator that yielded, as end results, the total vehicle-related cost of delivery and the vehicle average energy consumption.
3.2.1. Reference Case
To allow assessment of the benefits of the proposed vehicle, we compared the narrow-track leaning vehicle with a four-wheeled nonleaning vehicle with parameters representative of those for similar vehicles, such as the Renault Kango/Citroen Berlingo or the Renault EZ flex concept. The weights and dimensions of the reference vehicle were defined taking into account the lack of space allocation for driver and driver protection. The AVRCoD and average energy consumption of the reference vehicle were used for comparison purposes.
3.2.2. Detailed Explanation of the Methodology
The architecture study considers primarily vehicle packaging and setting the vehicle dimensions, defining the size, weight, and arrangement of the main vehicle systems. In addition, it defines the characteristics of the electric drive system by motor size and battery capacity, thus allowing allocation of space and weight within the vehicle. The algorithm variables include:
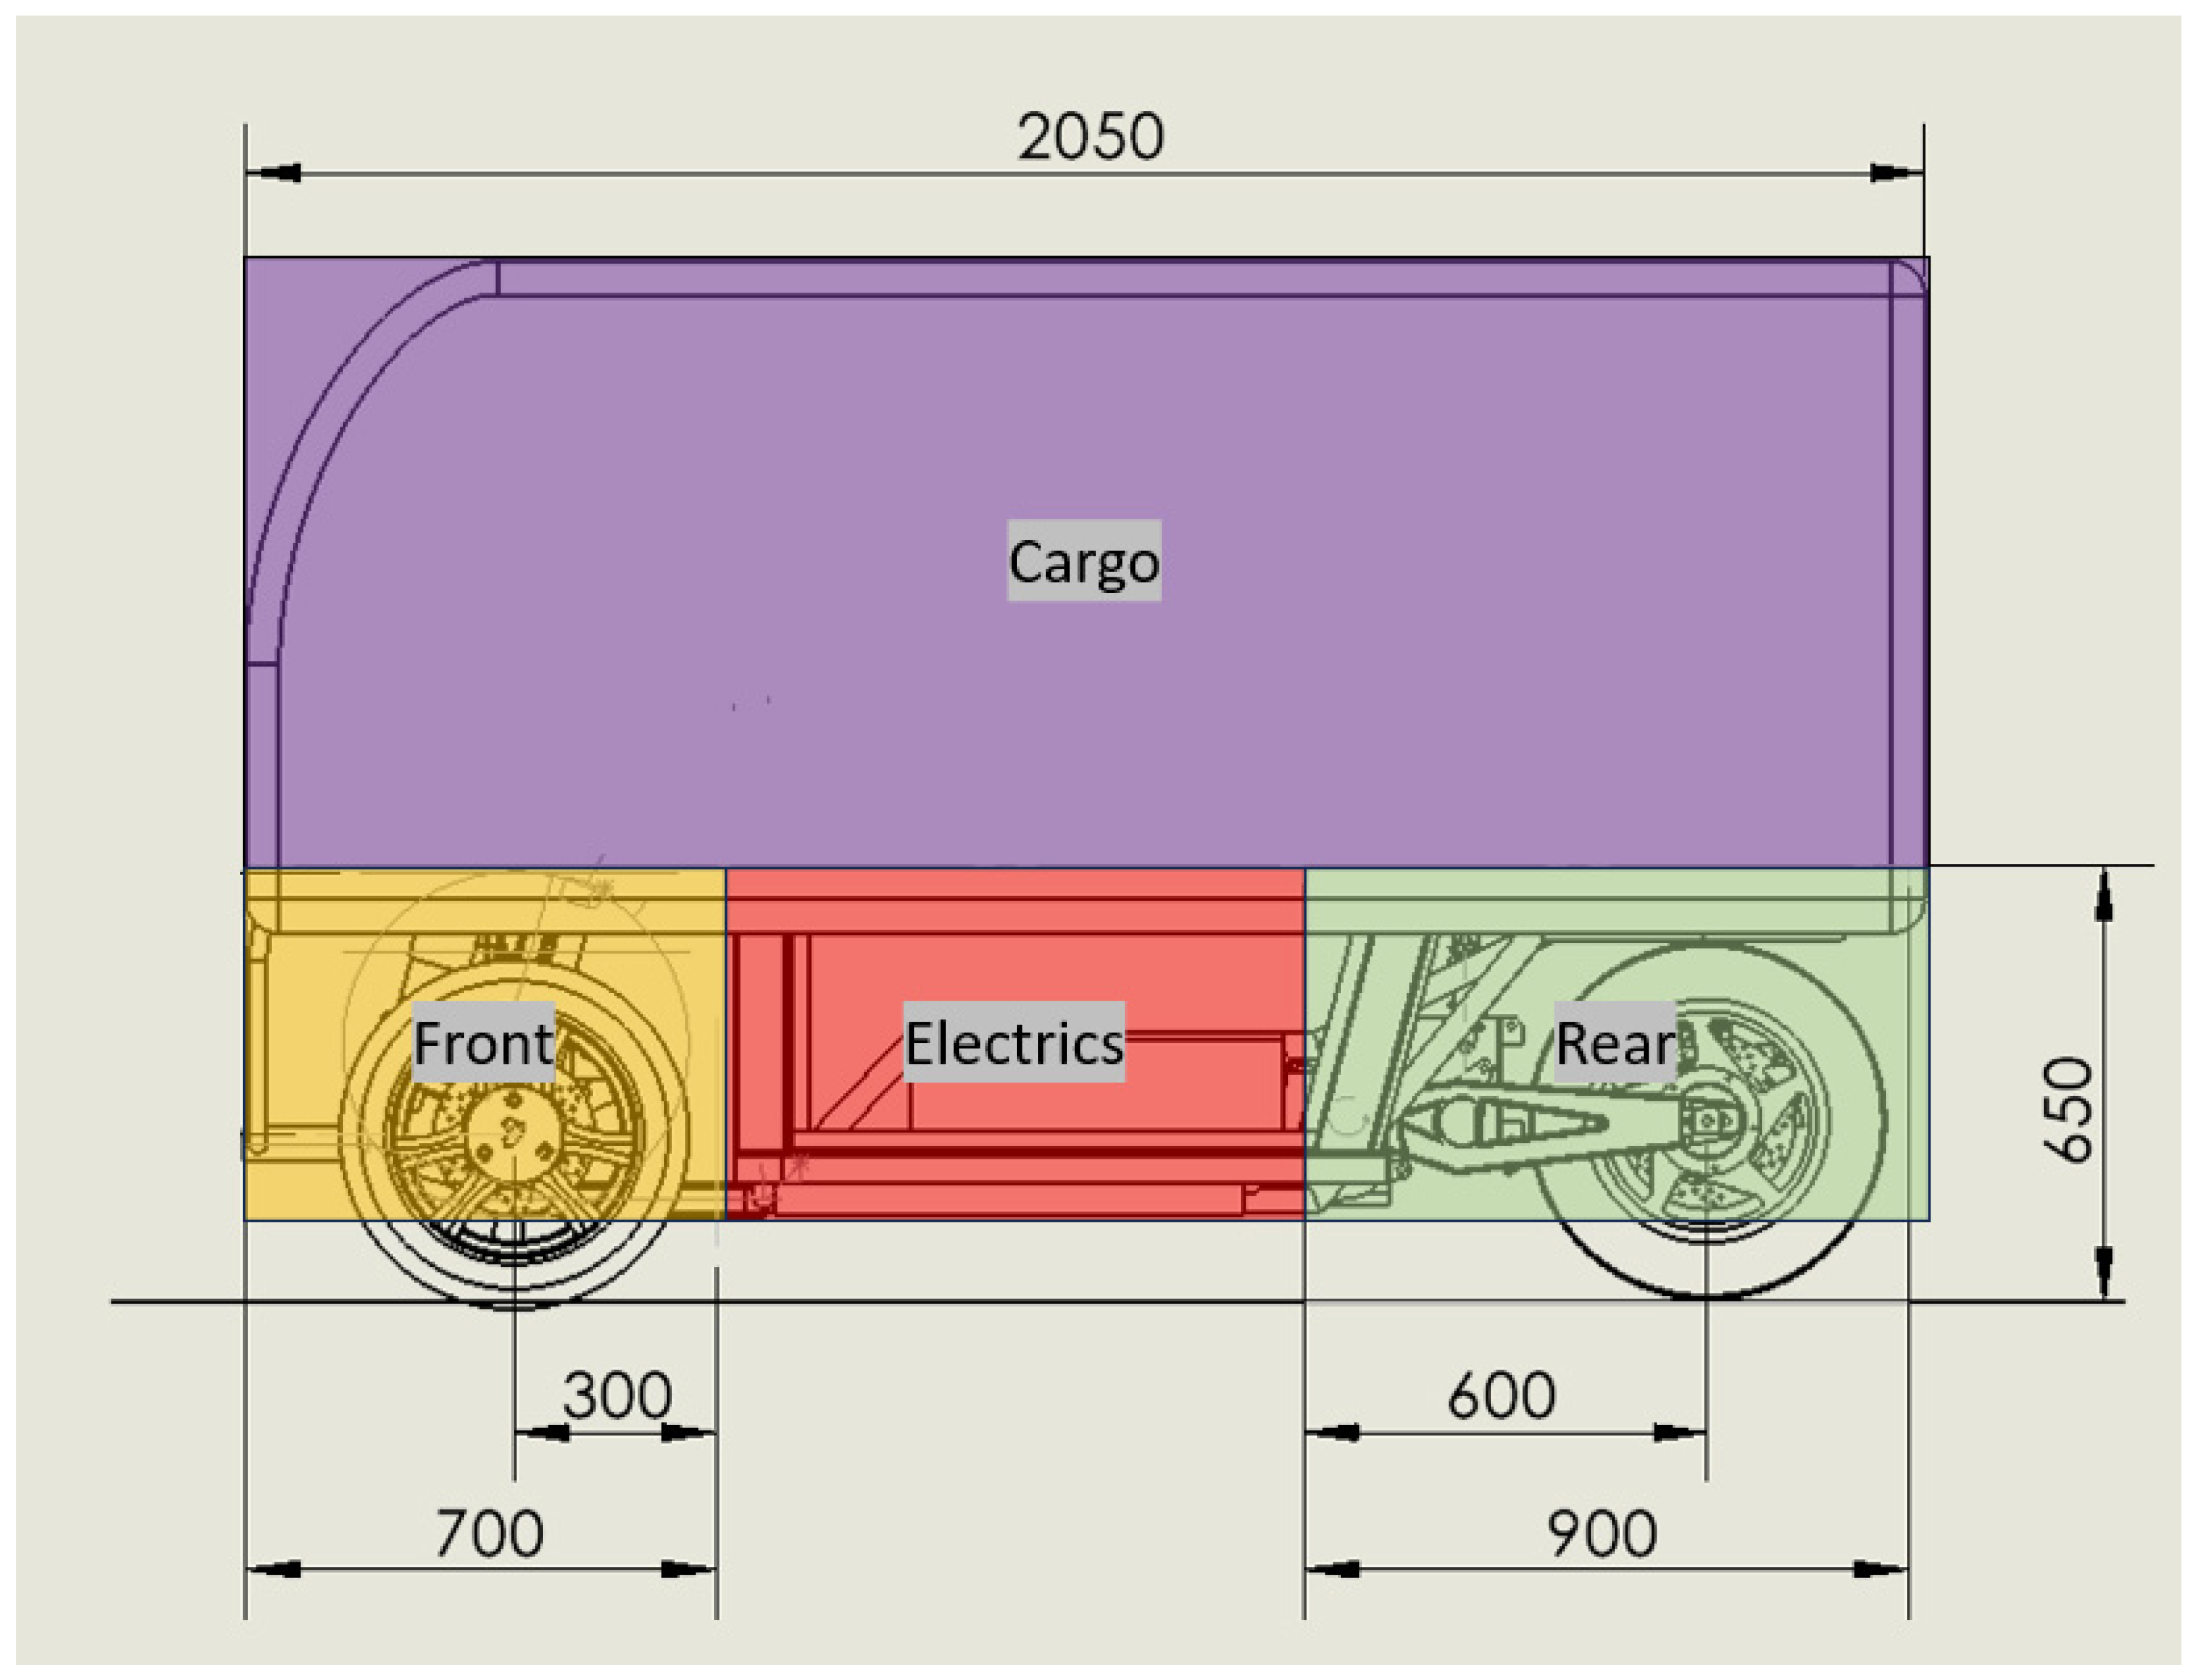
The vehicle layout is based on an L5e three-wheeled motorcycle with a cargo compartment instead of space for a rider, as explained above. The layout of the vehicle is governed mainly by its packaging requirements. The vehicle is divided into four clusters based on their functionality.
Figure 7 shows this cluster approach implemented on the proposed vehicle. The clusters are divided into fixed and modular clusters. The fixed clusters are the front and rear areas. The front cluster comprises the wheels, suspension, steering mechanism, and brakes, along with the free volume needed to allow the wheels to move up and down, and to allow steering motion. The dimensions of the front and rear cluster were set based on the dimensions of the tires that are suitable for the speed and loads exerted on them. The free volume needed for wheel motion and the horizontal dimensions are based on common three-wheel motorscooters such as the Piaggio MP3 and the Aeon Quadra. The dimensions used in this research are initial figures that serve the purpose of making conceptual design decisions. Engineers and decision-makers will most likely alter these figures in a detailed design phase that follows the conceptual stage.
The rear cluster includes the wheel, hub motor, rear fork arm, suspension, and the area necessary to allow vertical travel for the wheel. The modular clusters comprise the cargo cluster and the electrics cluster that contains the battery, power electronics (inverter/charger), and the computing hardware for autonomous driving. The electric cluster size varies depending on the vehicle specifications. The cargo width is fixed and set at 1100 mm. This width was determined by considering the width of scooters and motorcycles, as well as requirements for traffic agility, compact parking areas, and package size. The width and length of the vehicle are preset, whereas the height is determined by the dimension needed to provide the required cargo volume. We surveyed the large motorcycle width and found that 1100 mm is the upper limit. It is usually either in the handlebars or in the saddle bags.
3.2.3. Main Assumptions
Cargo Volume: Two vehicle payloads. The cargo capacities examined are 2 cu-m (named V2), and 3 cu-m (named V3). This is based on the effective trunk capacity of vehicles such as the smallest version of the Renault Kangoo, NURO and others. The V2 volume allows the vehicle to carry 100 kg of cargo, and to fill a gap of capacity not covered today. The goal of a 3 cu-m volume is ambitious. It was set to facilitate examining and obtaining a sense of the cargo benefits and limit of such a small vehicle.
Cargo Weight: Specific cargo weight is set to 0.1 kg/L. This is a number commonly used in the industry for general packages and luggage. For example, regulation ECE 107 specifies that the luggage weight in the lower luggage compartment of a coach is to be calculated by the overall compartment volume and 0.1 kg/L specific weight. Packages nowadays have even lower specific weight as suppliers use large packages. Please note this calculation is used to determine cargo weight and volume in normal daily use but only for the purpose of determining the layout. When considering strength and durability in vehicle design, the designer should consider higher cargo loads. The formulation of the packaging model geometry was entered into a spreadsheet with the fixed dimensions and the formulae (described below) that set cargo volume and battery size, for the purpose of calculating the vehicle dimensions—such as general height, wheelbase, and height—using the specifications as inputs. In addition, the model provides the center of gravity height and weight distribution for future dynamics and stability analysis work.
3.2.4. Vehicle Layout Calculation Explained
Gross Vehicle Weight Calculation. The
GVW is calculated by summing the weight of the vehicle glider, the cargo, and the battery. The glider weight is the total of the weights of the front end, rear end, power electronics, cargo container structure, and chassis, with a fixed value of 120 kg. The cargo weight depends on the cargo volume multiplied by the cargo-specific weight. The battery weight is derived from the battery capacity, which is first estimated, then predicted through simulation, and the battery pack’s specific energy.
where
VGW (vehicle glider weight) is in kg,
CSW (cargo specific weight) in Kg/m
3,
CV (cargo volume) in m
3,
BPSE (battery pack specific energy) in Wh/kg, and
BCap (battery capacity) in kWh.
Battery Capacity (
BCap) Calculation. Equation (3) presents the calculation of
BCap based on the average energy consumption as predicted in Ricardo Software IGNITE [
35] energy simulation and the required range between charges. Both values are derivatives of the use-case definition.
where
AEC (average energy consumption) is in Wh/km,
reqR (required range) in km, and
PBU (percent battery usage) as a percentage of the full
SOC (state of charge).
Vehicle Height Calculation. Total vehicle height is calculated by adding the height of the fixed clusters (modules) and the height of the cargo compartment. The cargo is calculated using the specified cargo volume divided by the width and length of the compartment.
where
VH (vehicle height) is in m,
FMH (fixed modules height) in m,
CV (cargo volume) in m
3,
VL (vehicle length) in m, and
VW (vehicle width) in m.
The battery pack size is determined by the energy consumption predicted by the simulation multiplied by the drive range between charges and by the percentage of battery used. Battery size is determined by comparison with commercially available battery modules with a capacity of 5000 Wh, length of 300 mm, height of 75 mm, and width of 685 mm.
where
BCap (battery capacity) is in kWh,
PEC (predicted energy consumption) in kWh/km,
Range in km, and
Ubat (useable battery) in % (taken as constant value of 90%).
3.2.5. Use Cases
This study focuses on two use cases that we believe best demonstrate the benefits of the proposed vehicle, primarily a high top speed (about 110 km/h) and a relatively high cargo capacity (two or three cubic meters). The first use case is for a delivery service within neighborhoods and between urban clusters of a city. It combines low-speed neighborhood driving for package pickup and delivery and some mid-speed travel between the city’s urban clusters. This use case is defined as the “midmile” use case. The second use case represents delivery trips crossing the megacity end to end. It combines low-speed neighborhood driving for package pickup and delivery, some mid-speed travel between the city’s clusters, and some high-speed driving on the city’s ring roads and inner city highways. This use case is defined as the “metropole” use case.
The use cases are defined by drive cycle, daily travel range, and available cargo capacity. Drive cycles are the function of travel speed over time.
3.2.6. Drive Cycles
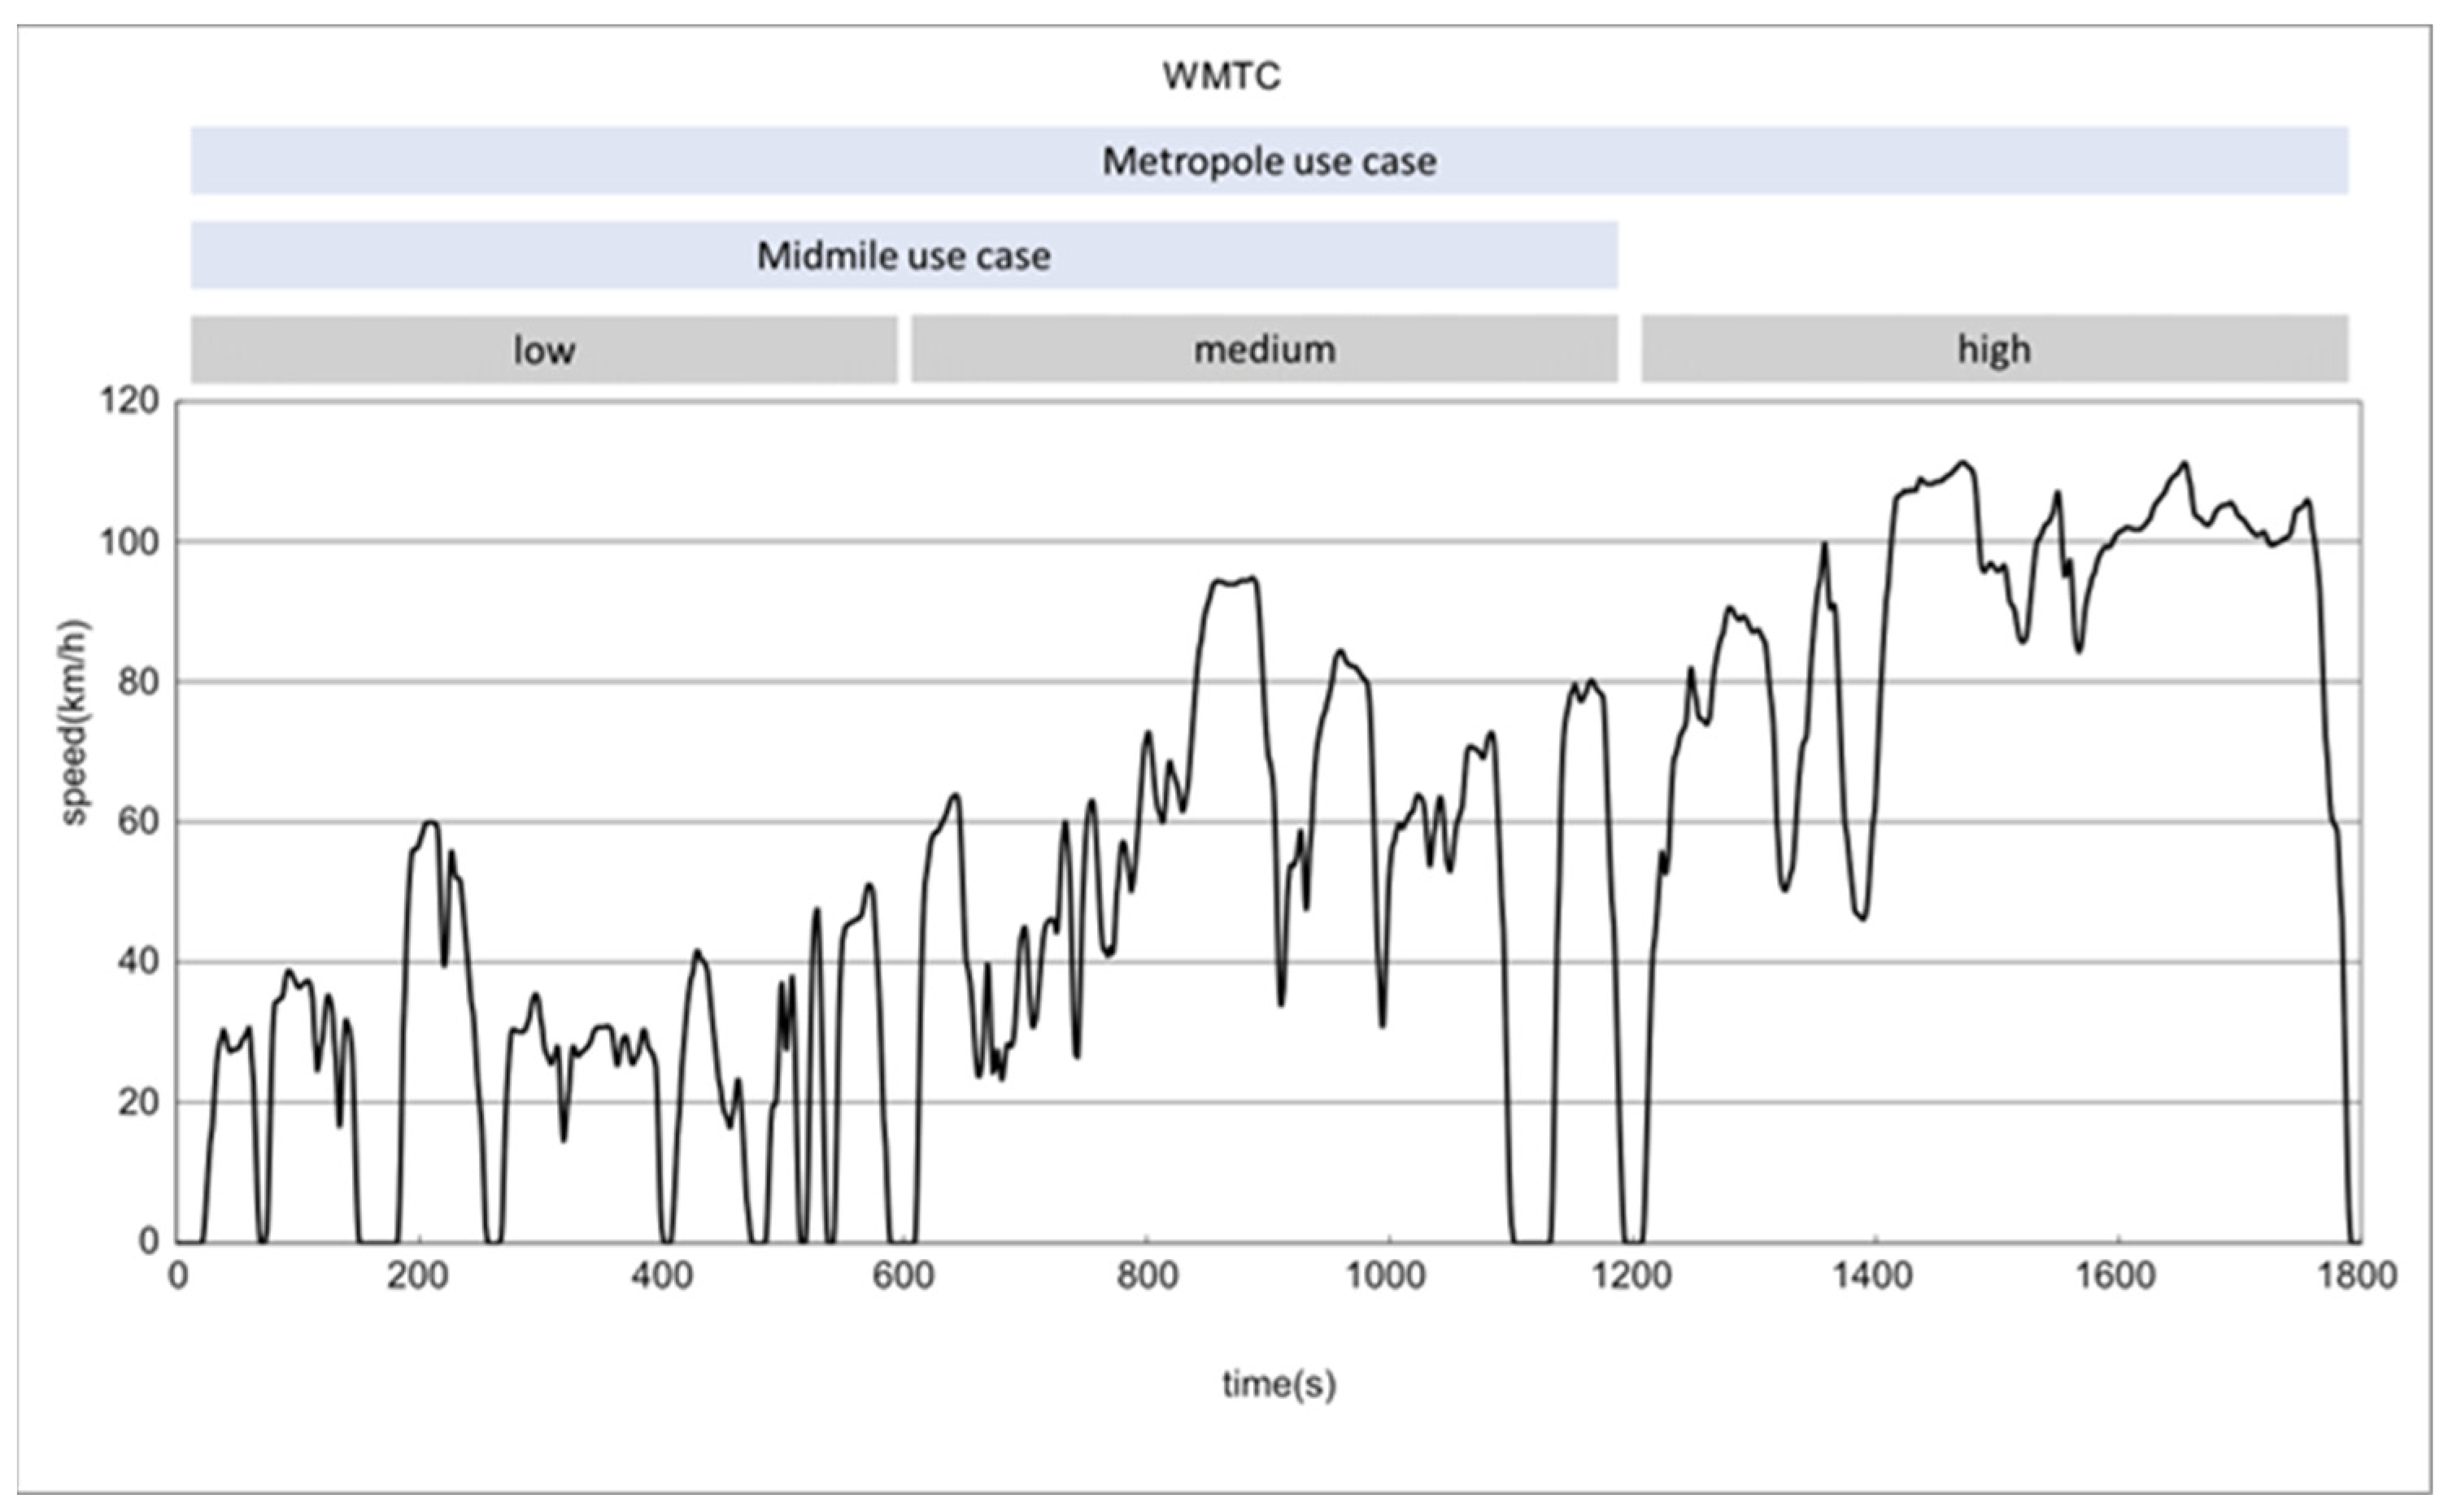
The midmile use case for the narrow-track three-wheeled vehicles is represented by the low-speed and medium-speed parts of the WMTC (Worldwide Harmonized Motorcycle Test Cycle) [
36]. The total daily travel range is 180 km without plug-in charge. The metropole use case for the same vehicles is represented by the low-speed, medium-speed, and high-speed parts of the WMTC. The total daily travel range is 250 km without plug-in charge. A wide range of drive cycles [
37] are in use by industry, regulators, and decision-makers. The choice of the WMTC is primarily because it is used to officially determine energy consumption and emissions in Europe and most of the Western world. The low-speed part of the WMTC has an average speed of 24.4 km/h and a momentary top speed of 60 km/h, corresponding to motorcycle use in a large neighborhood. The medium-speed part has an average speed of 54.7 km/h and a momentary top speed of 95 km/h, representing the midmile motorcycle use. The high-speed part has an average speed of 56.5 km/h and a momentary top speed of 111.3 km/h. This corresponds with crossing the metropolis on the highways between the city clusters and on the ring roads. Since the actual midmile use case of the delivery vehicle includes both neighborhood and between-neighborhood running, we defined the use case as having low- and medium-speed parts following each other. The same applies to the metropole drive cycle, which includes midmile driving with the addition of the high-speed part.
Table 2 shows the main characteristics of the defined drive cycles.
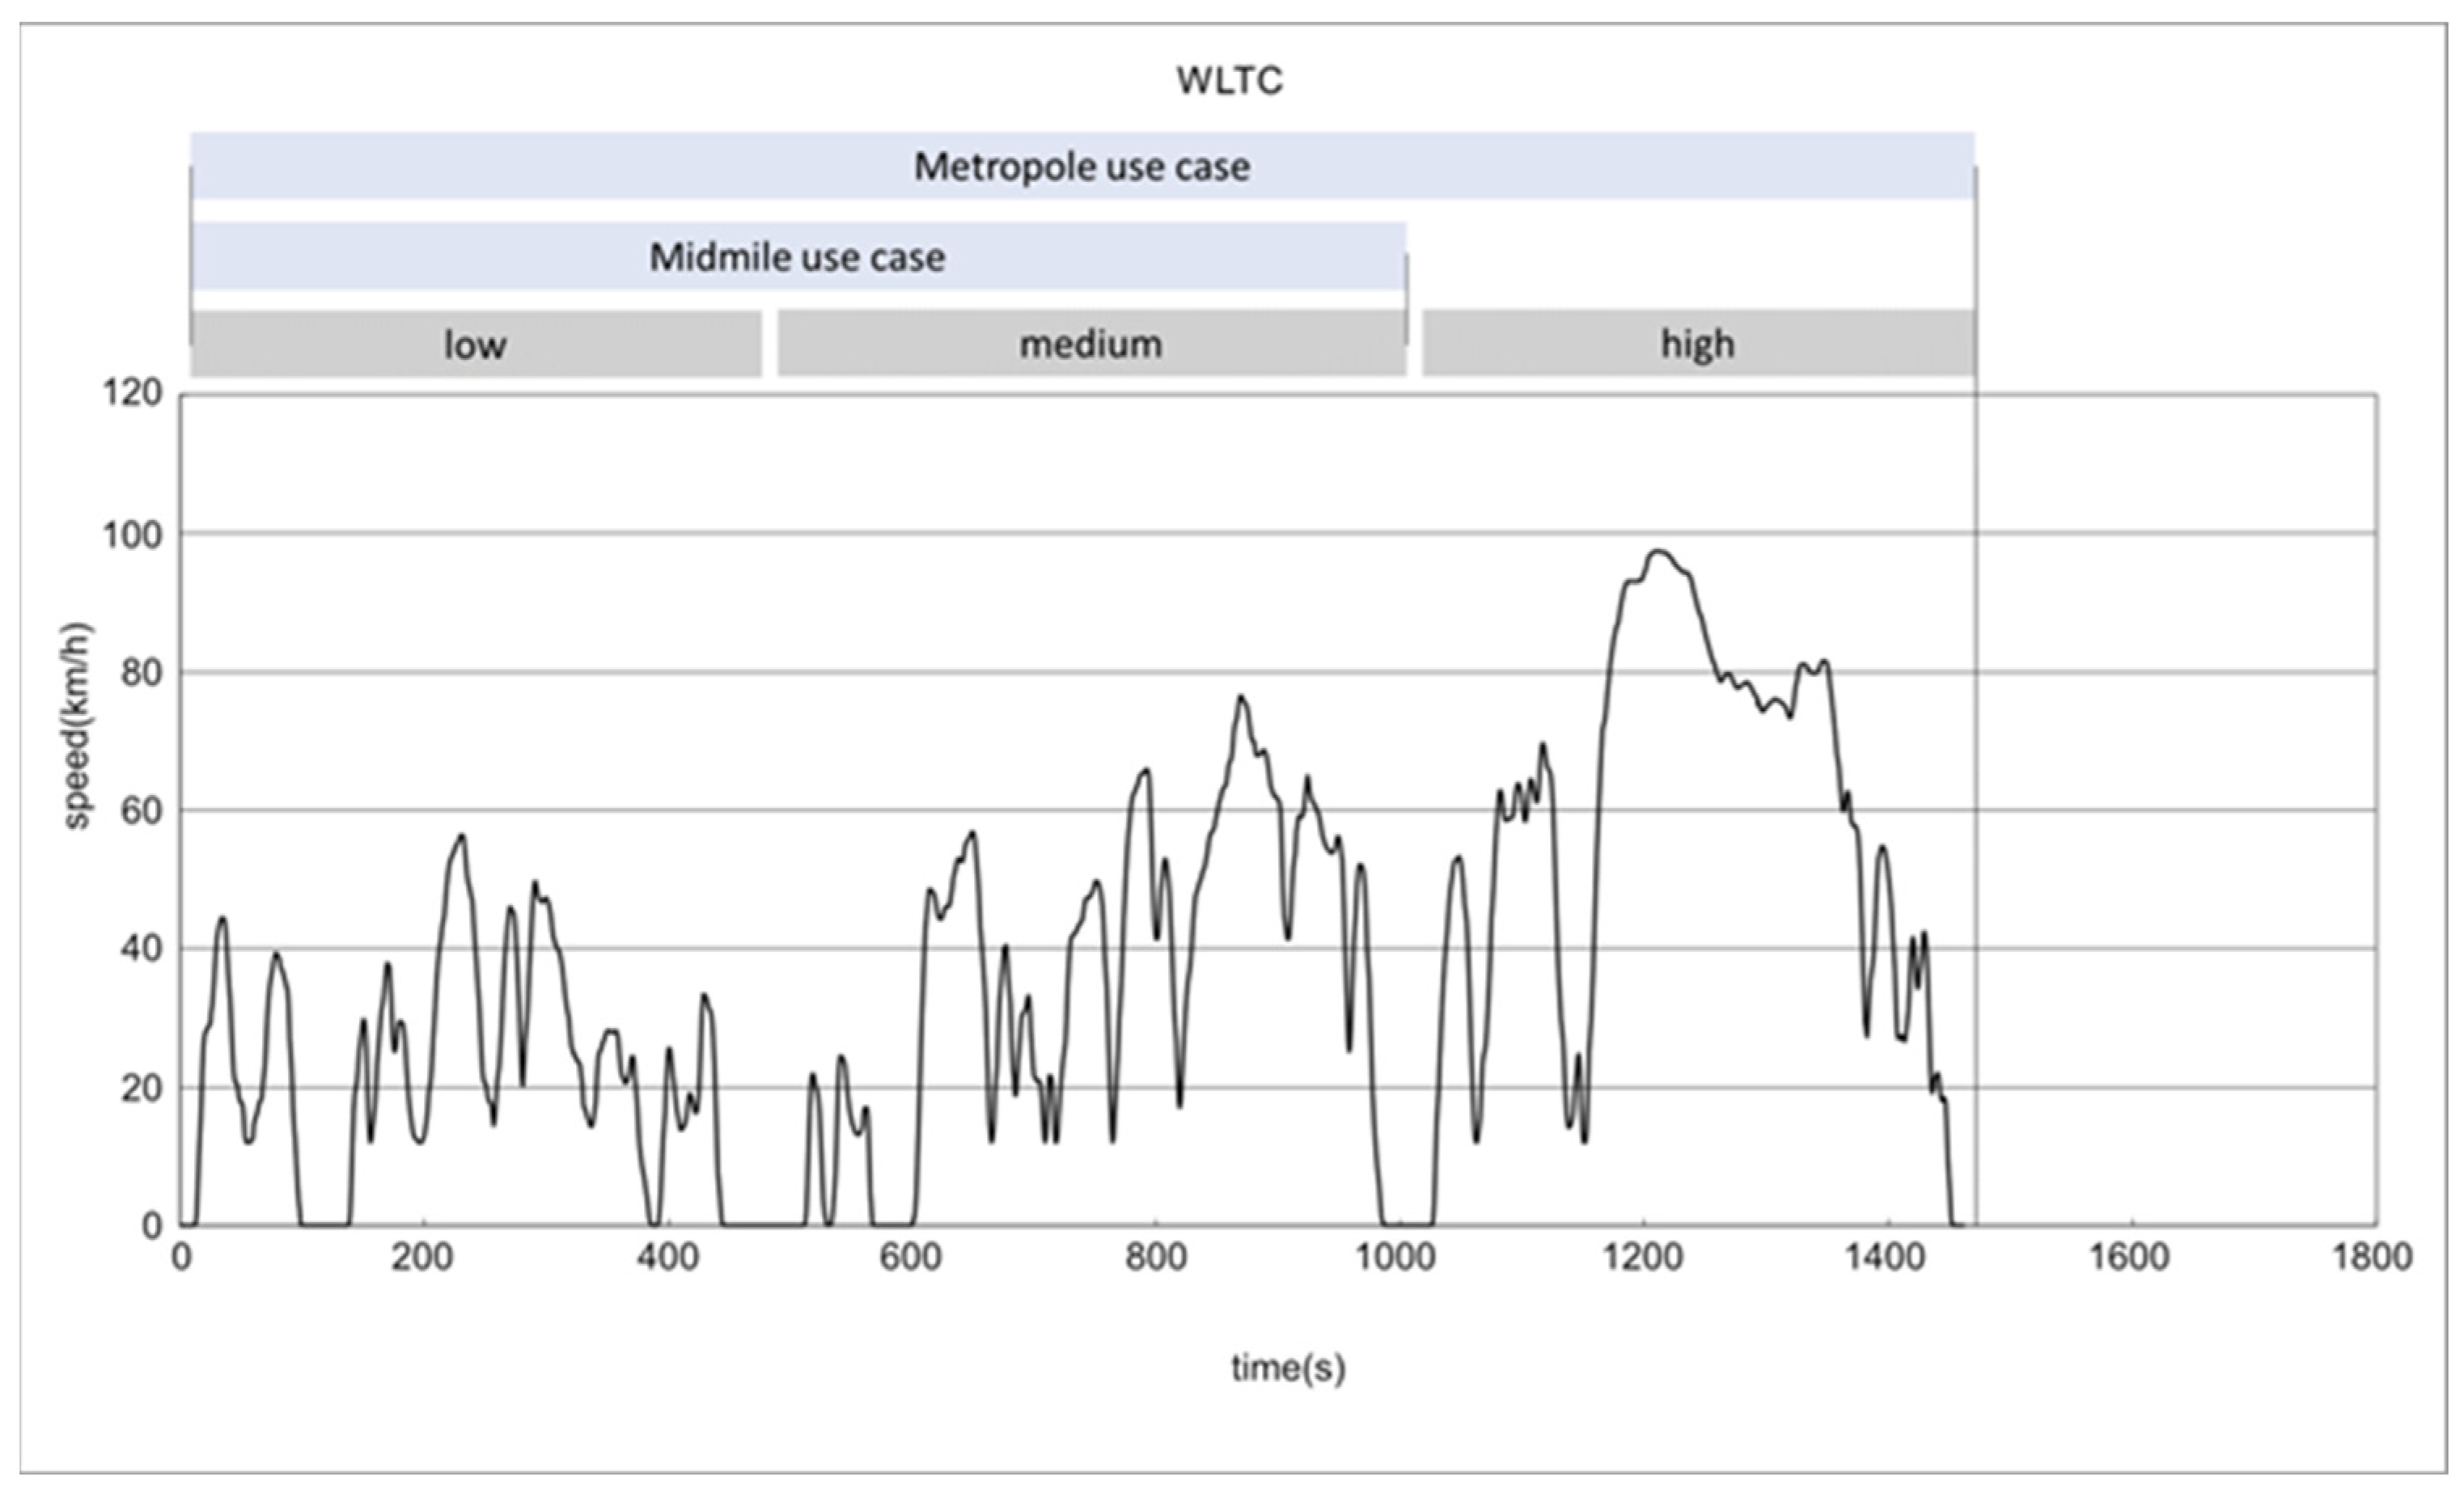
Since the proposed concept is examined in reference to traditional four-wheeled vehicles, we used the WLTC (Worldwide Harmonized Light Vehicles Test Cycle) [
38]. The WLTC is the equivalent regulatory drive cycle used for N1 and M1 vehicle energy consumption and emissions tests, corresponding to the WMTC. The WLTC has a slower pace, lower magnitude of accelerations, and more stoppage time. We used the same method of combining low- and medium-speed parts for the midmile use case, and low-, medium-, and high-speed parts for the metropole use case. Both the WMTC and WLTC drive cycles have ultrahigh-speed parts that were omitted for the purpose of this study.
Table 2 and
Figure 8 and
Figure 9 show the characteristics of the drive cycles and the way they were used to define the use cases.
Comparing narrow-track vehicles using the WMTC with four-wheeled vehicles using the WLTC may mirror actual conditions on the road today. However, this comparison does not allow an equitable basis for testing of the vehicle energy consumption for comparison of benefits. Furthermore, with no human factor for motorcycle riders who are tempted to drive aggressively, the pace of autonomous vehicles can be adjusted for better energy consumption. Thus, we added another case to the study simulating the narrow-track three-wheeled vehicle with the more moderate WLTC drive cycle.
For the midmile use case, we defined a daily driving range with no plug-in for charging as 180 km. This corresponds with the daily travel distance of within-city delivery services. For the metropole use case, the equivalent daily travel distance is 250 km. These values are based on the main author’s experience working with delivery and public transportation operators. All variations in the cases examined are presented in
Table 3.
3.2.7. Technoeconomic Analysis
This study examines technoeconomic viability from the perspective of the delivery operator. The optimization criteria are defined to allow for comparison on equal terms between different sizes of vehicle with different specifications and driving conditions. The criteria follow: (a) Minimum customer cost of service, defined as the total cost of delivering 1 kg of goods over 1 km in one year. The number of kilograms is defined by the available cargo space in the vehicle. This takes account of the vehicle’s capability in indicating the operator’s potential efficiency. (b) Minimum energy consumption of the vehicle in Wh/km.
Note: Because of their road agility, narrow-track vehicles are assumed to travel at a higher average speed relative to a four-wheeled “side-by-side” vehicle, thus delivering more packages per workday. For the purposes of this study, the average speed is provided by the drive cycle used. The cost of package delivery takes into account the potential for delivering more packages. To account for the available cargo effectively, the calculated four-wheeled capacity is adjusted based on the average speed ratio of the WMTC and WLTC, resulting in a midmile package factor of 1.43 and a metropole package factor of 1.58.
Total cost of ownership (
TCO) is defined as the capital cost of purchase, reduced by the residual value at end of life and by the cost of operation. The cost of operation comprises running costs and cost of maintenance [
34,
39]. The cost of operation is calculated as the cost of energy based on the energy simulator prediction, and the annual service-related cost. Service-related cost is estimated, based on the author’s professional experience, as 5% of the annual
TCO. End of life is assumed to be seven years. This is based on the assumption that the vehicle ends its life when the traction battery reaches the end of its life, given that the battery is the most expensive component of the vehicle. For the sake of simplicity, the calculation does not include capitalization.
while
3.2.8. Vehicle Purchase Cost Calculation
Having defined the vehicle layout, as explained above, we use a cost calculator to estimate the cost of the vehicle. This calculation is based on a survey [
35] and prediction of the costs for vehicle components and the total cost of ownership. The cost data and method is based on an overview of costs for the vehicle components, fuels, greenhouse gas emissions, and total cost of ownership. This source provides an insight into data typically considered proprietary information of vehicle manufacturers. In recent years, there have been rapid changes in material and energy costs due to the COVID-19 pandemic, the war in Ukraine, and global warming. As a result, the actual market cost may be different from the values we have used. However, these values still provide adequate results for decision-making when choices are being made between alternative vehicle and layout parameters. In addition, this research illustrates a method for technoeconomic decision-making that can be implemented using updated cost data. The specific costs of manufacturing and material values used are listed in
Table 4.
The purchase cost for the vehicle operator is calculated by adding a margin of 1.6 to the manufacturing cost. For the energy simulation and the calculation of AVRCoD, we assume that the average cargo capacity of a vehicle is 50% of available cargo capacity.
4. Results
In this section, we present simulation results, comparing a three-wheeled narrow-track vehicle with cargo volumes of 2 and 3 m
3, and a four-wheeled double-track vehicle with the same cargo volumes. The results are organized according to the following variables: energy consumption, total cost of delivery, and relative contribution to annual cost. The comparison is made between the two studied use cases, midmile and metropole, defined by the driving cycle, daily travel range, and available cargo capacity. A detailed description of the use cases is given in the Section
3.
4.1. Energy Consumption
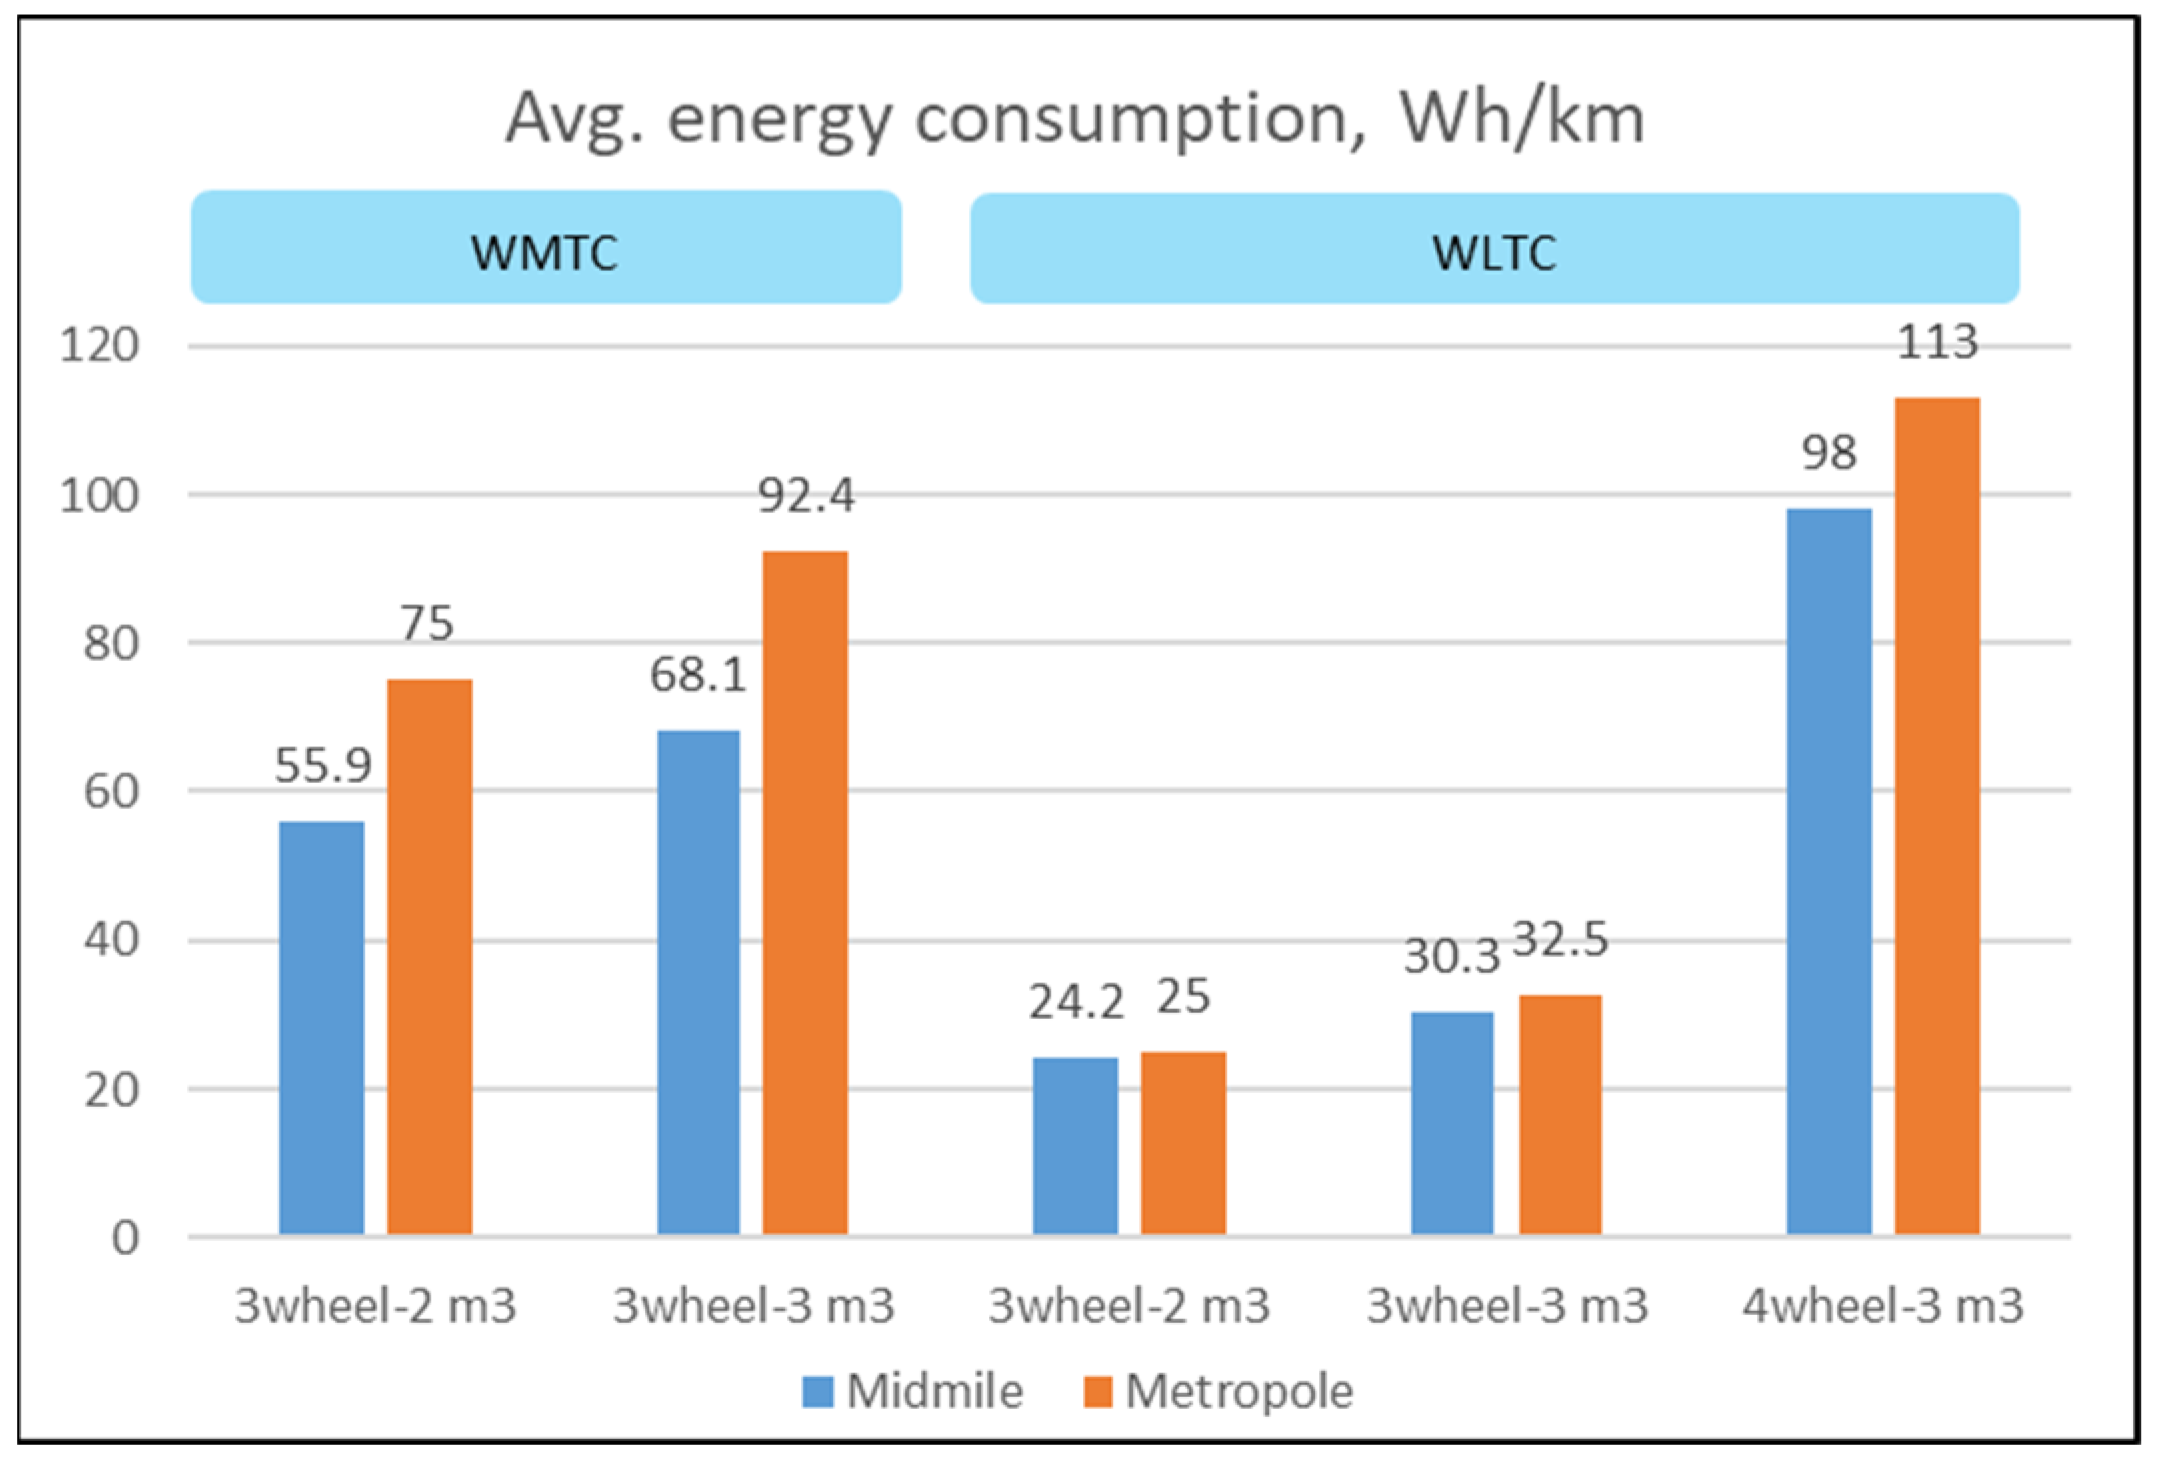
We conducted a comparative analysis of energy consumption between the individual simulations, using the metric of average energy consumption, calculated as the total energy consumption divided by the distance driven. The results of this average energy consumption analysis are shown in
Table 5 and
Figure 10.
Table 5 also shows a percentage-based comparison of average energy consumption between the narrow-track vehicle and the double-track vehicle, with the latter as the reference point at 100%.
In both use cases, the highest consumption values for the double-track vehicle were 98 Wh/km in midmile and a peak of 113 Wh/km in metropole. The narrow-track vehicle with a cargo volume of 2 m3 generally showed the lowest consumption values in the midmile and metropole use cases when using the WLTC: 24.2 Wh/km for midmile and 25 Wh/km for metropole. Using the WLTC, the narrow-track vehicle variant with the 3 m3 cargo volume consumed 30.3 Wh/km in the midmile use case and 32.5 Wh/h in the metropole use case. When using the WMTC, the consumption values were generally higher for the narrow-track vehicle than with the WLTC. The variant with 2 m3 cargo volume showed consumption values of 55.9 Wh/km for midmile and 75 Wh/km for metropole. In contrast, the variant with a cargo volume of 3 m3 achieved 68.1 Wh/km in midmile and 92.4 Wh/km in metropole. The percentage of average energy consumption relative to the double-track vehicle ranged from 57% (midmile) to 82% (metropole) for the narrow-track vehicle using the WMTC, and from 22% (metropole) to 31% (midmile) using the WLTC.
4.2. Total Annual Cost of Delivery
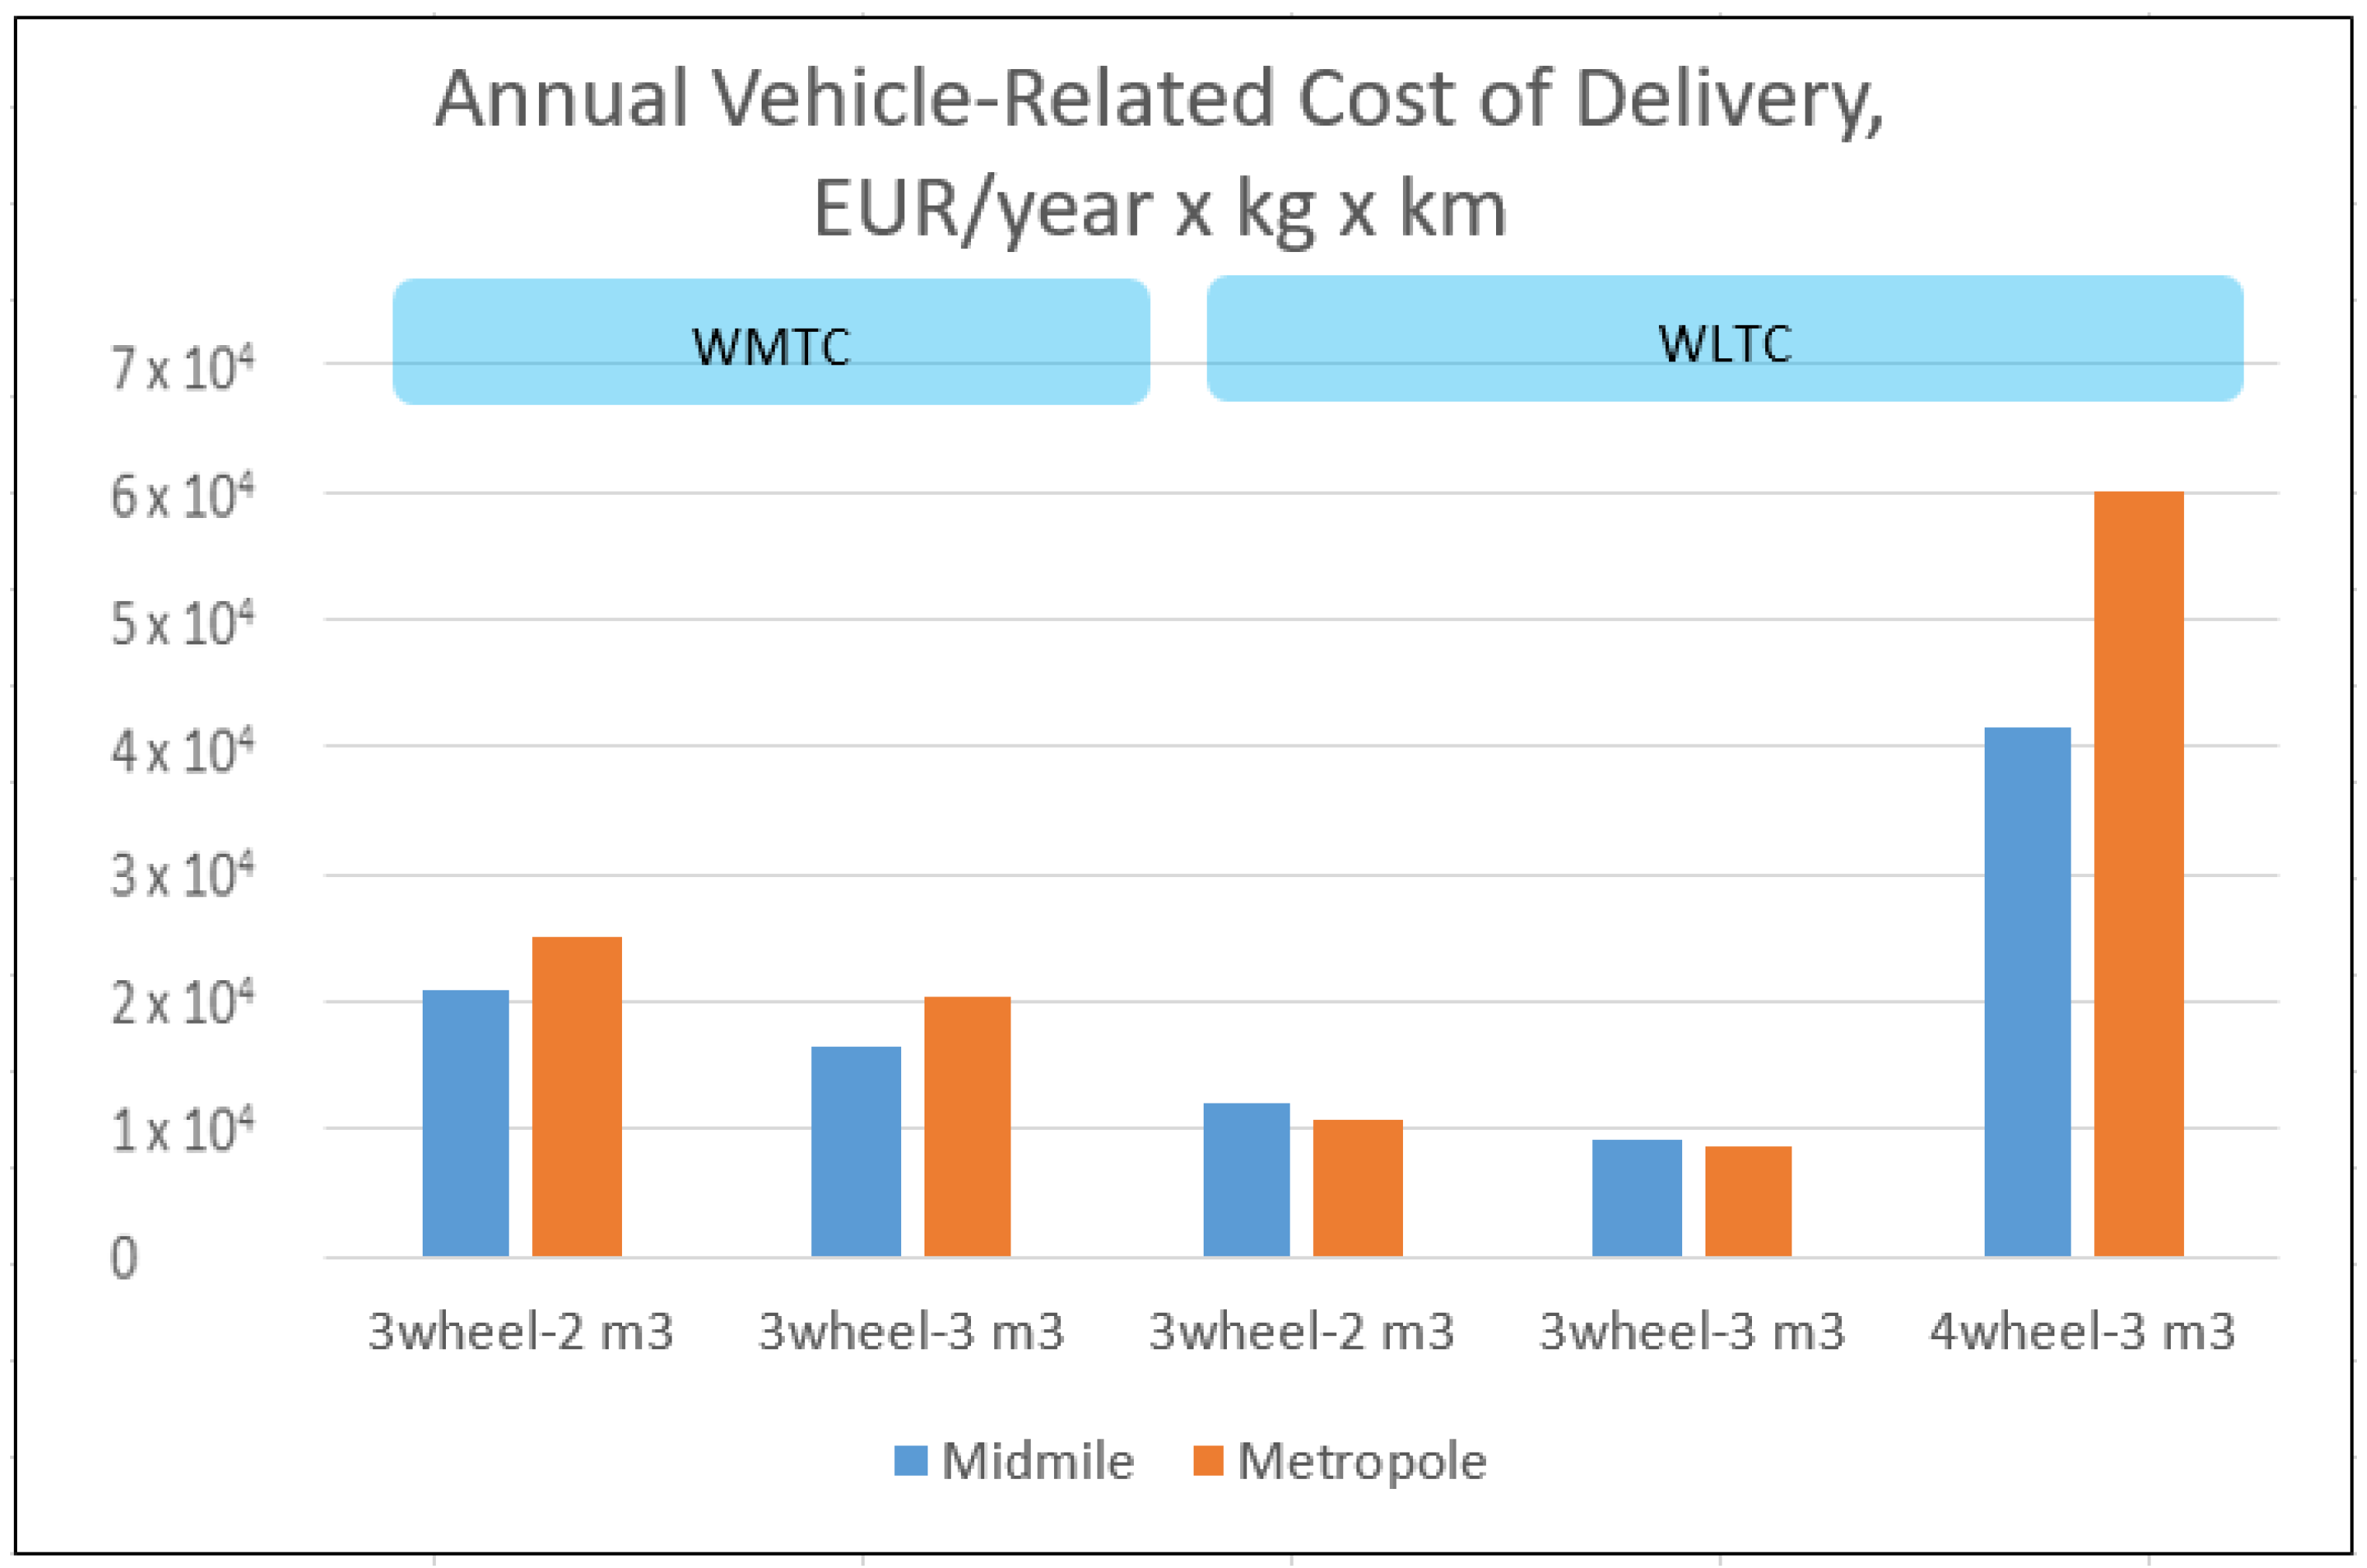
Recall that the annual cost of delivery in our work is represented by the annual vehicle-related cost of delivery (AVRCoD), i.e., the annual total cost of ownership (TCO) in Euros normalized by the total weight of packages that can be delivered, and the number of kilometers related to the use case of the vehicle.
The double-track vehicle showed the highest delivery costs: 4.14 × 10
−4 EUR/year × kg* × km for the midmile use case and 6.01 × 10
−4 EUR/year × kg* × km for the metropole use case. In
Table 6, both values are assumed to be 100% relative to the narrow-track vehicle results. The narrow-track vehicle with a cargo capacity of 3 m
3 achieved the lowest delivery cost values in the midmile use case: 9.25 × 10
−5 EUR/year × kg* × km. In the metropole use case, using the WLTC, the costs were 8.75 × 10
−5 EUR/year × kg* × km. In general, slightly higher values were achieved by the narrow-track vehicle when following the WMTC. There was also a greater difference in the resulting values when comparing the midmile and metropole use cases. The percentages for the 2 m
3 vehicle were 50% for midmile and 42% for metropole; for the 3 m
3 vehicle, they were 40% for midmile and 34% for metropole, compared to the double-track vehicle. All results are shown in
Table 6 and
Figure 11.
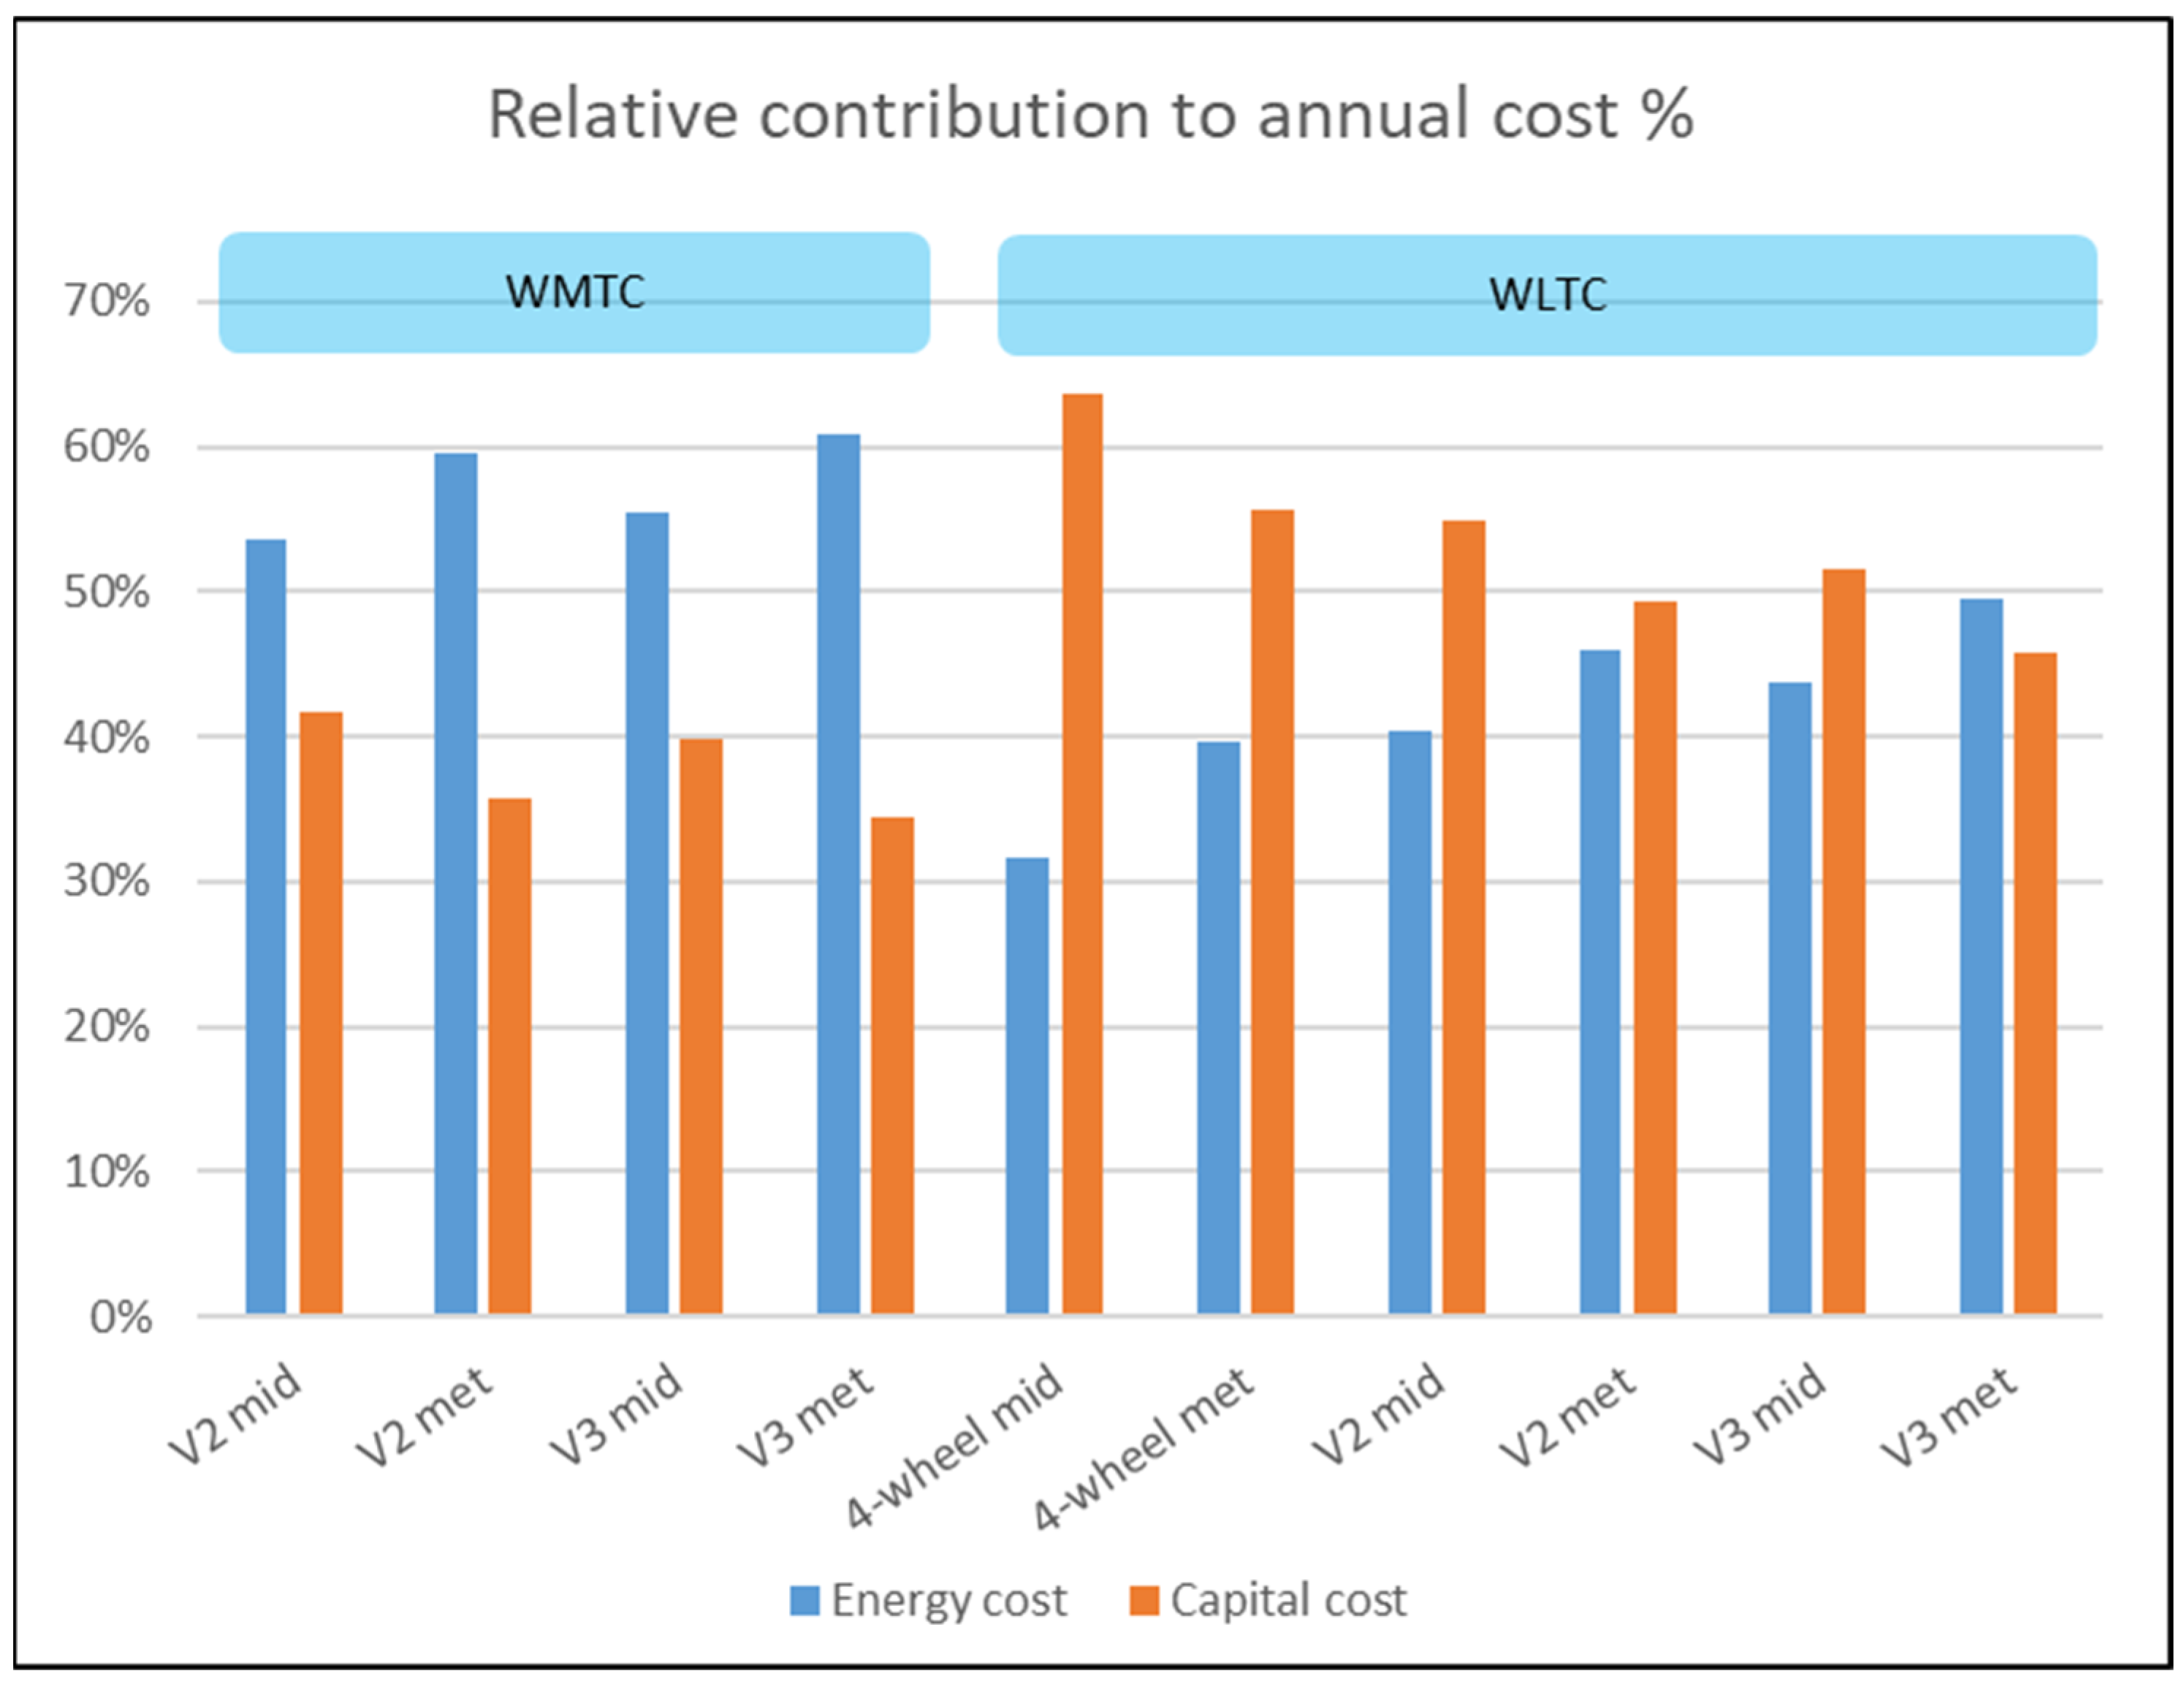
4.3. Relative Contribution to Annual Cost %
For more detailed results and to gain a deeper understanding when comparing the benefits and efficiencies of narrow-track vehicles with different cargo capacities, we divided the TCO per year by the number of kilometers traveled per year and the number of kilograms that can be delivered per year. This formula gave us the relative contribution to annual cost expressed as a percentage. The results, split into energy and capital costs, are shown in
Figure 12.
5. Discussion
The following subsections demonstrate the qualitative and quantifiable advantages of the proposed vehicle concept: a narrow-track leaning vehicle with the road signature of a motorscooter and the cargo capacity of a small four-wheeled vehicle.
5.1. Concept Design Methodology
This paper demonstrated the integration of total cost of ownership analysis methodologies, energy consumption prediction, and a methodical packaging design process used separately in previous works. We used the evaluation criteria in the reviewed literature to set goals for the conceptual design. We examined the aggregated method over different user use cases and cargo capacity size. This integrative approach is grounded in the belief that a singular design methodology may fall short in capturing the diverse needs and preferences of end users, particularly in the dynamic and complex integrative nature domain of urban delivery vehicles. The application of the aggregate design method to the conceptualization of an urban delivery vehicle serves as a practical demonstration of its efficacy.
5.2. Energy Consumption
The results show, as expected, that the narrow-track vehicle has lower energy consumption than the double-track vehicle. While the energy consumption of the four-wheel vehicle agrees with previous literature and commercial data, there is no reference for the proposed concept. The magnitude by which a narrow-track vehicle is more efficient—in the range 57% to 82%—is very significant. However, the characteristics of the drive cycle have a very high influence on the predicted energy consumption. This is evident when we examine the performance of a narrow-track vehicle when driven according to the WLTC and compared with the WMTC. In the case of the WLTC, the reduction in energy consumption is in the range 22% to 31%. When comparing the results of the same narrow-track vehicle running on the two different drive cycles, we see that the energy consumption drops to 44% in the midmile drive cycle. In the metropole drive cycle, the consumption drops even more—to 34%. The more significant energy benefit of the metropole drive cycle can be explained by its more aggressive acceleration, deceleration, and speed. The last conclusion further emphasizes the significance of drive-cycle characteristics on energy consumption.
Another factor with significant influence on the energy consumption of the narrow-track vehicle is its cargo capacity, mainly because of the contribution of the vehicle’s total weight and height. Based on the energy consumption results obtained from the analysis, it is evident that a narrow-track vehicle with a capacity of 2 m3 has an approximately 20% lower energy consumption compared to a similar vehicle with a capacity of 3 m3. This energy savings remains consistent across the given driving cycles.
Comparison of the resulting energy consumption of the narrow-track vehicle in the midmile and metropole use cases reveals that the vehicle achieves lower energy consumption in the midmile use case than it achieves in the metropole use case. However, when examining the WMTC drive cycles, we see a difference of 35%, while with the WLTC, the difference is less significant, amounting to approximately 5%. This difference may be due to the higher accelerations and decelerations of the WMTC. Therefore, the WMTC is more sensitive to the difference in vehicle weight. Another factor influencing this difference in results is the higher average speed difference in the WMTC (45%) compared to the difference when using the WLTC (32%). In addition, the consistently higher speeds of the WMTC make it more sensitive to vehicle height, affecting the frontal area. We can assess the effect of drive cycle and load capacity on energy consumption consistent with the literature reviewed.
5.3. Total Annual Cost of Delivery
In terms of the total delivery cost, the results showed, as we expected, that the narrow-track vehicle has a lower annual vehicle-related cost of delivery (AVRCoD) than the double-track vehicle. The magnitude by which a narrow-track vehicle is more efficient—in the range 34% to 50%—is very significant. It is also evident that the characteristics of driving cycles have a lower impact on AVRCoD prediction compared to their impact on energy consumption.
The reviewed literature does not have results equivalent to the AVRCoD that can be used for direct comparison. However, there are values for the total annual cost of ownership of various types of vehicles that show the results in this paper are reasonable.
5.4. Relative Contribution to Annual Cost %
Figure 11 illustrates an interesting phenomenon. The
AVRCoD for the metropole use case is higher under the WMTC than the
AVRCoD for the midmile use case, whereas it is smaller for the WLTC drive cycle. Moreover, in the case of the double-track vehicle with the WLTC drive cycle, the
AVRCoD on the metropole use case is higher. An examination of the breakdown of the
AVRCoD calculation explains these results. It is evident from
Figure 12 that energy cost is the predominant factor when driving according to the WMTC. This is because of the small vehicle weight and battery size and the more aggressive accelerations and speed. On the other hand, capital cost is the predominant factor when driving according to the WLTC. The energy consumption reduces by more than half when using the WLTC, while the capital cost remains the same. This is even more significant when examining the double-track vehicle. The vehicle cost is higher due to greater size and weight, requiring a bigger drivetrain and battery.
Concerning energy consumption, it can be seen that a narrow-track vehicle with a cargo capacity of 2 m3 generally achieves lower energy consumption. However, when considering the application of narrow-track vehicles to package delivery, achieving the lowest energy consumption may not be the highest priority requirement. Analyzing the relative contribution to annual cost results, we can deduce that the advantage of a narrow-track vehicle with a lower capacity, i.e., 2 m3, compared to a vehicle with a capacity of 3 m3 decreases when calculating on a per kilogram delivery basis. Consequently, a vehicle with a larger capacity of 3 m3 is more advantageous. The most financially viable use of a narrow-track vehicle occurs when it is used for a metropole use case in a moderate driving style, corresponding to the WLTC driving.
6. Conclusions
Transportation in emerging metropolitan environments, together with the growing need for package delivery, is becoming more challenging. The delivery industry needs to increasingly deploy more sophisticated approaches to overcome these challenges. Technological progress provides opportunities to rethink current solutions. However, any viable solution must appeal to the decision-makers, that is, the people who purchase and operate the vehicle. Any solution must therefore address the main concerns of the customer. This study has shown a methodical way of taking technical decisions based on customer value goals.
The demonstration of the proposed aggregate method through the conceptual design of an urban delivery vehicle and the practical validation of its efficacy is a proof of the contribution of this study to the following fields of research: vehicle design methods, vehicle technoeconomy, last-mile logistics, and vehicle energy prediction. The integration of user preferences, environmental considerations, and technological advancements in the design process illustrates the method’s ability to harmonize requirements and constraints. The resulting conceptual design not only addresses the specific challenges perceived by end customers, but also aligns with contemporary expectations of sustainability, efficiency, and user satisfaction. Furthermore, in recognizing the dynamic nature of customer preferences, technological advancements, and environmental considerations, this research contributes to the existing body of knowledge by emphasizing the importance of a flexible and adaptive design approach. In essence, this research advocates for a systematic methodology in the conceptual design of innovative vehicles, promoting the integration of various design methodologies into a cohesive and adaptive framework. By doing so, decision-makers and engineers can effectively respond to the challenges perceived by end customers, ensuring that the resulting vehicles not only meet functional requirements, but also align with evolving societal values and expectations. As the automotive industry continues to evolve, the insights and methodologies presented in this research provide a valuable foundation for fostering innovation and addressing the intricate demands of a rapidly changing world.
In this study, we have explored the claim that a narrow-track leaning vehicle for autonomous delivery has high potential for reducing financial costs and mitigating environmental impact. This exploration of concept serves as a unique contribution to the field of logistics vehicles. Additionally, it contributes to decreasing traffic and parking loads. This research aimed to examine the benefits for delivery operators of using the proposed narrow-track vehicles compared to traditional four-wheeled delivery vehicles in terms of efficiency and cost-effectiveness. This work has demonstrated that the proposed vehicle has an advantage over traditional four-wheeled double-track vehicles, both for between-neighborhood midmile trips and cross-city metropole trips. The research has also shown that the number of packages delivered per day with narrow- track leaning vehicles is significantly higher than those delivered by double-track vehicles, as long as the driving behavior exploits the agility of the narrow vehicle. This is evident in the ratio of average speed between the WMTC and WLTC.
This study has contributed to our understanding of vehicle layout and packaging consideration when the goal is economic efficiency and reduction in energy consumption. To complete the conceptual decision process, further research is needed to examine the stability and maneuverability of such large leaning vehicles in urban traffic conditions.
This study still needs to expand on vehicle stability at high speed and maneuverability, however, particularly in urban environments where congestion and tight spaces prevail. Stability and maneuverability may have a limiting effect on the vehicle cargo capacity, thus adding another layer to the concept design method. Such research will explore how stability and maneuverability affect various parameters in conceptual design.
While our current research has touched upon cargo capacity, future investigations should expand the scope to encompass a broader range in cargo types and sizes. This includes examining the adaptability of vehicle designs to accommodate diverse cargo loads, from small packages to larger, irregularly shaped items. The goal is to develop vehicles that optimize space utilization and offer flexible configurations to meet the varied needs of logistics and transportation services. Additionally, integrating modular cargo solutions can be explored, allowing vehicles to adapt to different cargo requirements.
Despite the growing interest in autonomous vehicles, the role of human drivers remains pivotal in many logistics delivery scenarios. Future research endeavors could focus on alternative concepts incorporating humans. A human driver poses many packaging constraints for safety and good ergonomics. Future research will explore the impact of these constraints on vehicle parameters.


