To anticipate the impacts on power quality resulting from the massive use of EV chargers in Colombian distribution networks, several field measurements were taken using power quality analyzers. This information allowed to characterize several EV chargers. Subsequently, a library of models was created for Level 1, Level 2 and Level 3 EV chargers available in the Colombian market. The prospective analyses were developed using ETAP simulation software, in the IEEE 13-bus test system, adapted to reflect a typical distribution system in Colombia. The modifications were carried out taking into account the typical demand curves present in the current load scenario for residential, commercial and industrial users in the country. Three scenarios are considered: the current state of the network (scenario 1) and demand projections for 2030 and 2040 (scenarios 2 and 3, respectively).
2.1. Collected Information
To characterize the main electrical parameters of the most common EV chargers available in Colombia, several measurements were carried out using network analyzer equipment. These measurements were performed upstream of the chargers mentioned below.
Table 1 presents the EV chargers that were monitored in the study, as well as their classification in terms of charging mode and level. In this case, all EV chargers used in the tests are off-board. Note that some of them feature Charging Mode 1 which is still currently used in Colombia; nonetheless, it is expected that this charging mode won’t be used in the future. These categories are defined according to the relevant regulations, specifically NTC-IEC 61851-1 and Resolution 40223 of 2021 of the Colombian Ministry of Mines and Energy (MME), which address aspects related to the safety and charging power of these devices. The following charging levels are considered:
Charging Level 1: it uses a standard Alternating Current (AC) outlet. Its power rating is less than 3.7 kilowatts [kW].
Charging Level 2: it requires the installation of a charging station with an alternating current (AC) connection. Its rated power is between 3.7 kilowatts [kW] to 22 kilowatts [kW].
Charging Level 3: it consists of a fast load with connection to Alternating Current (AC) or Direct Current (DC). Its rated power is greater than 22 kilowatts [kW] in AC and greater than 50 kilowatts [kW] in DC.
Table 2 presents a summary of the electrical parameters measured for the EV chargers described in
Table 1. These parameters include voltage, current, active and reactive power, power factor and individual percentage of harmonics present in the current waveform of each charger. It is worth mentioning that the EVA080KS fast EV charger operates at low load and is single-phase connected, therefore the presence of third harmonics. The main objective of this activity was to create a real library for each electrical charger to be used at a later stage of the study in the ETAP simulation software.
2.2. Test Network
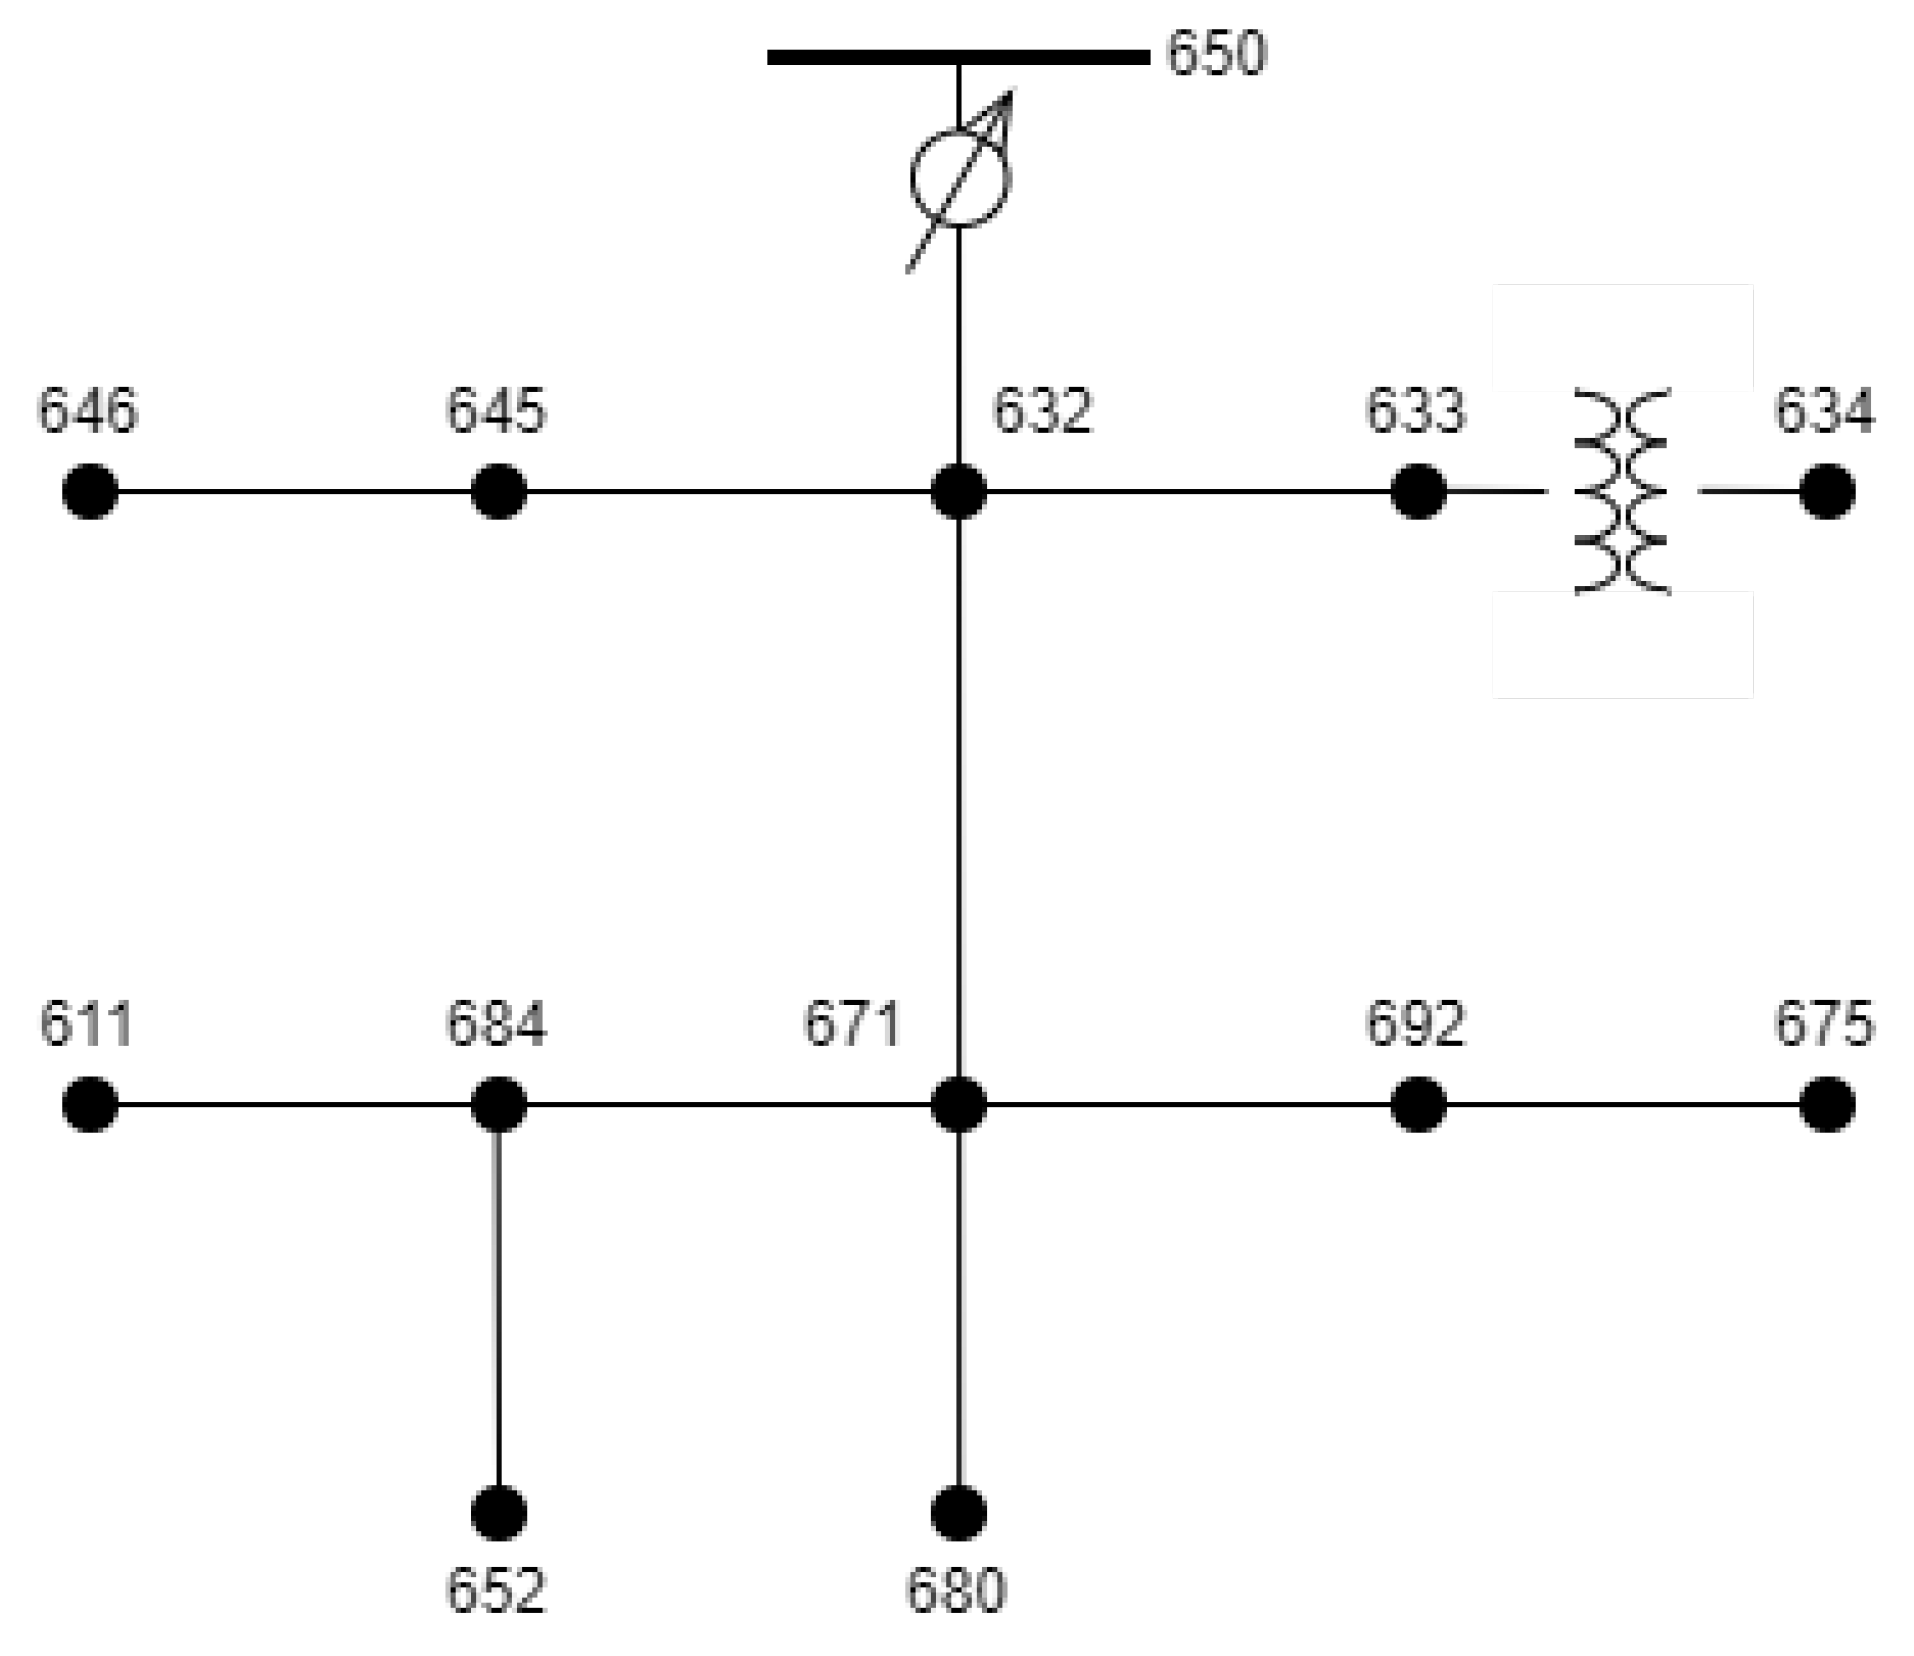
Benchmark test systems play a key role in electrical studies because they provide a standardized and consistent basis for comparison, enabling researchers, engineers, and manufacturers to assess the capabilities and limitations of new technologies, components, or methodologies. In this study, the IEEE 13-bus test system illustrated in
Figure 1 was used. In this case, node 650 is the common connection point or link with the substation where all the loads of the system are aggregated.
The IEEE 13-bus test system is a benchmark power system widely used in power systems research and analysis. This simplified representation of an actual power network comprises 13 buses (nodes) interconnected by transmission lines and transformers, designed to simulate various operational conditions. The system includes a mix of different types of buses and serves as a fundamental model for evaluating power flow, fault analysis, and stability studies, allowing researchers to test and compare different algorithms, control strategies, and optimization techniques.
Several modifications to the load of the IEEE 13-bus test system are carried out to simulate a typical Colombian distribution system. The electricity generated in Colombia is distributed in sectors such as residential, industrial, commercial, services, mining, construction and others. Based on the sectorized electricity consumption matrix of Colombia, each of the nodes of the IEEE 13-bus test system is classified according to the percentage of load demanded at each bus as indicated in
Table 3.
2.3. Scenarios Definition and Pilot Nodes
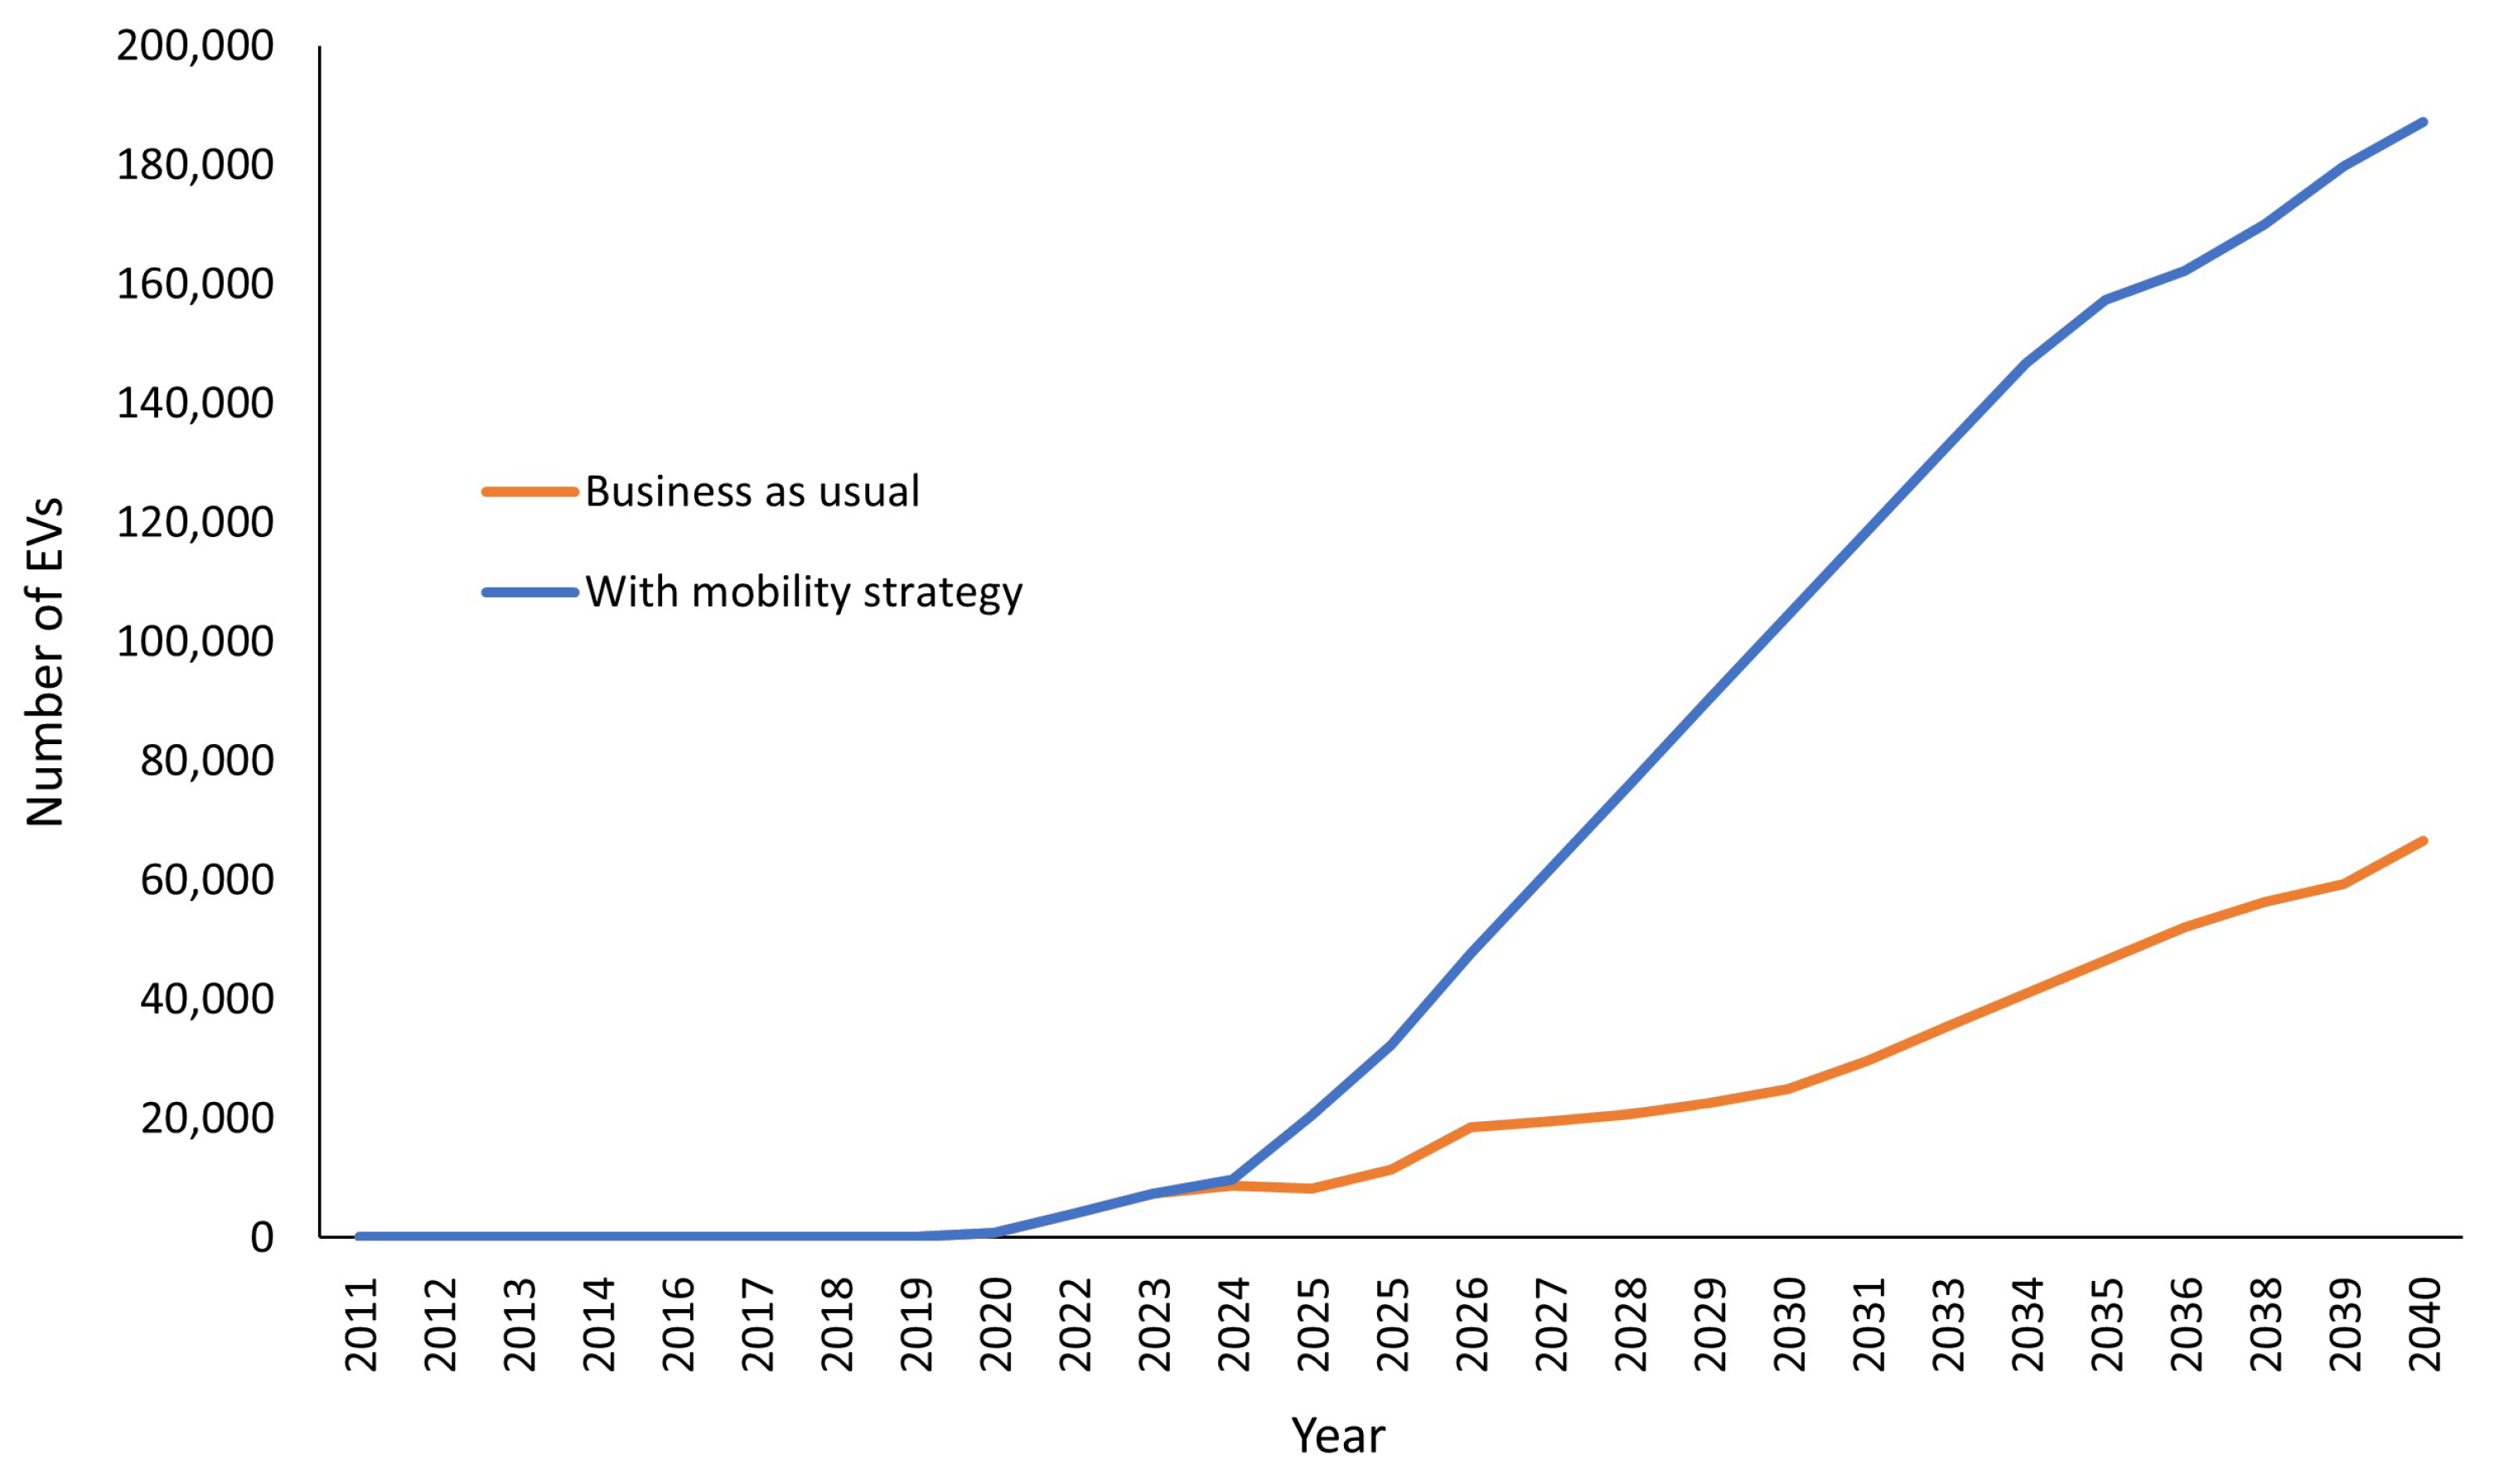
For generating the simulation scenarios, a projection of the growth of the EV fleet in the country up to the year 2040 is used. This projection is based on the national electric mobility strategy developed by the country’s Mining and Energy Planning Unit (UPME) which is illustrated in
Figure 2 [
26].
Although the load growth is expected in all nodes of the test system, three pilot nodes are selected for detailed analysis: 652, 671 and 692 which present residential, industrial and commercial loads, respectively. In the case of the commercial and residential nodes, demand growth was assumed not only in the number of EV chargers but also in the consumption associated with the homes and commercial buildings of the network. Based on the EV sales projection presented in
Figure 2, and in the absence of a government mobility strategy (business as usual), three scenarios were put forward to estimate the load growth of the aforementioned pilot nodes as shown in
Table 4.
These scenarios are used to anticipate how the growth in the adoption of EVs will impact different segments of the electric grid, which in turn will allow for more effective planning to ensure the availability and quality of power supply in these sectors.
Note that the pilot nodes are far from the main source or substation (bus 650). This choice was made to show how power quality problems propagate through the distribution system and ultimately affect the substation, allowing for a more complete assessment of the effects of EV chargers in various areas of electric distribution systems.
To estimate the percentage share of final energy consumption by EVs in Colombia for the years 2030 and 2040 (scenarios 2 and 3, respectively), the data projected by the National Electric Mobility Strategy was used [
26]. The EV participation by 2030 and 2040 considering projections of EV energy demand and the energy demand of the National Interconnected system (
) is computed as indicated in Equation (
1).
The results of these calculations provide approximate estimates of the percentage share of EVs in final energy consumption in Colombia for the years 2030 and 2040 as shown
Table 5. These projections are subject to uncertainty and may vary according to factors such as government policies, EV adoption and the growth of charging infrastructure.
According to
Table 5, the electricity consumption of the Colombian transportation sector is estimated to account for 8.7% of the total electricity consumption of the country by 2030 (scenario 2) and to increase up to 18.6% by 2040 (scenario 3). The scenarios described in
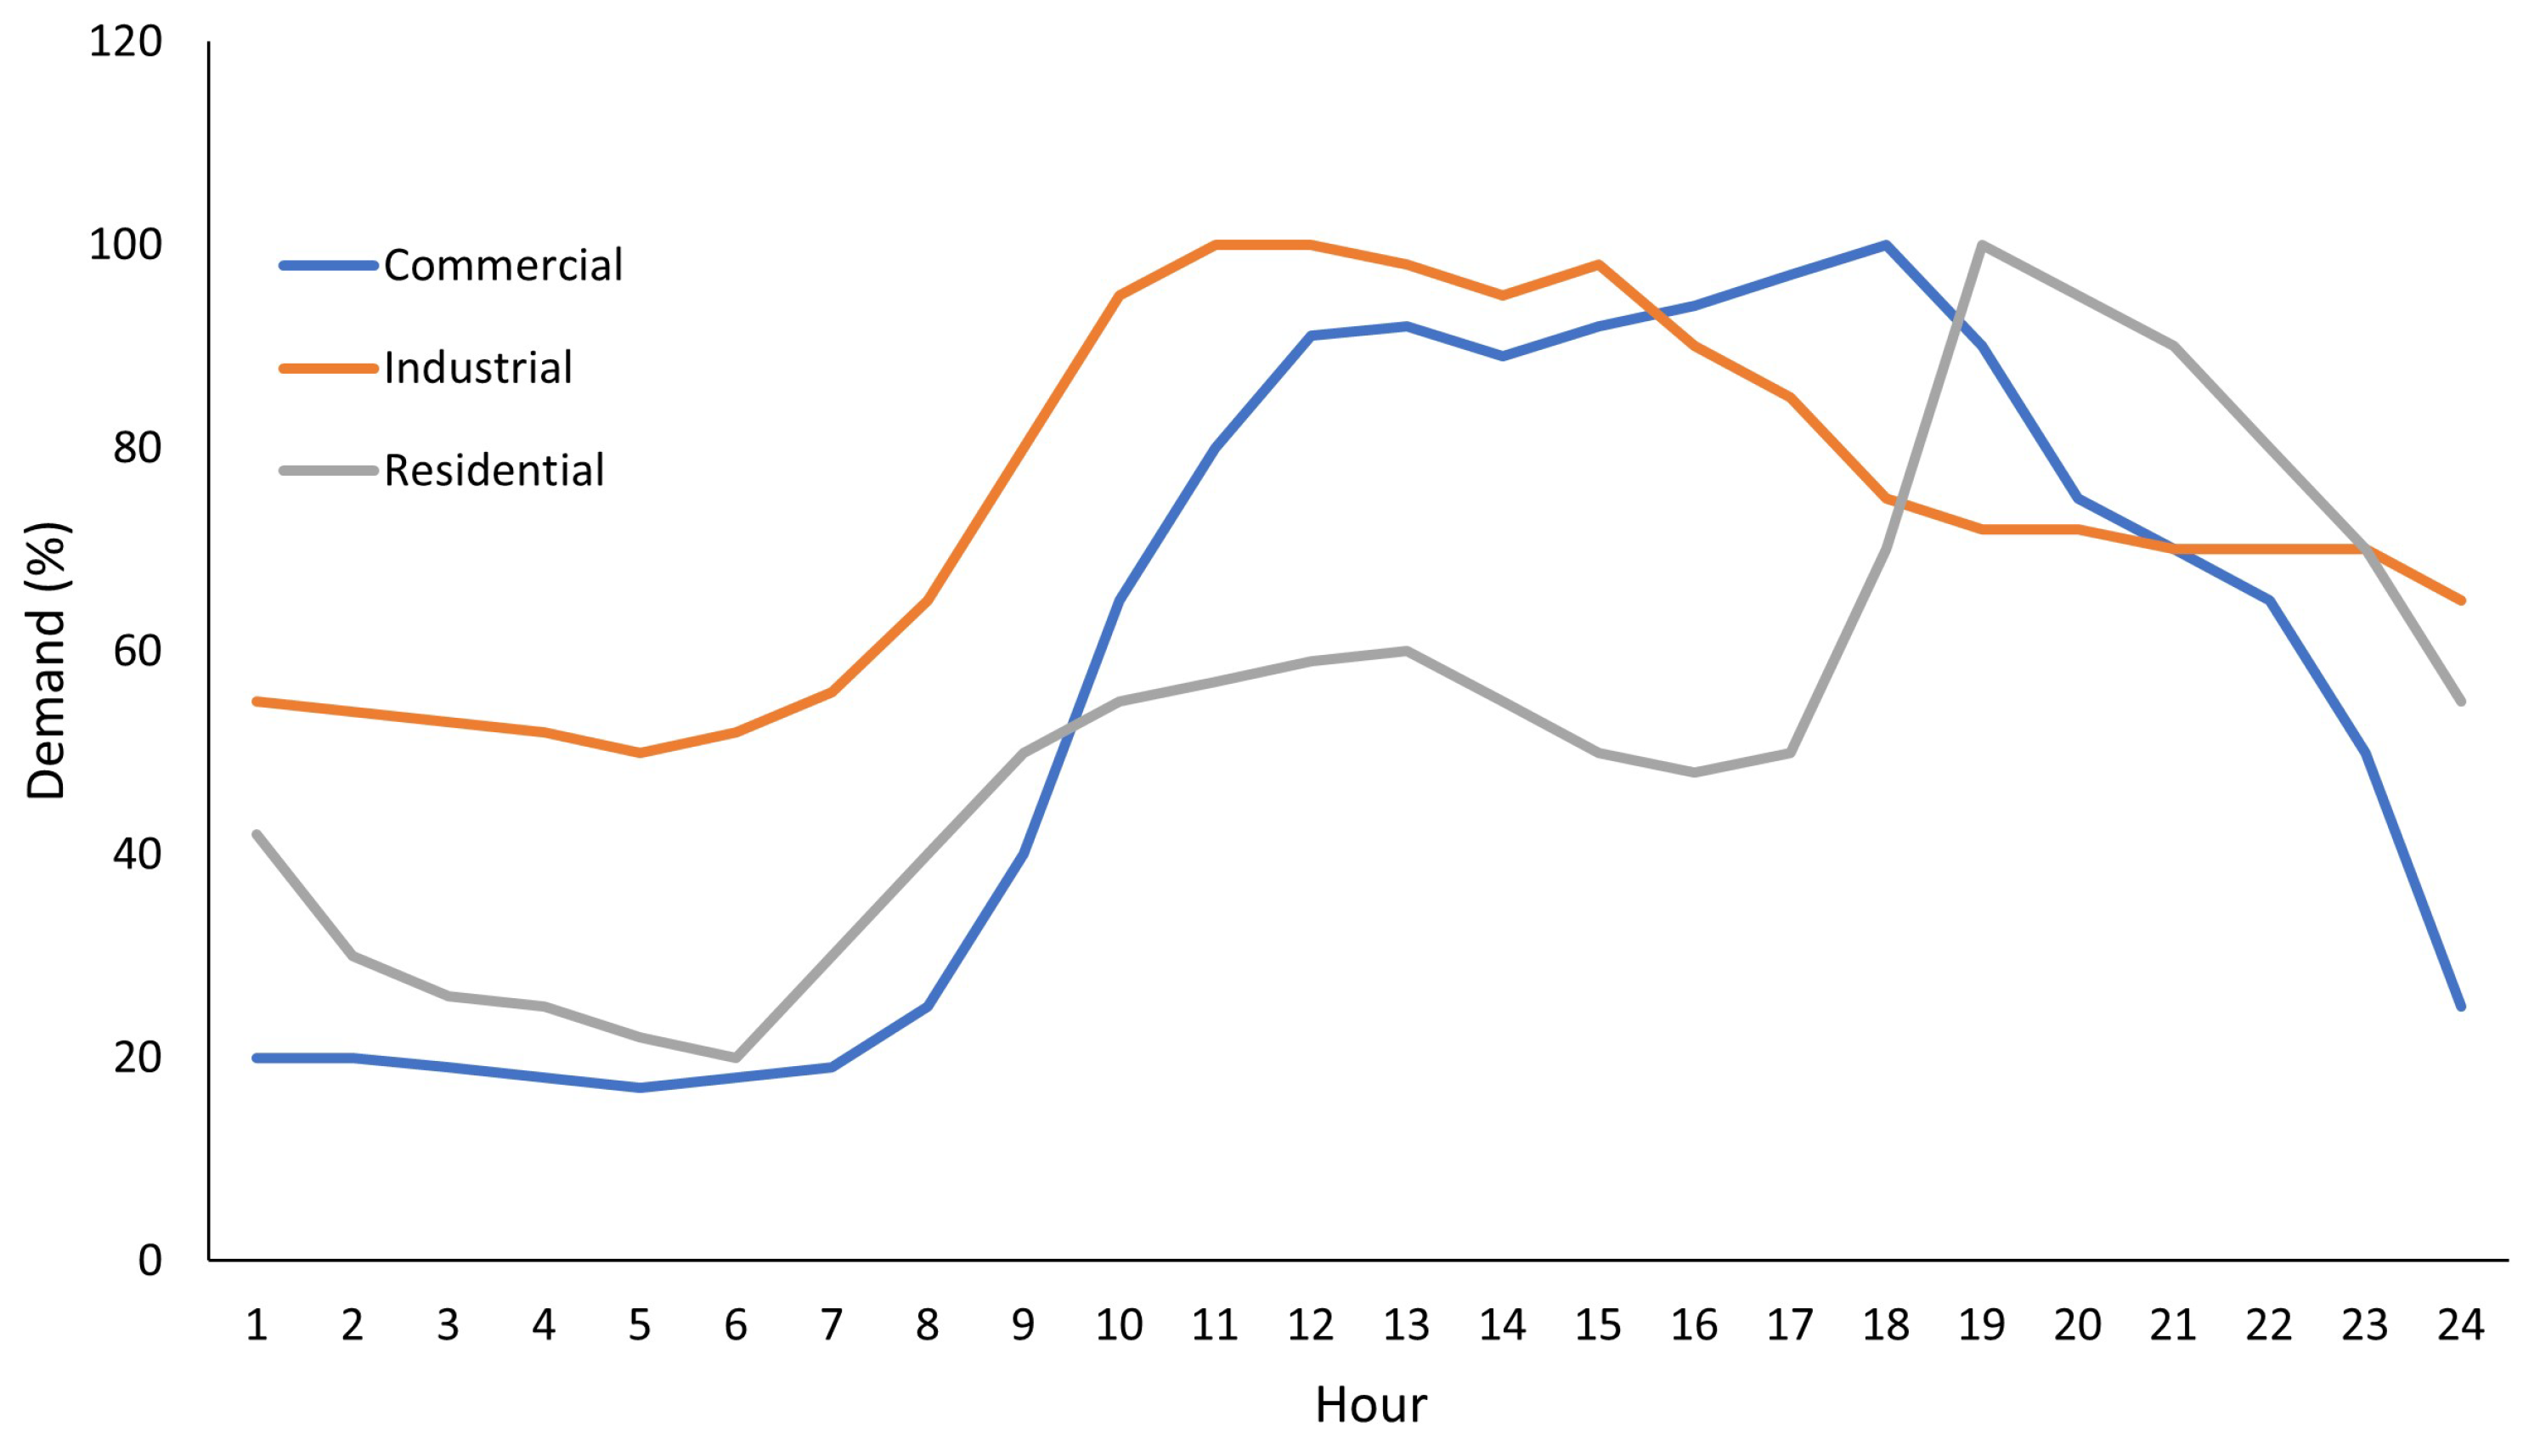
Table 5 are simulated on the IEEE 13-bus test system, adapted to reflect a typical Colombian distribution system by implementing load curves for residential, commercial and industrial sectors as indicated in
Figure 3.
Typical users of Colombian distribution systems encompass a mix of residential, commercial, and industrial consumers. In densely populated urban areas, residential and commercial users are prevalent, while in rural regions, distribution may focus more on dispersed residential or agricultural users. Typical distribution voltages range between 110 V and 440 V for residential and commercial users, while for industrial applications and some commercial users, voltages can vary up to 13.2 kV in medium-voltage networks.
The topology of distribution networks in Colombia varies based on the region. Urban areas commonly feature overhead distribution networks, whereas rural and mountainous zones may involve overhead lines and underground systems due to geographical conditions. In terms of technologies, there is an ongoing transition towards digitalization and the implementation of smart meters to enhance network management, efficiency, and data collection for analysis and control of distribution systems [
27].
In Colombia, a typical demand curve of a residential user experiences its highest energy consumption between 18:00 h and 21:00 h with a minimum demand between 22:00 h and 5:00 h. The commercial demand curve shows higher consumption between 9:00 h and 22:00 h, coinciding with the usual opening and closing hours of commercial establishments. The industrial demand curve reflects the period of maximum energy consumption from 7:00 h to 17:00 h, by the usual working hours of Colombian companies. It is important to highlight that in this sector, even during off-peak hours, consumption exceeds 50% of the peak demand. This is due to companies that operate continuously, keeping extended working hours.
2.4. Adaptation of Demands in Pilot Nodes
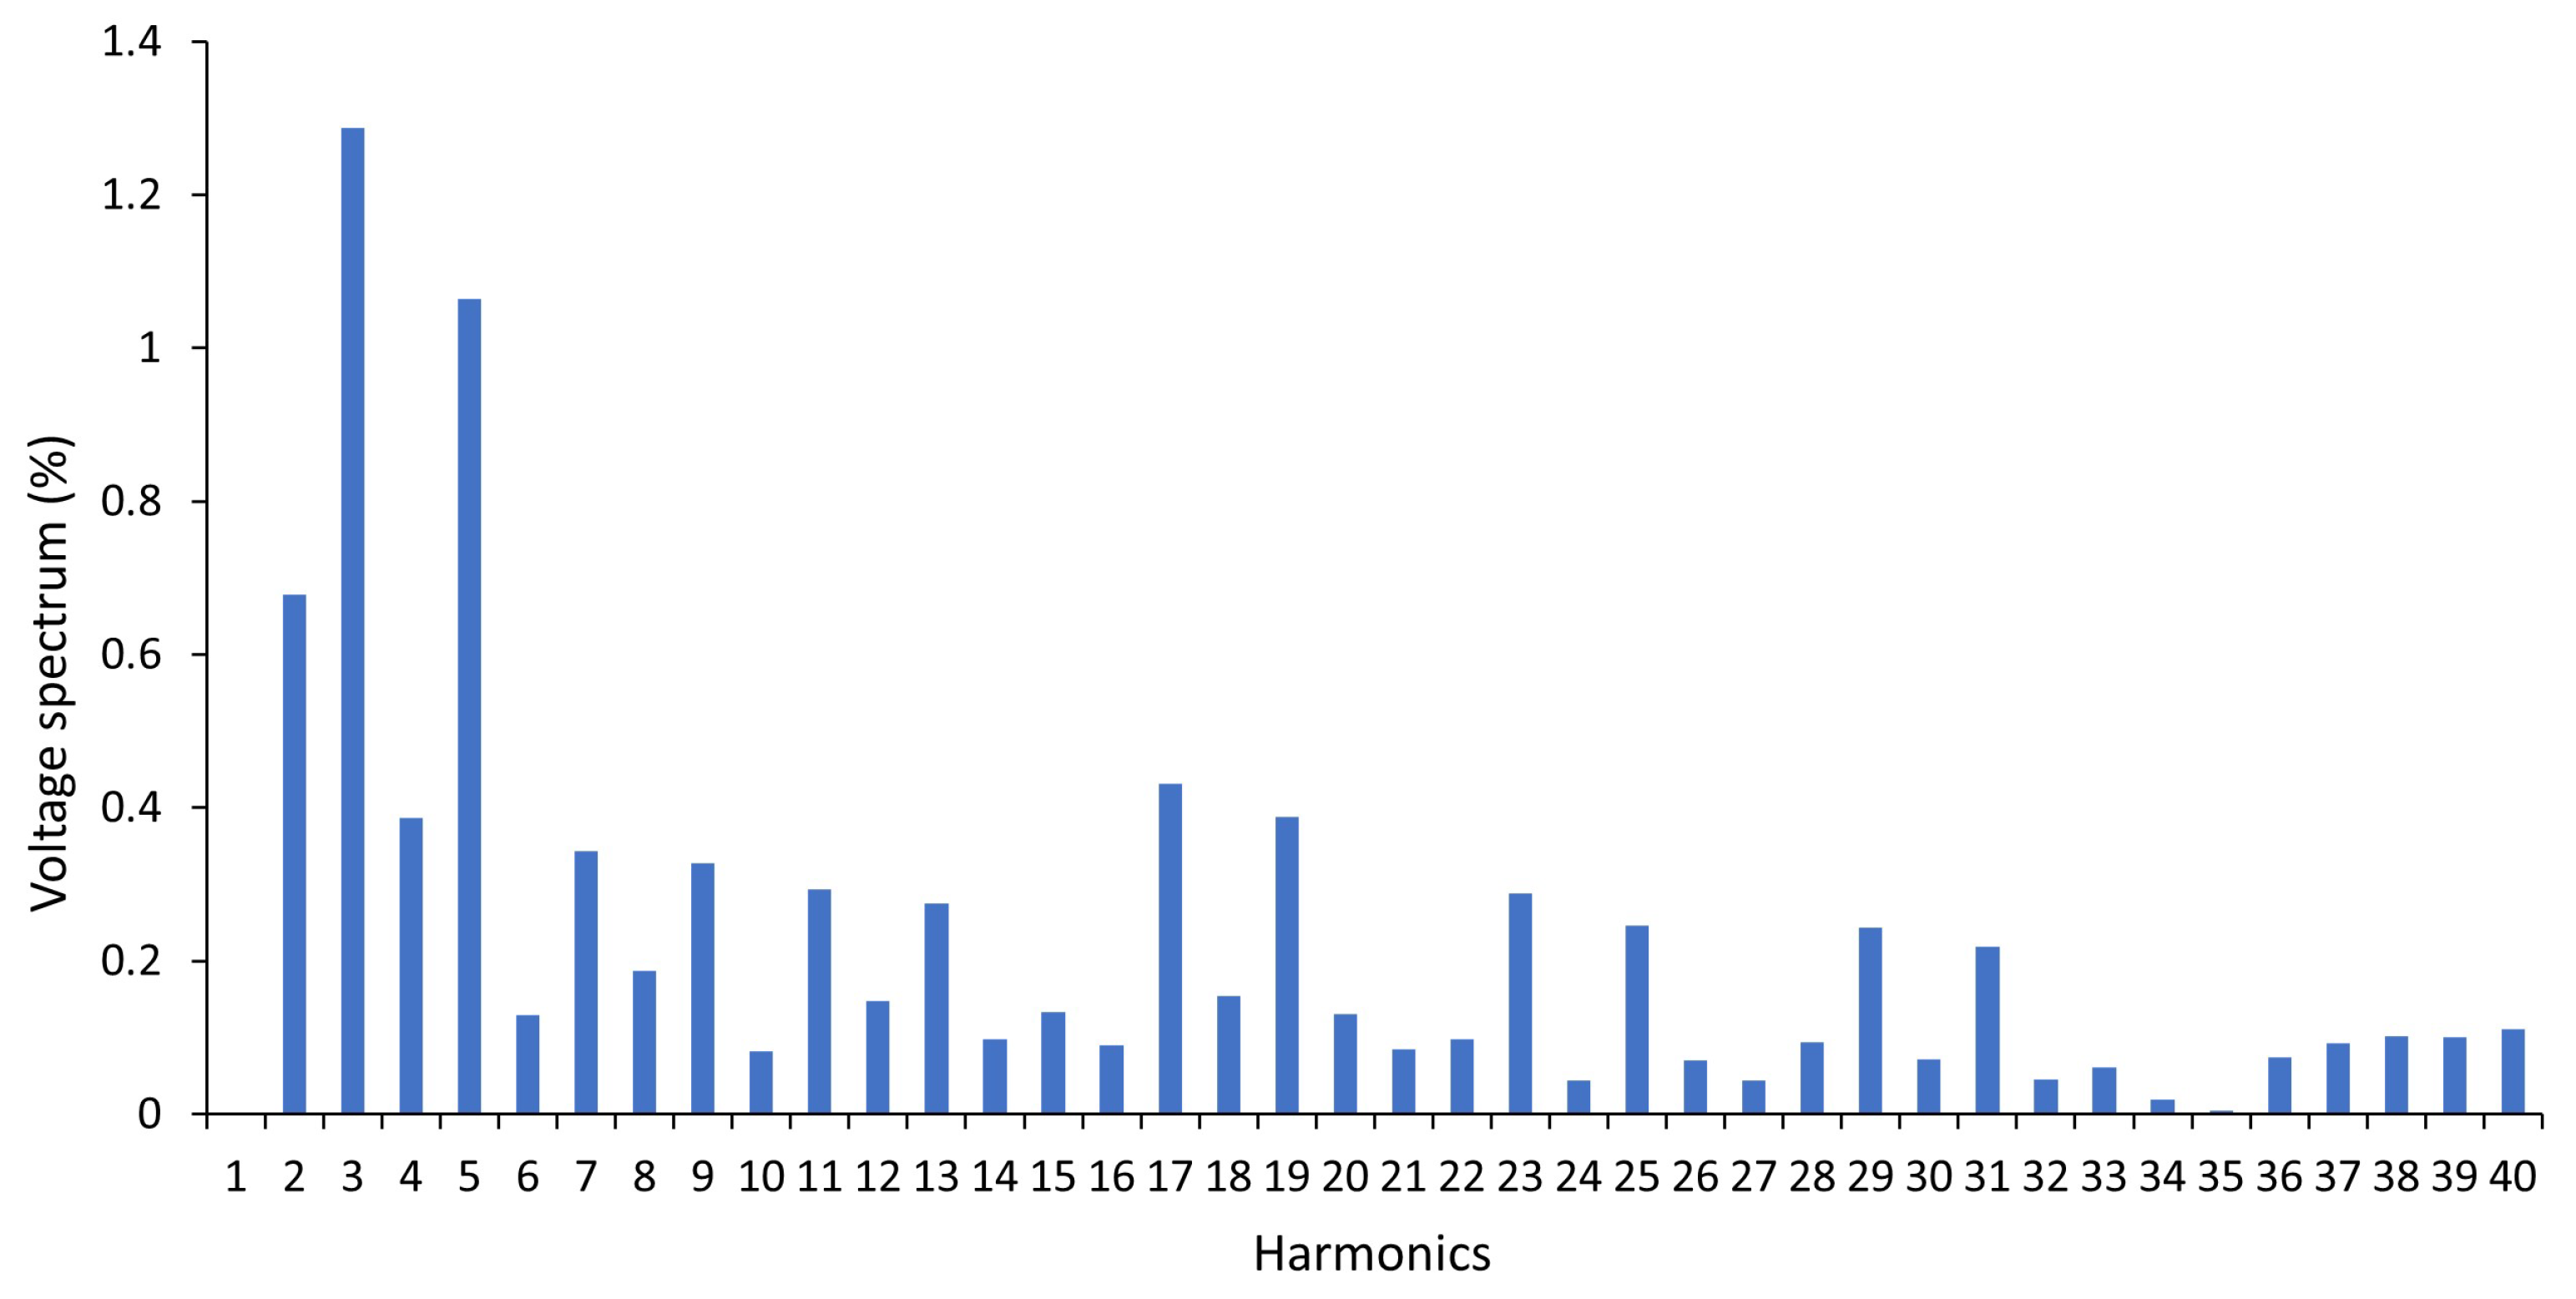
The network equivalent connected at node 650 was modified adding typical voltage harmonics, as shown in
Figure 4. In this case, the voltage waveform presents a Total Harmonic Distortion (THD) of 2.15%. A typical sub-network of a residential complex was included in the simulation, considering that the parking lots have charging stations for EVs. It was assumed that, on average, there is one charger for every two vehicles.
Node 671 was configured with an industrial-type load profile for the base scenario. However, in scenarios 2 and 3 projected for the years 2030 and 2040, respectively, a significant increase in demand for industrial-type chargers was considered. The load profile at node 671 follows the public transport schedules of major cities in Colombia, which run from 5 a.m. to 10 p.m. During this period, EV chargers remain in standby mode. In the remaining time, they are in full charge condition to ensure the recharging of the transport fleet.
A commercial charging profile is initially established for the base scenario in node 692. However, scenarios 2 and 3 incorporate typical loads from chargers with a semi-fast charging type. These chargers are located in the parking lots of shopping malls and play a key role in the Colombian electricity system. In this context, Level 2 chargers are included, taking as a reference the measurements made in the field. The incorporation of semi-fast chargers in scenarios 2 and 3 represents an important variation in the charging demand in node 692.
Node 652 is modeled as a typical sub-network of a residential complex, considering that the parking lots have charging stations for EVs. It has been assumed that, on average, there is one charger for every two vehicles.
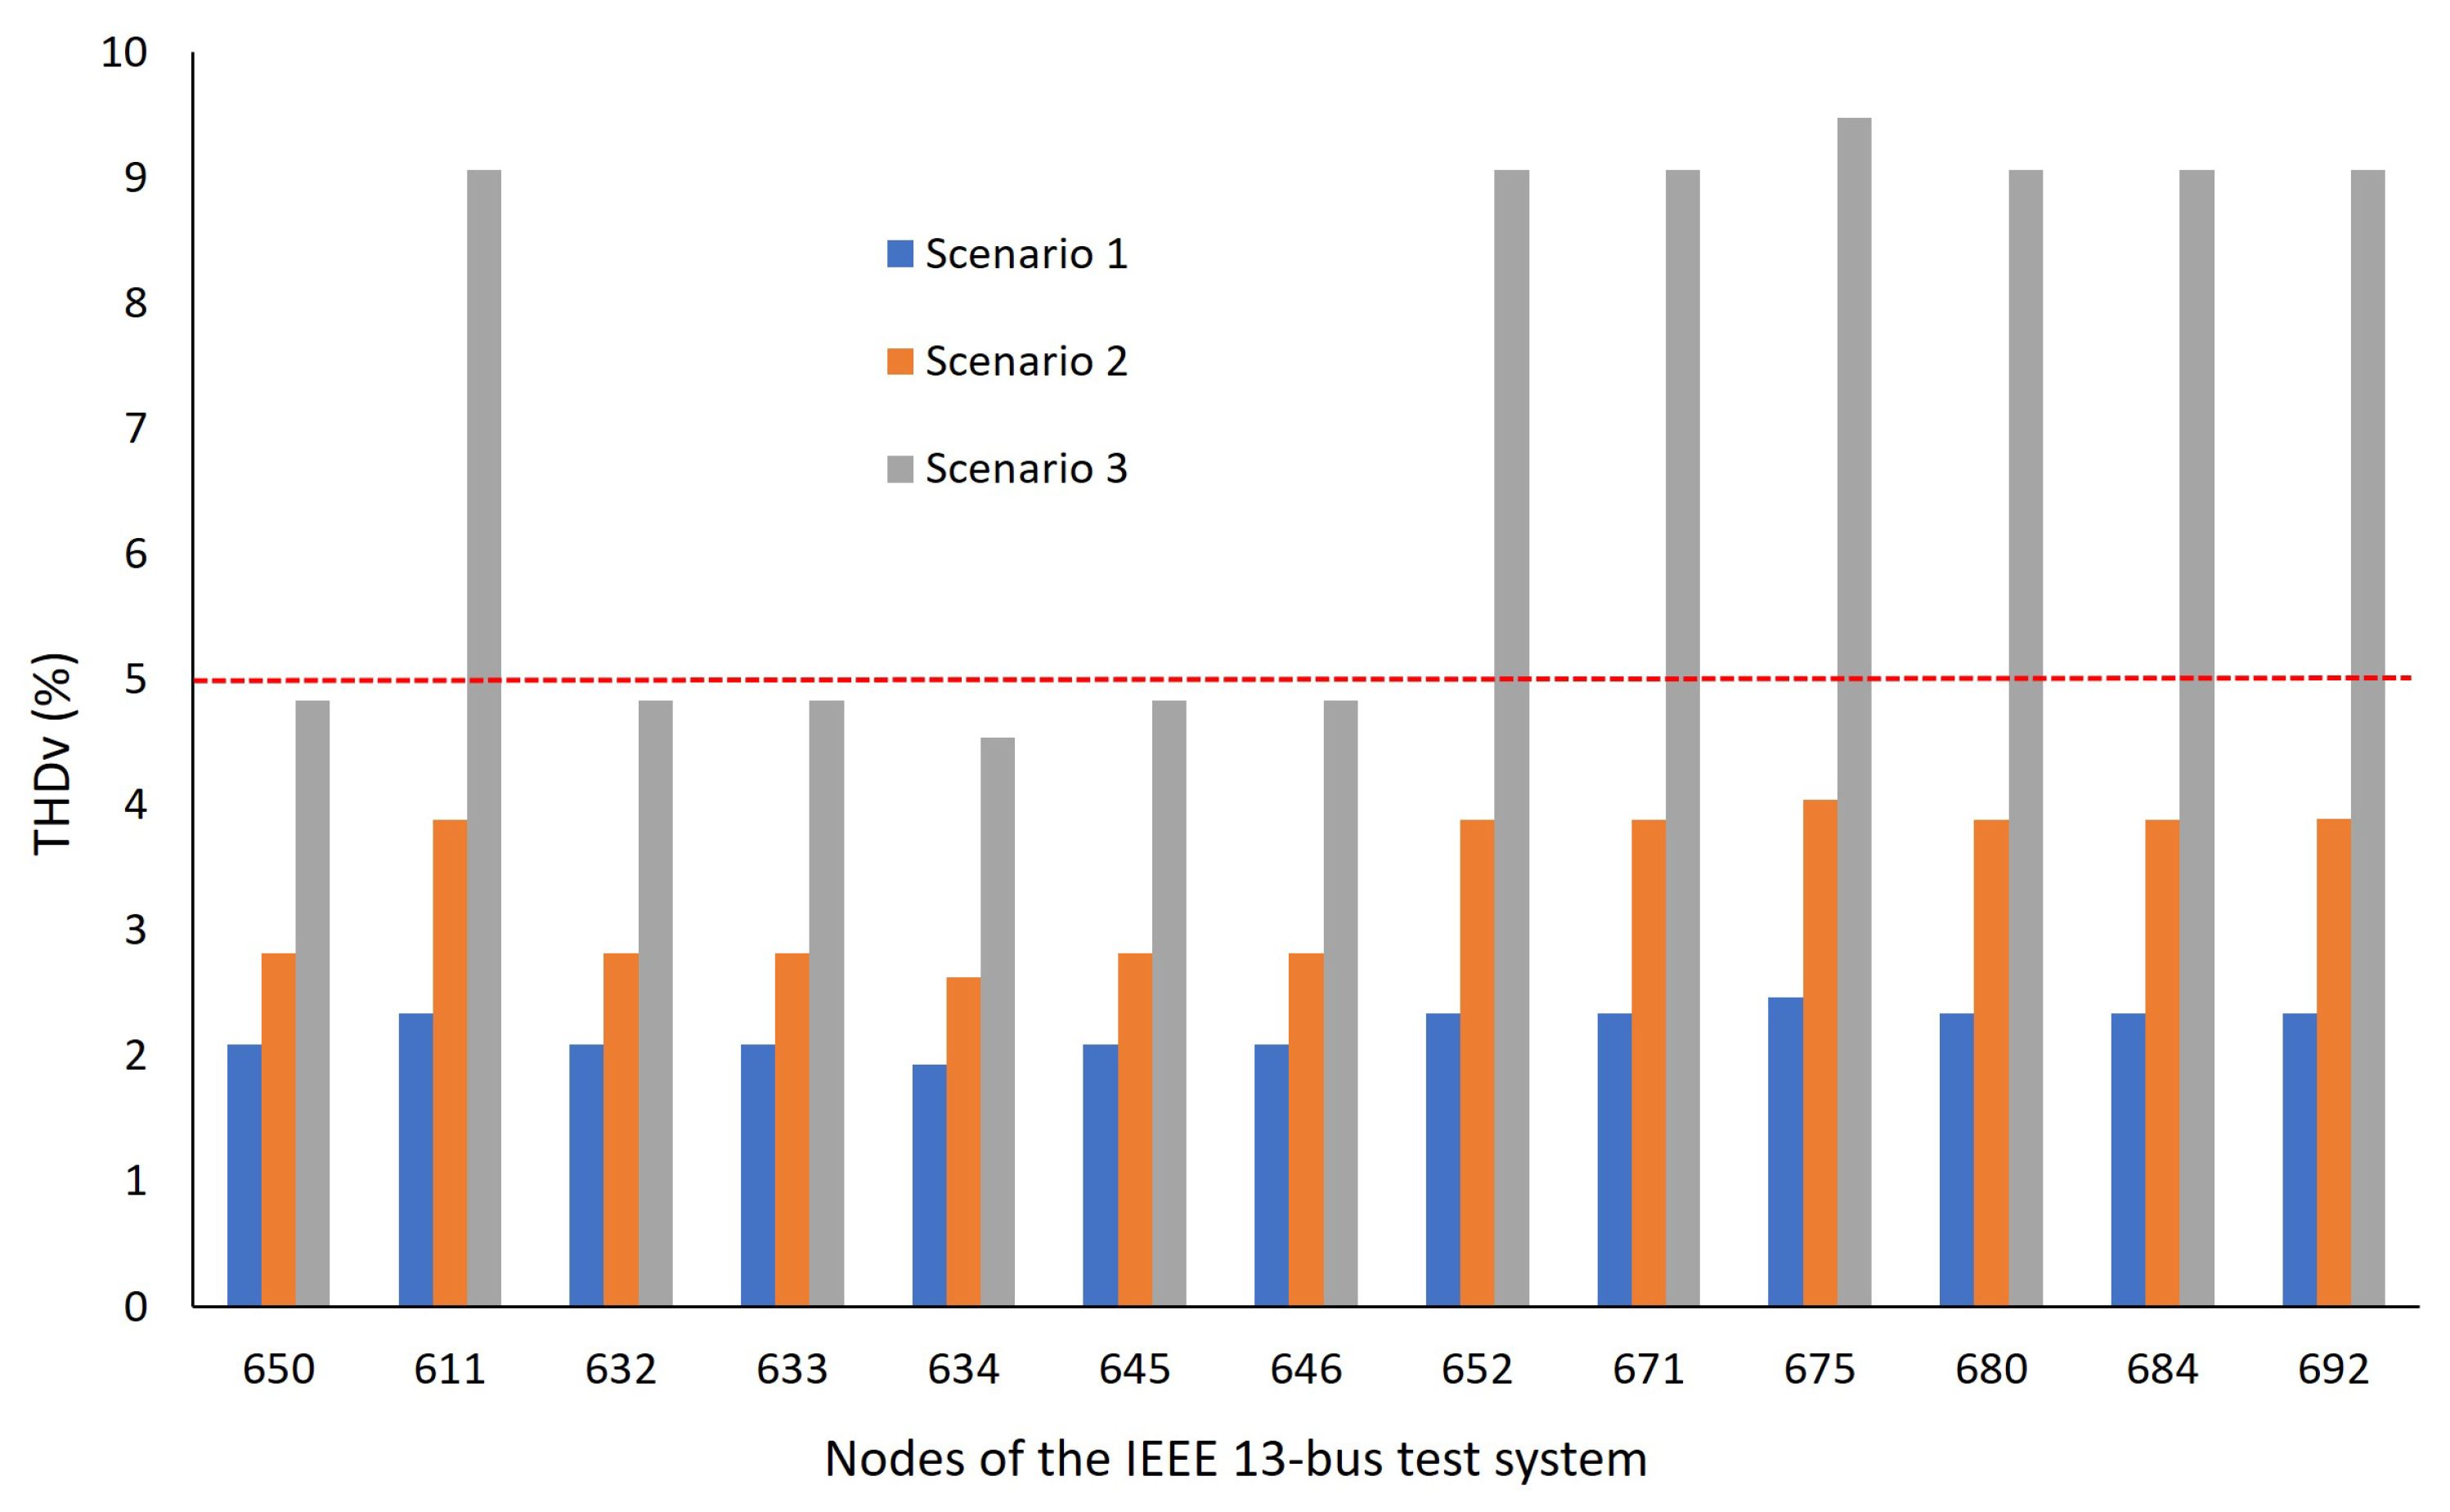
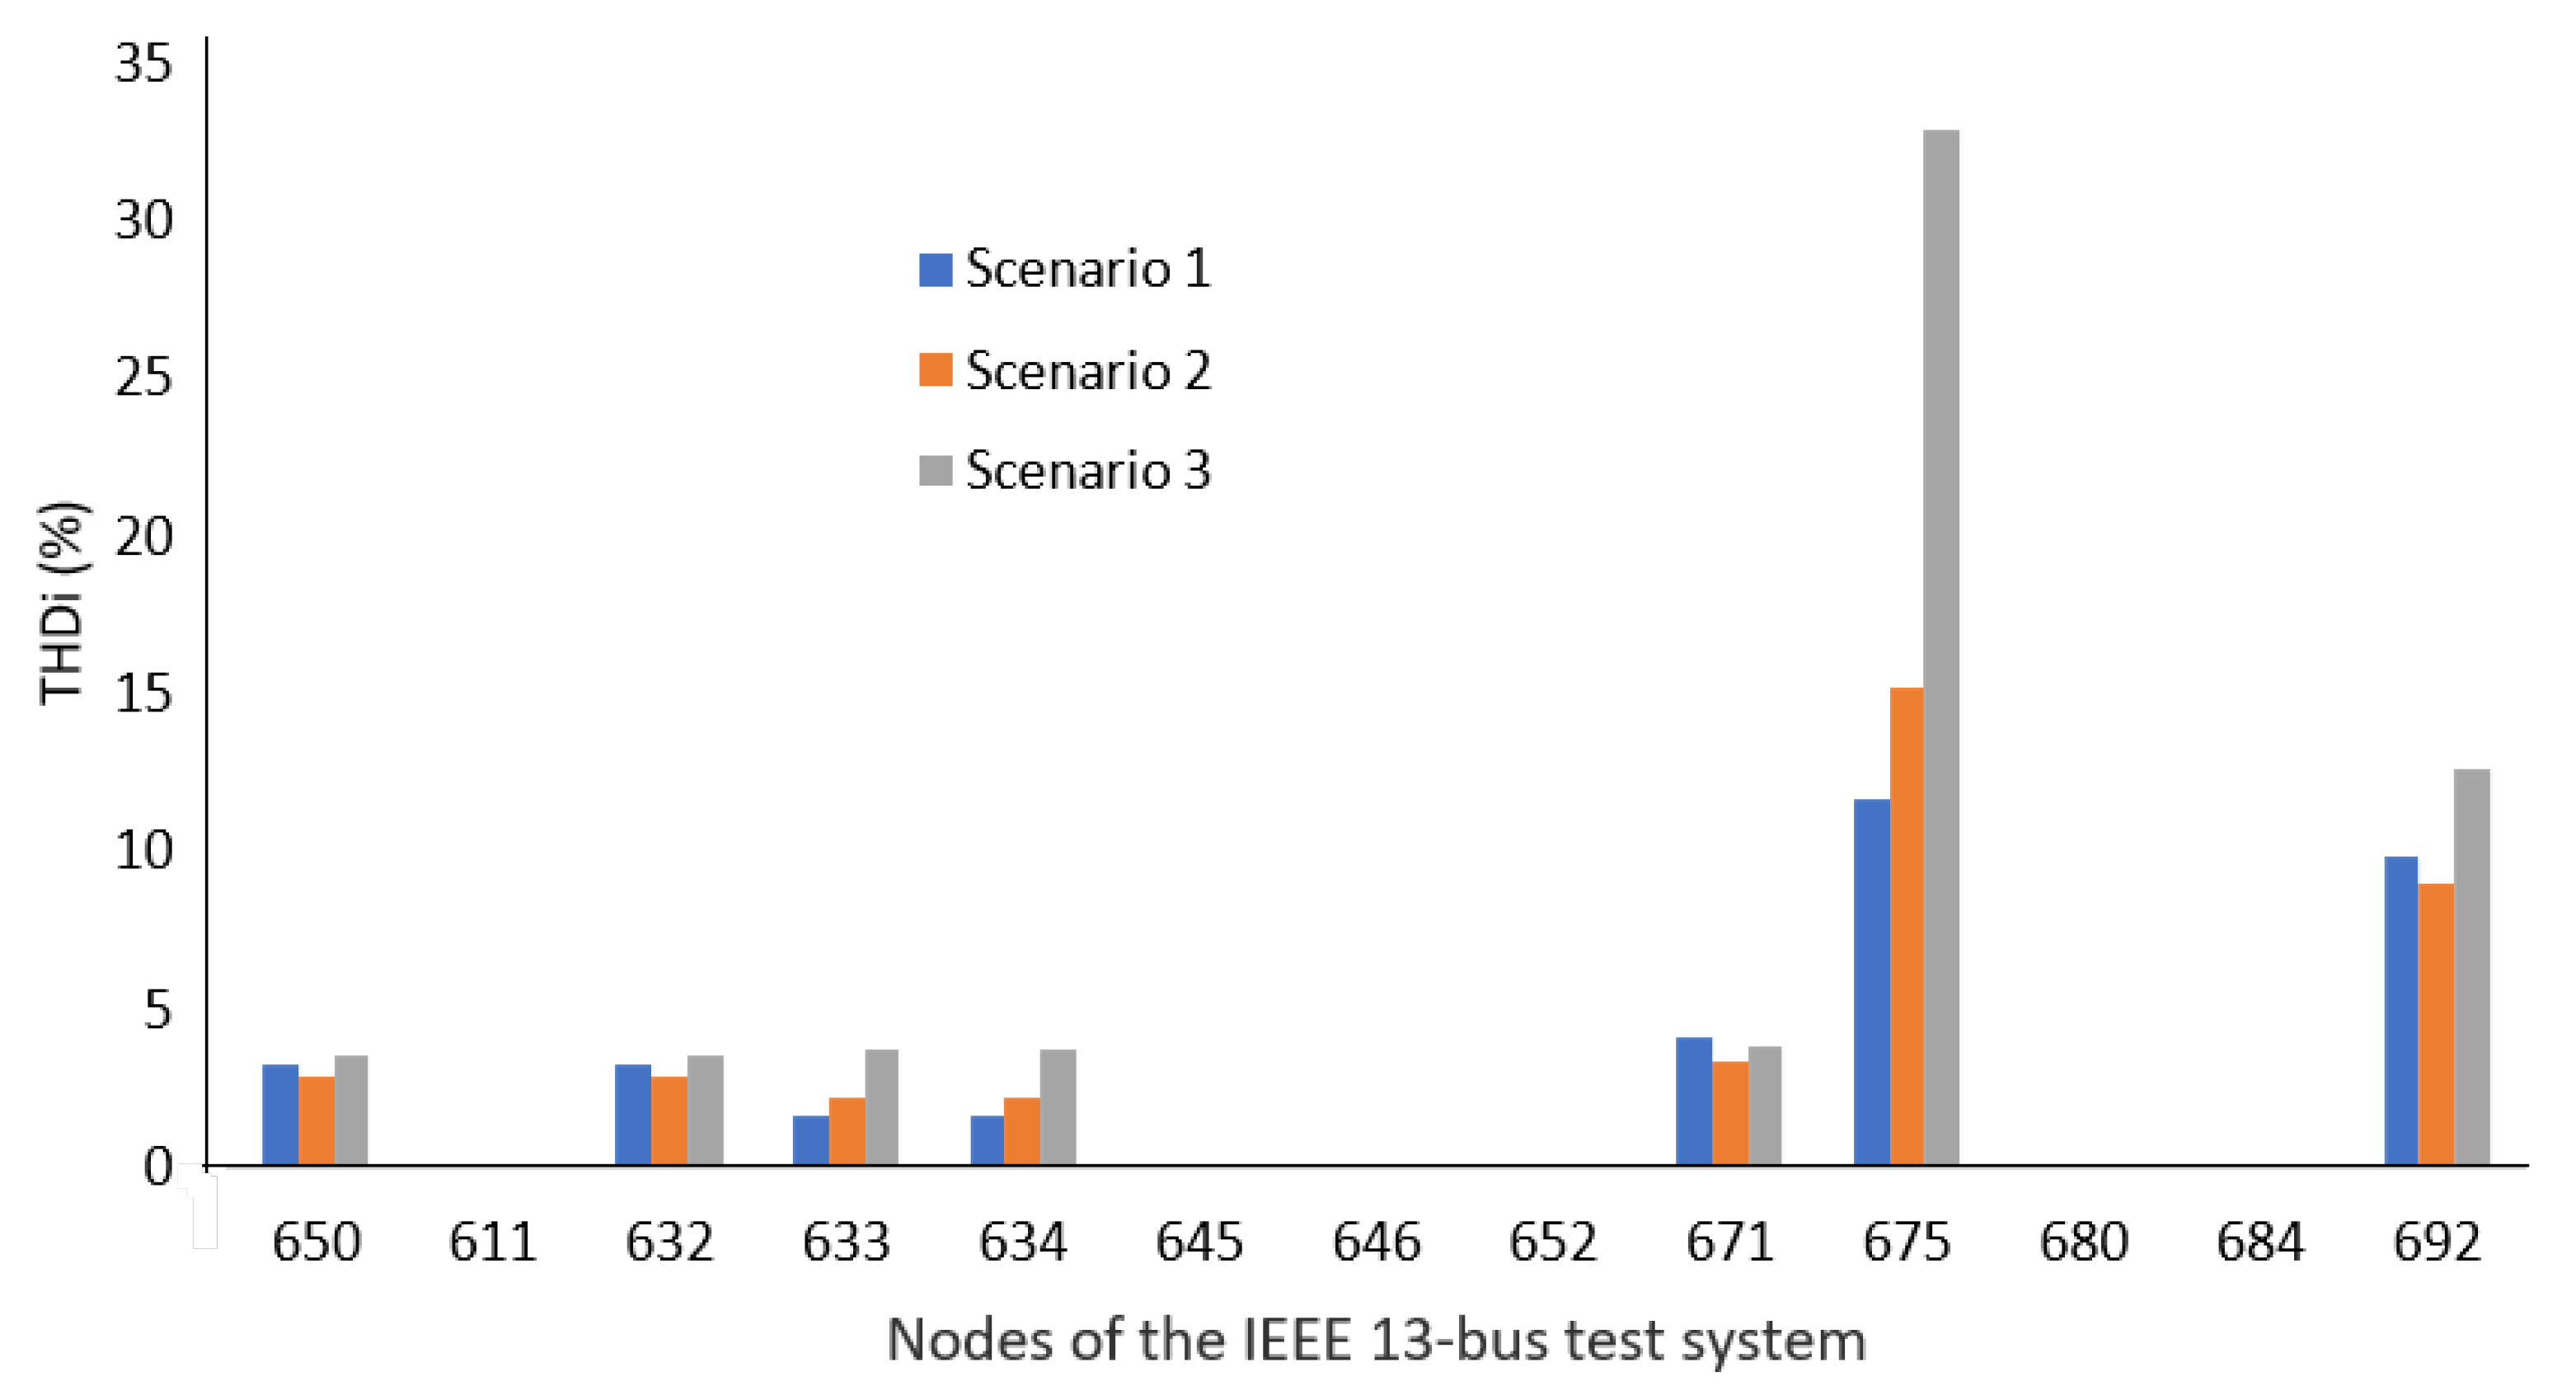
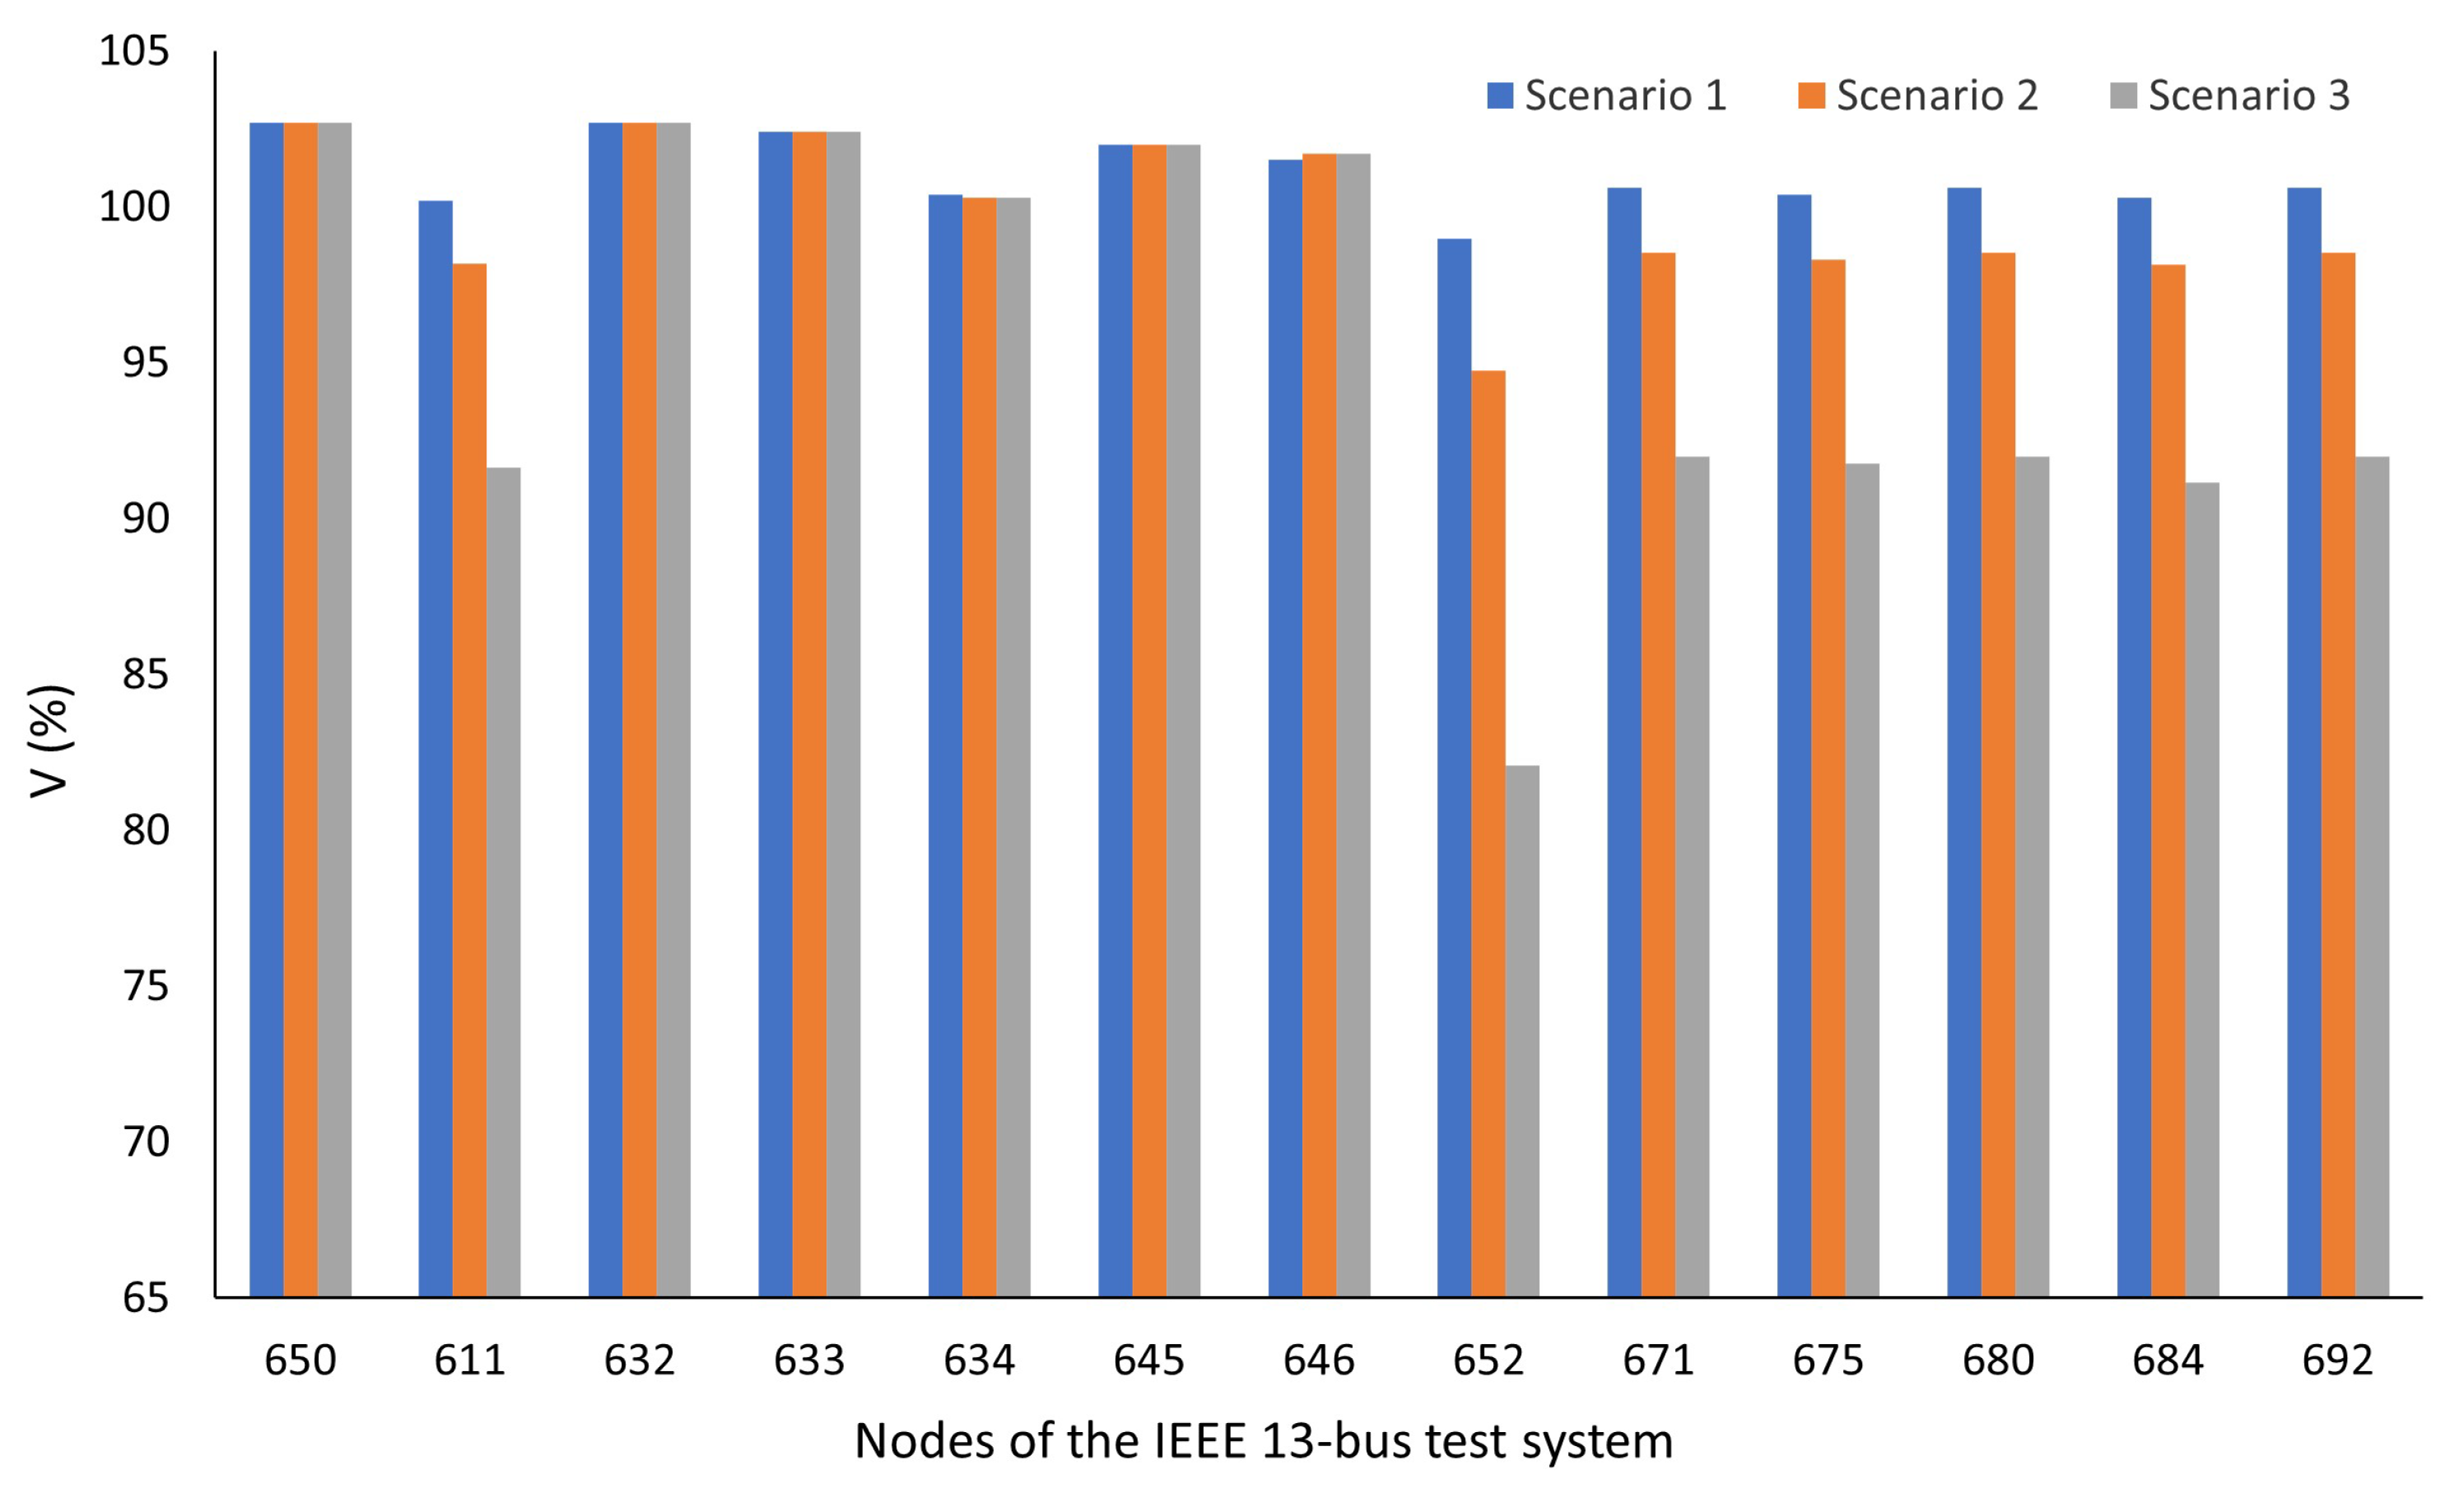
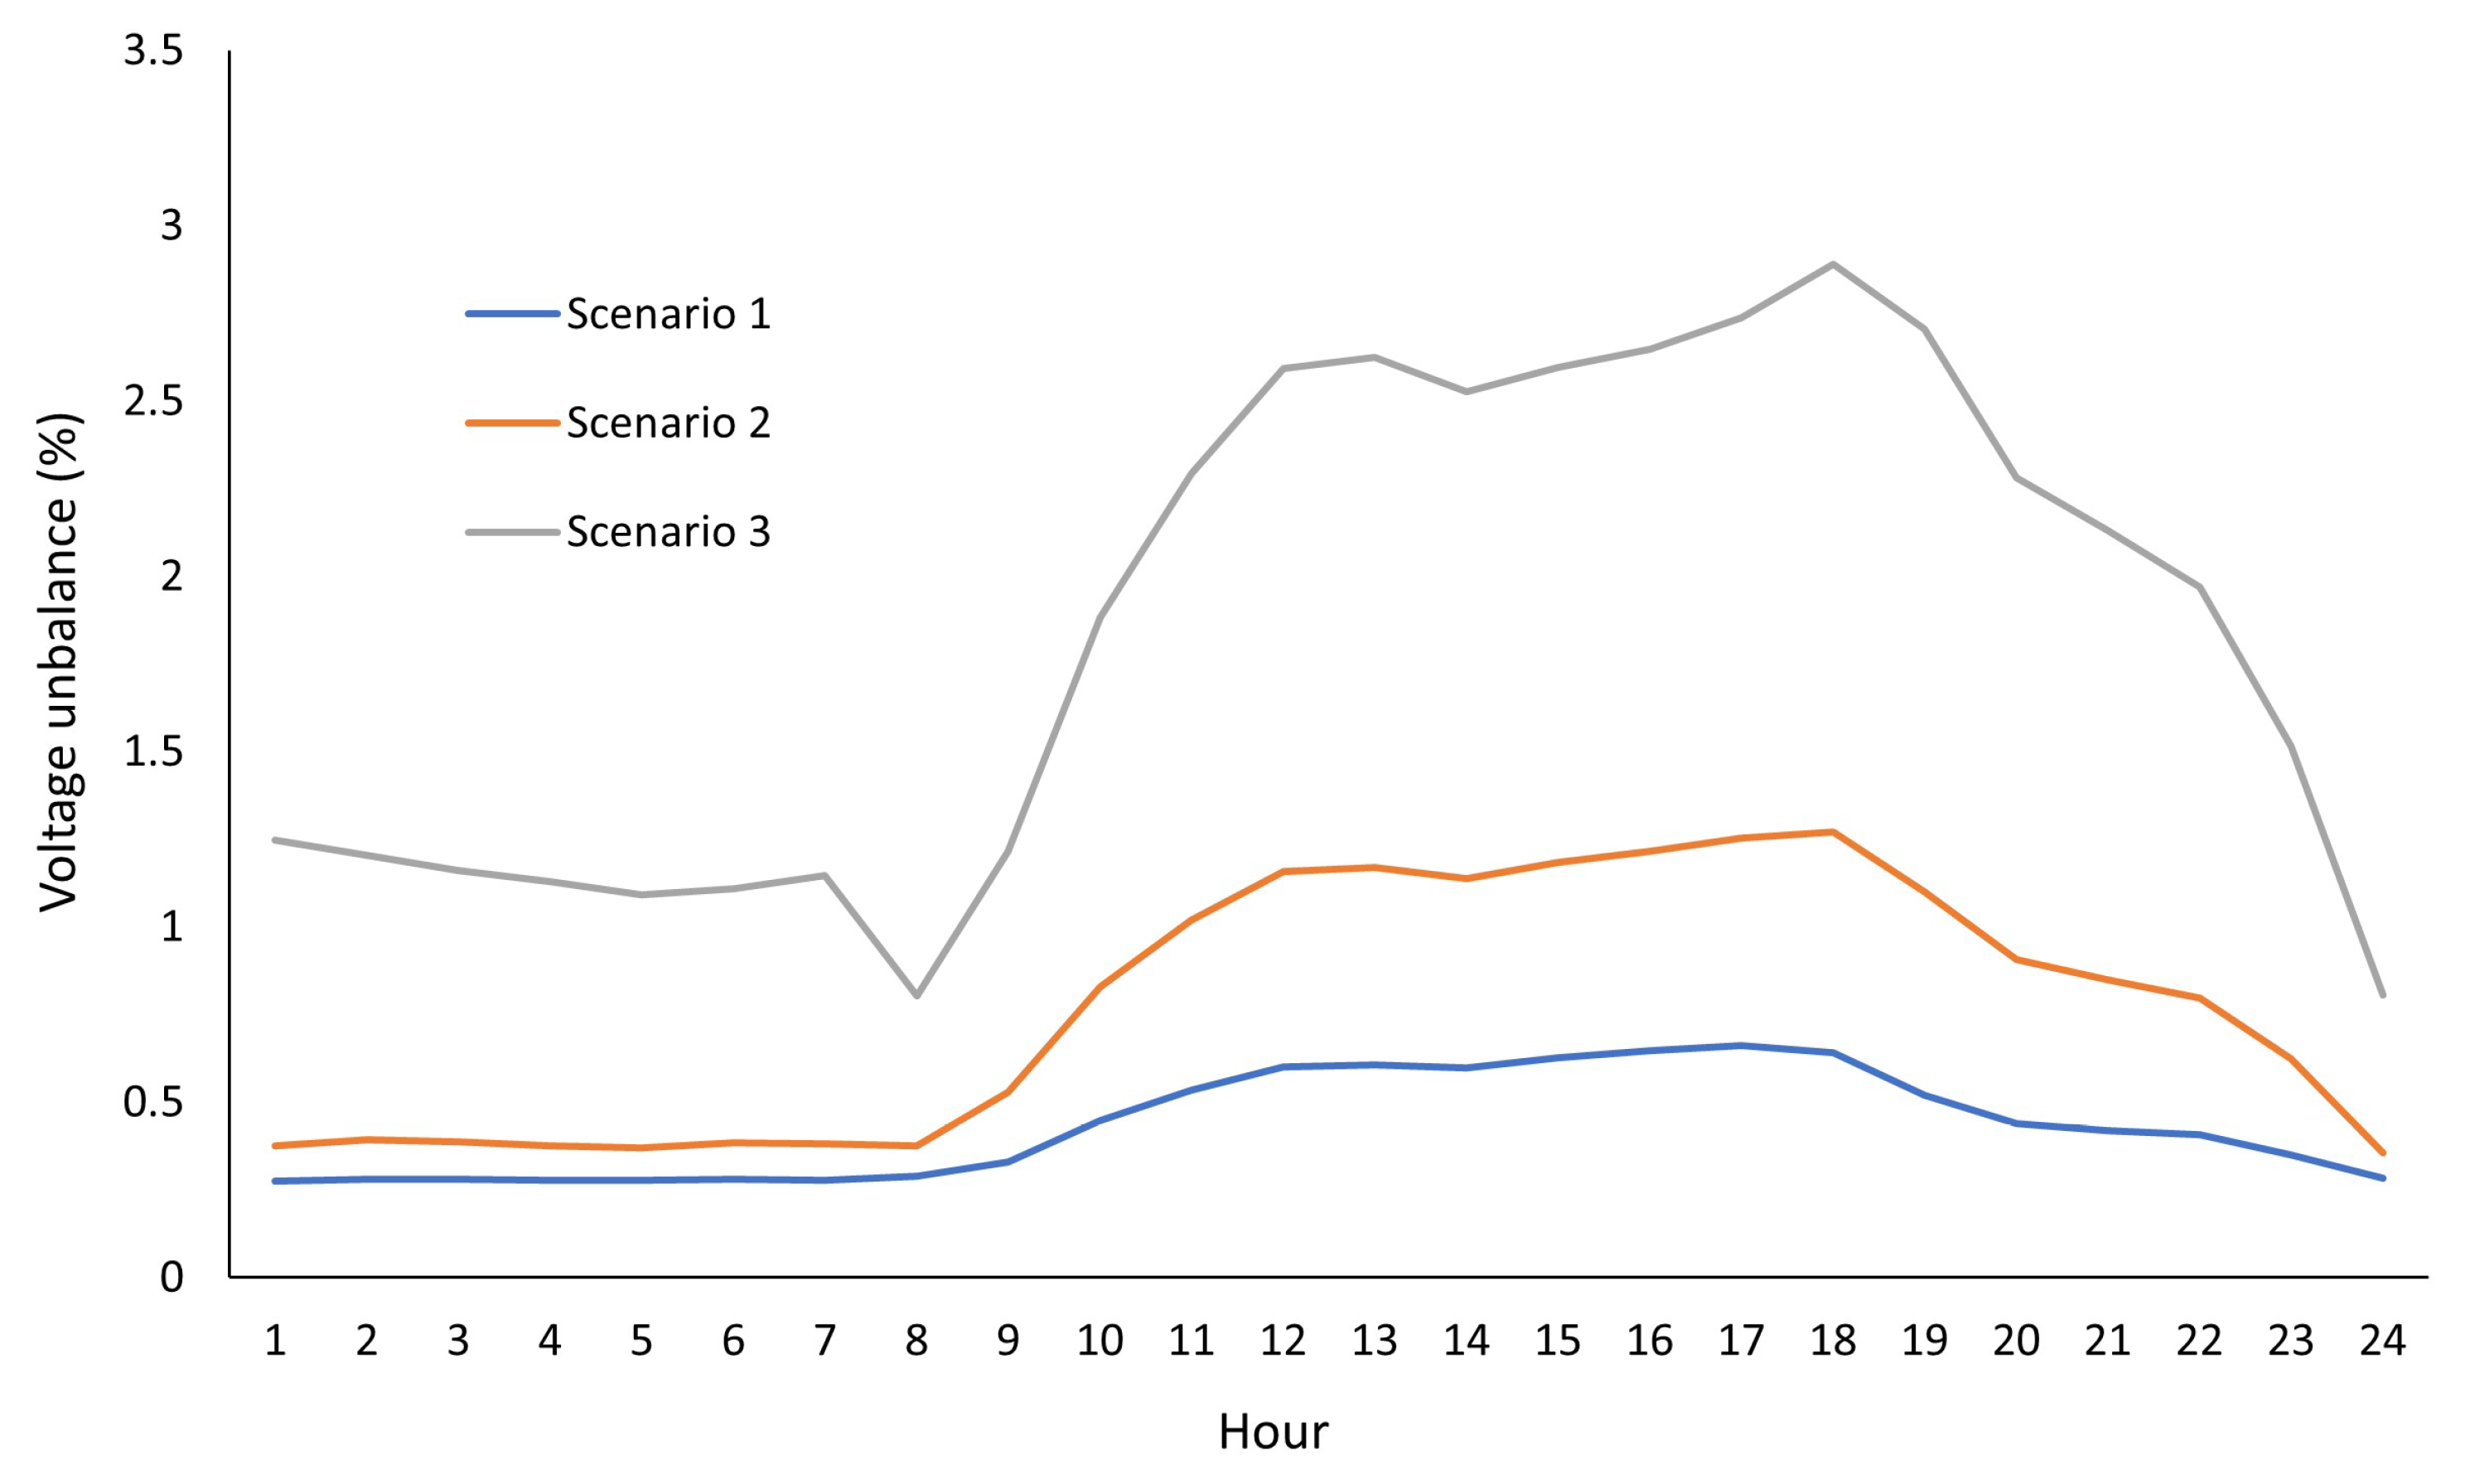
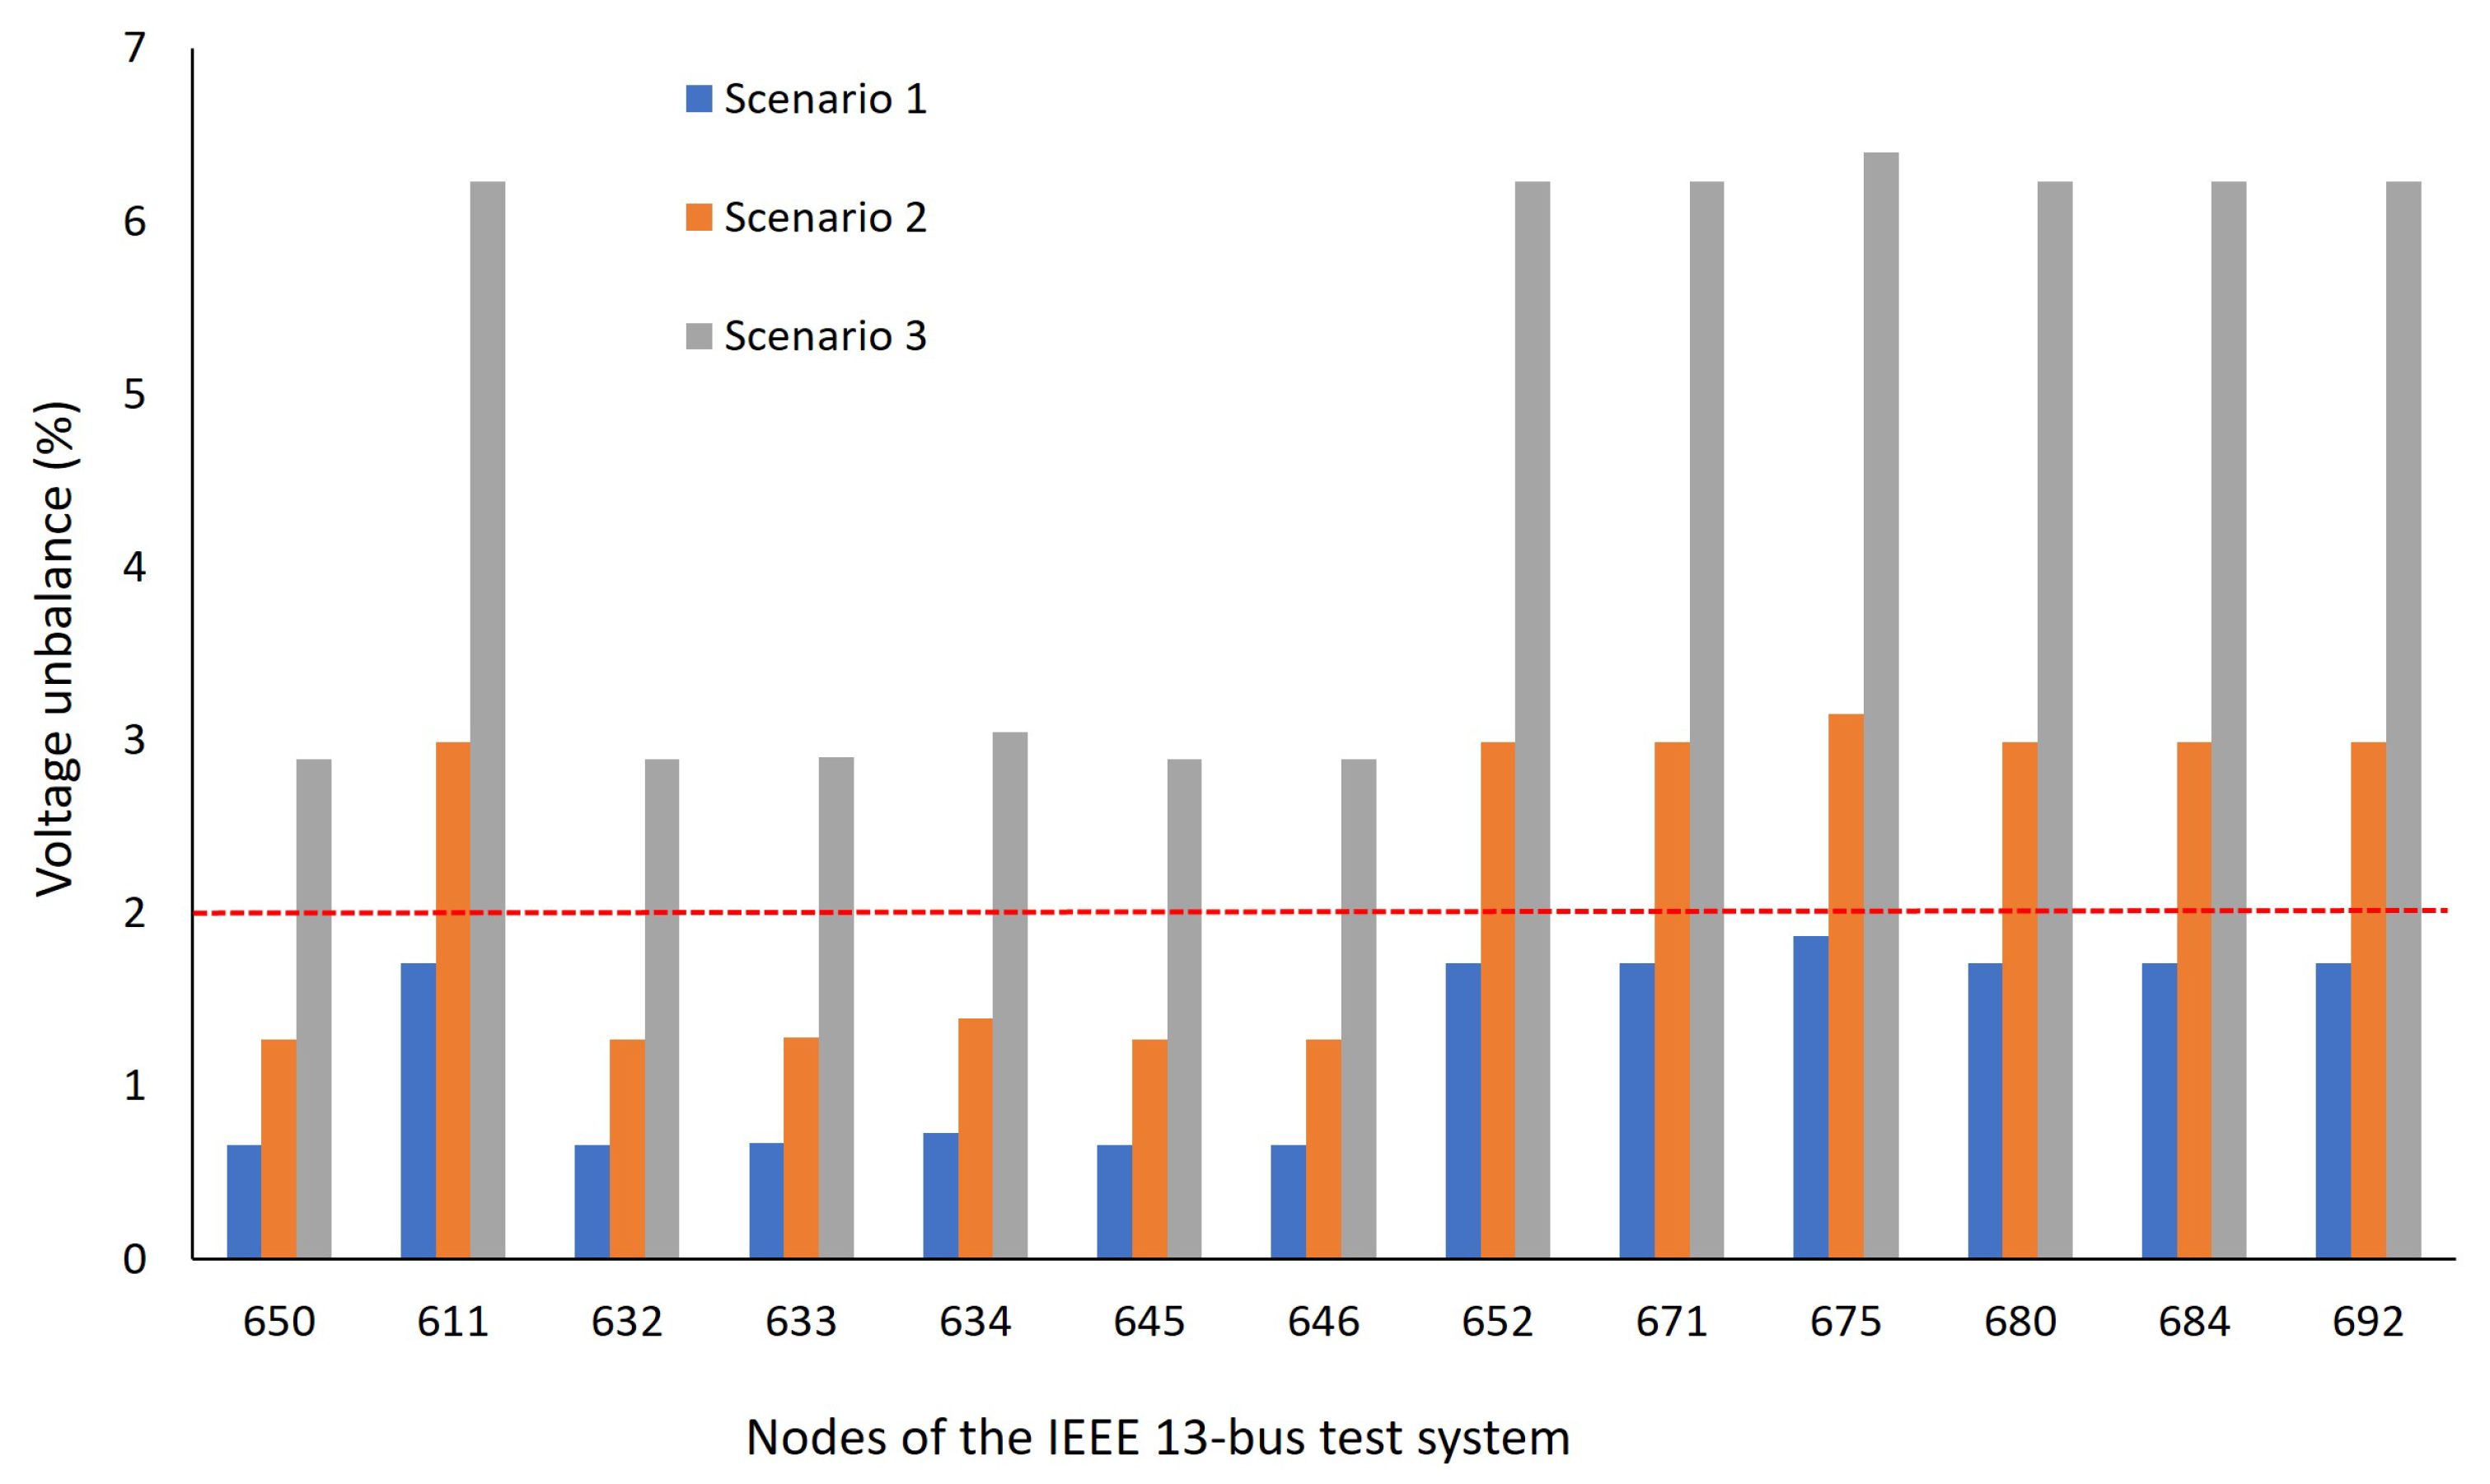
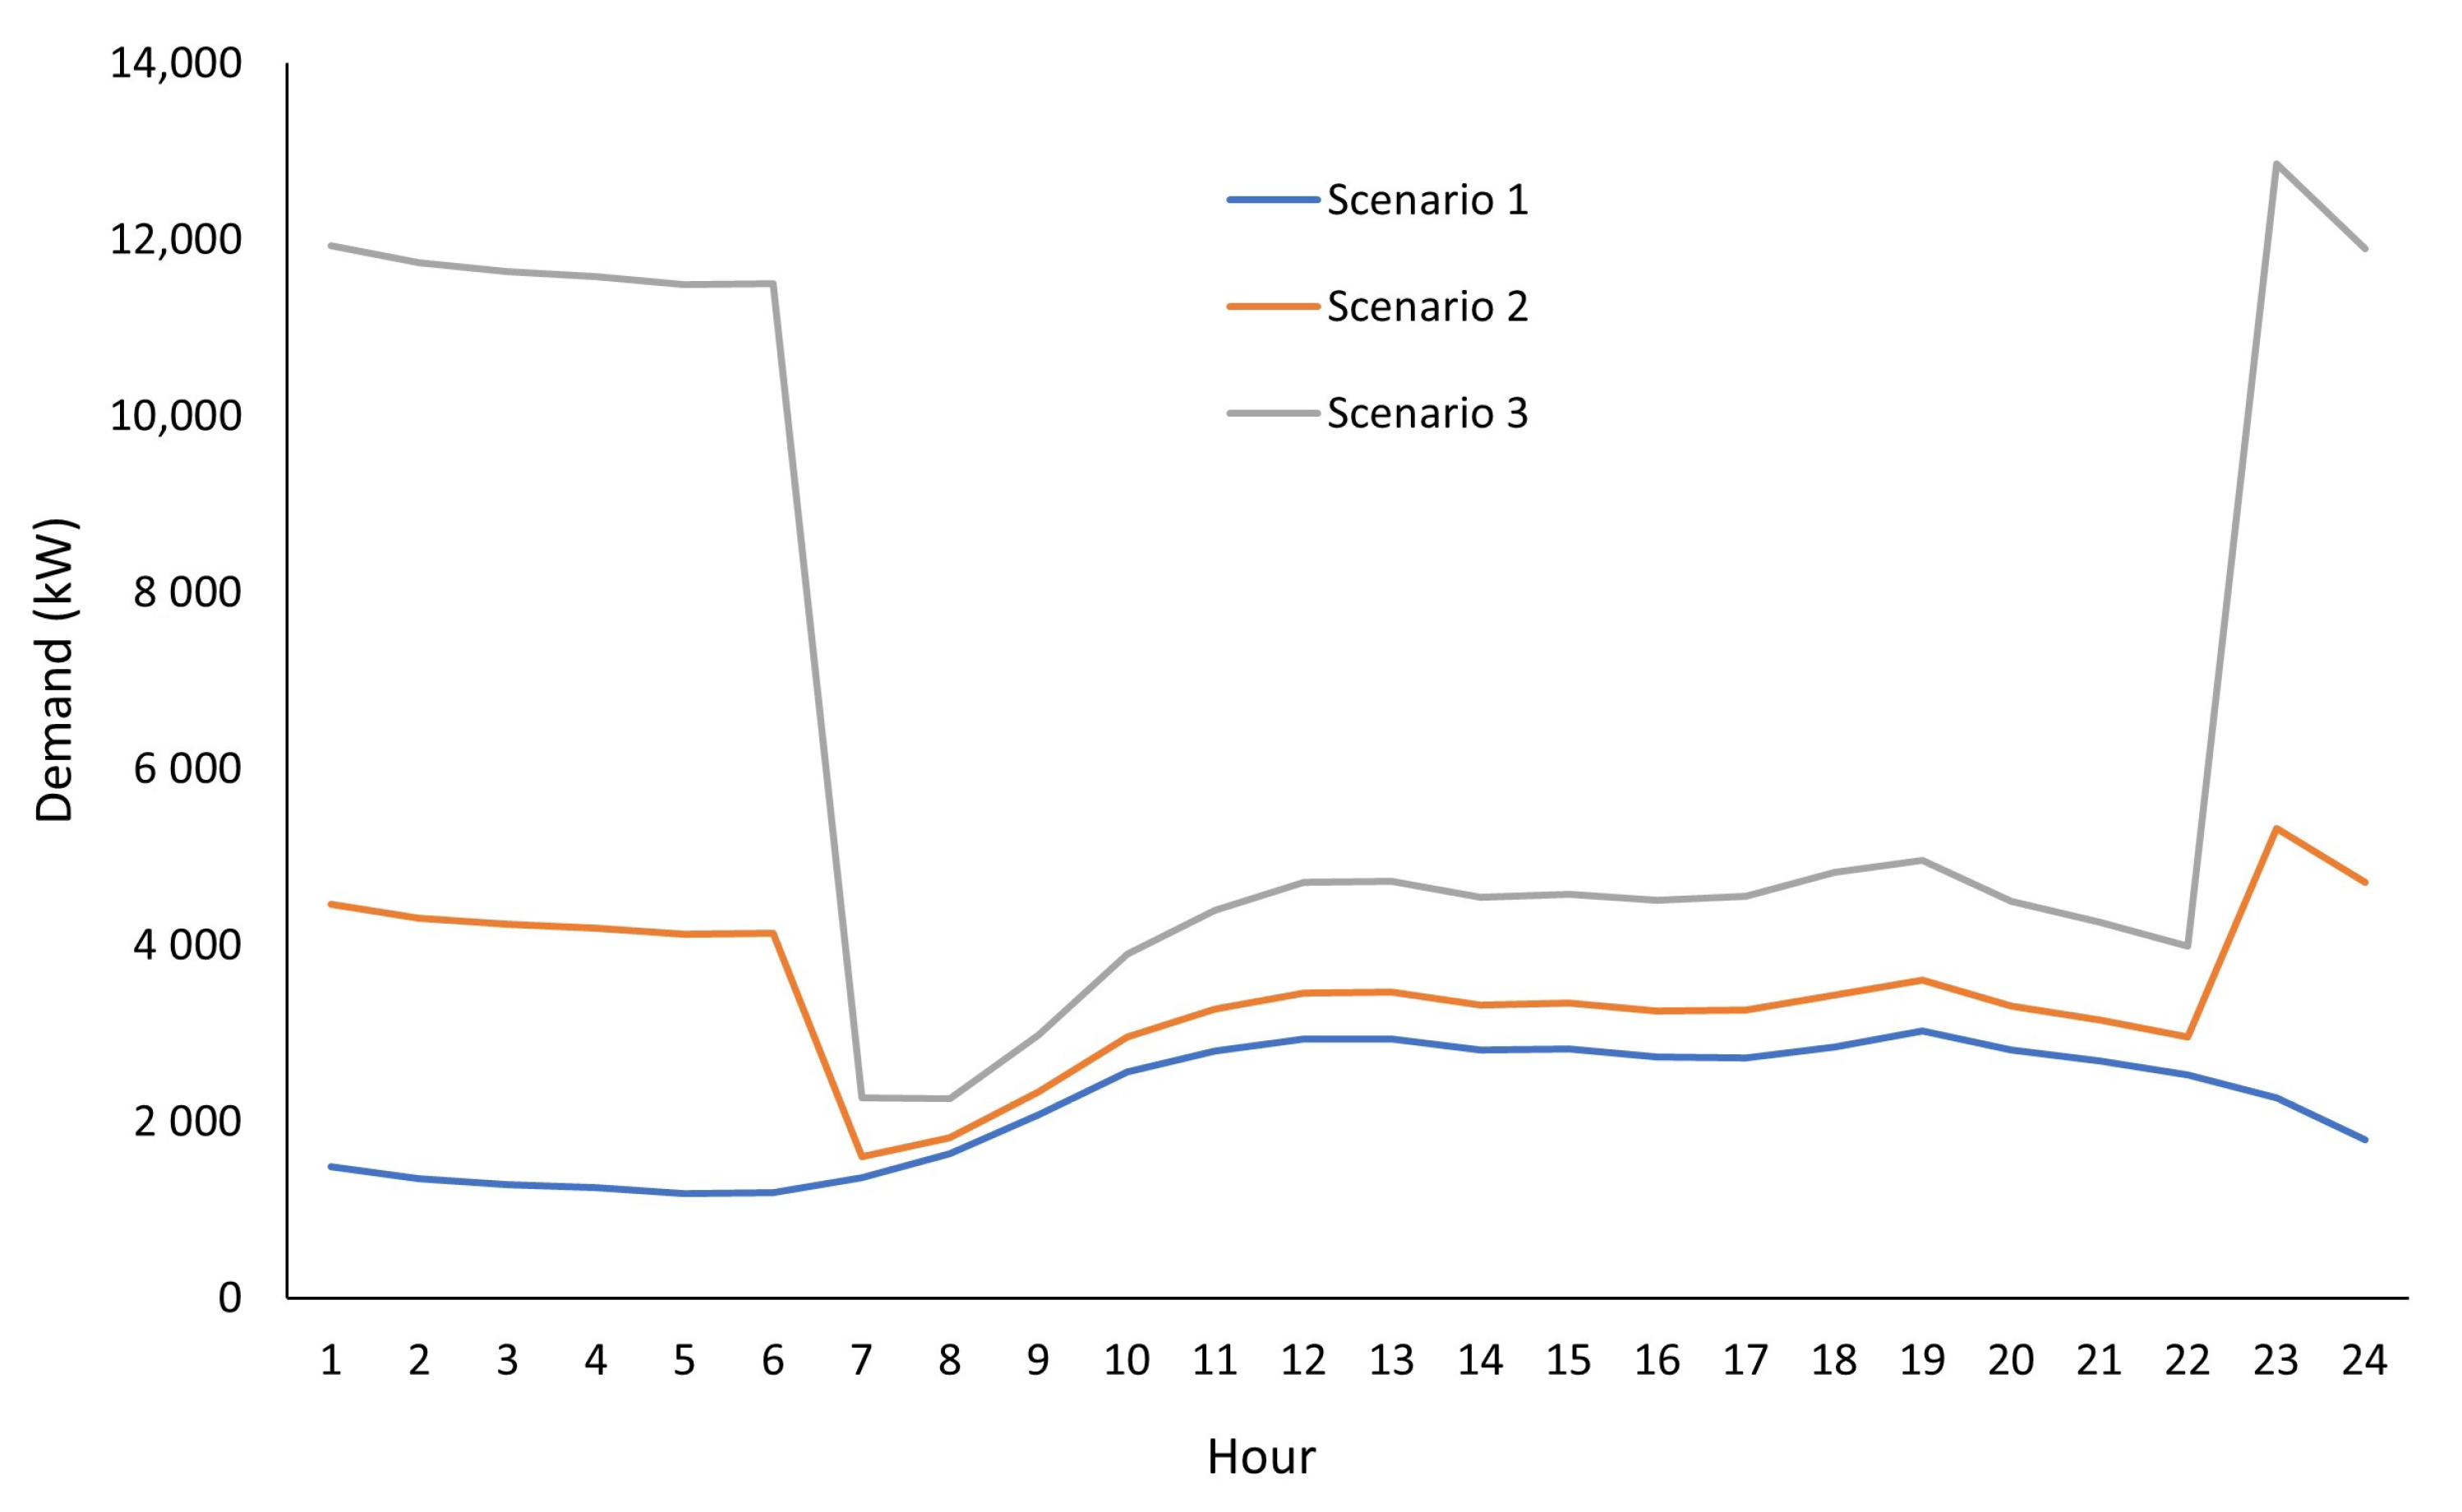
According to the changes made in the pilot nodes under study, the proposed scenarios are modeled in the ETAP software and simulated for collecting the electrical parameters of interest: demand profile, voltage unbalance, harmonic content, voltage drop or voltage regulation.
