Abstract
The premise of the large-scale operation of electric buses corresponds to efficient charging service guarantees. Recent research on charging stations mainly aims to obtain the construction location and construction sequence through optimization methods or decision-making methods. This research has considered the aspects of geography, charging efficiency, economic efficiency, and emergency response capacity. The increase of charging stations will lead to competition among charging stations, unbalanced use of charging facilities, and unnecessary loss of electricity to the power grid. In fact, few studies pay attention to the actual operation of existing charging stations. Therefore, it is necessary to establish a scientific, comprehensive, and efficient charging services evaluation framework to support the actual operation of charging stations. Based on the analytic hierarchy process (AHP), this paper designs a multi-level indicator evaluation framework, which includes 6 first-level indicators and 20 s-level indicators. The first-level indicators are cutting peak and filling valley (A1), location and scale (A2), intelligent technology (A3), equipment efficiency (A4), operating income (A5), and reliability (A6). Through the questionnaire survey of ten experts in related fields, we understood the importance and attention of these indicators. The results show that the weights of indicators of location and scale index (A2) and reliability (A6) are high, which are 0.2875 and 0.2957, respectively. The least concerned indicator is equipment utilization efficiency (A4), at a weight of 0.0531. According to the actual data of charging stations in Zhengzhou, China, the comprehensive competitiveness of several charging stations is evaluated by the Technique for Order Preference by Similarity to an Ideal Solution (TOPSIS). The result shows that station 1 has the highest comprehensive competitiveness, followed by station 2 and station 7. The evaluation framework proposed in this paper comprehensively considers a variety of factors. The combination of AHP and TOPSIS can reduce the uncertainty in experts’ evaluation of the service of the charging station.
1. Introduction
The electrification of buses is of great significance to the development of public transport. Under the influence of national policies (such as congestion charge exempts, purchase subsidies, and special waivers from parking and trading taxes [1]), the cumulative production and sales of new energy vehicles, such as pure electric buses and plug-in hybrid electric buses, increased approximately tenfold from 2015 to 2020 [2]. At present, China is the world’s largest manufacturer and user of electric vehicles (EV) and electric buses (EB), as well as the leader in the development layout of electric buses [3]. The problems of bus electrification mainly include the following aspects: the lack of service guarantee for charging facilities of electric buses, the “mileage anxiety” caused by the fact that the driving mileage of electric buses is less than fuel and gas buses, the low utilization and income of charging facilities, expensive charging infrastructure costs, and low willingness of social capital to participate in the construction of charging stations [4,5]. The proportion of electric buses in some cities, such as ones in China, has reached more than 50% and continues to increase rapidly. This leads to two new challenges for charging infrastructure. First, there are many electric buses, and the daily charging demand is very high. Thus, it is necessary to consider how to reduce the impact on the regional power grid [6,7]. Furthermore, with the increase in the number of charging stations, their competition is getting fiercer.
A large amount of literature presents studies on how to determine the location and number of new charging stations [8,9] based on fleet size, energy demand, route profile, current charging facility layout, and other factors [10,11], and different optimization methods have been used to achieve optimal distribution [12,13], thus contributing to the electrification of public transport vehicles. Generally, there are two main deficiencies in the existing research. One is the insufficient attention to the actual operation and future development of charging stations, and the other is the lack of reasonable and comprehensive charging service evaluation framework and evaluation methods. Particularly, most studies focused on the planning and prediction of uncompleted charging stations and were concerned about the early deployment stage of charging stations, ignoring the sustainability of charging stations in the future charging infrastructure network.
In order to solve the above problems, this paper constructed a charging station service evaluation framework covering geography, economy, reliability, utilization rate of charging facilities, and coordination with the power grid. The analytic hierarchy process (AHP) was employed to establish the evaluation framework. In order to reflect the importance of different indicators, the weight of each indicator could be obtained through the expert evaluation questionnaire [14]. Finally, the authors used the TOPSIS method to evaluate charging stations. The case used the data of an electric bus operating company in a central city of China. Moreover, the operation data for three consecutive months were used in the calculation. The author selected seven charging stations as the evaluation object, and the charging data of the calculation came from the management platform of a public transport operation enterprise in Zhengzhou, China. In the following sections, the author will review the previous literature in Section 2, construct the charging service evaluation framework in Section 3, introduce the evaluation methods in Section 4, conduct practical research in Section 5, and summarize this study in Section 6.
2. Literature Review
The literature on charging station evaluation can be divided into two aspects: the first concerns the selection of evaluation criteria, and the second concerns the selection of comprehensive evaluation methods. A reasonable and comprehensive evaluation framework of charging facilities needs to consider many aspects, such as the operation of the charging station, coordination between the charging station and power grid, geography and economy, and the risk response ability. The evaluation framework and methods used in some current studies are not conducive to evaluating the service capacity of the established charging stations. Maase et al. (2018) designed an evaluation platform to obtain some key performance indicators (KPI) based on actual charging data from existing charging facilities, and the platform can judge whether the charging facilities need to be expanded according to the existing charging station network [15]. The indicators adopted in their research mainly include the location of each charging station, electricity consumption, connection time, charging time, times, monthly unique users, and average occupancy rate. It is not sufficient to evaluate charging stations only based on the above indicators, which are derived from the real-time charging data. Some recent research has made great contributions to the electric development of public transport. They mainly focused on fleet size, charging station installation and expansion, driving and charging plan, and discussed the cost-effectiveness of vehicle purchase and infrastructure [10], the relationship between electricity price and travel plan [16], the impact of energy storage system [17], and the allocation of charging facility resources [18]. Research based on multi-criteria decision-making (MCDM) developed some evaluation frameworks for charging stations in recent years. We found that the evaluation indicators were mostly selected from the factors related to geographical location, the economy, the environment, and society.
In order to study the location of charging facilities and the evaluation of charging stations, some literature used a multi-criteria decision-making (MCDM) method to consider many factors to determine the optimal solution comprehensively. Feng et al. (2021) developed an integrated MCDM method through a linguistic entropy weight (LEW) method and a fuzzy axiomatic design (FAD) [19]. Erbas et al. (2018) identified 15 indicators and allocated the site availability score of the charging station using a GIS-based method. He/she prioritized the indicators using a fuzzy AHP and finally selected the best site using the TOPSIS [20]. Guo and Zhao (2015) selected evaluation indicators from the perspective of sustainability and ranked the alternatives of charging station locations using a fuzzy TOPSIS method. The evaluation framework was finally employed in the case of Changping District, Beijing, for validation [21]. Hosseini and Sarder (2019) proposed a Bayesian network (BN) model and took both quantitative and qualitative factors into consideration [16]. The research objectives of the first four studies mentioned above were all to optimize the site selection of charging stations, while the research objective of the last literature mentioned above was to select the site selection and evaluation of charging stations [22]. In order to review the articles on the evaluation framework of charging stations in recent years, the authors found that the evaluation criteria were mostly selected from the aspects of geographical location, the economy, the environment, and society. The indicators and influencing factors concerned by the above five literature references using the MCDM method could represent most similar charging station evaluation studies. Table 1 lists the criteria from them.

Table 1.
Components of the site selection system of charging service.
Multi-criteria decision-making/multi-criteria decision analysis (MCDM/MCDA) methods have been commonly used in transportation in the last 10 years. Broniewicz and Ogrodnik (2020) studied statistics and analyses of the MCDM/MCDA methods, mainly including improved AHP, TOPSIS, DEMATEL, PROMETHEE, and ELECTRE [23]. More and more relevant studies employed these methods to make decisions or evaluations. The evaluation frameworks of some studies contain both quantitative and qualitative indicators, which require the experts to evaluate each charging station in a comprehensive evaluation of all charging stations. Many cities are experiencing explosive growth in the number of charging stations, and therefore such methods are not easy to use. After comprehensively considering the advantages and disadvantages of several MCDM/MCDA methods, we adopted the AHP method to construct the hierarchy of evaluation indicators. Then, TOPSIS was used to calculate the performance of multiple charging stations. The method used in our research can efficiently process expert questionnaires and actual operation data of charging stations.
3. Research Methodology
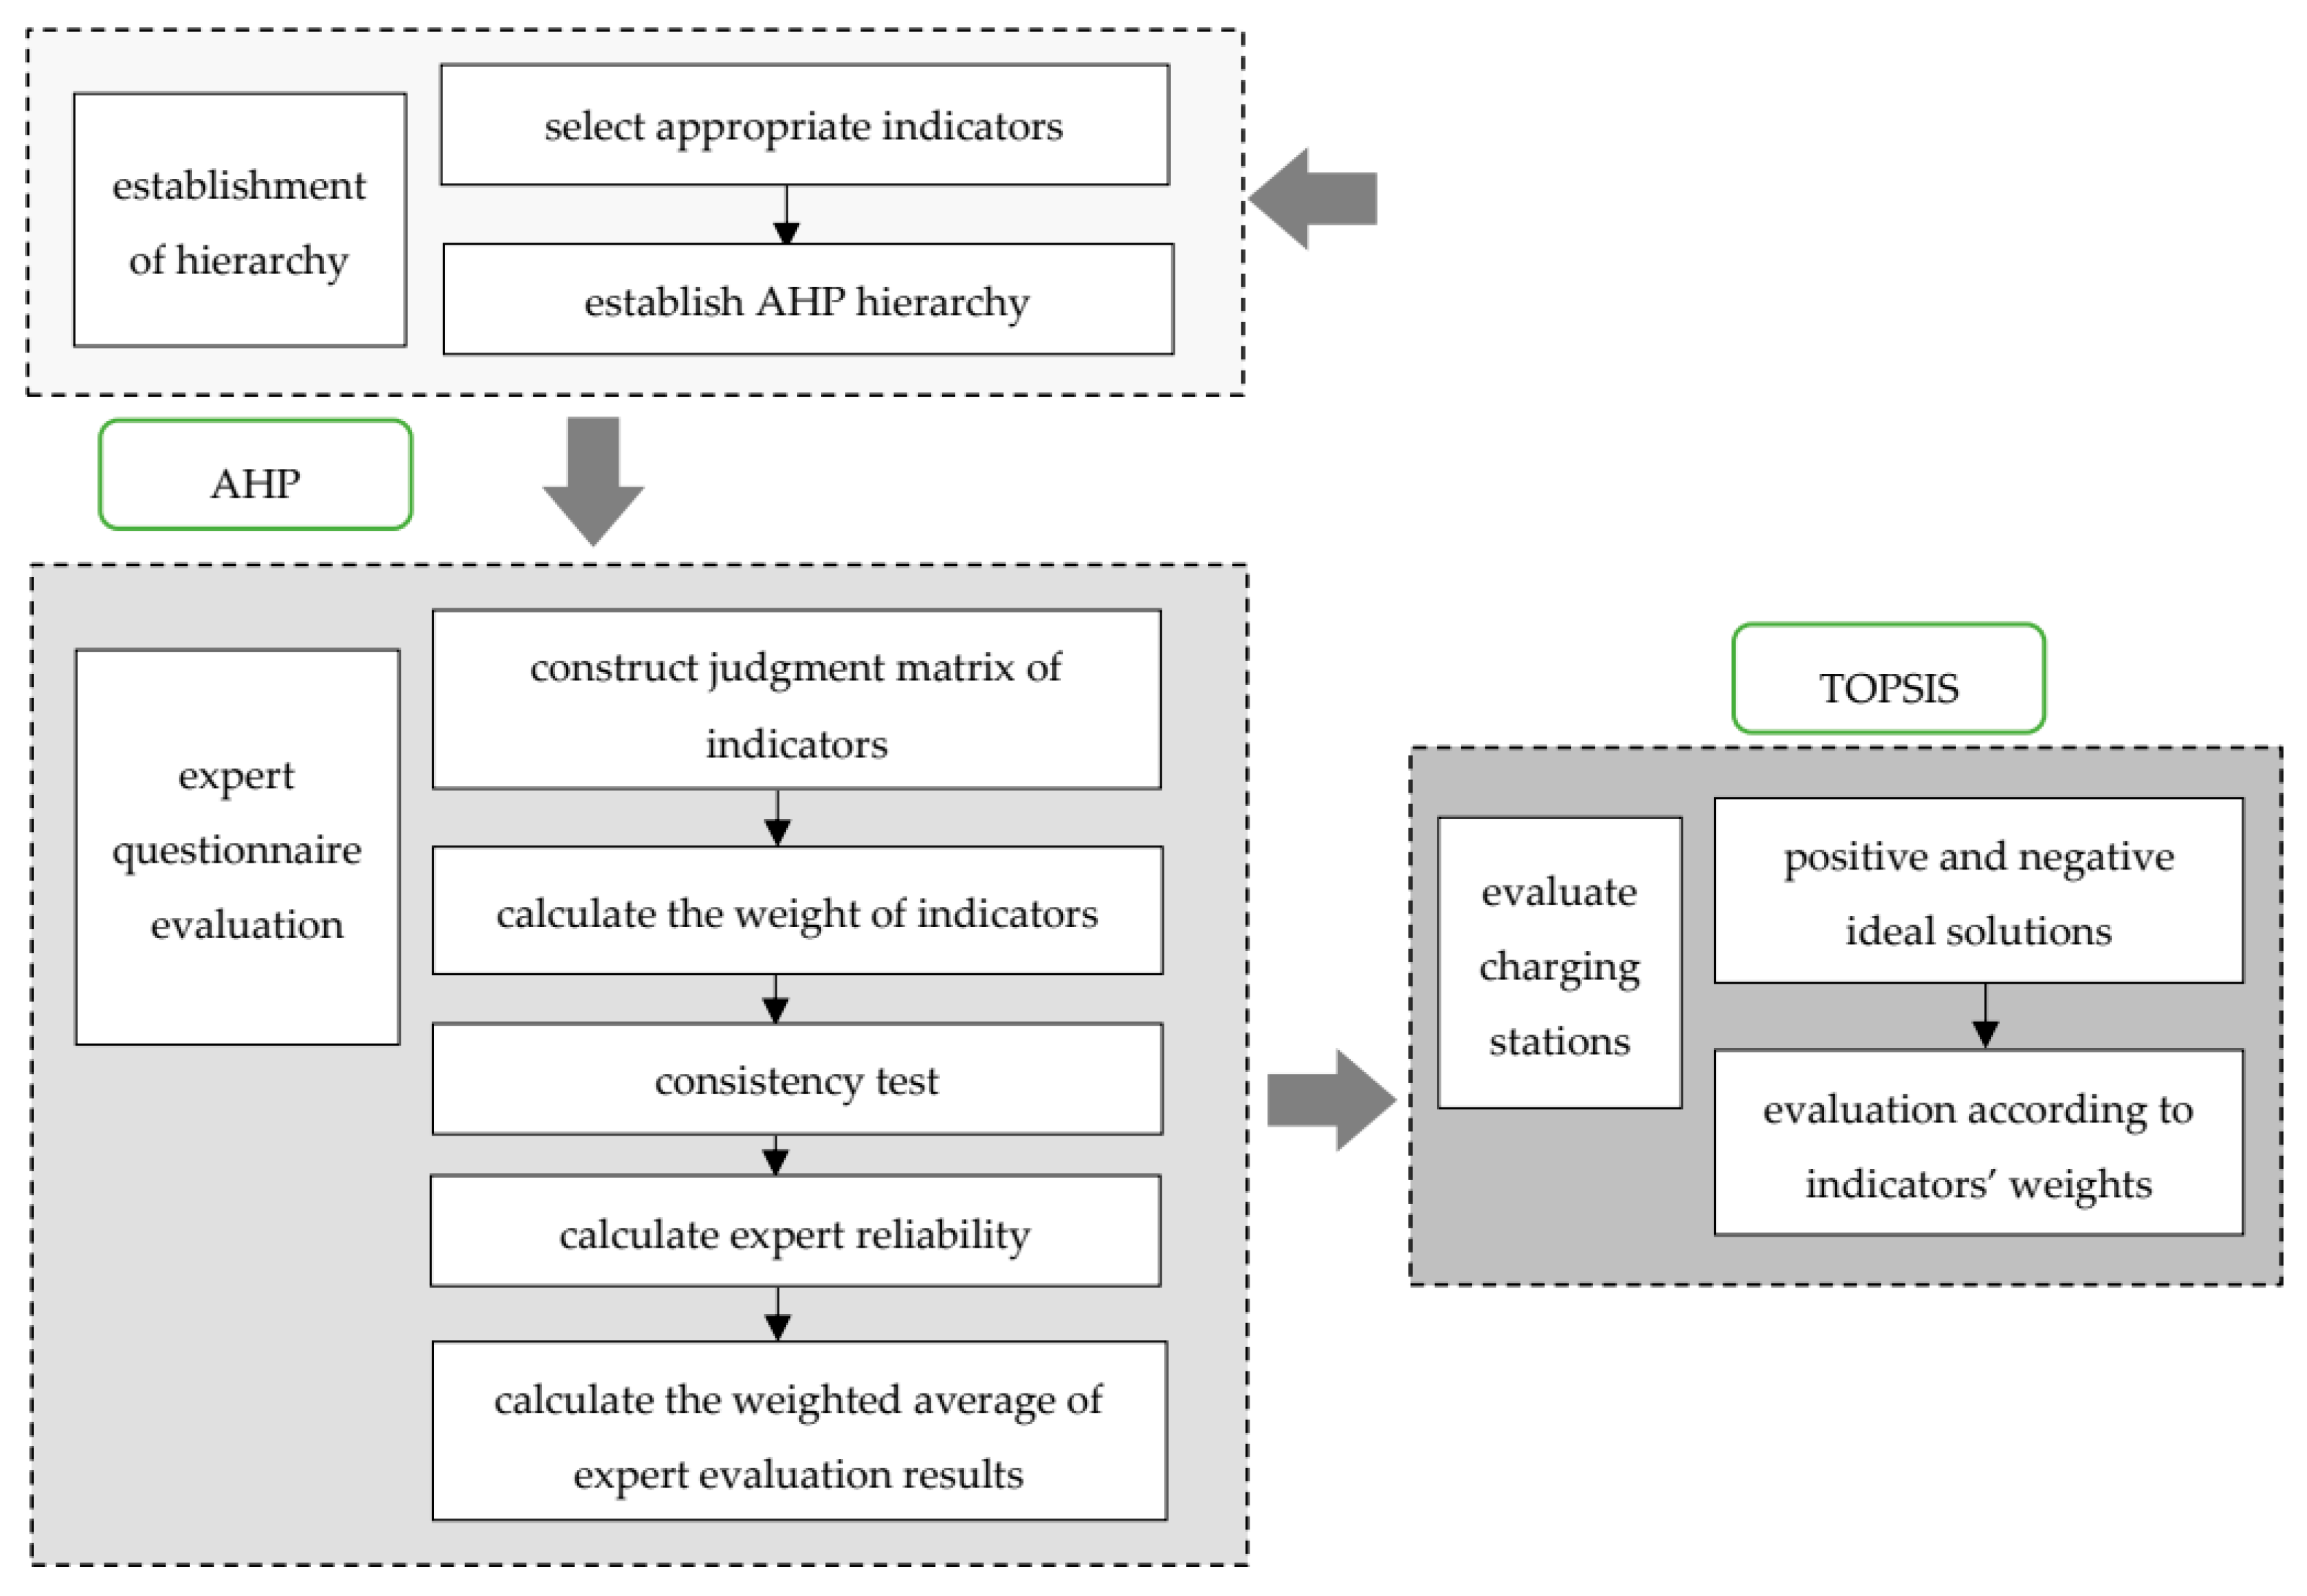
The AHP method, together with the TOPSIS method, is introduced in this section. The main steps of the research methodology is summarized in Figure 1.
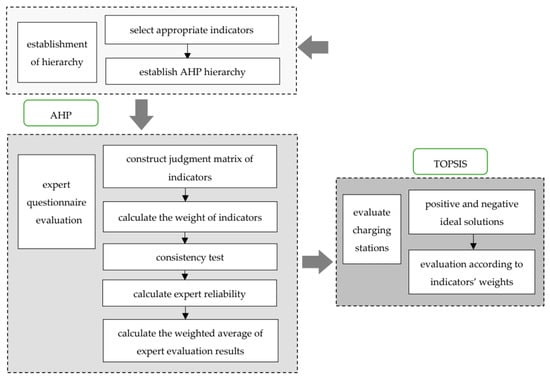
Figure 1.
Framework of the research methodology.
The analytic hierarchy process (AHP) method is often used to solve complex multifarious decision-making problems and is widely used in various fields, so it is suitable for evaluating the competitiveness of charging stations [24]. The steps are as follows: (1) Establishment of hierarchy: The hierarchy of the AHP method generally consists of three layers, named the objective layer, criterion layer, and scheme layer, from top to bottom. Complex decision-making problems can have four layers: the objective layer, criterion layer, sub-criterion layer, and scheme layer. (2) Calculation of weights: The judgment matrix of pairwise comparison of each criterion can be obtained by an expert evaluation questionnaire. The maximum eigenvalue and corresponding eigenvalue can be calculated by a matrix, and the weight of each criterion is obtained. If there are sub-criteria, it is necessary to obtain the weight of the sub-criteria on the decision-making goal and test the consistency. Finally, the decision results of multiple experts should be integrated based on credibility. (3) Comprehensive comparison of several alternatives: In this study, the TOPSIS method was used for the comprehensive evaluation of charging stations, and the most competitive charging stations were selected according to the index weights obtained by the AHP method.
3.1. Scale of Judgment Matrix
The scale of the judgment matrix refers to the value range of the element in matrix . The most commonly adopted scale is 19, which often causes subjective problems in expert reviewing and grading and makes experts feel confused when making choices [25]. Regarding the indicator scale and fractional scale, although these scales have good consistency and high computational accuracy, they are difficult to understand due to their poor readability and perceptibility [26]. The 02 scale is easy to understand; it needs to judge the relative importance indicator between the corresponding elements of maximum and minimum .
To take the advantages and disadvantages of the 19 scale and the 02 scale both into consideration, while experts can easily understand and give the judge matrix and obtain more accurate results, this paper adopts the five scale (−22 scale) to construct the judgment matrix [23]. The advantages and disadvantages of these three commonly used scales are compared in Table 2, and the meaning of the −22 scale is depicted in detail in Table 3.
Table 2.
Comparison of the 19 scale, −22 scale and 02 scale.
Table 3.
The interpretation of the −2~2 scale.
3.2. Basic Principle of the Calculation
If there is a judgment matrix , obviously, the diagonal elements of the matrix are all 1. The judgment matrix requires comparisons. According to the theorem of matrices in linear algebra, the maximum eigenvalue and eigenvector of matrix can be calculated to obtain the weight of each element of the matrix.
Generally, the judgment matrix scored by experts is not a consistent matrix. However, as long as the degree of deviation from the consistency condition of the matrix is within an acceptable range, the judgment matrix given can be accepted. Then, the weight of each indicator can be calculated. If the consistency indicator is closer to 0, matrix consistency is better. The mean random consistency indicator corresponding to the type matrix is selected to calculate the consistency ratio of the matrix. is obtained from the average of the maximum eigenvalues of 500 random samples of matrices with 19 values and their reciprocal [27].
3.3. Comprehensive Weight of Indicators
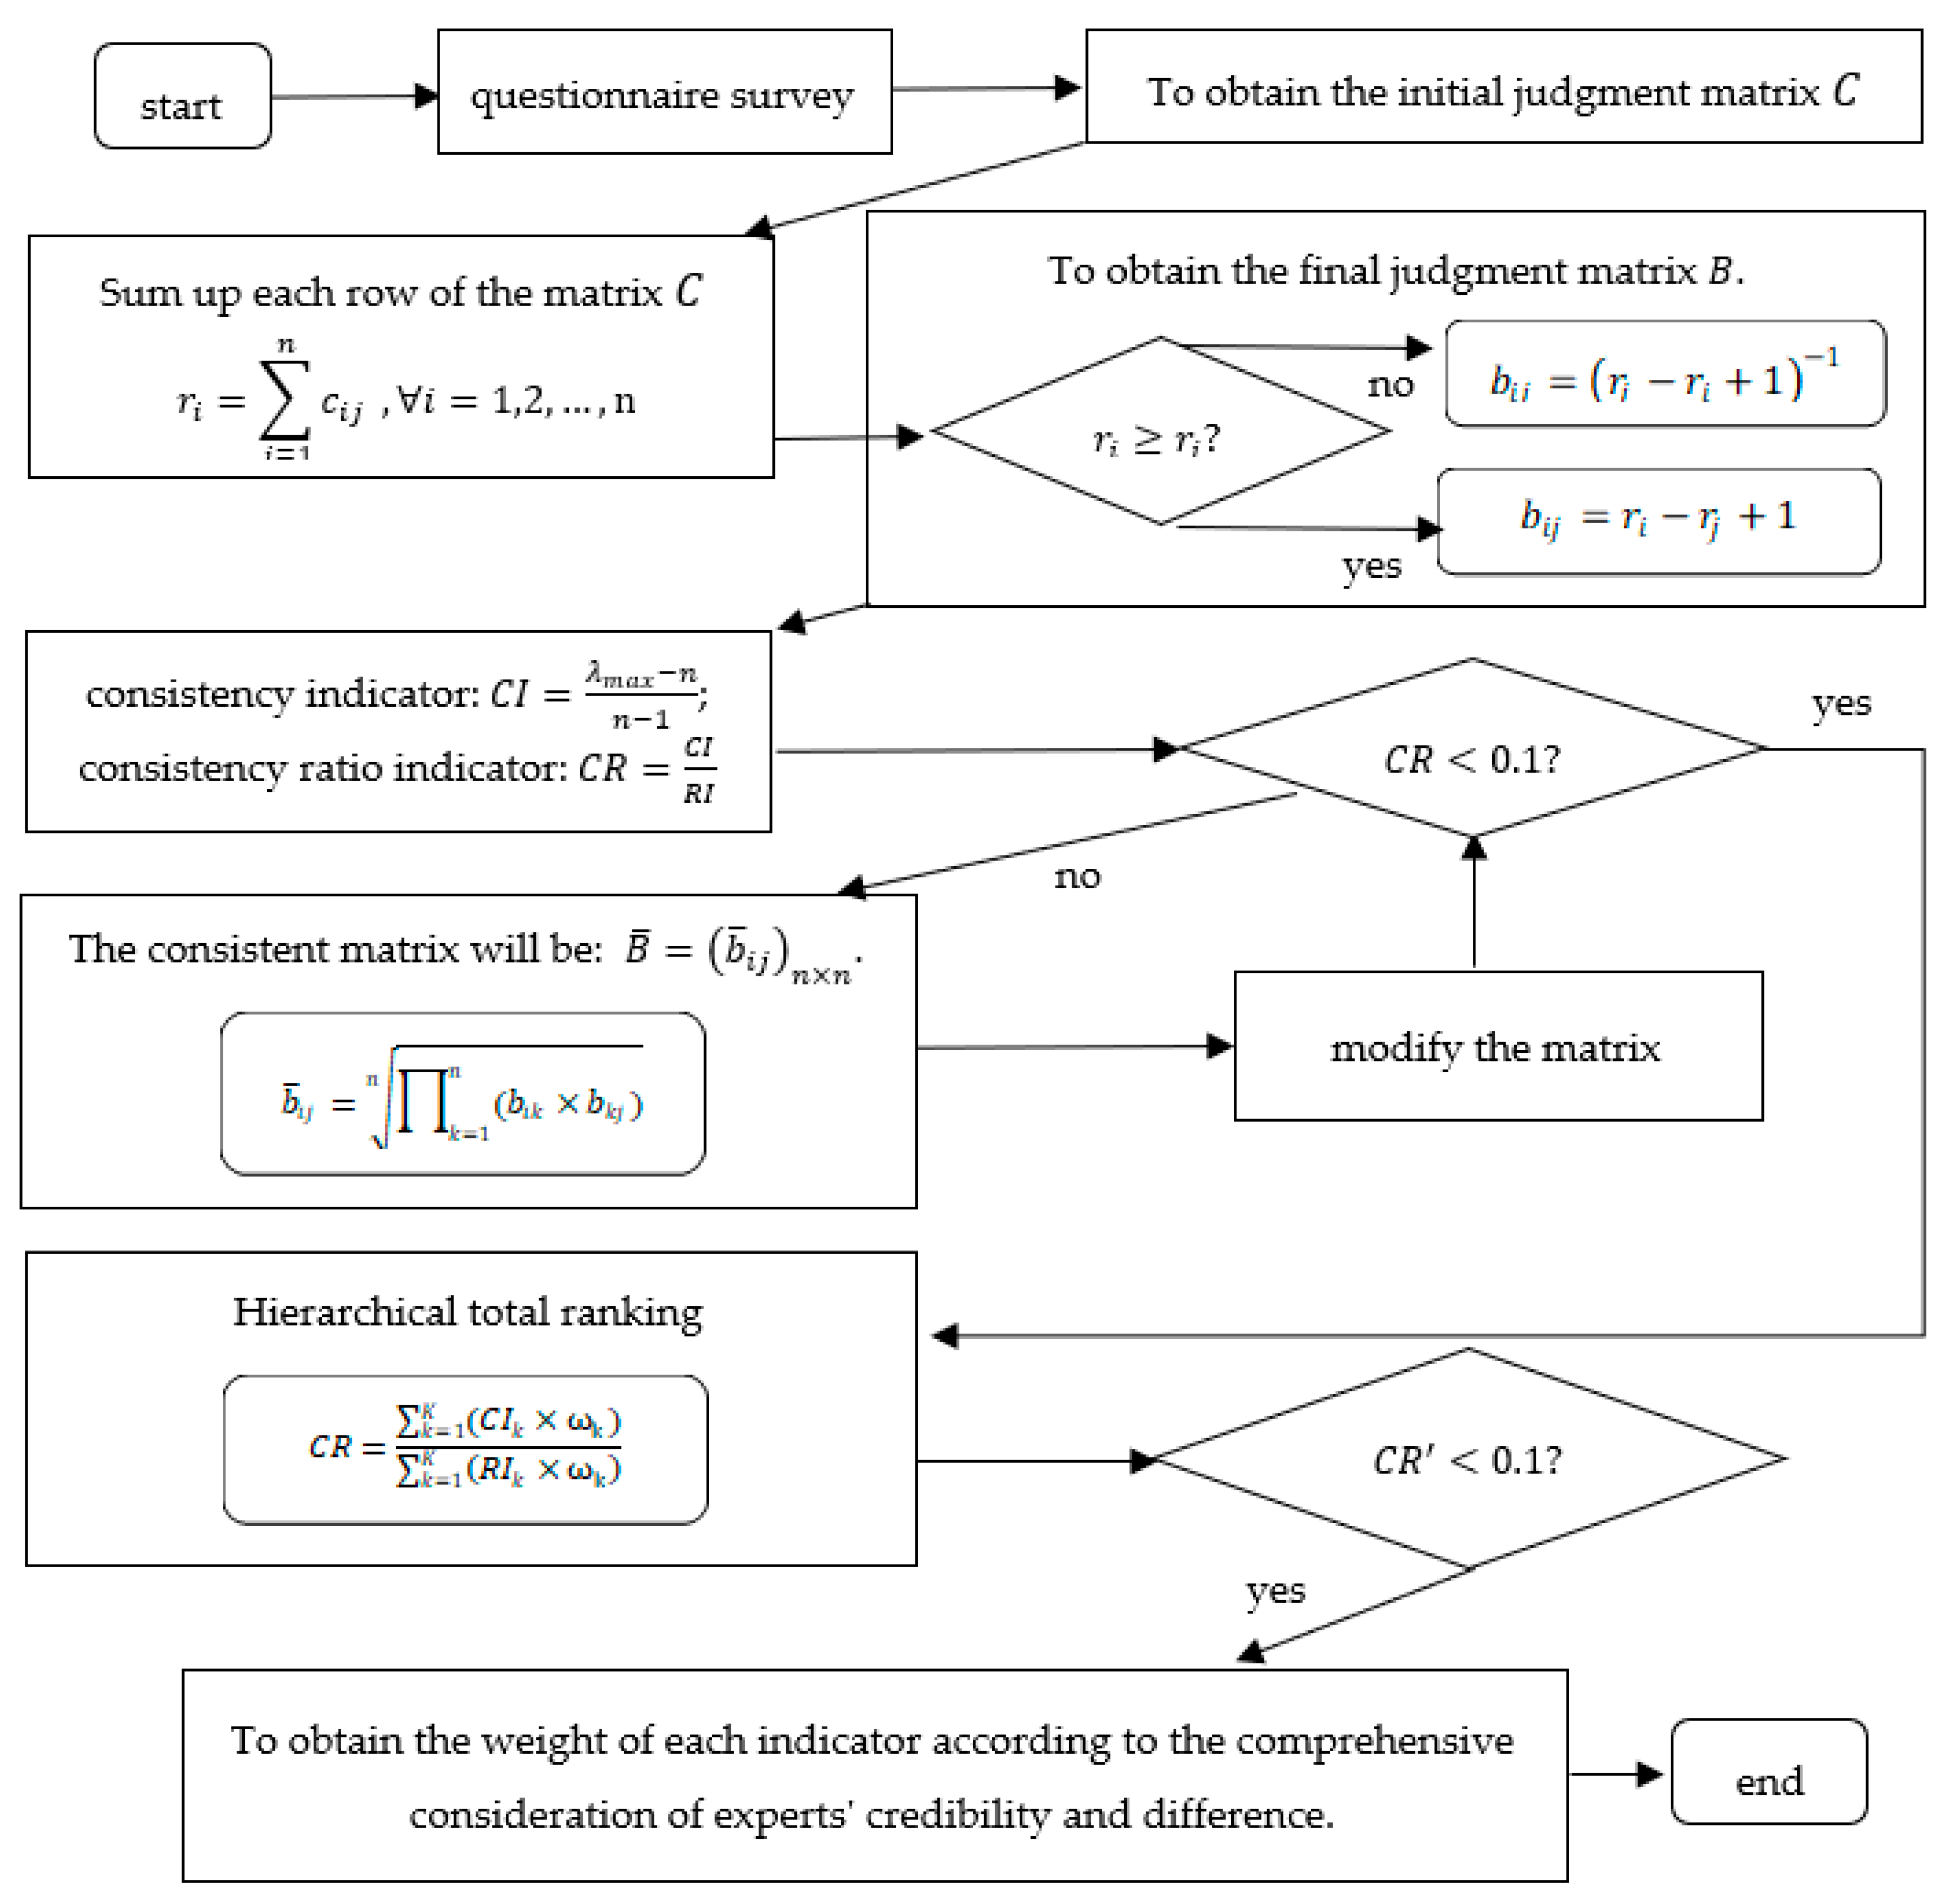
The indicator weight calculation process of the evaluation system is shown in Figure 2. Hierarchical total ranking refers to converting the single ranking weight of each indicator into the weight relative to the evaluation target. For the judgment matrix that meets the consistency requirement in the single ranking of hierarchy, the cumulative inconsistency after the total ranking of hierarchy may exceed the acceptable range. Therefore, it is necessary to test the consistency of the indicator after the total ranking of the second-level indicators. The expert scoring method cannot avoid subjective errors. However, different experts have different judgment matrices and credibility weights due to their different opinions.
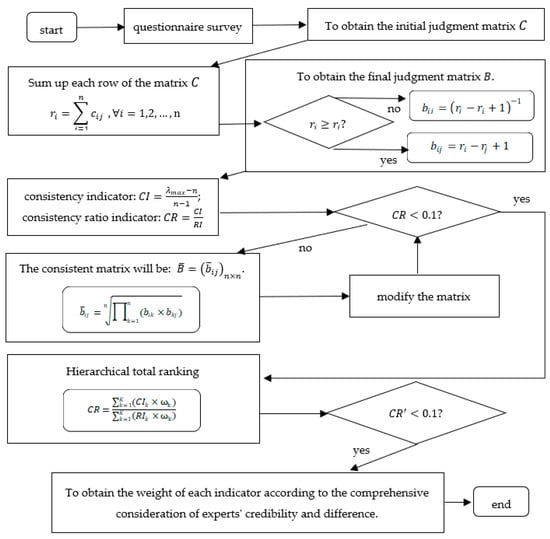
Figure 2.
Framework of the calculation model for indicator weights.
3.4. Comprehensive Evaluation of Charging Stations
Technique for Order Preference by Similarity to an Ideal Solution (TOPSIS) is a common evaluation method in Multi-Criteria Decision Making Methods (MCDM). It is a comprehensive evaluation method using the distance between the ideal solution as the evaluation standard [28]. TOPSIS is an evaluation method first proposed by Wang and Yoon in 1981 [29], and finite evaluation objects are sorted according to their proximity to the ideal goal. The goal is to find an optimal scheme with the minimum deviation from the ideal positive solution and the maximum deviation from the ideal negative solution [30]. TOPSIS is a practical multi-objective decision evaluation method, which only requires that each utility function is monotonically increasing (or decreasing).
The calculation steps of TOPSIS are as follows.
- Step 1: The original evaluation indicator matrix is defined as the matrix , as shown in Formula (1), where represents the objects to be evaluated, ; represents the evaluation indicator,; and is the initial evaluation value of indicator of object .
- Step 2: Calculate the standardized decision matrix . It is a decision matrix that unifies the value range of the evaluation value.
- Step 3: Calculate the weighted decision matrix . In Formula (3), is the weight of each indicator, which can be determined by AHP.
- Step 4: Calculate the positive ideal solution and negative ideal solution of each indicator. Since the utility functions of each evaluation indicator are monotonous, they only need to be taken from the maximum or minimum value of the evaluation value. is the positive ideal solution of the indicator , is the negative ideal solution of the indicator , and and are the sets of indicators with monotonically increasing and decreasing utility functions, respectively.
- Step 5: Calculate the distance between different evaluation objects and positive and negative ideal solutions for each indicator. The distance used here is the Euclidean distance. and are the distances between object and the positive ideal solution and the negative ideal solution, respectively.
- Step 6: Calculate the relative proximity of each scheme to the ideal solution and make the final decision. The objects are sorted according to the value of . The larger is, the closer the evaluation object is to the ideal solution, the better the object, and vice versa.
4. Evaluation Framework of Electric Bus Charging Services
The electrification of bus operations is complex due to the many factors that influence bus operations (i.e., route characteristics, vehicle types, scheduling strategies) [31]. Figure 3 illustrates the classification of influencing factors related to charging services. Efficient infrastructure (charging stations) is generally the key to improving electric bus services. Through the reasonable layout and efficient management of the electric bus charging station, the distance, waiting time, and charging time between the energy demand point of the electric bus and the power supply station can be shortened [32,33]. This will narrow the gap in waiting time between electric bus charging and conventional bus refueling.
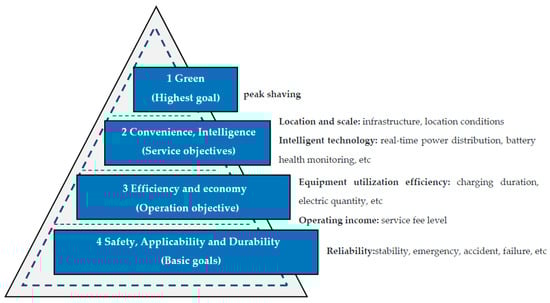
Figure 3.
Basic influencing factors of electric bus charging station service evaluation.
From the perspective of the public services of charging stations, the energy supply, utilization rate, reliability, and user experience are the most important aspects [34]. In addition, a charging station system needs to meet the basic functions of high efficiency and economy and implement the sustainable concept of low carbon and being green [35]. To simplify the evaluation process and facilitate the electrification of bus services, the authors established an evaluation framework to evaluate the competitiveness of charging stations (Figure 4). Indicators can be divided into qualitative indicators and quantitative indicators. An evaluation system with more quantitative indicators is more conducive to promotion and use due to the inconvenience of qualitative indicator evaluation.
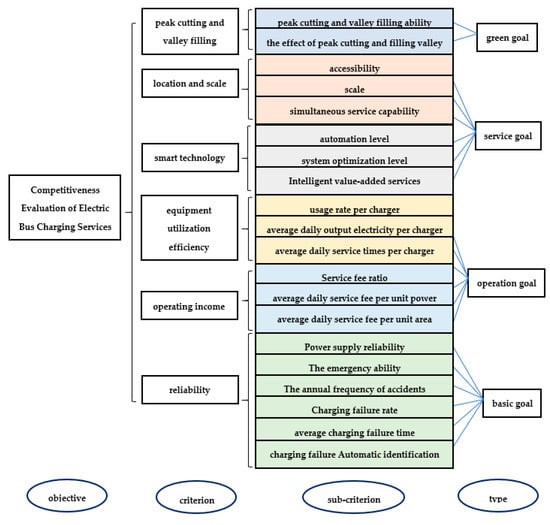
Figure 4.
Evaluation indicator system.
This study, referring to the evaluation indicators in the existing research literature, establishes a set of scientific competitiveness evaluation systems of charging stations from six aspects: peak load shifting, site selection and scale, intelligent technology, equipment utilization efficiency, operating profit, and reliability. After analyzing the charging record data of a charging station in a central city in China, the second-level indicators (Table 4) and the calculation formula (Table 5) are designed accordingly to facilitate the promotion and use of the evaluation system.
Table 4.
The hierarchical structure of competitiveness evaluation indicators.
Table 5.
Indicators formula.
4.1. Peak Cutting and Valley Filling
An electric charger is a kind of nonlinear equipment that produces harmonic pollution in the power grid, increases the power grid loss, and easily affects the stability of voltage and power [19]. If the power output from the power grid is not fully utilized during the period of low power consumption, it will cause waste and affect the stability of the power grid, while the excessive charging demand during the peak period will increase the load of the power grid. The coordinated charging demand will improve the utilization rate of the grid, reduce the pressure and energy consumption of the grid, and thus improve the service level of the charging station [36].
In terms of temporal and spatial characteristics, charging demand tends to be periodic. The 24-h period can be divided into three periods: peak period (8:00–12:00, 18:00–22:00), peak period (12:00–18:00, 22:00–0:00), and trough period (0:00–8:00). Pricing strategies of different electricity prices in peak and trough periods can guide charging demand. At present, some charging stations are equipped with battery storage, which can store electric energy in the trough period and sell electric energy in the peak period to earn price differences, which can generate economic income while reducing the load of the power grid.
4.2. Location and Scale
As an urban infrastructure, the physical space conditions of charging stations will affect the user experience and operation scale. The location and scale reflect the physical space of charging stations. Traffic flow and passenger flow can reflect the geographical location; the total physical space and the maximum charging service supply can reflect the scale of charging stations.
4.3. Smart Technology
Intelligent charging management systems can help develop optimal charging strategies [37], promote the coordinated operation of urban traffic and distribution networks to reduce peak loads, and increase the utilization rate of charging facilities. An energy storage system (ESS) has the advantages of fast response and continuous power supply; it has a great economic effect and ensures the reliability of the charging service [38]. The use of energy storage technology and peak shifting subsidies can be used to achieve peak reduction and valley filling of energy. However, these aspects of intelligent technology are rarely considered.
The intelligence of charging stations is mainly reflected in three aspects: automation level, real-time power distribution [39], and battery health monitoring. The level of automation is reflected by the level of onsite staff. The more staff members are responsible for, the lower the level of automation is. In addition, charging stations need to meet the charging time and route schedule requirements and allocate power according to the real-time charging demand changes.
4.4. Equipment Utilization Efficiency
For efficiency, the two factors of charging time and charging quantity can directly reflect the utilization efficiency of charging stations. On the basis of the two elements, we set up two second-level indicators under the equipment utilization indicators: single EV charger usage and single EV charger average daily power output. In addition, the average daily service times of a single EV charger are added as second-level indicators to measure the charging demand of charging stations.
4.5. Operating Income
The total charge fee includes the electricity fee and service fee in the operating process. The electricity fee will be paid to the grid, and the service fee will go to the charging station operator. At present, the evaluation indicators of the economy in relevant studies are generally measured from two aspects: input and output. In this study, the construction cost of charging stations is considered the sunk cost, which has little impact on the competitiveness evaluation, and the input cost in operation is not considered in this framework. The second-level indicators under the operating income indicators of this evaluation system mainly measure the level of service fee income.
4.6. Reliability
Reliability generally includes stability, maintenance, failure, and other factors. After analyzing the operation data records of charging stations, the following three aspects are established as reliability indicators. (1) Power supply reliability: two types of charging stations are connected to the grid, named the single circuit and double circuit. A single circuit means that one power supply circuit serves one load, and a double circuit means that two power supply circuits serve one load. The stability of the double circuit is higher. (2) Accident and emergency: Although the probability of accidents or failures (leakage of electric power or spontaneous combustion of vehicles) in charging stations is low, the economic and other losses caused by these accidents are huge, so the frequency of accidents should be considered. In addition, advanced preparation of emergency measures for charging stations is essential, so the proportion of emergency EV chargers reflects the level of emergency capacity. (3) Charging failure: in the charging process, there might be bad contact with the EV chargers or the charging is finally cut off for other reasons, which are difficult to identify, and charging failure will cause a waste of time resources.
5. Case Study
5.1. Calculation of the Weight of Indicators
In order to capture the differences in different stakeholders’ understanding of the competitiveness of charging stations, the experts selected must be fully professional and cover the different roles related to the locating and construction of charging stations. Therefore, the ten experts are carefully selected. Particularly, they include managers of public transport operation enterprises, managers of charging station construction operators, scholars of government-affiliated research institutions, and professors in universities. The judgment matrix of the −2~2 scale of all indicators is obtained through an expert questionnaire survey, and the final judgment matrix is obtained after mathematical formula conversion. Then, the matrix that does not conform to the consistency test is adjusted.
Then, the total ranking of the judgment matrix was calculated, the weight value was calculated, and the consistency of the total ranking was tested. After the test, they all met the requirements. We calculated the importance of each indicator for each expert according to the steps described in Figure 2 and then calculated the weighted average value of each indicator according to the reliability of the expert. Their weighted average values are summarized in Table 6. The higher the weight of an indicator, the more concerned the government, electric bus operators, and other related agencies are.
Table 6.
Evaluation value of each indicator.
5.2. Comprehensive Assessment
In this study, seven electric bus charging stations in a central Chinese city were selected as evaluation objects, and the value of each indicator physical quantity of each charging station was obtained according to the operation and charging record data of the charging station.
In terms of the indicator of the evaluation framework in this paper, the charging quantity, charging duration, and service fee are the daily average values. The physical quantities, such as the cumulative charging quantity and the cumulative charging duration in a certain month in a certain year, are calculated to reduce the error, and the daily indicators are obtained accordingly (Table 7). In addition, when calculating the failure of charging, only those whose time interval is between 2 min and 5 h are counted; those whose time interval is more than 5 h and the remaining values are treated as outliers. The evaluation results of the seven charging stations calculated by TOPSIS are 0.6850, 0.5818, 0.4191, 0.3984, 0.4198, 0.4354, and 0.4646 successively (Figure 5). Among them, station 1 has the highest comprehensive competitiveness, followed by station 2 and station 7.
Table 7.
The physical quantities of the evaluation indicators of seven charging stations.
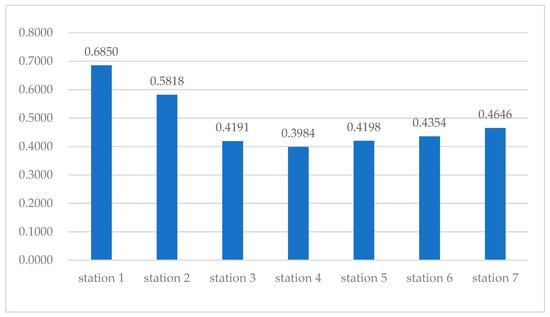
Figure 5.
Evaluation values of charging stations.
6. Conclusions
This study established a competitiveness evaluation system based on the actual situation of charging stations, improved and modified the indicators of competitiveness evaluation of charging stations at all levels based on the feedback of expert questionnaires and finally set up 6 first-level indicators and 20 s-level indicators. According to the above analysis in Section 4, differences in the importance of indicators will affect the evaluation results of the comprehensive competitiveness of charging stations. The results show that the evaluation system proposed in this paper can scientifically, efficiently, and comprehensively evaluate the competitiveness of charging stations. The evaluation method in this paper is easy to understand, has applicability, can obtain good data results, and is convenient to promote and use. This will help improve the comprehensive competitiveness of each charging station, improve the efficiency of the whole charging service network, and provide more guaranteed charging services for large electric bus fleets.
Electric buses are still in the development stage, and new technologies and concepts will continue to bring forth new ones. The evaluation system of charging stations and other infrastructure still needs to be further studied and developed. At present, the number of electric buses is gradually increasing, and unbalanced charging demand has a negative impact on the power grid. Energy storage batteries, intelligent management, and other technologies are receiving increasing attention. The evaluation method can be supplemented or modified on this basis in future studies to make the evaluation results more accurate and more applicable. For example, if the number of experts participating in the evaluation can be increased in future improvements, the result will better reflect the focus of the government and enterprises at the present stage. In addition, it may be difficult to obtain the evaluation value of charging station indicators in practical applications; for example, only interval numbers can be obtained, and decision-makers give subjective judgment data based on knowledge and experience [40,41]. In future studies, it is also necessary to consider how to convert uncertain hybrid evaluation data into definite values to make the evaluation method of charging station competitiveness more applicable.
Author Contributions
Methodology, Y.S. and K.L.; questionnaire survey, J.W., C.L. and K.L.; data curation, Y.S., J.W. and C.L.; writing—original draft preparation, Y.S.; writing—review and editing, C.L. and K.L. All authors have read and agreed to the published version of the manuscript.
Funding
This research was funded by the National Natural Science Foundation of China, grant number 51378091 and 71871043.
Institutional Review Board Statement
Not applicable.
Informed Consent Statement
Not applicable.
Data Availability Statement
Not applicable.
Conflicts of Interest
The authors declare no conflict of interest.
References
- Yang, X.; Lin, W.; Gong, R.; Zhu, M.; Springer, C. Transport Decarbonization in Big Cities: An Integrated Environmental Co-benefit Analysis of Vehicles Purchases Quota-Limit and New Energy Vehicles Promotion Policy in Beijing. Sustain. Cities Soc. 2021, 71, 102976. [Google Scholar] [CrossRef]
- Jansuwan, S.; Liu, Z.; Song, Z.; Chen, A. An Evaluation Framework of Automated Electric Transportation System. Transp. Res. Part E Logist. Transp. Rev. 2021, 148, 102265. [Google Scholar] [CrossRef]
- Yusof, N.; Abas, P.; Mahlia, T.; Hannan, M. Techno-Economic Analysis and Environmental Impact of Electric Buses. World Electr. Veh. J. 2021, 12, 31. [Google Scholar] [CrossRef]
- Zhu, C.; Chen, X. Optimizing Battery Electric Bus Transit Vehicle Scheduling with Battery Exchanging: Model and Case Study. Procedia Soc. Behav. Sci. 2013, 96, 2725–2736. [Google Scholar]
- Pathak, A.; Scheuermann, S.; Ongel, A.; Lienkamp, M. Conceptual Design Optimization of Autonomous Electric Buses in Public Transportation. World Electr. Veh. J. 2021, 12, 30. [Google Scholar] [CrossRef]
- Ullah, I.; Liu, K.; Yamamoto, T.; Zahid, M.; Jamal, A. Electric Vehicle Energy Consumption Prediction Using Stacked Generalization: An Ensemble Learning Approach. Int. J. Green Energy 2021, 18, 896–909. [Google Scholar] [CrossRef]
- Ullah, I.; Liu, K.; Yamamoto, T.; Mamlook, R.; Jamal, A. A comparative performance of machine learning algorithm to predict electric vehicles energy consumption: A path towards sustainability. Energy Environ. 2021, 1, 30. [Google Scholar] [CrossRef]
- An, K.; Lo, H. Robust Transit Network Design with Stochastic Demand Considering Development Density. Transp. Res. Part B Methodol. 2015, 81, 737–754. [Google Scholar] [CrossRef]
- An, K. Battery Electric Bus Infrastructure Planning under Demand Uncertainty. Transp. Res. Part C Emerg. Technol. 2020, 111, 572–587. [Google Scholar] [CrossRef]
- Rogge, M.; Evelien, V.; Larsen, A. Electric Bus Fleet Size and Mix Problem with Optimization of Charging Infrastructure. Appl. Energy 2018, 211, 282–295. [Google Scholar] [CrossRef] [Green Version]
- Uslua, T.; Kaya, O. Location and Capacity Decisions for Electric Bus Charging Stations Considering Waiting Times. Transp. Res. Part D Transp. Environ. 2021, 90, 102645. [Google Scholar] [CrossRef]
- Guschinsky, N.; Kovalyov, M.; Rozin, B.; Braunerb, N. Fleet and Charging Infrastructure Decisions for Fast-Charging City Electric Bus Service. Comput. Oper. Res. 2021, 135, 105449. [Google Scholar] [CrossRef]
- Xylia, M.; Leduc, S.; Patrizio, P.; Silveira, S. Locating Charging Infrastructure for Electric Buses in Stockholm. Transp. Res. Part C Emerg. Technol. 2017, 78, 183–200. [Google Scholar] [CrossRef]
- Li, K.; Lin, K.; Jin, M.; Yuen, K.; Yang, Z.; Xiao, Y. Impact of the Belt and Road Initiative on Commercial Maritime Power. Transp. Res. Part A Policy Pract. 2020, 135, 160–167. [Google Scholar] [CrossRef]
- Maase, S.; Dilrosun, X.; Kooi, M.; Van den Hoed, R. Performance of an Electric Vehicle Charging Infrastructure: Development of an Assessment Platform Based on Charging Data. World Electr. Veh. J. 2018, 9, 25. [Google Scholar] [CrossRef] [Green Version]
- Hosseini, S.; Sarder, M. Development of a Bayesian Network Model for Optimal Site Selection of Electric Vehicle Charging Station. Int. J. Electr. Power Energy Syst. 2019, 105, 110–122. [Google Scholar] [CrossRef]
- Dominguez-Navarro, J.A.; Dufo-Lopez, R.; Yusta-Loyo, J.M.; Artal-Sevil, J.S.; Bernal-Agustín, J.L. Design of an Electric Vehicle Fast-Charging Station with Integration of Renewable Energy and Storage Systems. Int. J. Electr. Power Energy Syst. 2019, 105, 46–58. [Google Scholar] [CrossRef]
- Liu, K.; Gao, H.; Liang, Z.; Zhao, M.; Li, C. Optimal Charging Strategy for Large-Scale Electric Buses Considering Resource Constraints. Transp. Res. Part D Transp. Environ. 2021, 99, 103009. [Google Scholar] [CrossRef]
- Feng, J.; Xu, S.; Li, M. A Novel Multi-Criteria Decision-Making Method for Selecting the Site of an Electric-Vehicle Charging Station from a Sustainable Perspective. Sustain. Cities Soc. 2021, 65, 102623. [Google Scholar] [CrossRef]
- Erbaş, M.; Kabak, M.; Özceylan, E.; Çetinkaya, C. Optimal Siting of Electric Vehicle Charging Stations: A GIS-Based Fuzzy Multi-Criteria Decision Analysis. Energy 2018, 163, 1017–1031. [Google Scholar] [CrossRef]
- Guo, S.; Zhao, H. Optimal Site Selection of Electric Vehicle Charging Station by Using Fuzzy TOPSIS Based on Sustainability Perspective. Appl. Energy 2015, 158, 390–402. [Google Scholar] [CrossRef]
- Ju, Y.; Ju, D.; Gonzalez, E.; Giannakis, M.; Wang, A. Study of Site Selection of Electric Vehicle Charging Station Based on Extended GRP Method under Picture Fuzzy Environment. Comput. Ind. Eng. 2019, 135, 1271–1285. [Google Scholar] [CrossRef]
- Broniewicz, E.; Ogrodnik, K. Multi-Criteria Analysis of Transport Infrastructure Projects. Transp. Res. Part D Transp. Environ. 2020, 83, 102351. [Google Scholar] [CrossRef]
- Liu, J.; Yin, Y. An Integrated Method for Sustainable Energy Storing Node Optimization Selection in China. Energy Convers. Manag. 2019, 199, 112049. [Google Scholar] [CrossRef]
- Awasthi, A.; Chauhan, S. Using AHP and Dempster–Shafer Theory for Evaluating Sustainable Transport Solutions. Environ. Modeling Softw. 2011, 26, 787–796. [Google Scholar] [CrossRef]
- Poh, K.; Ang, B. Transportation Fuels and Policy for Singapore: An AHP Planning Approach. Comput. Ind. Eng. 1999, 37, 507–525. [Google Scholar] [CrossRef]
- Ocampo, L.; Tanaid, R.; Tiu, A.; Selerio, E., Jr.; Yamagishi, K. Classifying the Degree of Exposure of Customers to COVID-19 in the Restaurant Industry: A Novel Intuitionistic Fuzzy Set Extension of the TOPSIS-Sort. Appl. Soft Comput. 2021, 113, 107906. [Google Scholar] [CrossRef]
- Hwang, C.; Yoon, K. Multiple Attribute Decision Making: Methods and Applications; Springer: New York, NY, USA, 1981. [Google Scholar]
- Du, Y.; Gao, K. Ecological Security Evaluation of Marine Ranching with AHP-Entropy-Based TOPSIS: A Case Study of Yantai, China. Mar. Policy 2020, 122, 104223. [Google Scholar] [CrossRef]
- Gorosabel, O.; Xylia, M.; Silveira, S. A Framework for the Assessment of Electric Bus Charging Station Construction: A Case Study for Stockholm’s Inner City. Sustain. Cities Soc. 2021, 78, 103610. [Google Scholar] [CrossRef]
- Lin, Y.; Zhang, K.; Shen, Z.; Miao, L. Multistage Large-Scale Charging Station Planning for Electric Buses Considering Transportation Network and Power Grid. Transp. Res. Part C Emerg. Technol. 2019, 107, 423–443. [Google Scholar] [CrossRef]
- Kaya, M.; Tortum, A.; Alemdar, K.; Odur, M. Site Selection for EVCS in Istanbul by GIS and Multi-Criteria Decision-Making. Transp. Res. Part D Transp. Environ. 2020, 80, 102271. [Google Scholar] [CrossRef]
- Wang, Y.; Huang, Y.; Xu, J.; Barclay, N. Optimal Recharging Scheduling for Urban Electric Buses: A Case Study in Davis. Transp. Res. Part E Logist. Transp. Rev. 2017, 100, 115–132. [Google Scholar] [CrossRef]
- Zhou, J.; Wu, Y.; Wu, C.; He, F.; Zhang, B.; Liu, F. A Geographical Information System Based Multi-Criteria Decision-Making Approach for Location Analysis and Evaluation of Urban Photovoltaic Charging Station: A Case Study in Beijing. Energy Convers. Manag. 2020, 205, 112340. [Google Scholar] [CrossRef]
- Liu, K.; Wang, J.; Yamamoto, T.; Morikawa, T. Exploring the Interactive Effects of Ambient Temperature and Vehicle Auxiliary Loads on Electric Vehicle Energy Consumption. Appl. Energy 2018, 227, 324–331. [Google Scholar] [CrossRef]
- Ma, T.; Xie, S. Optimal Fast Charging Station Locations for Electric Ridesharing with Vehicle-Charging Station Assignment. Transp. Res. Part D Transp. Environ. 2021, 90, 102682. [Google Scholar] [CrossRef]
- Shekhovtsov, A.; Sałabun, W. A Comparative Case Study of the VIKOR and TOPSIS Rankings Similarity. Procedia Comput. Sci. 2020, 176, 3730–3740. [Google Scholar] [CrossRef]
- Ding, H.; Hu, Z.; Song, Y. Value of the Energy Storage System in an Electric Bus Fast Charging Station. Appl. Energy 2015, 157, 630–639. [Google Scholar] [CrossRef]
- Liu, K.; Gao, H.; Liang, Z.; Wang, Y.; Feng, T.; Li, C. Robust charging strategies for electric bus fleets under energy consumption uncertainty. Transp. Res. Part D Transp. Environ. 2022, 104, 103215. [Google Scholar] [CrossRef]
- Elliotta, M.; Kittner, N. Operational Grid and Environmental Impacts for a V2G-Enabled Electric School Bus Fleet Using DC Fast Chargers. Sustain. Prod. Consum. 2021, 30, 316–330. [Google Scholar] [CrossRef]
- He, Y.; Liu, Z.; Song, Z. Optimal Charging Scheduling and Management for a Fast-Charging Battery Electric Bus System. Transp. Res. Part E Logist. Transp. Rev. 2020, 142, 102056. [Google Scholar] [CrossRef]


Publisher’s Note: MDPI stays neutral with regard to jurisdictional claims in published maps and institutional affiliations. |
© 2022 by the authors. Licensee MDPI, Basel, Switzerland. This article is an open access article distributed under the terms and conditions of the Creative Commons Attribution (CC BY) license (https://creativecommons.org/licenses/by/4.0/).