
Multi-Dimensional Analysis of Load Characteristics of Electrical Vehicles Based on Power Supply Side Data and Unsupervised Learning Method

 , ,
, , 
Abstract
:1. Introduction
2. Data Processing and Expansion
2.1. Basic Format and Data Cleaning
- Delete records that satisfy .
- Let be the charging duration and records with too long charging duration be deleted ().
- The maximum charging output power is denoted as . Delete abnormal charging records ().
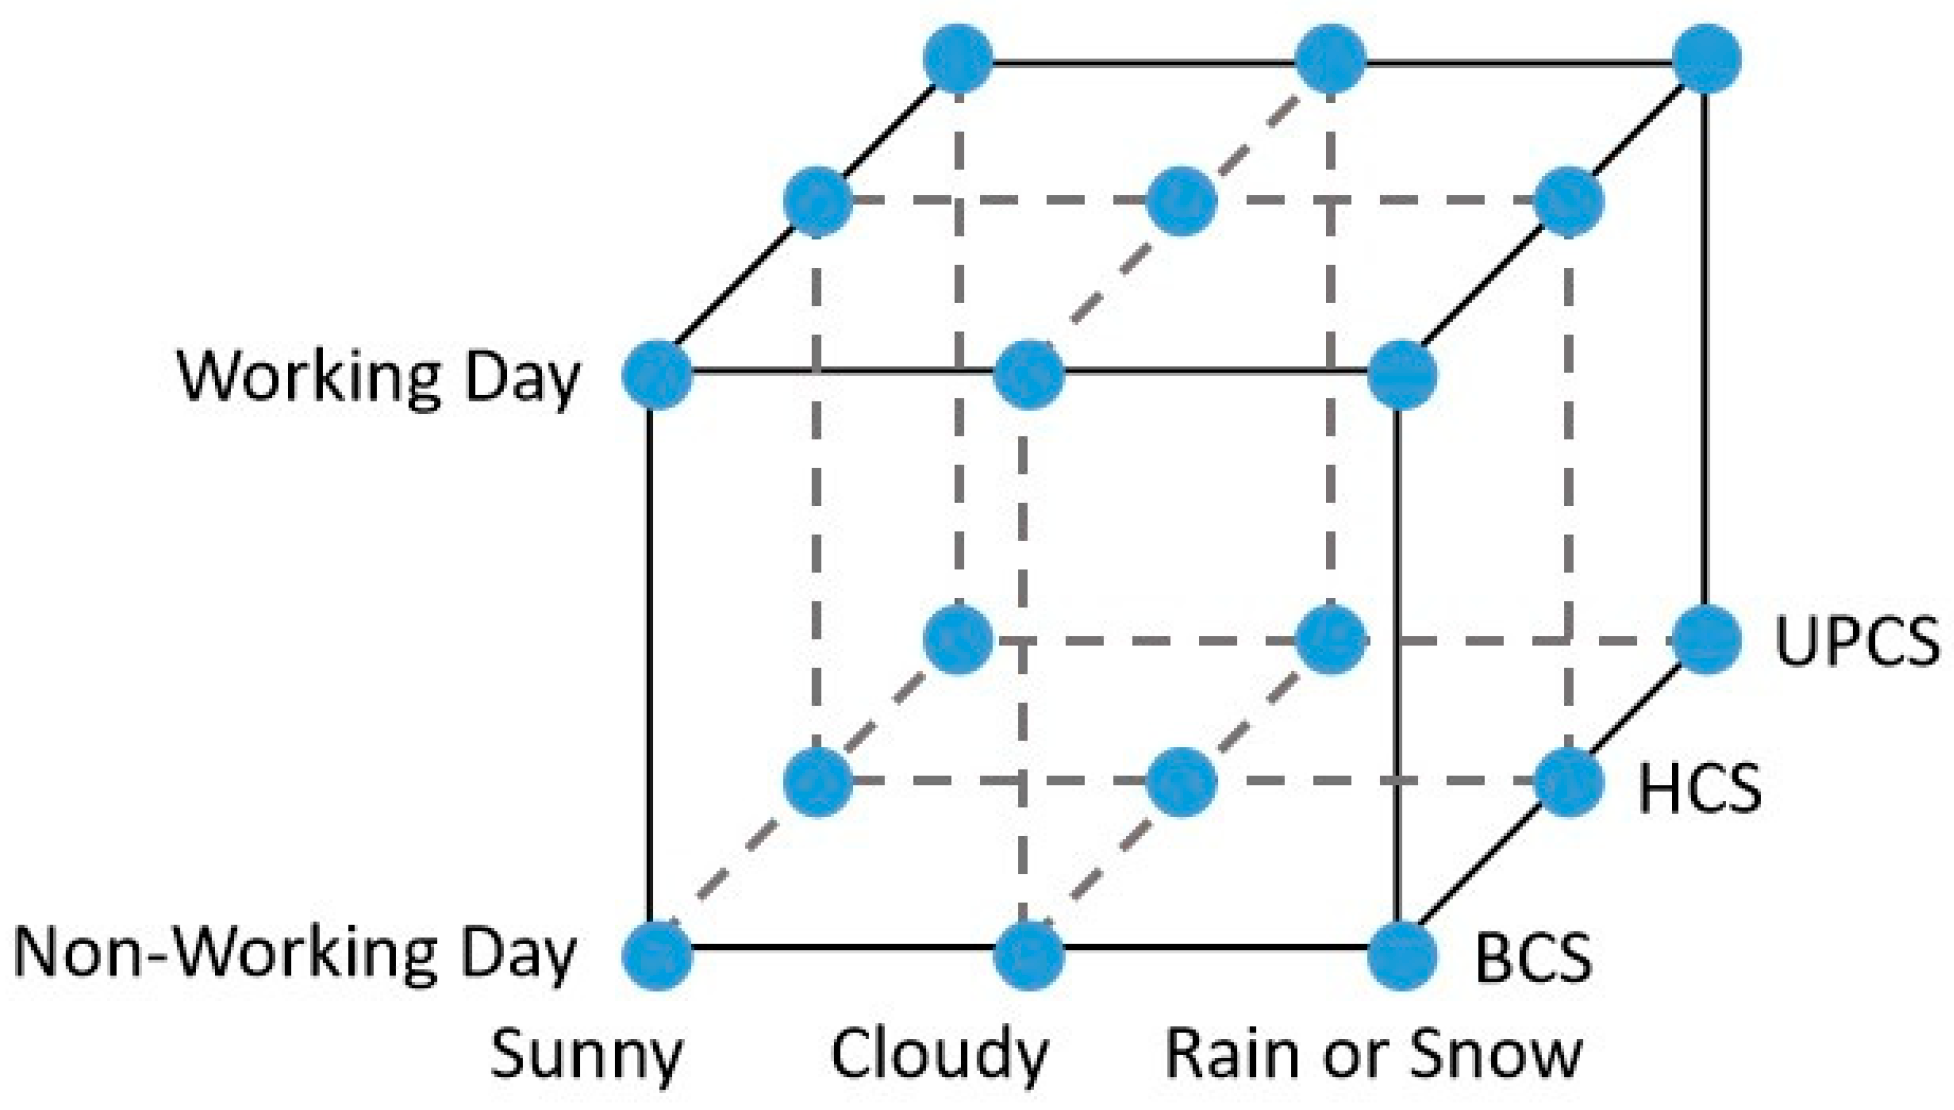
2.2. Data Expansion and Scene Classification
- Service type. The service object in each record can be determined based on the text information in . If contains ’bus’, it is determined to be a bus charging service; if it contains ’service area’, it is then classified as a highway charging service; if it does not contain any special characters, it is determined to be a general urban public charging service.
- Weather condition. Combine the charging start date (‘year’, ’month’, and ’day’) with the charging station location information in , such as “××province, ××city, ××district”, the weather information at the time when each record is generated can be obtained through the web information. The weather conditions are divided into three categories: ’sunny’, ’cloudy’, and ’rain or snow’.
- Day type. According to the charging start date and the holiday/weekend information from 2018 to 2019, the day type at the start time of each record can be obtained, that is, working day or non-working day.
- Temporal data conversion. With known , and can be calculated by using the time function in MATLAB. In addition, the Hour, Minute, and Second properties were extracted from , and they were converted into floating point numbers that are easy to statistically process.
3. Clustering and Characteristic Index Calculation
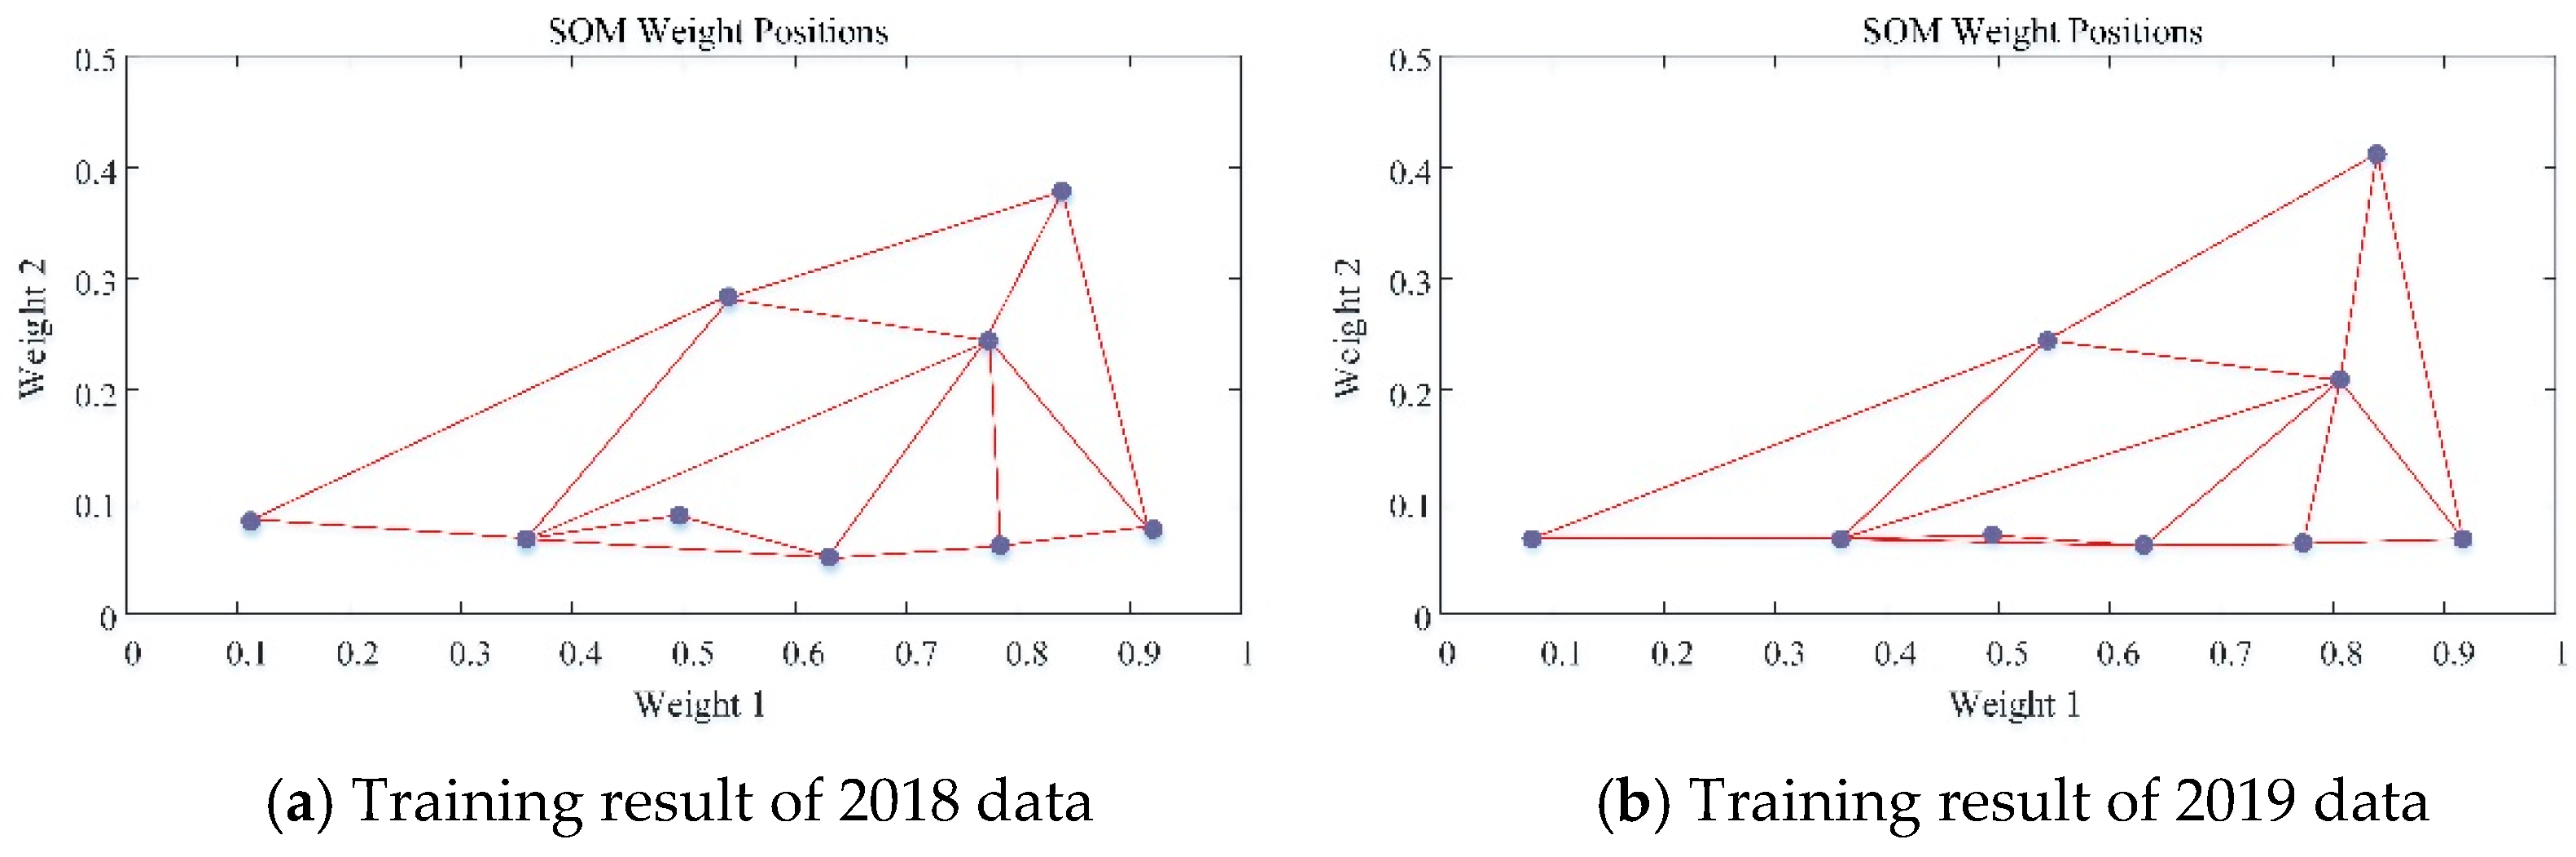
3.1. SOM Clustering Algorithm
- Initialize the neighborhood and learning rate functions ; set stop conditions. The area surrounding the winner neuron, which is calculated in next step, is called the neighborhood , and the neighborhood neurons are activated to varying degrees. is a function of the number of calculations, which decrease as it increases. affects the weight correction magnitude. To control the training stability, it also decreases with an increase in the number of calculations. The training ends when the maximum iterations are reached.
- Calculate the Euclidean distances between the p-th input sample and the weight vector , where . The output neuron with the smallest distance is selected as the winner neuron.
- According to the neighborhood and learning rate functions, the neighborhood neuron weights are updated:where k is the current number of calculations.
- Determine whether all samples have been input: if complete, set k to zero and proceed to Step 5; if not, update the neighborhood and learning rate, and return to Step 2.
- Determine whether the iterations have completed: if completed, output the training results; if not, return to Step 2.
3.2. Characteristic Index Calculation Method
- peak load ratio and daily load duration ratio .
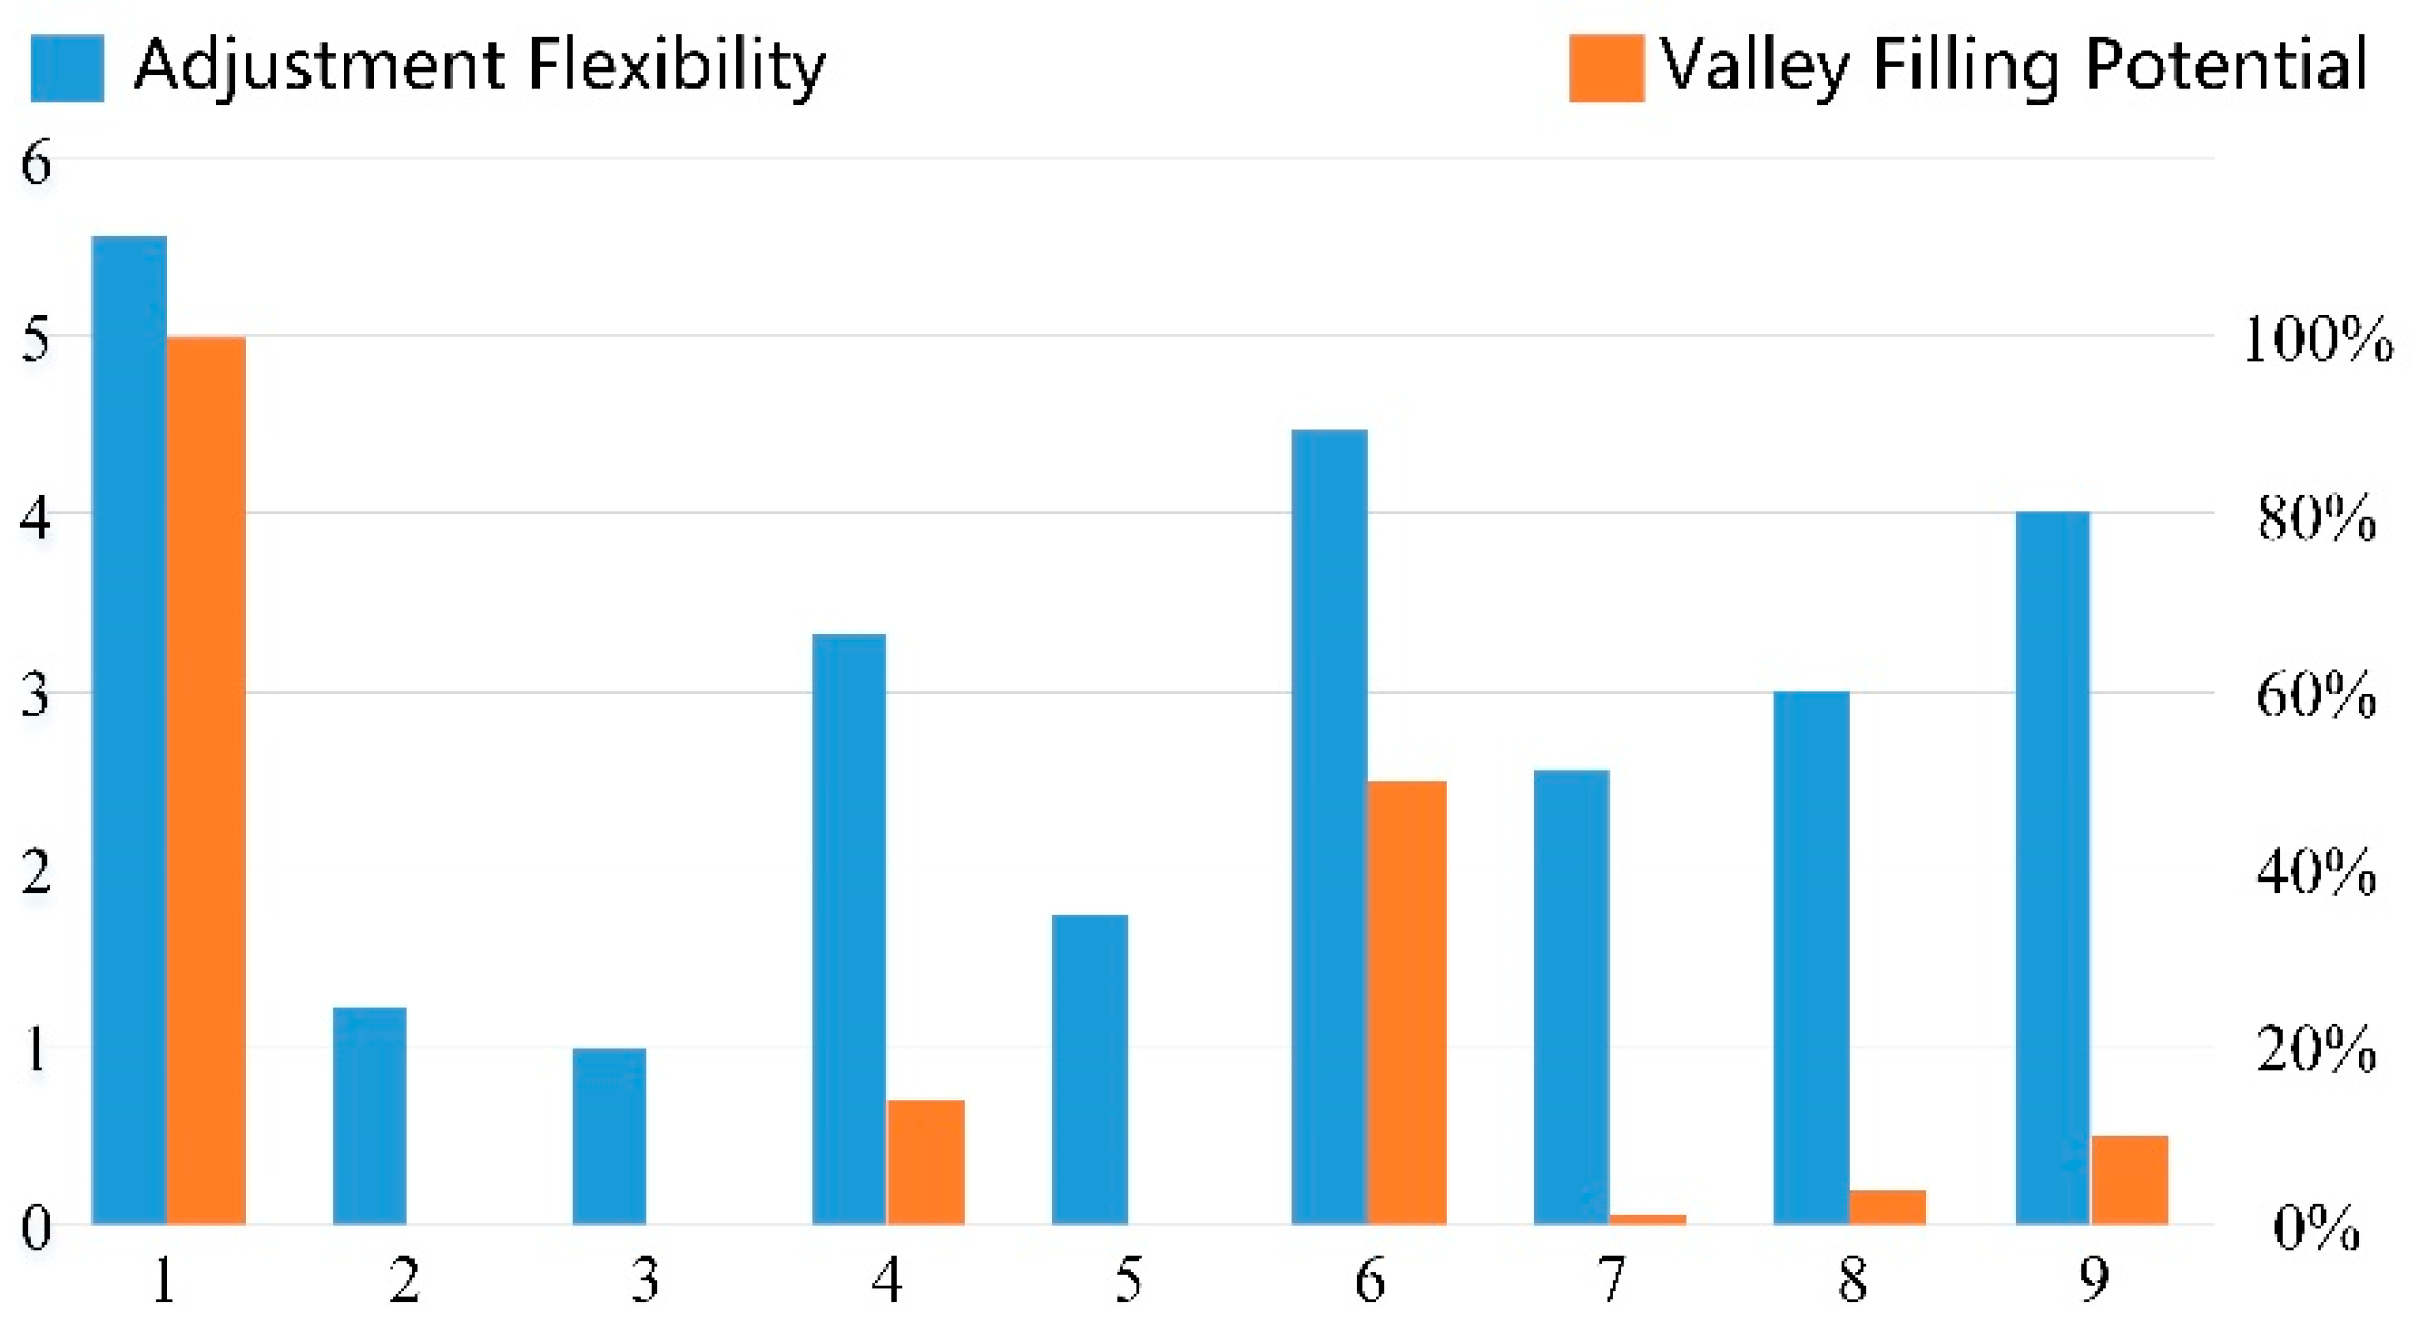
- adjustment flexibility
- valley filling potential
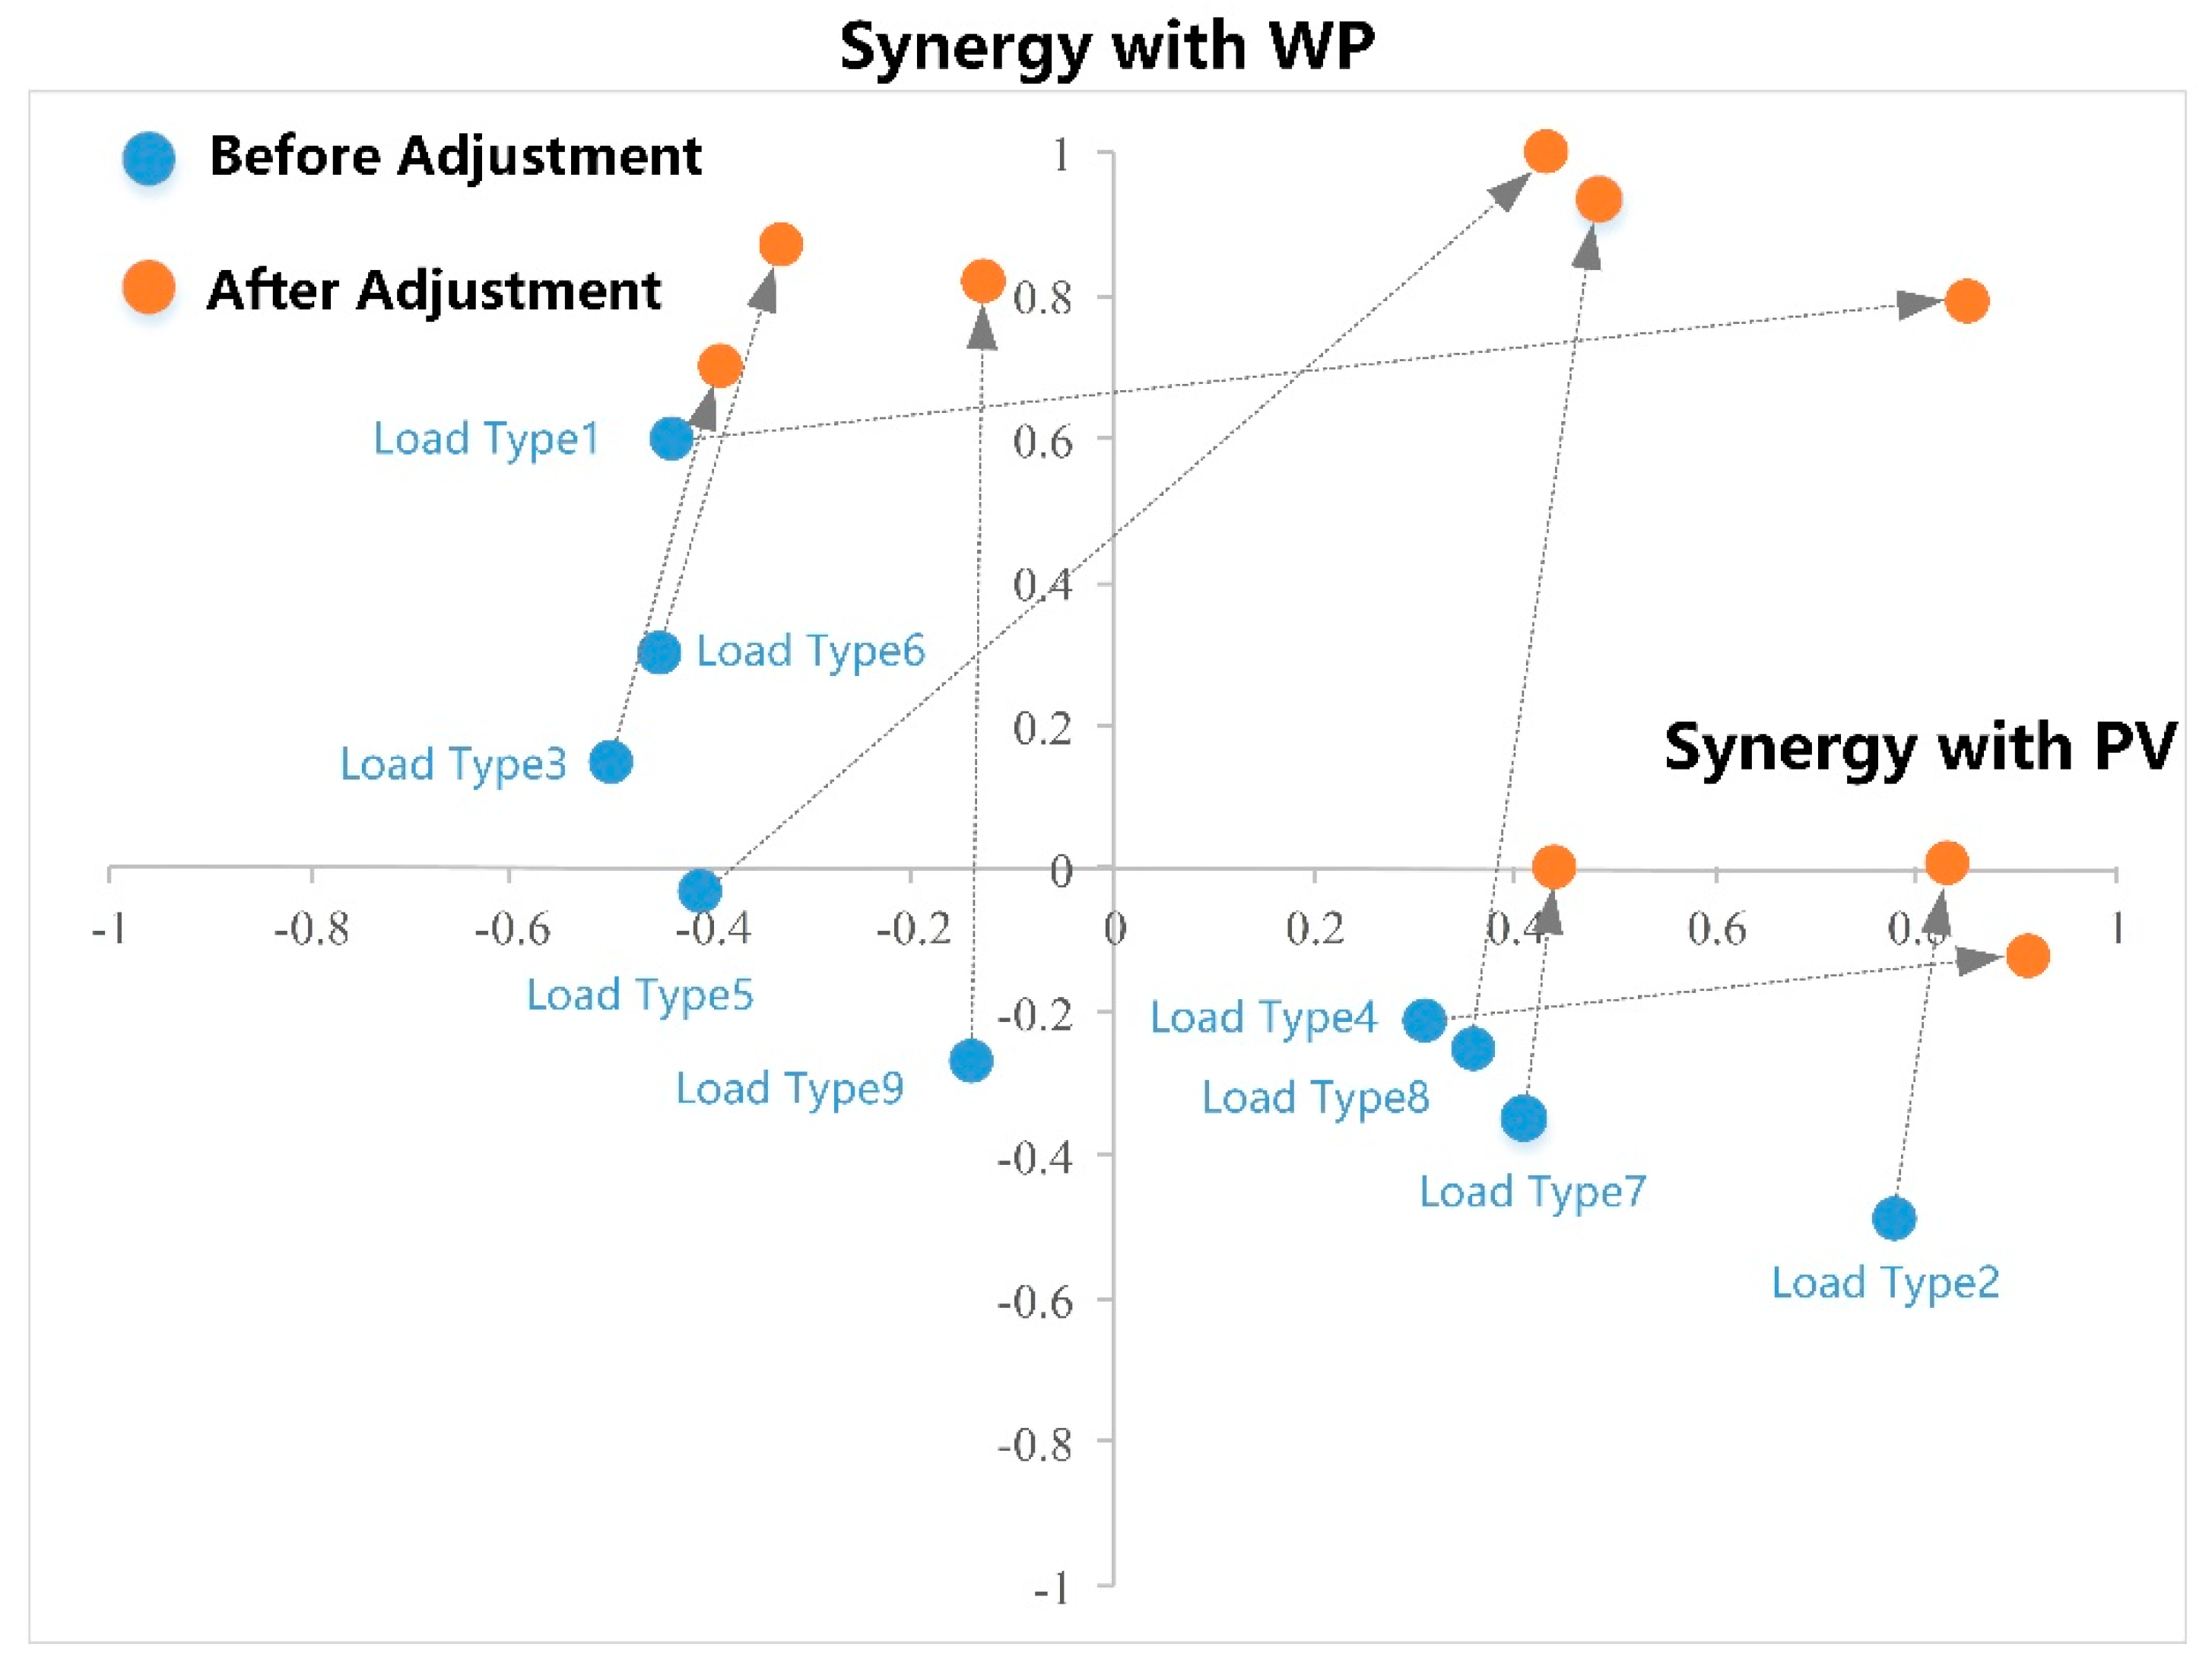
- synergy with renewable energy
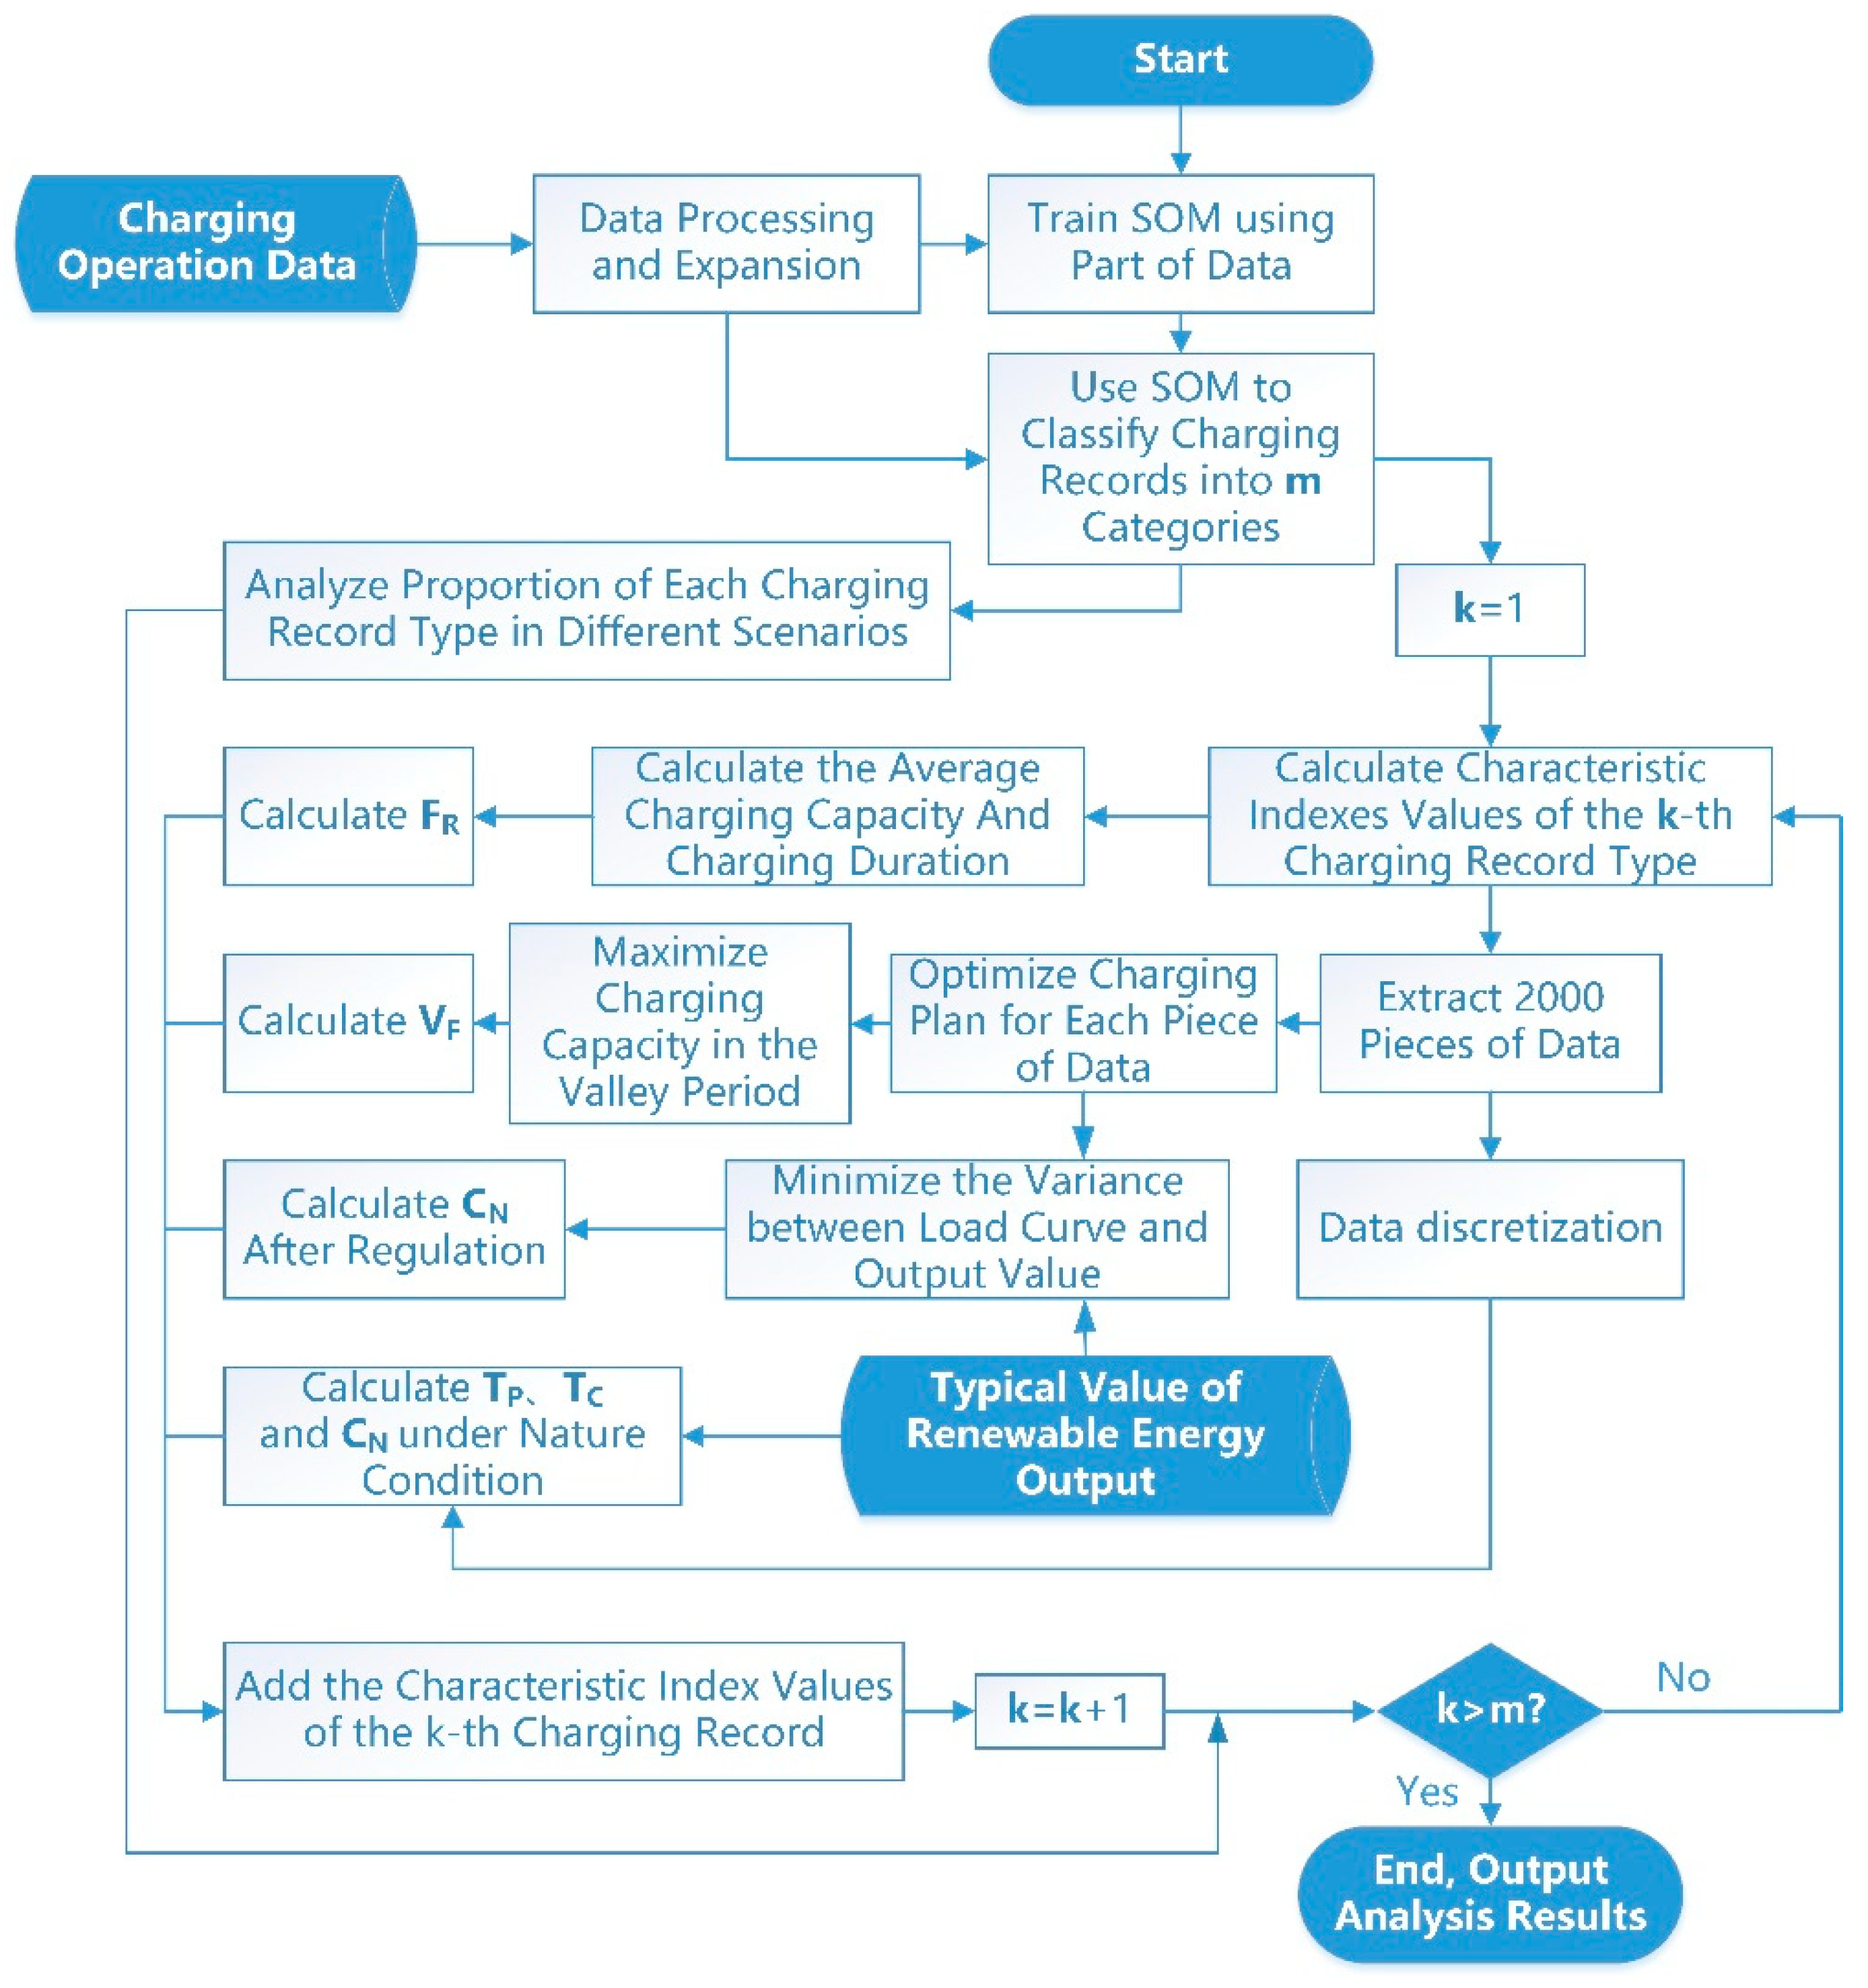
3.3. Load Characteristic Analysis Process
4. Results of Multi-Dimensional Analysis of EV Load Characteristics
4.1. Cluster Analysis
4.2. Characteristics of Each Load Type
4.2.1. Peak Load Ratio and Daily Load Duration Ratio
4.2.2. Adjustment Flexibility and Valley Filling Potential
4.2.3. Synergy with Renewable Energy
4.3. Comparison of Different Scenarios
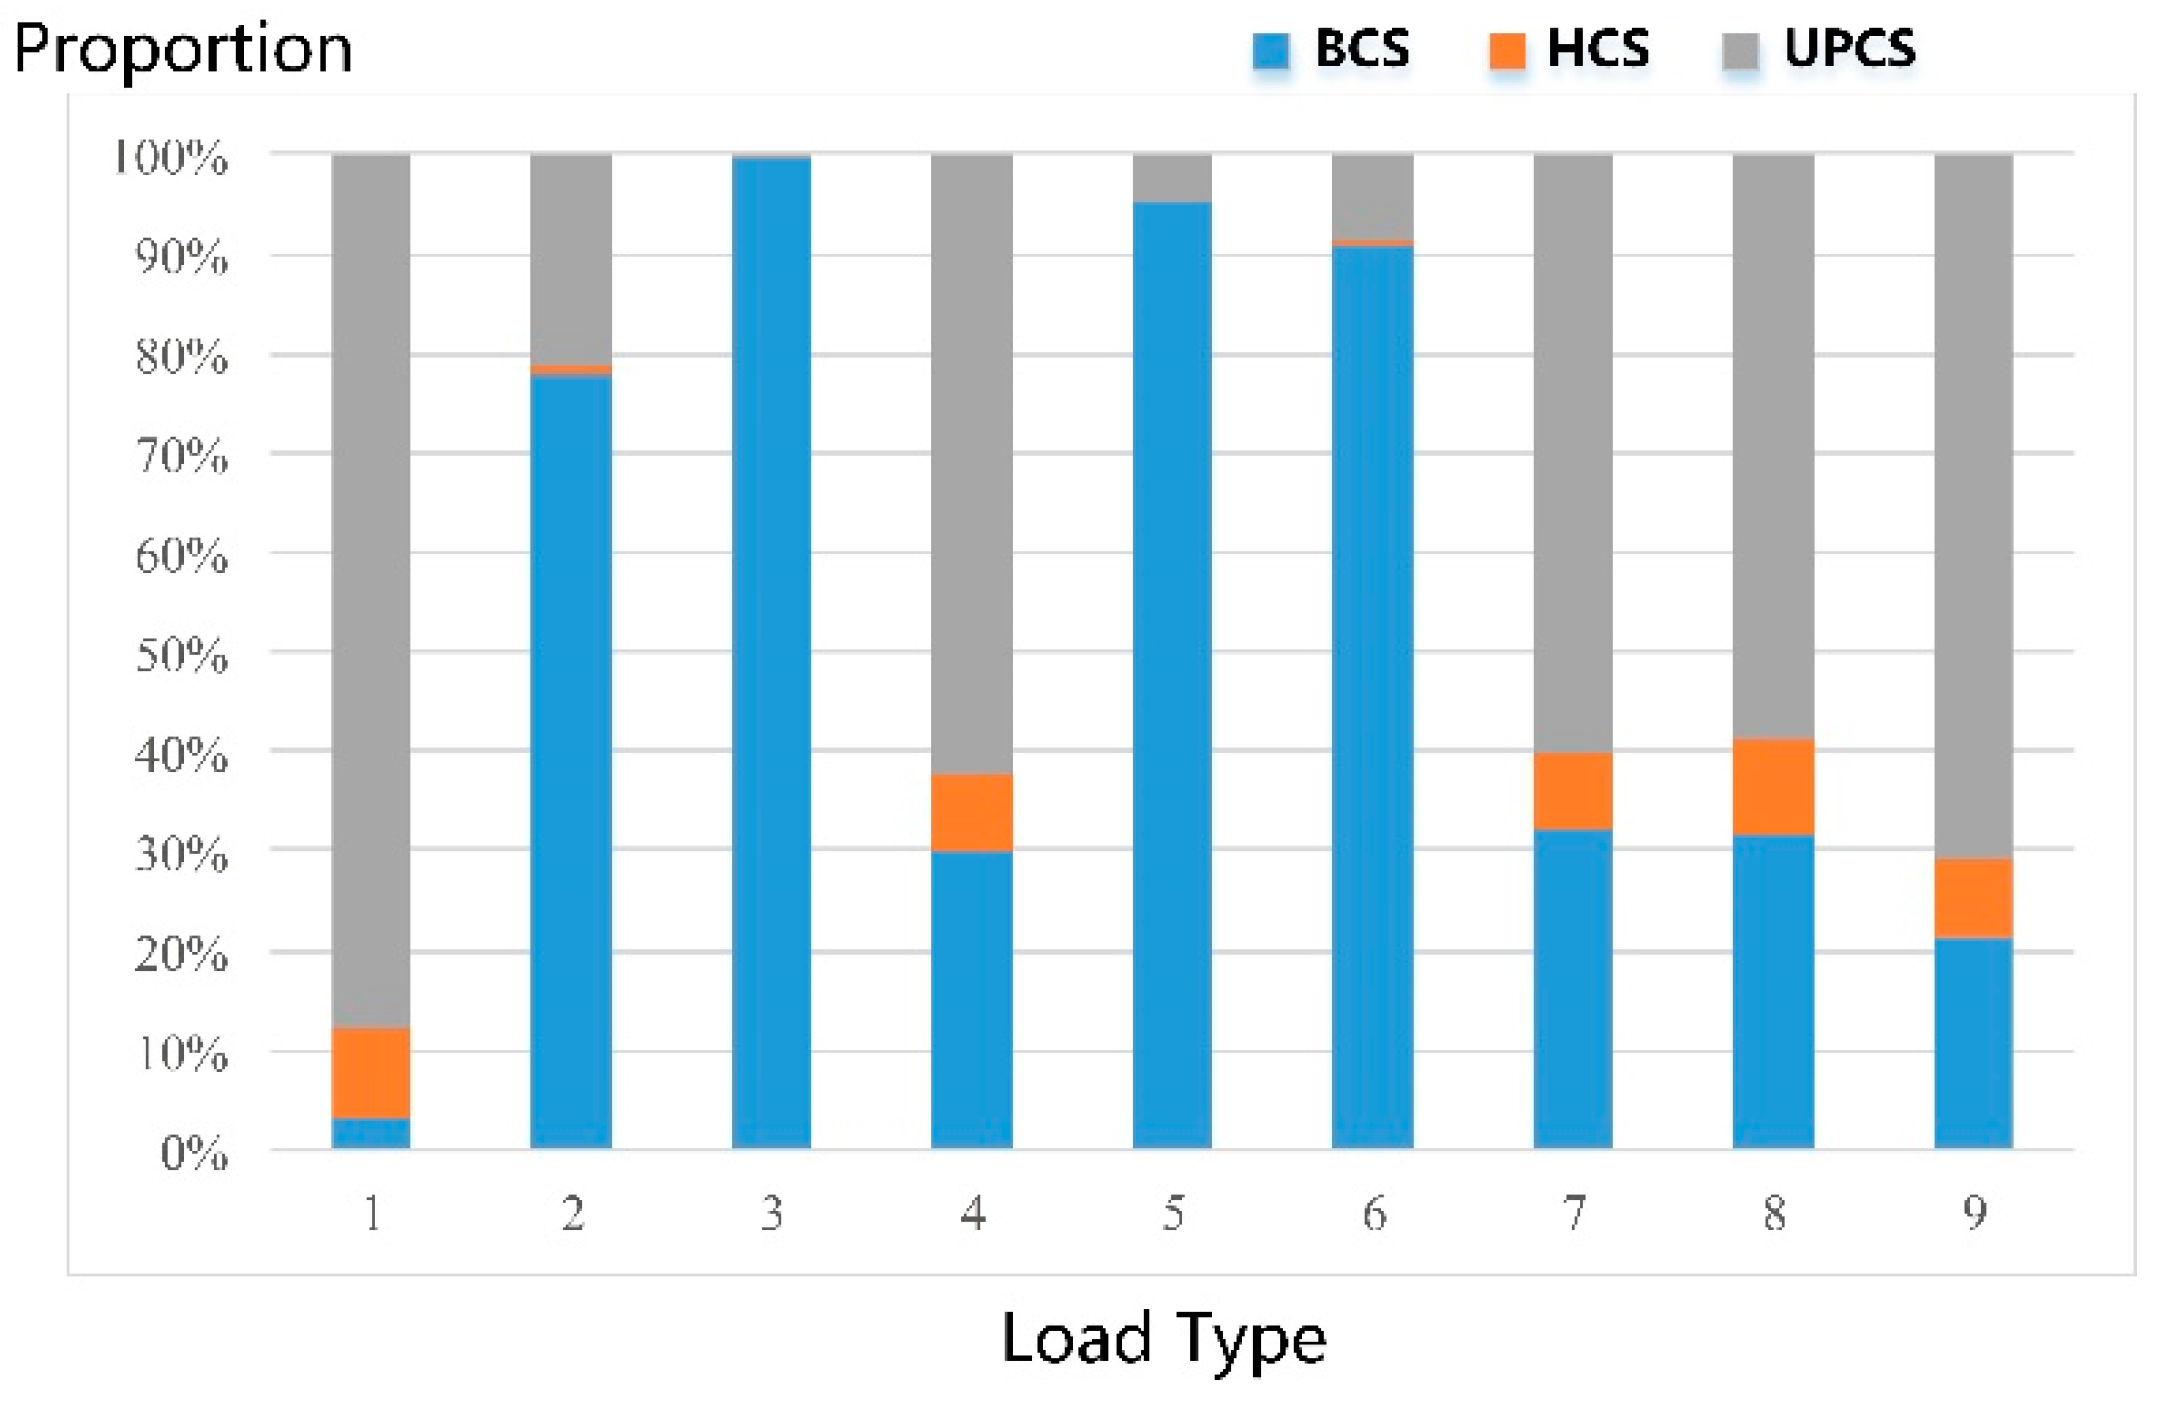
4.3.1. Load Composition in Different Scenarios
- The number of charging behaviors in HCS is much smaller than BCS and UPCS. The application areas of EVs are mainly in the interior of the city.
- BCS and UPCS generally charge more on working days than non-working days, while HPCS have a larger charging capacity on non-working days. The reason is that the rigid travel behaviors in the city on non-working days has been significantly reduced. The proportion of intercity-travel will increase in non-working day, resulting in a corresponding load increase.
- On working days, there are more charging records for different types of charging stations in rainy and snowy weather conditions. On the one hand, bad weather has led to an increase in the average power consumption of EVs, on the other hand, it has increased the users’ dependence on cars under the rigid travel demand. On non-working days, bad weather will reduce users’ flexible travel needs.
4.3.2. Comparison of Characteristics of BCS, HCS and UPCS
- Load types 2, 3, and 5 with relatively stable distributions and large average charging capacities are mainly composed of bus charging loads. The total number of charging records and charging capacity are 25.54% and 58.69% of the bus load, respectively. Load type 2 and PV have better natural synergy characteristics, and load types 3 and 5 have better regulation and synergy characteristics with WP. Load type 6 is also mainly composed of bus charging load, which accounts for 18.75% of the bus charging records and 10.42% of the charging capacity.
- The load composition types of HCS and UPCS are similar. The main difference is that the HCS charging loads are more concentrated on load types 7 and 8 with shorter duration and less adjustment flexibility.
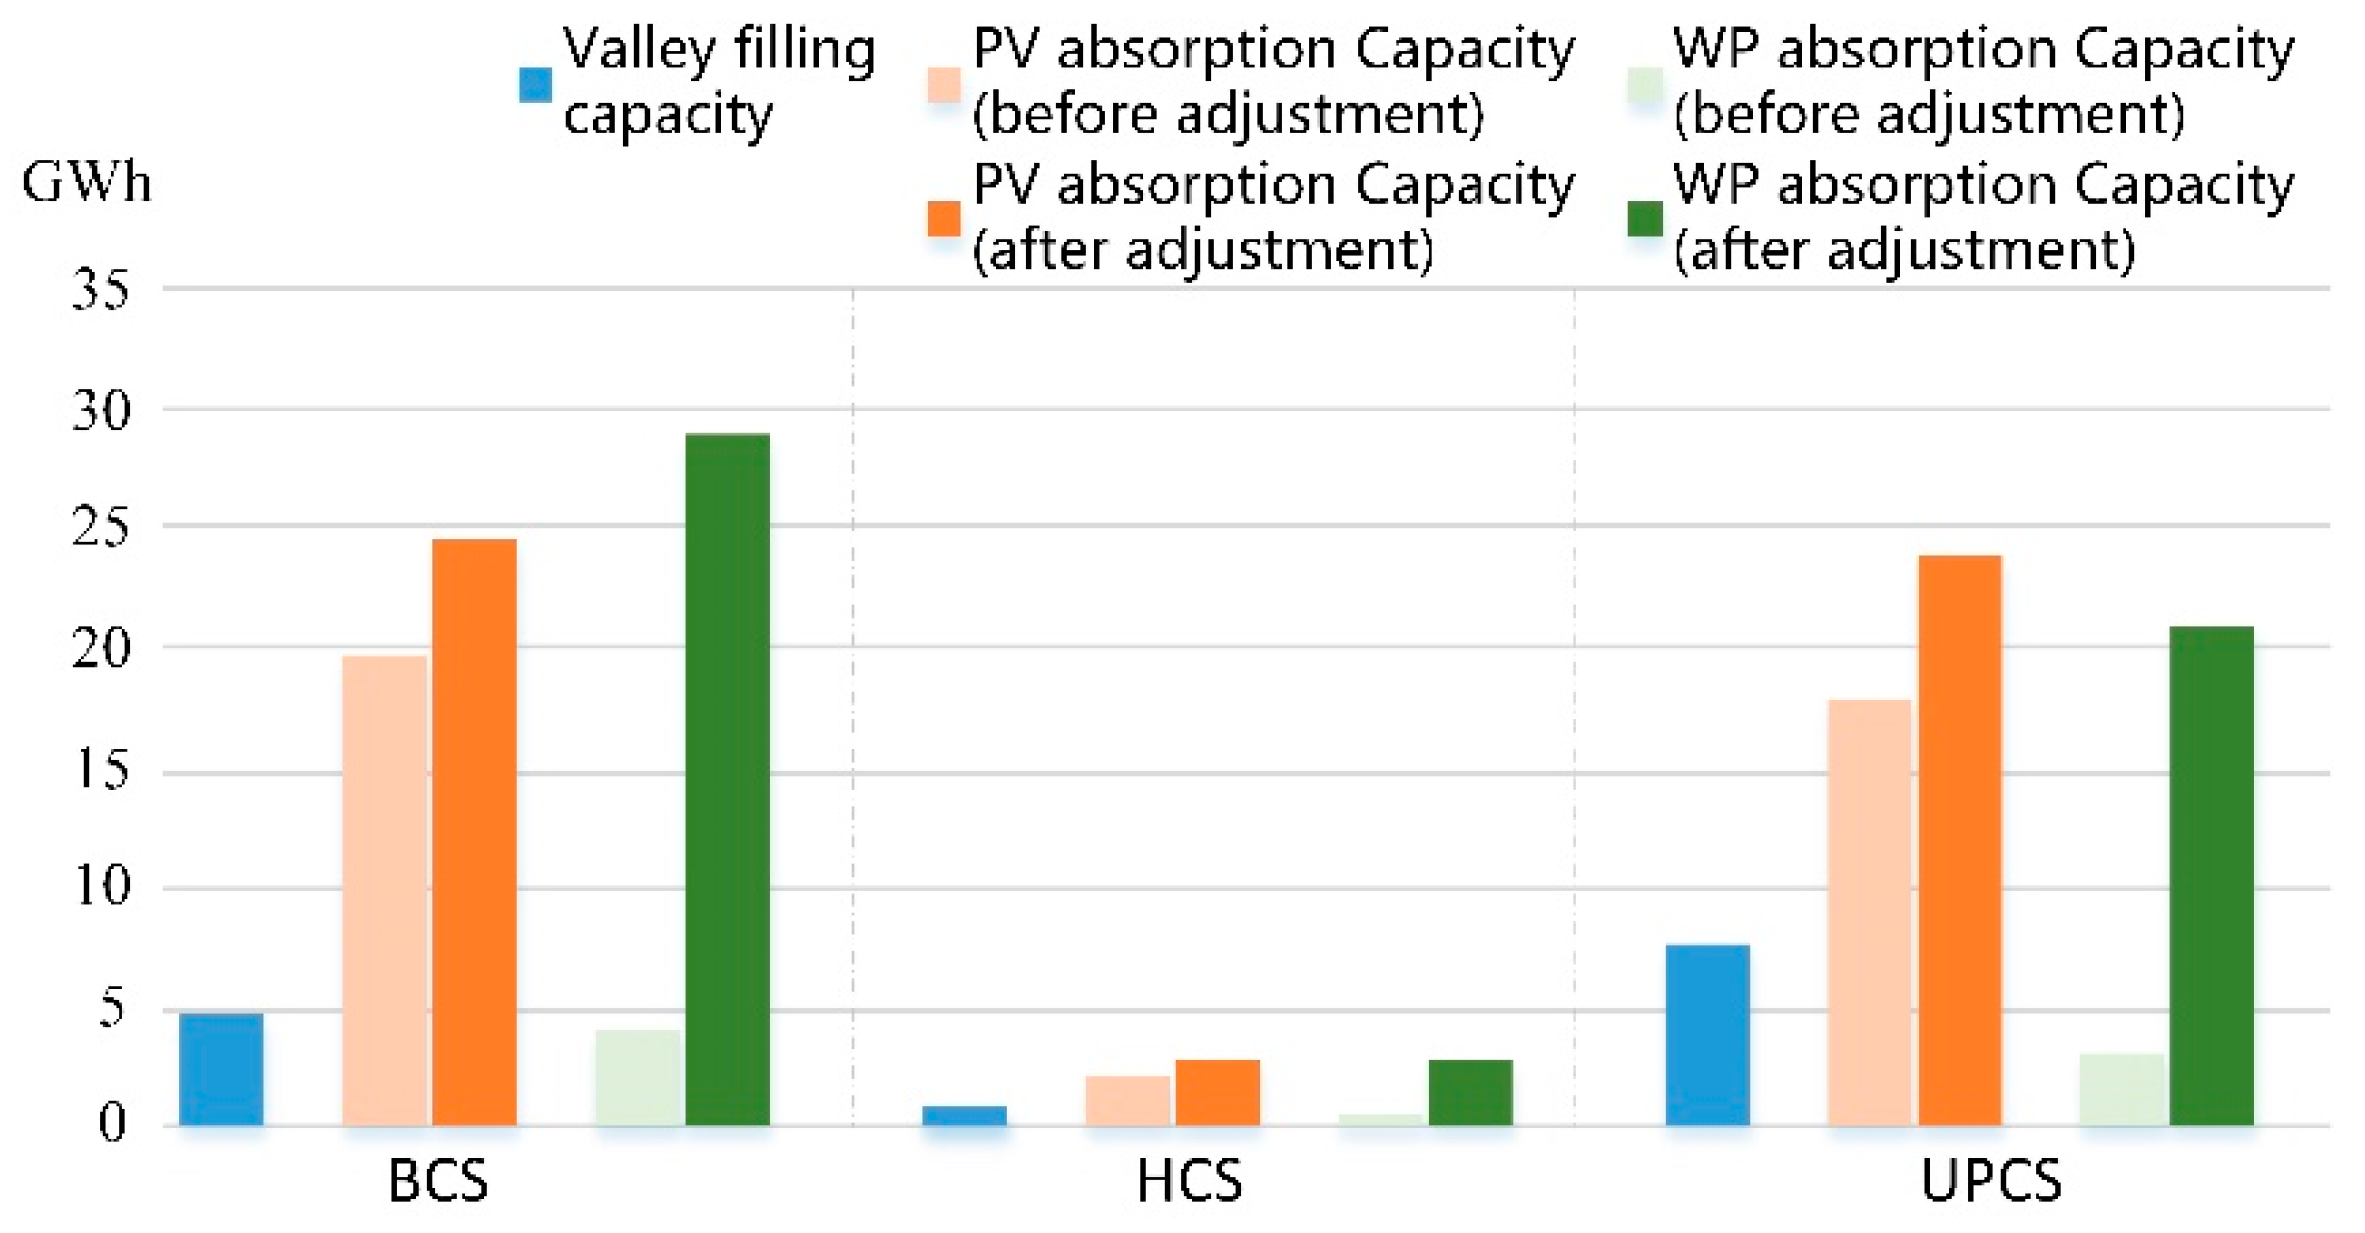
4.3.3. V2G Capabilities of Different Types of Charging Stations
5. Conclusions
- The load structure and characteristics of the same charging service type (BCS, HCS, UPCS) under different weather conditions and day types are stable and consistent, which provides benefit for infrastructure planning and smart charging scheduling based on charging behavior analysis and load forecasting.
- The charging loads are closely coupled with the user’s travel behavior. The impact of weather conditions on the amount of charging load depends on the necessity of travel. On working days, bad weather will lead to an increase in the charging load and a decrease on non-working days.
- BCS has relatively stable total load curves and a large amount of charging loads concentrated at night, resulting in good valley filling capacity and the ability to absorb WP at night.
- The peaks of charging load in BCS and HCS are relatively concentrated, and the volatility of the load curve is large, which brings challenges to the economic and safe operation of charging stations. Compared with HCS, UPCS has longer load durations and greater adjustment flexibility.
- In different scenarios, EVs have the potential to synergize with the power grid and renewable energy sources, especially in cities. Smart charging adjustment can greatly increase the consumption of PV and WP by EVs.
Author Contributions
Funding
Institutional Review Board Statement
Informed Consent Statement
Data Availability Statement
Conflicts of Interest
References
- Zhang, H.; Hu, Z.; Song, Y.; Xu, Z.; Jia, L. A prediction method for electric vehicle charging load considering spatial and temporal distribution. Autom. Electr. Power Syst. 2014, 38, 13–20. [Google Scholar]
- João, A.; Lopes, P.; Soares, F.J.; Almeida, P.M.R. Almeida. Integration of Electric Vehicles in the Electric Power System. Proc. IEEE 2011, 99, 168–183. [Google Scholar]
- Tao, S.; Liao, K.; Xiao, X.; Wen, J.; Yang, Y.; Zhang, J. Charging demand for electric vehicle based on stochastic analysis of trip chain. IET Gener. Transm. Distrib. 2016, 10, 2689–2698. [Google Scholar]
- Chen, L.; Nie, Y.; Zhong, Q. A model for electric vehicle charging load forecasting based on trip chains. Trans. China Electrotech. Soc. 2015, 30, 216–225. [Google Scholar]
- Wen, J.; Tao, S.; Xiao, X.; Luo, C. Analysis on charging demand of EV based on stochastic simulation of trip chain. Power Syst. Technol. 2015, 39, 1477–1484. [Google Scholar]
- Guo, C.; Liu, D.; Zhu, C.; Wang, X.; Cao, X. Modeling and analysis of electric vehicle charging load in residential area. Electr. Power Autom. Equip. 2020, 40, 1–9. [Google Scholar]
- Arias, M.B.; Bae, S. Electric vehicle charging demand forecasting model based on big data technologies. Appl. Energy 2016, 183, 327–339. [Google Scholar] [CrossRef]
- Xing, Q.; Chen, Z.; Huang, X.; Zhang, Z.; Xu, X.; Zhang, T.; Huang, X.; Wang, H. Electric vehicle charging demand forecasting model based on data-driven approach. Proc. CSEE 2020, 40, 3796–3813. [Google Scholar]
- Gajani, G.S.; Gruosso, G. Data-driven approach to model electrical vehicle charging profile for simulation of grid integration scenarios. IET Electr. Syst. Transp. 2019, 9, 168–175. [Google Scholar] [CrossRef]
- Shao, Y.; Mu, Y.; Yu, X.; Dong, X.; Jia, H.; Wu, J.; Zeng, Y. A spatial-temporal charging load forecast and impact analysis method for distribution network using EVs-traffic-distribution model. Proc. CSEE 2017, 37, 5207–5219. [Google Scholar]
- Yanga, J.; Wu, F.; JunYan Lin, Y.; Zhan, X.; Chen, L.; Liao, S.; Xu, J.; Sun, Y. Charging demand analysis framework for electric vehicles considering the bounded rationality behavior of users. Int. J. Electr. Power Energy Syst. 2020, 119, 1–16. [Google Scholar] [CrossRef]
- Yang, J.; Wu, F.; Yan, J.; Lin, Y.; Zhan, X.; Chen, L.; Liao, S.; Xu, J.; Sun, Y. Research on spatiotemporal behavior of electric vehicles considering the users’ bounded rationality. Trans. China Electrotech. Soc. 2020, 35, 1563–1574. [Google Scholar]
- Zhang, Z.; Chen, Z.; Xing, Q.; Ji, Z.; Huang, X. Comprehensive Optimal Scheduling Strategy of Multi-Element Charging Station for Bounded Rational Users. IEEE Access 2021, 9, 9442–9452. [Google Scholar] [CrossRef]
- Kohonen, T. Self-organized formation of topologically correct feature maps. Biol. Cybern. 1982, 43, 59–69. [Google Scholar] [CrossRef]
- Chen, B.C.; Liang, B.; Zhou, Y.B.; Lin, X.Q.; Zhao, Y. An application of SOM neural network in customer classification. Syst. Eng. Theory Pract. 2004, 3, 8–14. [Google Scholar]
- Li, Z.; Wu, J.; Wu, W.; Song, B. Power customers load profile clustering using the SOM neural network. Autom. Electr. Power Syst. 2008, 15, 66–70. [Google Scholar]
- Yinquan, H.; Heping, L.; Amp, L.P. An analysis on the charging characteristics of lithium iron phosphate batteries for electric vehicles. Automot. Eng. 2013, 5, 293–297. [Google Scholar]


| Name of Charging Station | Charging Start Time | Charging End Time | Energy Delivered/kWh |
|---|---|---|---|
| Bus Return Yard Charging Station (Internal), Renmin West Road, ××City | 2018-01-02 08:14:45 | 2018-01-02 08:48:28 | 33.64 |
| Guangling Service Area Charging Station, ××Highway, ××City | 2019-01-01 03:32:08 | 2019-01-01 03:59:59 | 16.52 |
| Charging Station in Parking Area of Zhongwei Building, ××City | 2019-10-08 21:48:26 | 2019-10-09 00:10:49 | 37.03 |
| Rain or Snow | Sunny | Cloudy | ||||
|---|---|---|---|---|---|---|
| Working Day | Non-Working Day | Working Day | Non-Working Day | Working Day | Non-Working Day | |
| BCS | 397.97 | 317.19 | 287.25 | 220.87 | 318.61 | 327.46 |
| HCS | 53.85 | 57.55 | 49.24 | 63.09 | 49.43 | 65.63 |
| UPCS | 503.15 | 420.88 | 424.85 | 390.05 | 438.18 | 433.21 |
Publisher’s Note: MDPI stays neutral with regard to jurisdictional claims in published maps and institutional affiliations. |
© 2021 by the authors. Licensee MDPI, Basel, Switzerland. This article is an open access article distributed under the terms and conditions of the Creative Commons Attribution (CC BY) license (https://creativecommons.org/licenses/by/4.0/).
Share and Cite
Zhang, Z.; Huang, X.; Ding, H.; Ji, Z.; Chen, Z.; Tian, J.; Gao, S. Multi-Dimensional Analysis of Load Characteristics of Electrical Vehicles Based on Power Supply Side Data and Unsupervised Learning Method. World Electr. Veh. J. 2021, 12, 125. https://doi.org/10.3390/wevj12030125
Zhang Z, Huang X, Ding H, Ji Z, Chen Z, Tian J, Gao S. Multi-Dimensional Analysis of Load Characteristics of Electrical Vehicles Based on Power Supply Side Data and Unsupervised Learning Method. World Electric Vehicle Journal. 2021; 12(3):125. https://doi.org/10.3390/wevj12030125
Chicago/Turabian StyleZhang, Ziqi, Xueliang Huang, Hongen Ding, Zhenya Ji, Zhong Chen, Jiang Tian, and Shan Gao. 2021. "Multi-Dimensional Analysis of Load Characteristics of Electrical Vehicles Based on Power Supply Side Data and Unsupervised Learning Method" World Electric Vehicle Journal 12, no. 3: 125. https://doi.org/10.3390/wevj12030125
APA StyleZhang, Z., Huang, X., Ding, H., Ji, Z., Chen, Z., Tian, J., & Gao, S. (2021). Multi-Dimensional Analysis of Load Characteristics of Electrical Vehicles Based on Power Supply Side Data and Unsupervised Learning Method. World Electric Vehicle Journal, 12(3), 125. https://doi.org/10.3390/wevj12030125