Abstract
Seeking to solve problems in the power electric system (PES) related to exacerbated and uncontrolled energy consumption by final consumers such as residences, condominiums, public buildings and industries, electric power companies (EPC) are increasingly seeking new information and communication technologies (ICTs) to transform traditional electric power distribution networks into smart grids (SG). With this implementation, PES will be able to remotely control electric power consumption as well as monitor data generated by smart meters (SM). However, Internet-of-Things (IoT) technologies will enable all this to happen quickly and at low cost, since they are low-cost devices that can be deployed quickly and at scale in these scenarios. With this in mind, this work aimed to study, propose, and implement a hybrid communication infrastructure with LoRaWAN and LoraMesh for the demand-side management as a service (HyDSMaaS) using IoT devices such as long range (LoRa) to provide an advanced metering infrastructure (AMI) capable of performing all these applications as a service offered by EPC to end consumers. Additionally, services such as demand-side management (DSMaaS) can be used in this infrastructure. From the preliminary results it was found that the LoRaWAN network achieved a range of up to 2.35 km distance and the LoRaMESH one of 600 m; thus, the latter is more suitable for scenarios where there is little interference and the SMs are at long distances, while the other is used for scenarios with greater agglomeration of nearby SMs. Considering the hybridized scenario between LoraWAN and LoRaMESH, it can be seen that the implementation possibilities increase, since its range was approximately 3 km considering only one hop, and it can reach 1023 devices present in a mesh network. Thus, it was possible to propose the actual implementation of LoRaWAN and LoRaMESH protocols as well as the hybridization of the two protocols for HyDSMaaS. Additionally, the results obtained are exclusively from Radioenge’s LoRa technology, which can be further improved in the case of using more powerful equipment.
1. Introduction
The electricity distribution network of cities is getting closer and closer to becoming a SG. This due to the advances in terms of standardized, scalable, intelligent, and low-cost communication infrastructures [1,2,3]. With an advanced communication infrastructure to the point of promoting this type of automation throughout the power distribution network, it will be possible to implement various applications to manage and control energy consumption and generation on the end consumer side [4]. That is, instead of doing all the distribution control and monitoring in the electric power concessionaire (EPC), the management will be done in the final consumer’s residence, in order to reduce centralized processing and, mainly, to solve problems that are of importance for the EPC such as network anomalies [5], electric power quality [6], and excessive consumption in peak hours [7], among other problems that are also addressed in this work. In addition, this service enables the consumer to control spending, as well as provide automation and security to the residence, making it an Intelligent Home. These applications are called demand-side management (DSM) and can be offered to consumers as a service, which is called DSM as a service (DSMaaS), where consumers pay for the service used and can choose to cancel the service at any time. It is a technology that is primarily aimed at a long range with low power consumption and a low acquisition cost. In addition, LoRa has a two-level security that makes it a safe option using only the default settings, and it can be further enhanced. However, in this work the hybridization of LoRaWAN and LoRaMESH was implemented and used to provide this DSMaaS, thus naming this architecture as the hybrid communication infrastructure with LoRaWAN and LoraMesh for the demand-side management as a service (HyDSMaaS).
HyDSMaaS represents a very important reason why the utility must overcome the main issues facing the traditional and centralized distribution network, i.e., the growing demand for electricity, the incorporation of distributed energy resources, the maintenance of old infrastructure, and general concerns about energy efficiency and the cost-benefit of the network. In addition, HyDSMaaS will provide a collaborative and scalable environment due to the increasing use of renewable energy resources, which implies a renewable energy system with intelligent resources for the intelligent management of electricity consumption and generation [8,9]. In this context, the concept of HyDSMaaS represents the scalability of the integration of distributed energy resources in the grid and DSM services, allowing the use of home energy management (HEM) and motivating the need for an advanced metering infrastructure (AMI) [10,11,12]. In addition, other technologies are already used in some countries, such as smart meters (SMs) [13,14,15]. The SMs are equipment that will measure the energy consumption of the site as the traditional meters already operate; however, these SMs will additionally communicate directly to the EEC as well as carry out processing at home, monitoring the quality of electricity (QoE) among other services on the edge of the network (in English, edge computing) [16]. In this sense, LoRa technology will be used to propose the communication between IoT devices that will enable HyDSMaaS.
Within the context of SG is the AMI, which is responsible for providing bidirectional communication between the electric power concessionaire (EPC) and households. With this, it is possible that applications can act, either on the EPC side or on the final consumers’ side. Therefore, with an AMI in full operation in an energy distribution system, it is possible that the HyDSMaaS can act in a definitive way. This power management can occur in a simple way, using a communication infrastructure that provides the necessary communication between EPC and households, as well as using IoT devices. With IoT, the range of applications for HyDSMaaS grows, and a study is needed on the main communication technologies to promote a communication infrastructure for AMI. However, it is necessary to have a good study to highlight the main IoT technologies to be used in this scenario, so, in this work, LoRa was studied using the LoRaWAN protocol as well as LoRaMESH and the hybridization of these two technologies.
A HyDSMaaS can be implemented in a real scenario using several options of communication technologies whether wired or wireless [12]. Currently, one of the communication technologies that has been studied is power line communication (PLC), obtained through the transmission line where all the data is transmitted by the same wiring that transmits the electrical energy, whose transformers are bypassed during this operation because they behave like a low-pass filter and which are not suitable for transmitting high frequency data [17]. Additionally, PLC technology presents a high installation cost in cities compared to other communication technology options on the market [18]; so, the utility must upgrade its entire distribution infrastructure by exchanging the current wires for PLC wires [19]. Thus, the wireless sensor network (WSN) of IoT devices becomes an option, but for it to be adopted in a scalable and secure way, it is extremely important to pay attention to the main features of this context, as well as the operating requirements such as scalability, security, and reliability, because this context includes the implementation of an infrastructure that will provide communication between the utility and all households in a city [20,21]. In addition, there are operating requirements such as physical barriers/obstacles such as poles and trees present in the urban environment; neighborhoods and houses present in places further away from cities; buildings and condominiums with large numbers of apartments; public buildings; and commercial and industrial establishments. Therefore, when choosing the technology to be used, it is important to analyze it in a real scenario in order to prove its efficiency and functionality for AMI in the context of HyDSMaaS.
There are several SG architectures modeled in the current state of the art. One of the most referenced was the proposed architecture in [11] where the services of the EPC will act in AMI. However, the focus of this architecture is on management from the EPC side, while the present work focuses on management from the demand side. For HyDSMaaS, some web applications such as the payment monitoring and control system, real-time graphics to monitor energy traffic, and QoE, among others, should be unimplemented so that artificial intelligence (AI) services and other applications can act without the need for information to reach the EPC. For that, an architecture was modeled in this work and presented in the Figure 1, where these applications can be present in the infrastructure as a service to final consumers. Initially, for a LoRa network to act, there must be a network server to be responsible for the exchange of information in a secure and scalable way. The IoT hub will be a web application responsible for routing data to streaming data in real time, and, for this, used several frameworks can be used; the most widely used is The Things Network (TTN), which is a network server capable of collecting the data in the infrastructure and forwarding it in a secure and scalable way to an application server, which in this case can be the Microsoft Power BI [22,23]. The data can then be represented on a dashboard that are interactive, and real-time graphics can be generated and analyzed directly in Power BI. AI algorithms, such as machine learning (ML), can act in this scenario as intelligent systems capable of predicting, indicating, and collaborating in decision making by both the EPC and the end consumer in an automated and intelligent way. Additionally, the consumer and EPC website can be a means of communication and consumption of this information through visual access via the Internet or via mobile applications. This is due to the implementation of the application programming interface (API), which will be responsible for providing communication between the database and external applications such as website and mobile applications, which will give greater flexibility to consumers and reduce implementation costs for the EPC.
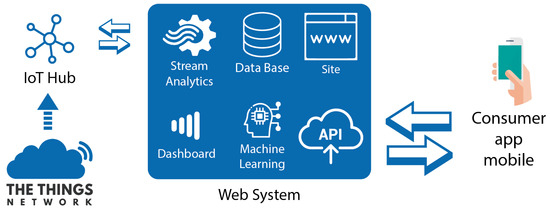
Figure 1.
Smart Grid Application Architecture as a Service.
In this case TTN will be used to work with the LoRaWAN protocol, there may be other network servers to connect to other protocols, as well as a hybrid network server, but this work was limited to studying only the LoRaWAN and LoRaMESH protocols, so TTN was adopted. Besides using only one technology to provide the HyDSMaaS, there are other studies that seek to hybridize the networks, so that if a technology just can not meet these requirements, will be made a hybridization with another technology [24,25], however, the studies are limited to the management on the EPC side. With this in mind, this work has as its main differential in relation to the state of the art, the proposal of a hybrid infrastructure for management on the demand side.
For DSM services to exist, HEM and SM technologies must be present in a scalable and secure way in an AMI [26]. However, the introduction of these technologies to provide HyDSMaaS also presents new operational and technical challenges [27], and the main one is which technology and communication topology to use to satisfy this data exchange between customers and the EPC, or vice versa. And with this, several communication technologies are able to be used in this infrastructure, among them are WiFi (Wireless Fidelity), BLE (Bluetooth Low Energy), IEEE 802.15.4 [28] and ZigBee [28] for indoor environments, i.e., within environments such as homes, buildings, condominiums, businesses and industries. For the outdoor scenario, 5G (Fifth Generation) technologies, LTE (Long Term Evolution), GSM (Global System for Mobile), NB-IoT (Narrow Band in IoT), WiMAX (IEEE 802 standard) [29], PLC (Power Line Communication) [17] and SigFox [30] are available as possible candidates to provide this communication infrastructure, in this case the scenario is of external communication between final consumers through the SM to the EPC. However, in order to have a communication infrastructure using these technologies the investment must be higher, due to the cost of network equipment as well as the final equipment [31]. In addition, each technology has its own way of operating, but none of them offers the long range between concentrators and end devices and scalability related to low cost and energy consumption. Some technologies can cover a large area within the city, however it requires a lot of investment and many devices which also increases the complexity of implementing this infrastructure. Additionally, the hybridization proposed when it comes to the use of different network topologies, is only possible if different technologies are used, such as the use of 5G together with LTE [32] as well as the hybridization of services in the cloud [29], which may make the infrastructure budget even more unfeasible.
This work aims to study, propose, and implement a Hybrid Communication Infrastructure with LoRaWAN and LoraMesh for the Demand Side Management as a Service (HyDSMaaS) for AMI using LoRa modules under the LoRaWAN and LoRaMESH protocol, seeking to provide a bidirectional communication between the electric utility and the final consumers of a city, thus enabling the utility to offer HyDSMaaS to its consumers.
Studies on two-way communication infrastructures for SG in the context of HyDSMaaS have already been conducted in the literature [33,34,35], however, to date the LoRaWAN, LoRaMESH and LoRa hybrid networks have not been analyzed. And this happens, because the technologies that are being used the most such as ZigBee, WiMAX and among others are the networks that have a low range, however they have a large bandwidth, thus allowing the exchange of larger packets [36,37]. In this context, considering that the main measurement data to be used by the EPC are only consumption, voltage and current. With this in mind, the modeling of the packets to be sent by the SMs should be modeled so as to obtain a size that does not affect the sending time or network bandwidth. Therefore, carrying out this modeling is one of the contributions of the present work because it will enhance the results. In addition, the network infrastructure studied and analyzed in this work will demand a lower investment cost compared to the networks studied so far as well as the way it will operate in the proposed context. However, LoRa technology has begun to appear in the market with the objective of offering a long range device, low energy consumption and low cost. In addition, one can use a star topology with the LoRaWAN protocol [38] as well as a mesh network with LoRaMESH [39]. Thus, the proposal of a hybrid network using only LoRa technology with LoRaMESH and LoRaWAN protocols, which may become a more viable technology option for AMI while maintaining features such as low consumption and cost of deployment and maintenance.
An SG is not yet a reality in many countries because investments in communication infrastructure are still limiting [40,41,42]. With this in mind, a LoRa hybrid network besides being adaptable to different scenarios, will maintain the characteristic of a low cost infrastructure as well as long range, 3 to 4 km approximately, operating at approved frequency (915 MHz in Brazil), has a two-level security with encrypted keys and is an affordable technology for telecom companies to manufacture, sell and maintain, since AMI is an infrastructure that will cover cities of large proportions and will be full of modules and gateways [43,44,45,46].
The main contributions of this work are:
- (1)
- LoRaWAN and LoRaMESH analysis for use in HyDSMaaS considering the different types of packages and SF configurations in a real scenario;
- (2)
- Proposal and implementation of a hybrid network using LoRaWAN and LoRaMESH for HyDSMaaS considering the main possible clients and services offered by EPC.
The rest of this work is organized as follows, in Section 2 the literature review is being done presenting the state of the art study on LoRa technology under LoRaWAN and LoRaMESH protocols, in Section 3 the proposed methodology presents the proposal of the work and the implementations in the scenarios chosen for the initial tests, the results are presented and discussed in Section 4 and finally the conclusions and future work are presented in Section 5.
2. Related Works and Overview
The state of the art is organized in order to understand an overview and contextualization about Smart Grid (SG), while the Advanced Measurement Infrastructure (AMI) is being detailed and studied as presented in the state of the art, EPC’s main clients such as Smart Home, Building Condominium and Industry 4.0 are also analyzed. Additionally, an overview is made of the main DSM services and how they will be executed in this communication infrastructure using IoT technologies.
2.1. Overview and Contextualization about Smart Grid (SG)
Electric energy has been characterized as a source of energy highly capable of being used in the most different ways and for the most different purposes. Electric power systems, or Power Electric Systems (PES), have the main function of supplying electric power to the different consumers, wherever they are and at the moment they wish. The PES, possess great plants, hundreds or thousands of kilometers of transmission lines, besides an infinity of substations and control centers. The complexity and high costs involved in managing all of this equipment have been responsible for significant efforts, the objectives of which are to find safe and efficient techniques for operating and expanding electrical power systems, in order to ensure a balance between the supply and demand of electrical energy. It is important to stress that the traditional PES works in a unidirectional way, that is, the electrical energy is transported by the transmission and distribution system to the consumers in a single direction.
With the increase in the demand for electrical energy, several problems in the functioning of the traditional PES become explicit, perceptible in the fragilities of electrical energy distribution at peak times, in voltage oscillations and in the interruption of its supply [47]. Soon, contemporary society, because of its high level of dependence on electricity, began to demand an PES that was as reliable and safe as possible. In addition, the restructuring of the electricity sector with privatizations and deregulations significantly changed the environment in which power companies operate, bringing new and important challenges for the planning and operation of PESs.
Faced with this reality and the technological advances that have occurred, a new paradigm known as SG has emerged, which according to the authors in [48], represents a great change in the electricity sector. The SG is idealized to perfect the generation, transmission, distribution and consumption of electric energy, as presented in the Figure 2, where besides the transmission and distribution of electric energy, there is a bidirectional communication between the EPC and the homes, companies and buildings, which are the final consumers. In addition, power generation becomes clean and renewable, through wind power plants and photovoltaic power generation sites. In addition, homes will have intelligent appliances and energy monitoring and control systems, may have renewable generation that can be used for their own consumption, independent car loading or redistribution in the grid, being present in the context of microgrids [49].
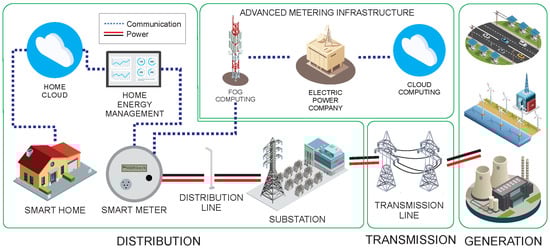
Figure 2.
Advanced Metering Infrastructure Architecture.
The objectives of SG are quite broad, among them are: detect, analyze and notify consumers and network administrators about possible failures such as interruption of electricity supply [50]; resist physical and cyber attacks [51]; know the profile of energy consumption of consumers [52]; Provide quality electricity consistent with the needs of consumers (residential, industrial and commercial) [53] insert renewable sources of electricity generation [54] and support the inclusion of a variety of services such as Demand Response (DR) [55]. Important to note that with the SGs, the consumer has the possibility of producing its own electricity (through photovoltaic panels, for example) and send to the grid the energy that was not consumed over a time horizon, enabling a two-way mode of operation between the consumer and the utility [56]. However, the use of renewable energy sources implies new challenges to ensure the balance between the supply and demand of electricity [57].
The SG can only be implemented in the current scenario if it has a standardized and approved communication infrastructure, so that the SM [58] can communicate with all services and especially with the EPC. And this is very close to happen, because studies already point to the standardization of this infrastructure through an AMI [59], which in turn uses crucial components to organize all devices and services involved in the distribution of electricity throughout the city PES.
2.2. Advanced Metering Infrastructure (AMI)
As already mentioned, for a SG to exist, it is important to have a standardized two-way communication infrastructure between the EEC and final consumers such as homes, buildings, businesses and industries. For this, an AMI has been developed and studied, as presented in [60]. An AMI is responsible for standardizing the communication infrastructure as well as the infrastructure of services provided by the EPC to end consumers [11]. That is, it is responsible for organizing and standardizing how the technologies involved will communicate as well as where the services will be executed. A standardized AMI, can result in a standardized model for all cities to implement in PES, as well as companies and universities can develop solutions and implementations of new technologies and services for DSM in the context of SG [61,62,63,64].
In the Figure 2, is the implementation of an AMI in a context of SG. It is possible to observe, mainly, that in addition to the distribution of electricity to final consumers, the EPC has a two-way communication with them. With this, some technologies arise to propose new implementations either of technology as well as services. Among these technologies are the SM, responsible for receiving energy and distribution to all household appliances, in addition, it will be responsible for communicating with the EPC through a communication infrastructure used bidirectional [13]. In short, the SM is the most important component for the SG. Then there will be antennas for collecting and aggregating information, these antennas are part of the communication infrastructure to be implemented, and may be a gateway or just a router [65]. Inside the house, has the Home Energy Management (HEM), this will be an optional item for end consumers, however, will be of great importance because it will be responsible for managing and controlling appliances and enabling home automation in an intelligent way and integrated with web systems and mobile applications, this on account of services in the Home Cloud (HC) [66,67,68].
Within the context of AMI, are the end customers, and among them the largest number of consumers are households. The residential consumers are present in the SH scenarios that are intelligent homes that are located in rural and urban areas of cities, in addition to SH, there are the condominiums of homes which in turn is a scenario where are located a quantity that can be reduced or extensive of homes or buildings present in an infrastructure deployed and centralized only for them. This means that a small energy substation is implanted for this set of residences, which makes the control and management of a certain quantity of houses that have a more similar consumption profile less complex. In addition, PES is composed of public buildings such as hospitals and universities, commercial points and industries.
2.3. Clients: Smart Home, Building Condominium and Industry 4.0
EPC’s main clients include houses, condominiums, public buildings, 4.0 hospitals and industries. In this scenario, there are some works that are seeking to perform DSM services to help manage the energy consumption of these clients and to make them individual and more intelligent. In the SH scenario, several technologies are being developed and studied to monitor and control consumption and power generation in the home, as well as applications to provide security and even sophisticated automation, where the consumer has total control of the house in a mobile application [69].
Besides the technologies present in a broader scenario of SG, there will be other technologies within the environments present in this infrastructure. In this case, the Smart Homes (SH) are at the forefront of novelties and studies being made for this purpose [69,70,71,72]. In the SH technologies will operate with the generation of photovoltaic energy, which in microgrid scenarios, will be one of the most present items in SH together with wind energy [73,74]. Voltage inversion of the energy generators and conversion of this energy to HW and will be distributed energy of the EPC is conducted via city poles and connect directly to the MW which is responsible for the distribution of this energy into the house and monitoring the generation of energy that will be returned to the PES [58]. Inside the house several communication technologies can act, normally are used the network IEEE 802.11 (WiFi) [75,76] to connect via internet the appliances with the home cloud and the mobile application [77]. The HEM is also present, connecting to the appliances directly or via router (HEM to SH). Equipment like Smart Sensors and Smart Plugs will be responsible for collecting data from sensors, and control (on/off) actuators as household appliances [78]. Finally, the houses will also be composed of autonomous car chargers because with the advance of this technology, in the future each SH will be able to charge these cars, as well as use their energy in cases of power loss [79].
House condominiums can be composed of a small or large amount of SHs with basically the same physical and average structure of consumers per residence. This allows the energy distribution to be done in a more uniform and controlled way compared to a neighborhood of houses with different physical structures. Furthermore, all condominiums have a centralized distribution center, which allows one to have an MS to measure the energy consumption of the condominium as a whole, and of each independent MS [80]. Another important point to note is that a gateway or data aggregator may be responsible for collecting data from the entire condominium and passing directly to the EPC or another gateway. In a home condominium, several applications can be implemented to help the energy management of the houses as well as the condominium itself, such as automating the outside lights, swimming pool, common areas and parking lots. In addition, the distribution of energy generated in each home can allow the implementation of a Smart Microgrid, where homes are integrated within the condominium and can make an intelligent and interactive consumption between consumers [81].
Just like in home condominiums, building condominiums have a small or large set of apartments, but in a uniform manner and with a very similar consumption profile. The difference is that in building condominiums, there are other factors that do not appear so often in home condominiums, such as penthouses, elevators, pumps, communication interference between apartments of different floors or buildings, basements and other peculiarities. In this case, some studies point out the implementation of communication technologies that allow avoiding this interference and promoting communication within and between buildings and floors [82]. In addition, consumption can be collected in centralized locations, which allows a standardization of the way of collecting and sending information to each apartment.
Following the same problem faced in building condominiums, public buildings such as hospitals, shopping malls, universities and among other buildings also have several peculiarities present in buildings. And it’s worth mentioning that these are also energy users, so they will also be present in AMI. For universities to be present in AMI, it is necessary to have a data aggregator to collect the data of all the blocks and sectors scattered throughout the geographical area of the university [83]. Applications have been studied and developed to promote automation and communication between various sensors and actuators within the university, and this is important to be considered because they are of extreme importance to intelligently manage energy consumption in these locations. The same occurs in public hospitals, several machines that consume a lot of electrical energy are increasingly present in hospitals, and this must be considered and managed intelligently in the context of AMI [84].
At AMI we cannot forget the industries, which in the context of industry 4.0, Information and Communication Technologies (ICTs) are constantly growing and becoming more and more a reality in this scenario [85]. With this in mind, the EPC should propose its integration in this infrastructure, in order to promote from the management of consumption, from generation to the provision of DSM services [86]. Several technologies are studied and developed for the automation and control of robots in industries such ascite. Automation of energy consumption itself are applications that are being studied to increasingly improve the efficiency of industries in order to reduce energy costs.
However, this work seeks to glimpse the largest number of customers present in the EPC network in the urban scenario that both consume electrical energy, as can be generators of renewable energy and managers of their own energy consumption without this management is on the side of the EPC.
2.4. Overview of DSM Services
Demand Side Energy Management (DSM) consists of a range of services that the EPC can offer its consumers as a way to assist them in the control and management of consumption and generation of energy without this processing being done in the EPC but in the very scenario where the consumer is [87]. In this context, the Figure 3, presents an architecture of services that the EPC must obtain at least to be able to make the management of consumption and distribution of electricity for the entire EPS. Thinking about this, a Distributed Operation Center (DOC) will have to be implemented along all the AMI to distribute applications that even in so centralized in the EPC. Among the main management services are Consumer information systems (CIS and Billing), Disturbance management system (DMS), Geographic information system (GIS), Metering data management system (MDMS) and Interruption management system (OMS). These services will be processed in the DOC in order to reduce all the flow in the Operation Center (OC) of the EPC based on the data coming from AMI by regions, after, sent only information already computed and summarized to the OC in order to manage only in a fast and intelligent way, having the OC where all the information should be stored for the EEC.
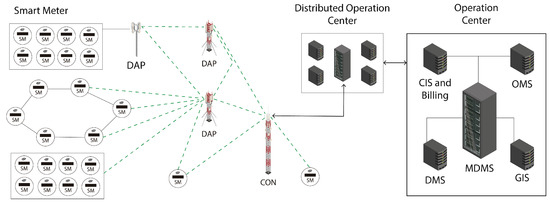
Figure 3.
General communication topology of AMI.
On the demand side are the SMs, which connect to a data concentrator to communicate with this operation center. In addition, it is the SM who will pass on all the energy pricing information during the day, consumption plans and strategies oriented by the EPC, and among other information coming from the operation center. With all this, the SM will be able to do some kind of processing or pass this information to the HEM that will do this processing and will be able to make the decision on how to proceed with the management of consumption and power generation on the consumer side. For this, several services have already been studied and developed to promote the DSM, among them are the services presented in the Table 1.

Table 1.
DSM services proposed by the current state of the art.
As can be seen, there are already several services being studied and implemented by the current state of the art, however, there is still a lack of integration and application in a communication infrastructure capable of providing these services, being able to maintain a stable, scalable and secure bidirectional communication, because services like these, need this type of pre-requisites in order to operate effectively. Moreover, it is worth highlighting the importance of IoT for this process, because if there are no devices to exchange messages, control actuators, read sensors and be able to perform some kind of processing, none of this will be possible to be implemented in a real scenario. Therefore, IoT must be inserted into these proposed scenarios mainly before these services can be offered.
2.5. Internet of Things (IoT)
IoT is an area of computing that involves from the development of microcontrolled technologies that can turn on and off actuators and read sensor values [97]. In addition, it is a technology that promotes communication between these devices, enabling them to exchange messages between them and servers that will store, process and interact with web systems and mobile applications [98]. However, IoT is a candidate technology to promote efficient and low cost communication between devices within homes with managers, as well as machines with robots, products with boxes, houses between homes, buildings between buildings and with the EPC [99].
Thus, equipping the SMs with IoT technologies capable of communicating by different types of technologies, protocols and communication topologies, the essential is to have security, privacy and data flow is fast and effective, i.e., without congestion in the communication infrastructure due to the amount of devices in this network [100]. Thus, it is extremely important to study and compare the main IoT technologies whether wired or wireless that are available for use, and fit the DSM scenario.
Is the PLC, as previously mentioned is a communication technology that allows sending data through the same power cables [101]. The PLC has some advantages, among them is that if implemented in the city, will be built a broad new communication infrastructure promoting the opportunity for physical disconnection according to other networks and lower operating and maintenance costs. However, the PLC has some disadvantages such as higher signal losses and channel interference because the infrastructure is via cable and in the same physical structure passes data and energy, disruptive effects caused by appliances and other electromagnetic interference, difficult to transmit higher bit rates and complex routing. In addition, it is worth mentioning the high cost to build this new physical infrastructure throughout the city. Another means of communication that can be used to provide this communication infrastructure for SGs, is the wired communication via fiber optic cable [102]. Optical fibers are flexible filaments made of fiberglass or plastic materials. This cable is thinner than a hair but can be several kilometers long. This communication is usually used for several applications, with data transmission being one of the most common. Among its main advantages are long distance communications, ultra high bandwidth, and robustness against electromagnetic and radio interference.
Besides wired technologies, other IoT technologies that have been gaining a lot of space to provide this communication infrastructure for SG are the Wireless Sensor Network (WSN) technologies. Among the WSN technologies, the Wireless Personal Area Network (WPAN) stands out, which are technologies that can reach up to 200 m of distance, but were made for private networks, that is, to be implemented inside SHs, industries, hospitals, buildings, condominiums and among other scenarios, but not in the outdoor scenario, that is, in AMI in fact. For this technology, ZigBee has been studied for the development of various devices capable of performing some of the main DSM services such as home automation, sensor reading and actuator control [103,104]. Still in the scenario of short range and high data rate, is the Wireless Fidelity (WiFi), one of the technologies that is already present in virtually every location in the city, whether inside homes, condominiums, shopping and buildings, even public spaces such as squares, tourist attractions and avenues [105]. Like WPAN technologies, WiFi is also widely used for low-range applications to promote DSM services through low-range infrastructure, high energy costs and high data rates. However, WPAN is a low bandwidth technology and has limitations in bandwidth and packet size for building large networks, while WiFi has limitations such as high interference spectrum, too high power consumption of any SG device and simple QoS support.
When it comes to wireless technologies, there are a number of technologies that are able to communicate with a long distance between the nodes. Among these technologies are Worldwide Interoperability for Microwave Access (WiMax). This technology is implemented under the IEEE 802.16 standard, being a wireless interface for metropolitan networks that has as objective, to provide a communication infrastructure that has compatibility and interoperability between any equipment in the IEEE 802.16 standard in order to provide connectivity for home, business and hotspot use. WiMAX is similar to Wi-Fi, but it adds more recent features, aiming at a better communication performance, allowing higher speeds. WiMAX has been studied to provide communication between SG applications due to its performance and long range, which makes it a great candidate for technology that will be used in an outdoor and indoor environment [106]. WiMAX supports large groups of simultaneous users and also has more sophisticated distances and QoS than Wi-Fi. However, network management is very complex, the cost of implementation and equipment is quite high and has as a requirement to have the licensed spectrum [107].
Still in this context, the Global System for Mobile (GSM) emerged to offer the communication service for cell phones and devices that need connectivity via the Internet or other means of communication such as Short Message Service (SMS) or connection, thus GSM was responsible for standardization of mobile telephony. And because it is a technology that supports millions of devices, has low power consumption of the final equipment, has high flexibility, is suitable for cases of different use and still has open industrial standards, becomes a very interesting option to be used in the scenario of SG [108,109]. However, GSM has some limitations that should be considered when planning which technology to use for this communication infrastructure, such as high prices to use the services providers of the network and increasing costs from the licensed spectrum to the price to be paid for the use of the band in each device. Making a very simple survey for comparison purposes, a GSM node that is used for tracking cars costs around U$ 9.00 per month for using the infrastructure to send the geolocation data from the car to a server in the cloud [110]. That is, thinking about the residential scenario, it will be unfeasible to use GSM for all SPs and SSs spread around the house. But perhaps it is a viable option to promote communication between SMs and EEC [111]. Moreover, it is worth noting the diversity of technologies that are in this content as Third Generation (3G)/Fourth Generation (4G)/Long Term Evolution (LTE) [112] and especially the emerging technology that is currently the Fifth Generation (5G) [113,114].
Finally, among the technologies that stand out in the current state of the art for the SG context are the (LPWAN) with the LoRaWAN technology added with LoRaMESH, which are technologies that have a high range with low energy consumption, in addition, they are low-cost technologies only that have as limitation the low data band rate [115,116]. Within this context are two technologies that are SigFox and LoRa [117,118]. Both are homologated technologies, low cost, long range and low power consumption, and are used in the context of point to point, star through a gateway or mesh. These technologies have two major advantages besides cost, they are technologies that can reach long distances and yet remain reliable and with high security standards. The disadvantages are that these equipments operate with 7 different ranges of Spread Factory (SF) and depending on their configuration or distance to the gateway, can generate high latencies in communication. Moreover, this is one of the factors that leads to low power consumption. Another important point to note is its low bandwidth that makes communication restricted in terms of package size, but this has already been studied in order to standardize ways of sending and receiving packages divided [119].
However, it is possible to see that there are several options with very peculiar and specific characteristics for applications in different scenarios. However, not all technologies are able to supply the full range of services that HyDSMaaS will provide to its customers. Therefore, some solutions such as network hybridization may be viable outputs for this problem. However, some technologies, even with hybridization, become feasible to be implemented in a scalable, secure and low cost way. Therefore, this work intends to study and analyze if LPWAN technologies can be a good option to solve this problem, acting as a strictly LoRaWAN or LoRaMESH network when possible, and hybridizing if it is not possible to use them individually. And finally, in order to highlight the operational power of LPWAN technologies, this work was limited to studying LoRa technology under the LoRaWAN and LoRaMESH protocols, making a study using individualized networks, and compared to the hybridization scenario with the two technologies.
However, it is possible to notice that there are several options of wired and wireless communication technology, long and short range that can be used for the proposed scenario, however, each technology has its pros and cons. Considering these factors, LP-WAN technologies are offered to the market with the proposal of achieving a long reach while keeping the low cost, and this is extremely important when it comes to the implementation of a large and scalable infrastructure that needs to have a low cost but is a flexible, secure and efficient technology, and it is this technology that will be studied, implemented and analyzed in the SG scenario in order to know if it will really be a good option of communication technology for AMI.
3. Hybrid Network Implementation Using LoRaWAN and LoRaMESH
LoRa is an LP-WAN technology of low cost modulation, low energy consumption and that has as main proposal the long range [43]. Like any technology, the LoRa also has disadvantages, after all, to achieve long range without consuming much energy and that is low cost, some factor should be affected and this is the bandwidth. Thus, LoRa is not a technology like WiFi that enables streaming, lives, donwloads and extensive package uploads. However, LoRa will be widely used for applications that don’t need large bandwidth, but that need scalability, low cost and especially long reach. Among the IoT technologies presented, this work proposes the implementation of a two-way communication infrastructure using LoRa technology through LoRaWAN, LoRaMESH and hybrid between the two protocols.
3.1. LoRa Modulation
A proprietary spread-spectrum modulation technique derived from existing Chirp Spread Spectrum (CSS) technology, LoRa offers a conflict of choice between sensitivity and data rate, while operating on a fixed bandwidth channel of 125 KHz or 500 KHz (for uplink channels), and 500 KHz (for downlink channels). In addition, LoRa uses orthogonal propagation factors, this allows the network to preserve the battery life of the connected end nodes by making adaptive optimizations of the power levels and data rates of an individual end node. For example, an end device located near a gateway must transmit data with a low spread factor (Spreading Factor—SF), since very little connection budget is required. However, an end device located several kilometers from a gateway will need to transmit with a much higher SF. Theoretical transmission rate values as a function of the SF [120], where SF7 is 21,875 bits/s, SF8 is 12,500, SF9 is 7031, SF10 is 3906, SF11 is 2148, SF12 and SF13 is 1172. LoRa is purely a physical layer (PHY), or bit, implementation, as defined by the OSI Seven Layer Network Model. Instead of cabling, air is used as a means to transport LoRa radio waves from an RF transmitter in an IoT device to an RF receiver in a gateway in the case of the LoRaWAN protocol or coordinator in the LoRaMESH protocol, and vice versa.
3.2. Packaging Structure
For the present work, two types of packages adapted to LoRa technology were used based on their SF specifications, in this case using packages of 96 bytes for SF 7, 8 and 9 and dividing this package into two smaller ones of 51 bytes for SF 10, 11 and 12 based on the modeling done in [121]. In this case, the package represented by the Figure 4, has all the pertinent information about the consumption of the home, where data such as the id of the MS, id of the location of the MS, the frequency, current, voltage, power factor, active and reactive power, power consumption and possible network failures are passed as information to the EEC.

Figure 4.
SMs Package with 63 bytes size.
In the Figure 5, the same package is divided in the middle, and a variable called the package id will be responsible for joining the divided packages in the application server. It is worth mentioning that the packages present information that can be used by several HyDSMaaS applications.
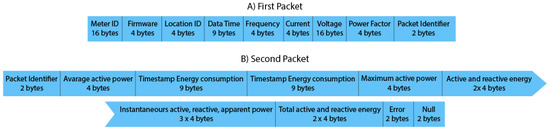
Figure 5.
Packages of the SMs with size of 31 bytes.
When the package needs to be very small, a third scenario was modeled which is to divide the package into three smaller ones, which is what occurs in the Figure 6. Where the packet is divided into three, sending first the A, then the B, and finally the C.
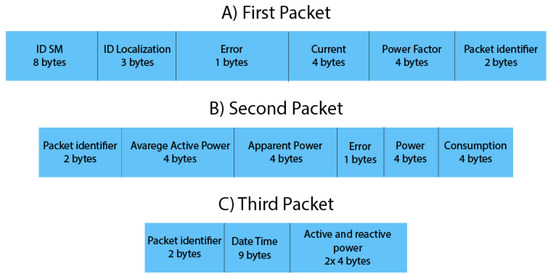
Figure 6.
Packages of the SMs with size of 21 bytes.
In order for the AMI to feed this database, data packets were implemented that the network server sends to the application server, using JSON (JavaScript Object Notation) packets, which are standard formats for REST (Representational State Transfer) communication between two online applications via TCP/IP. In this case the web server transforms the data into a JSON and sends it to an Application Programming Interface (API) implemented in the Microsoft Power BI service, which is an online service from Microsoft for creating APIs that will be used to feed the Power BI database. This API receives the JSON, extracts the data and registers it in the Power BI database, from there this data will be used for reporting and data visualization for the final customers and for EPC.
All the JSON packages modeled and implemented to feed the application database are represented in Figure 7, Figure 8 and Figure 9, each package was made to feed each of the six application tables and as already explained, these JSON packages are small, light and practical for REST communications between two online services, thus avoiding a delay or increase in communication time between servers. Furthermore, security is implemented in the API itself and in the REST communication protocol used.
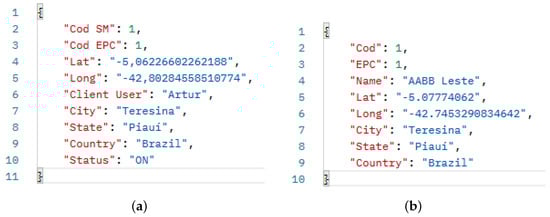
Figure 7.
All JSON packages modeled to feed the application database. (a) JSON from the left SM table. (b) JSON from the front SM table.
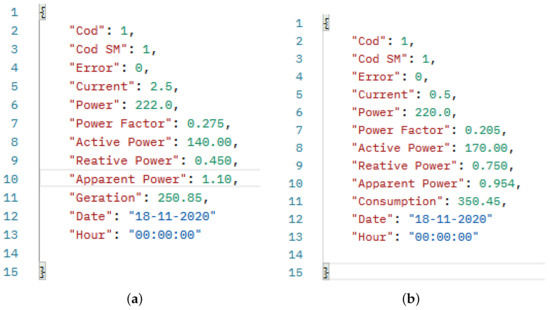
Figure 8.
All JSON packages modeled to feed the application database. (a) JSON of the front generation record table. (b) JSON of the left consumption record table.
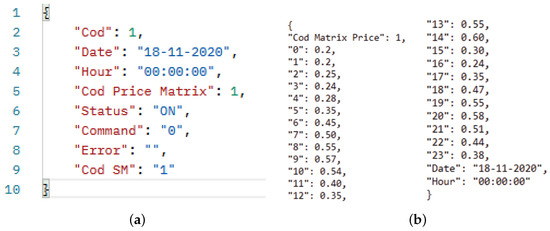
Figure 9.
All JSON packages modeled to feed the application database. (a) JSON of the right EPC record table. (b) JSON of the right price matrix table.
Each table has a code for data organization level. The SM registration table is related to almost all tables except the price matrix. It relates to the EPC registration table which is related to the price matrix table, because of this multilevel relationship it is possible for example to calculate the energy consumption by multiplying with the hourly energy price value, all this filtering by EPC. In addition, some other calculations can be performed in the application to obtain an analysis of this data, however this work was limited to only perform the implementation of the entire infrastructure of AMI until the final application of the consumers and EPC. Therefore, the application is simple but allows for great possible future implementations that can be performed.
3.3. Frequency Bands
LoRa can operate with the frequencies 915 MHz, 868 MHz and 433 MHz, however the frequency 868 MHz and 433 MHz is a band that operates in a regulated manner only in Europe and North America. In this case, in Brazil the frequency that can operate in a regulated way is 915 MHz [38].
3.4. LoRaMESH
Among the main network topologies for IoT is the MESH, where devices can connect directly with the central devices, in this case the coordinators (from the Coordinator) or passing through several routers until reaching the coordinator, this topology can be seen in the Figure 10.
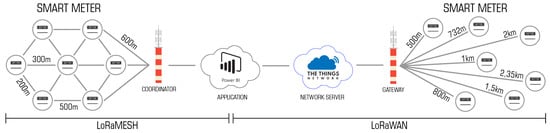
Figure 10.
LoRaMESH and LoRaWAN Topologies.
In this topology, the devices are able to reach great distances because of the jumps between the end-nodes until they reach the coordinator, however they lose in distance between one end-node and another. In this way, the point to point of this topology does not have great alncance, but make the mesh yes. In [122], the authors study this topology using LoRa technology through the LoRaMESH protocol. In this work the authors provide a review of LoRaMESH multihop proposals, additionally perform a comparative analysis and classification as well as discuss open questions and future directions for the use of this technology in various scenarios.
3.5. LoRaWAN
LoRaWAN networks are being represented in a star topology where gateways relay messages between end devices and a central network server [123], as also shown in the Figure 10. The gateways are connected to the network server via standard IP communication while the end devices use LoRa or FSK communication of a single frequency for one or many gateways [124]. All communications are usually bi-directional, although uplink communication from an end device to the network server is expected to be the predominant traffic.
Communication between end devices and gateways is spread over different frequency channels and data rates. Data rate selection is a compromise between communication interval and message duration, communications with different data rates do not interfere with each other. LoRa data ranges from 0.3 kbps to 50 kbps. Thus, it is possible to configure the LoRaWAN module considering the Bandwidth (BW) ranging from 125, 250 or 500 KHz, Data Rate (DR) ranging from 0 to 4 and Spreading Factor (SF) ranging from 7 to 12.
3.6. LoRaWAN Class
In LoRaWAN three classes of operation are defined, of which only Class A must be implemented in all devices compatible with LoRaWAN [125]. Because of this policy, there is a basic set of features that are present in all LoRaWAN final devices, keeping both the architectural complexity and the production cost as low as possible.
Class A devices operate on a two-way communication between the end device and the gateway. Uplink messages (from the device to the server) can be sent at any time (randomly). The device then opens two reception windows at specified times (1 s and 2 s) after an uplink transmission. If the server does not respond in either of these reception windows, the next opportunity will be after the next uplink transmission from the device. With this, the server can respond in either the first reception window, or the second reception window, but should not use both windows. In Class B, the devices extend Class A by adding programmed reception windows for downlink messages from the server. Using synchronized timers transmitted by the gateway, this way the devices periodically open reception windows. Class C devices extend Class A by keeping reception windows open unless they are transmitting. This allows for low-latency communication, but often consumes more power than Class A devices.
3.7. Topologies for the HyDSMaaS Context
For the HyDSMaaS context there are different WSN topologies that can be used with IoT LoRa technology as presented in Figure 11. Among these topologies are the point-to-point network using LoRa, where end devices can communicate directly with each other via a long-range, low-cost, direct communication. In this case, it is not used for the scenario of this work, because the amount of SM is too large, and a point-to-point network would not be the most viable option due to the amount of packets and the communication time between the nodes. Another network possibility is the star network through the LoRaWAN protocol where a gateway plays the role of data collector and communicates directly with the end devices. In this case it is more scalable and can be used in the scenario proposed in this work, the limitation is that, as the amount of SMs grows, more gateways will be needed to cover the entire city. A third network possibility is through mesh with LoRaWAN technology under the LoRaMESH protocol. In this case, all SMs are able to connect to all SMs close to it, thus enabling a relay of the packets until they reach the application’s IoT HUB. It can also be used in the proposed scenario, however, for scenarios with nearby houses and little distance. In order to propose a scalable infrastructure capable of covering an entire city and counting the SMs present in it. This work presents a proposal for hybridizing LoRaWAN with LoRaMESH networks. With this architecture, it will be possible to have a star LoRaWAN network with gateways spread throughout the city to connect more distant SM sets, and use the LoRaMESH network to connect large sets of nearby SMs, such as condominiums and buildings. And with this, also enabling direct communication from the application to the device via point-to-point.
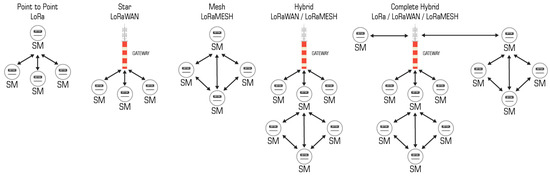
Figure 11.
Network topologies to be used in this work adapted from the work [126].
And another hybrid scenario is the use of LoRa, LoRaMESH or LoRaWAN network depending on particular specifications such as distance from the home to the EEC, distribution of homes, interference and distance from the homes to the gateways. For most of the cases already studied, hybridization of communication networks occur most often between star and mesh topologies [127]. Therefore, for the HyDSMaaS context, using only one network topology may overload the communication infrastructure, so new implementations should be made to propose a more robust hybridized topology to be able to supply the entire AMI scenario. In Brazil, the National Telecommunications Agency (Anatel) is responsible for regulating communication technologies of this size. It is worth mentioning that for LoRa technologies the adopted frequency is 915 MHz. furthermore, it is worth mentioning that all the equipment as final devices responsible for collecting the data and send to the gateways and gateways that are the devices responsible for collecting the data and send to the network server, used in this work are duly homologated and ready for commercialization in case they are implemented and trained for it. This way, making this work even closer to reality and opening opportunities for possible commercialization.
3.8. Implementation of the Hybrid Network Using LoRaWAN and LoRaMESH
This work studies and proposes the implementation of a strictly LoRaWAN or LoRaMESH and hybrid network with the two protocols for an AMI in the HyDSMaaS scenario using LoRa technology. For that, the implementation was divided in four steps, being (1) LoRaWAN and LoRaMESH protocols implementation, (2) Benchtop protocols performance analysis (testbed), (3) Data Aggregator Point (DAP) device hybridization implementation and finally, (4) real scenario test. The implementation of the protocols takes place through the use of LoRa technologies mentioned above. It is worth noting that each protocol consists of a distinct architecture and devices even with the same technology, the LoRa.
3.9. Implementation of LoRaMESH
In this feeling the Figure 12 presents the implementation of the LoRa MESH network on the bench. This protocol consists of the implementation of two devices (1) End-node or final device and (2) Coordinator. The end-node is the device that will be implemented in the SMs, he who plays the role of forwarding the information to the coordinator or receive it. And the coodinator plays the role of gateway, i.e., he who will communicate directly with the server of the EPC or the DAP itself, but this will be seen later still in this work. In short, the coordinator is responsible for receiving and sending the messages to all the end-nodes present in his network, whether at his reach or not. In this case, if an end-node does not reach the coordinator but reaches any other end-node in the network it can send this message to the device that will act as a router, forwarding this message to the coordinator, this will be due to the implementation of the MESH network in the devices.

Figure 12.
LoRaMESH implementation components.
The LoRaMESH module, Figure 13 is a device homolated by ANATEL. This device joins LoRa modulation, long range and low power consumption, to the so-called Mesh network, where each radio works not only as a signal receiver, but also as a router, being therefore a highly scalable network. Using the ModBus protocol, messages can easily be transmitted transparently between different points on the network, and the company already markets these modules with the RPL (IPv6 Routing Protocol for Low Power and Lossy Networks) factory-based routing protocol implemented [128]. Additionally, the coordinator will be connected to an application server where he will be sending to the application server either locally or in the cloud to store and display interactive dashboards using Power BI for example, in order to make it more accessible to the end consumer and the management of the EPC. At the implementation level, LoRaMESH final devices need to have a shield to connect the devices to the Arduino hadware and free software prototyping board and thus promote serial communication between the two [129]. The other specifications of this device are described in the Table 2. This application was used with Arduino to validate the network proposal, for the industry it is enough to change the microcontroller used, because the technology is already certified and homologated for the industry.
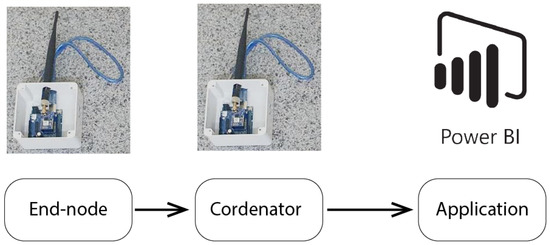
Figure 13.
LoRaMESH Architecture.
Table 2.
LoRa Radioenge end-node specifications.
This equipment has manufacturer specifications that report the possibilities of communications between two devices with more than 500 m of distance. In addition, this equipment allows communication via mesh topology, that is, the devices are capable of routing the communication between the coordinator and another end-node that has no connectivity directly with the coordinator. In this case, the end-node sends to the router, making a communication jump, and the router forwards to the coordinator, making the second communication jump. Using this device, a coordinator has the capacity to support up to 1023 devices on the network, and the amount of jumps is according to the number of nodes on the network. This process is done automatically, so this work didn’t focus on the analysis and implementation of the routing protocol for LoRaMESH networks in this scenario.
3.10. Implementation of LoRaWAN
In the LoRaWAN scenario, as shown in the Figure 14, the topology used is the star. This way, all the end-nodes in the network will be directly connected to the LoRaWAN gateway. In this case the two main components are (1) LoRaWAN end-node and (2) LoRaWAN gateway. The end-node has the same role as the end-node in the mesh, however it is not a router for the other end-nodes that are on the network and do not reach the gateway. The gateway plays the same role as the mesh coordinator, because it is responsible for sending and receiving packets to the SMs and will be connected directly to the EPC server.
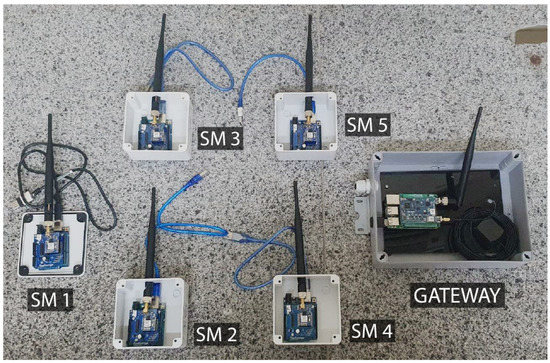
Figure 14.
Components used for LoRaWAN implementation.
The LoRaWAN topology requires that all end-nodes have connectivity directly to the LoRaWAN gateway, that is, if they do not have this connectivity, the device will be outside the coverage area of a given gateway and will look for another gateway that is closer to its coverage area. This way, the end-node will look for other coverage areas, if it finds any other gateway this end-node will connect to it and the communication will be performed again. Thus, it can be said that an end-node should not necessarily be fixed to a given gateway. It only needs to contact a gateway that is configured to send my data to the network server.
3.11. End-Node LoRaWAN
The LoRaWAN EndDevice Module is the device that will be connected directly to the SMs playing the role of sending and receiving data directly from the LoRaWAN gateway. In the Figure 15, it is possible to see the node implemented for this work, where the LoRaWAN device is connected to arduino by means of a board that is pierced on top of Arduino called the shield. It is worth mentioning that this module is homologated by ANATEL and its technical specifications are described in the Table 2 [128].
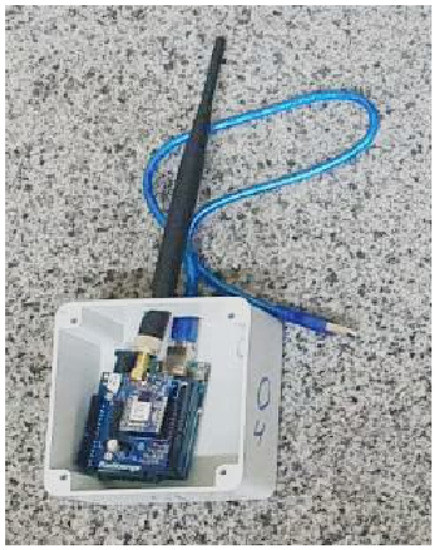
Figure 15.
End-node LoRaWAN.
The LoRaWAN end-node device as shown in the Figure 15, is a device capable of connecting to the gateway with distances of approximately 2.5 km in the urban area and up to 3 to 4 km in open field without barriers and with target. This way, the device will be ready to act on the sent SM and receiving data from the gateway.
3.12. Gateway LoRaWAN
The LoRaWAN Gateway, shown in the Figure 16 allows long range communication, being able to use LoRa/CSS modulation with the ability to receive packets on up to eight channels simultaneously. In order to be used definitively, this module has buses for integration with Raspberry Pi, which has the processing and on-board computing of all the logistics of the LoRaWAN gateway as well as the communication via internet with TTN. Like the final device, the LoRaWAN gateway couples on top of the Raspberry Pi without the need for a shield. Additionally, this gateway has an antenna and GPS interface for geolocation also approved by ANATEL.
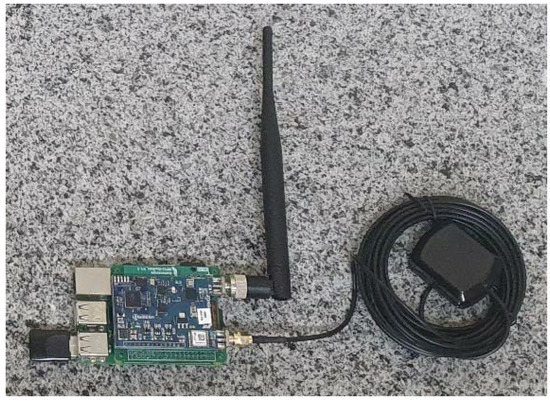
Figure 16.
Gateway LoRaWAN.
This device is capable of connecting to end-nodes in urban areas around 3 km away and in open country up to 5 km. Network tracking features were implemented to monitor traffic and a broker Message Queue Telemetry Transport (MQTT) [130] to allow communication with IoT devices and a python code MQTT client via network. All LoRaWAN gateway specifications are presented in the Table 2 as described in its datasheet.
For this work, the LoRaWAN architecture implements consite in a star topology network where the End-node is the communication device of the SM of the homes and the Gateway is the device responsible for collecting all this data sent by all the SMs within its coverage area and forwarding it to a network server that in this case was used TTN [123]. From TTN, the data will be forwarded to the application server which in this case is the Power BI, a tool for data visualization and analysis via dashboard and interactive reports [131]. In the Figure 17 this architecture is being represented in more detail.
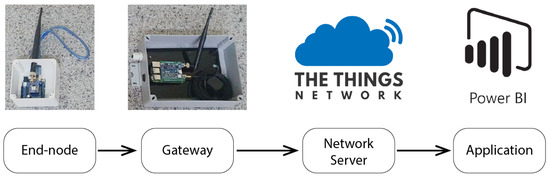
Figure 17.
LoRaWAN Architecture proposed and implemented in this work.
3.13. Smart Meter Manufacturing
The SM was manufactured using Arduino, a 100 A current sensor, a 220 V (Volts) voltage sensor, a 19 × 2 LCD for data display, and the LoRa is a shield that sits on top of Arduino. The power supply is a hi-link, which receives the 220 V from the house electrical network and converts to 5v direct current which is the power that the SM will need to operate. In Figure 18 is the proposed SM electrical circuit. It is capable of obtaining all the voltage, current, power factor, activated power, reactive, apparent power, consumption data, network quality and among other parameters that can be programmable for Arduino to collect. This SM in total, costs approximately U$96,82.

Figure 18.
Manufacture of the Smart Meter electric circuit.
3.14. Bench Performance Analysis (Testbed)
Initially, the two technologies were tested on bench or testbed. In this case, the technologies were submitted to the process of sending and receiving packages from their respective responsible parties (coordinator for the LoRaMESH endnode and Gateway for the LoRaWAN). In the tests, the endnodes were kept at a distance of 2 m for their responsible and all communication was monitored and analyzed in order to understand the operation of the metrics analyzed. In this case, the RSSI was considered the indicator responsible for presenting the received signal strength, SNR (Signal to Noise Ratio) metric responsible for measuring the relationship between signal and noise, Time on Air (ToA), this measure will show the time the package stays in the air until it reaches the other device and Delay which is the time between the last message sent and the next. In addition, some parameters have been configured to analyze their relationship with the measures analyzed as the SF, in LoRa technology we have the SF 7 to 12 and the payload size (the Portuguese package size) that in this work were considered the following package sizes for the two message sending scenarios (A) From the EPC to the SMs and (B) From the SMs to the EPC, in the tabletop Table 3 are those described in more detail.
Table 3.
Package size specifications.
As can be seen in the Table 3, this work presents 3 different packet size configurations for each different SF group be it 7, 8 or 9 we have the packets of 63 bytes, considering that it will be necessary to send only one packet that will already contain all the information that the EEC needs. In case of reducing the size of this packet, you have the option to use the 31 byte size packet, however, the packet will be split in half, thus making the SM have to send two packets. The same occurs in cases where there is an even larger division, which will be 21 bytes divided into 3 packages. In the case of SF bigger as 10, 11 and 12 the packets must be reduced, because the greater the distance and the SF that the endnode is present, the smaller the packet must be, otherwise the packet will not reach its destination or will have a very large loss rate due to the bandwidth being too low.
Finally, we also analyzed packages that the EPC will send to the SMs with varying sizes of 60 bytes for packages with price information for the next 24 h as well as suggestions for plans to use the electricity to be followed, 40 bytes when for packages with prices for the next 12 h and suggestions for plans and finally 20 bytes for packages with only prices from 1 h to 6 h ahead and suggestions for plans. In this case, only one package will be sent at a time from the EPC to the end-nodes. Finally, the fixed end-node configurations consist of 4/5 coding rate (CR) and 125 MHz bandwidth (BW).
3.15. LoRaWAN Module Behavior in Testbed
Based on the implementations explained above, the tests were performed in order to observe and understand how these metrics behave based on the technologies to be used in this work as well as the difference between the proposed implementations, since the idea is to hybridize two networks with different topologies but using the same technology.
3.15.1. Behavior of the Network with the Packets Sent by SMs to the EPC
As can be seen in the Figure 19, the graphs show a difference between the SF settings based on the size of the package to be sent. Considering the RSSI (a), the larger the SF the better the RSSI, but as the packet size increases this will directly affect the RSSI. With the SNR (b), the measure that the SF increases the SNR will be smaller, because of the sensitivity with possible barriers such as trees, buildings and homes, and the increase in the size of the packet also affects the SNR. What is important to highlight are the ToA (c) and delay (d) measures, as these are extremely important for network scalability. In this sense, as the SF is increased the ToA grows approximately twice as long, while the delay the difference follows around 1 to 2 s. In the cases of smaller SFs the ToA is very similar for all packet sizes however, the delay grows as the SF as well as the packet size increases. For these metrics the difference is approximately 260 ms for the worst and best case of ToA and 8 s for the delay.
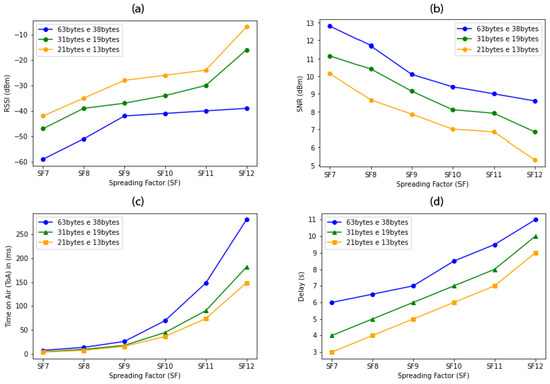
Figure 19.
LoRaWAN behavior (a) RSSI, (b) SNR, (c) ToA and (d) Delay of packets sent by SMs.
3.15.2. Behavior of the Network with the Packets Sent by the EPC
When packets are sent by the EEC, it means that the packet leaves the gateway towards the SMs. In this scenario, it is possible to see in the Figure 20 the results obtained for the LoRaWAN protocol performance analysis considering the sending of the three types of packets that the EEC will send to the SMs.
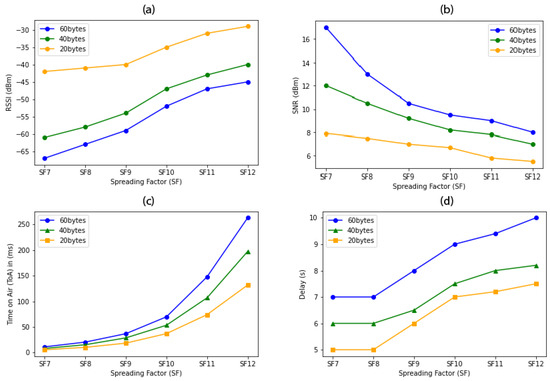
Figure 20.
LoRaWAN behavior (a) RSSI, (b) SNR, (c) ToA and (d) Delay of packets sent by EEC.
As can be seen, the difference between RSSI (a) and SNR (b) in relation to the SF configuration and the package size is approximately −20 dBm for RSSI, and 3 dBm for SF 7 to 9 and 1 dBm for the larger SF for SNR. However, the RSSI is better for the smaller package, with the larger size it has a difference of approximately −20 dBm. On the SNR the difference is well reduced for all packet sizes in the SF7 to 11 nodes, with the SF12 the difference increases to almost 10 dBm. As far as ToA (c) is concerned, all packet sizes have a similar ToA for the smaller SF configurations, however, as the SF increases between SF 10 and 12, the difference in ToA reaches 25 ms, 100 ms and 150 ms respectively. The delay (d) behaves more evenly between all the SFs having a difference of approximately 1 s between the two smallest packets, and 2 s between the two largest packets. This way it is possible to notice that for the smaller SFs any type of size can be sent that the ToA won’t be affected, but in the case of delay, the bigger the SF configuration the bigger the delay between the packets will be.
3.16. Behavior of LoRa MESH Modules in Testbed
To carry out the LoRaMESH network study, only the packages sent between the EEC and the SM were analyzed in a bidirectional way. In the case of the mesh, the ToA and delay metrics were not possible to be collected yet in this work due to implementation challenges for the collection of this information.
Metrics like ToA and delay were not possible to be collected yet in this work. In the Figure 21 are the results obtained from the testbed using the LoRaMESH network in order to understand how the RSSI and SNR are behaving in relation to the different SF configurations.
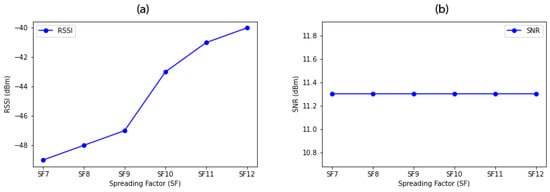
Figure 21.
Result of LoRaMESH scenario (a) RSSI and (b) SNR for packages sent by SMs or EPC.
As seen in the Figure 21a it is noticeable that for the distance of 2 m in this testbed, the RSSI was better for the SF 7 to 9 has a worse RSSI than the larger SFs. In the case of SNR Figure 21b, all the nodes obtained the same value, considering that no matter the SF configuration, what will really affect the most will be the extent to which the nodes really move away from the coordinator as well as the barriers available in the real scenario.
3.17. Implementing Hybridization through DAP Device
Based on the understanding of how the main communication metrics behave in the infrastructure using LoRaWAN and LoRaMESH topologies, this work has as main motivation to hybridize these two topologies in order to propose a scalable, long range and low cost communication infrastructure, making it feasible to be implemented in a real scenario. With this in mind, the implementation of Data Aggregator Point (DAP, from the Portuguese Data Aggregator Point) emerged, which is a hybrid module that contains two channels, being one LoRaWAN and the other LoRaMESH. This module will be able to hybridize the network, so that the two can interact with each other. This device is being shown in the Figure 22.
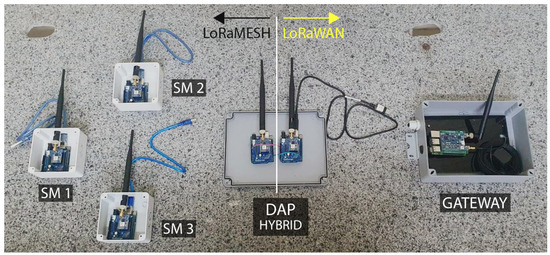
Figure 22.
Hybrid implementation.
In this case, DAP will be a coordinator for the LoRaMESH network and an end-node for the LoRaWAN network, making the communication between the two technologies and hybridizing it, thus having a LoRaMESH topology on the left and a LoRaWAN topology on the right. In the Figure 23, it is possible to visualize how the architecture of this network will be.
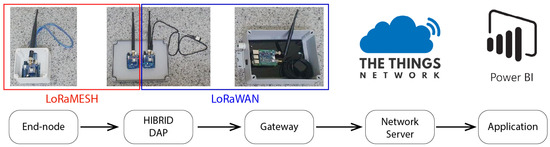
Figure 23.
DAP implementation proposal for AMI hybridization.
The end-node present in the SM will send the package via MESH until it reaches the coordinator present in the DAP, the DAP will make a queue of packets to be sent to the LoRaWAN end-node also present in the DAP. As soon as the packets are sent to the LoRaWAN end-node via serial communication, they will be forwarded to the LoRaWAN gateway, which will send them to the EPC TTN network server, which will then view the data in the Power BI application.
3.18. Tests in the Real Scenario
For the real scenario, the LoRaWAN and LoRaMESH protocols will be submitted to the same analysis only in different positions in relation to the gateway in the case of LoRaWAN and at different distances in both cases. For the LoRaMESH network the nodes were distributed by distance and can be seen in more detail in the Table 4.
Table 4.
LoRaMESH Real Scenario Point Specifications.
To better present the distribution of endodes within the chosen scenario in the city of Teresina, Piauí, Brazil, whose geographic coodenadas are −5.063688 longitude and −42.803953 latitude representing the neighborhood of consumers of the EEC service, as shown in the Figure 24.
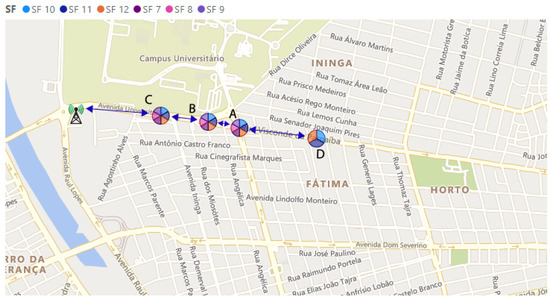
Figure 24.
Endode positions in the real scenario in LoRaMESH implementation.
The distribution is not in alphabetical order but in order of distance from the point in question to the next nearest point. This distribution was made for two reasons (1) The distribution was made within the LoRaWAN scenario as well as following the distance limitations of the LoRaMESH technology studied and implemented in this work in the urban scenario, which is approximately 600 m of distance between the nodes. During the tests, the nodes made the jumps according to the distribution assigned in order to seek analysis in the real scenario.
The LoRaWAN scenario is being presented in more detail in the Figure 25. Where the points were distributed by distances, being distributed in all the maximum ends that the end-node was able to reach from the gateway within the urban scenario. In addition, the nodes were organized in three strategic but very specific points, being (A) Left: avenue with several houses and commercial points, (B) Front: point well obstructed and full of houses and buildings, and (C) Left: region with fewer obstacles such as houses, some commercial points, bridges and land.

Figure 25.
Endode positions in the actual scenario in LoRaWAN implementation.
To better present the points, the Table 5 presents its distribution and specific characteristics. As previously mentioned, each position refers to a specific urban setting where different types of barriers are considered such as buildings, tourist points, bridges and commercial points. In this sense the SMs that positioned themselves to the left of the gateway achieved a greater reach however only with the larger SFs as well. For the other sides, the barriers are present with greater intensity directly affording the maximum range between the nodes and the gateway, reaching only 2 km.
Table 5.
LoRaMESH Real Scenario Point Specifications.
Besides the maximum distances reached by each topology, it is possible to observe that the urban scenario has many interferences and barriers that affect the dictatorship and accessibility of connectivity between the nodes, that is, in some cases the MESH is able to make the communication because of the jumps and in other cases the LoRaWAN achieves a greater distance because of the capacity of the technology to have a greater reach and not be interfered because of these barriers. That is, in the next chapter all this analysis will be raised and discussed in order to analyze how RSSI and SNR are affected for the different scenarios in order to make a survey of the two technologies and reach a hybrid model proposed by this work.
4. Results and Discussion
As described in the previous section, the results obtained in the real scenario will be discussed in this chapter. In the tests, the main metrics used were RSSI and SNR, considering the different points, sides and SF. Furthermore, the tests were performed considering the LoRaWAN and LoRaMESH protocols at different geographical positions within the city. At each position, 10 data were recorded for each SF configuration (SF7–SF12), different distances (between 200 m to 2.35 km) and sides (left, right and front). In total, 780 packets were recorded in the test with LoRaWAN and 210 packets with LoRaMESH. The following tests were performed for LoRaWAN and LoRaMESH protocols in the proposed scenario.
- Received Signal Strength Indication (RSSI)
- Signal-to-Noise Ratio (SNR)
- LoRaWAN or LoRaMESH restricted network reach
- LoRaWAN or LoRaMESH restricted network capacity
4.1. Indication of Received Signal Strength (RSSI) vs. Signal-to-Noise Ratio (SNR)
About the presented graphs (boxplot) Q1 is the first and Q2 is the second quartile, which represents the upper and lower range of values. ICmin and ICmax are the confidence intervals, in python, they are calculated automatically. Points below ICmin or above ICmax are the outliers, i.e., error values that are far outside the confidence interval of the data. The bar that is approximately in the middle of the mean area is the median of the mean values obtained. This analysis was performed as shown in Figure 26.
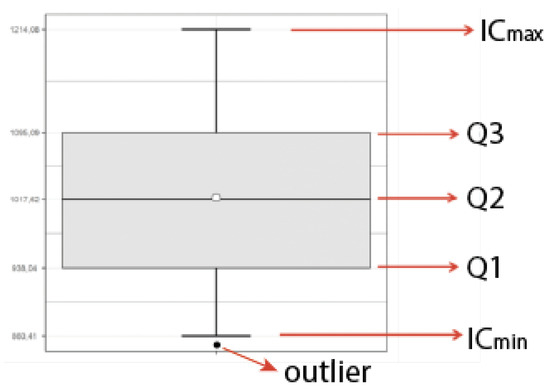
Figure 26.
Boxplot chart.
4.1.1. Network Performance for Different SF Configurations
The averages of RSSI and SNR per SF configuration in the LoRaWAN network are shown in the Figure 27.
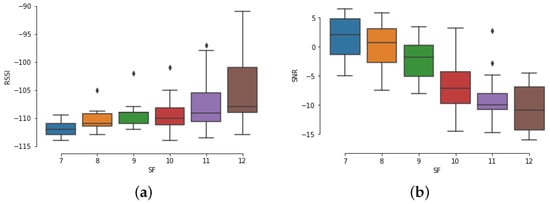
Figure 27.
Average RSSI and SNR per SF LoRaWAN. (a) RSSI. (b) SNR.
The closer the RSSI is to zero, the better the signal intensity, in this sense it is possible to observe in the Figure 27a that the larger SF configurations (10 to 12) have an average signal intensity between −110 and −103 dBm having a mm better signal intensity compared to the smaller SF configurations (7 to 9) having an average between −112 and −110 dBm. The difference between the settings is not significant, however, when it comes to signal in relation to noise, even with a better RSSI, the larger SFs are more affected by interference in relation to barriers as can be seen in the Figure 27b. The smaller SFs have an average between 3 and −5 dBm of SNR, while the larger configurations have from −5 to −15, which means that considering −7 an ideal SNR, the larger configurations are significantly affected by the barriers and this is due to the greater distances that these configurations allow to achieve precisely because of the RSSI they operate.
In the LoRaMESH scenario, Figure 28 the SF configurations have the same performance as the LoRaWAN in terms of both RSSI and SNR, however the difference between the SFs is less significant compared. In terms of RSSI, Figure 27a, the LoRaMESH operates with an average between −98 and −118 dBm, when it comes to SNR the variation is between 12.6 and 11.1 dBm. In this case, the variation between the SF settings show operating equally for both LoRaWAN and LoRaMESH, having better RSSI values and worse SNR values, Figure 27b, for larger SFs and the opposite for smaller SFs, however, it is worth noting that the LoRa technology that operates with LoRaMESH has a better average RSSI compared to the LoRaWAN, reaching differences of up to 20 dBm better, when the SNR is considered, the LoRaMESH is able to operate with a higher value, even if it is using larger SF. That is, it is possible to conclude that the LoRaMESH has less signal interference in relation to possible noises, but this only happens because the technology itself works with smaller distances like 600 m maximum. LoRaWAN operates with distances of up to 2.35 km and this is a relevant factor for these results.
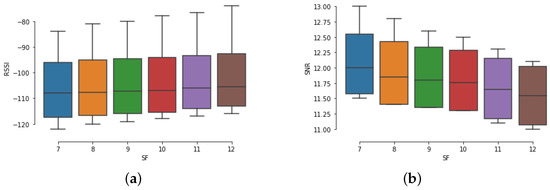
Figure 28.
Average RSSI and SNR per SF LoRaMESH. (a) RSSI. (b) SNR.
4.1.2. Network Performance Relative to the Geographical Side of SMs Relative to DAP
The same analysis done previously was also performed for the different geographical sides of the SMs in relation to the DAP or Gateway that will receive their packages. In the Figure 29 the average of RSSI and SNR per side are represented. At first, it is important to point out that each side has different geographic specifications, and on the front side it is a scenario full of houses and business buildings of at most 2 to 3 floors, on the right side it is a cleaner scenario full only of houses and land, and on the left side it is a main avenue full of several houses and the presence of some posts, pharmacies and commercial buildings.
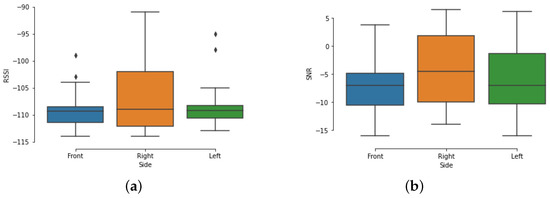
Figure 29.
Average RSSI and SNR per side LoRaWAN. (a) RSSI. (b) SNR.
In this context, it is possible to observe in the Figure 29a that RSSI is better for the right side, because even with longer distances the devices do not have so many barriers ahead, however the difference for the other sides is only 5 dBm, which also does not make this difference significant. In the Figure 29b it is possible to observe that the presence of barriers interferes with the SNR, thus making the front and left sides have an average SNR of −3 to −11 dBm while on the right side the SNR is around 5 dBm and this is due to the terrain and pressure of fewer barriers.
After understanding how the RSSI and SNR are being effected for each side, these metrics were analyzed considering each SF configuration and the results are presented in the Figure 30. Where the Figure 30a presents the RSSI for each geographic side in each SF configuration, showing that the smaller SFs have a difference of only 4 dBm regardless of which side the SM has. In larger configurations, the difference can reach almost 15 dBm depending on the side, i.e., depending on how the distribution of the SMs is in relation to the existing barriers in the middle of the communication infrastructure to the gateway.
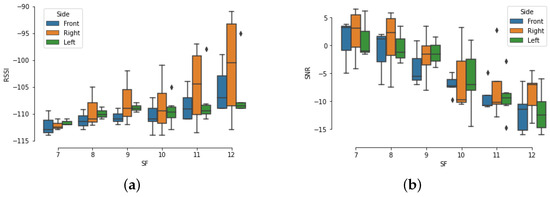
Figure 30.
Average RSSI and SNR per SF LoRaWAN. (a) RSSI. (b) SNR.
In the Figure 30b the SNR clearly presents how larger configured SFs are significantly affected when scenarios are full of barriers. In this case, the larger SFs were SNRed between −5 and −15, while the smaller SFs range from 5 to almost −5, showing that for smaller configurations the side will not be a relevant factor, but rather the barriers present in the middle. In this case, the LoRaMESH was not analyzed by side, limiting this analysis only to the LoRaWAN Gateway, since the LoRaMESH operates on a regular basis regardless of the position it is in, which is important to know to what extent the barriers interfere with this protocol and this analysis was done next.
4.2. LoRaWAN or LoRaMESH Restricted Network Reach
The scope of the protocols restricted LoRaWAN and restricted LoRaMESH were analyzed within the same context of the sides presented above, where the nodes were distributed to each side, and the maximum range per SF was obtained and analyzed in order to present the performance of the two protocols and then obtain a broader result with the hybrid infrastructure. In the Figure 31 are the results of the average RSSI and SNR per point with LoRaWAN protocol. Where in the Figure 31a is the representation of RSSI per point, and it is clear to see that as the distance increases, RSSI loses quality. The difference is almost 15 dBm from the SM which is 500 m from the gateway, to the SM which is 2.35 km away. And this small difference represents how much this technology is able to communicate with small and long distances without having a significant interference in the RSSI. The same occurs in the SNR represented in the Figure 31b, where the difference is as much as 10 dBm from the nearest GS in comparison with the GS further away from the gateway.
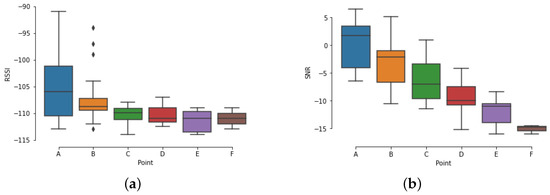
Figure 31.
Average RSSI and SNR per LoRaWAN point. (a) RSSI. (b) SNR.
However, communication was only possible up to a distance of 2.35 km considering all sides and barriers present. In this case, the left side was the one that got the best range, this because the scenery is an avenue because of this target, facilitated the effective communication of the SM with the gateway, already the other sides got only a distance of 2 km due to the barriers present in the scenery. It is worth mentioning that the smaller SFs reached only the distances A to C for the sides (left and front) and A to D for the right side, the other points only communicated with the larger SFs. In the LoRaMESH scenario the RSSI and SNR results by side were also collected and are being presented in the Figure 32.
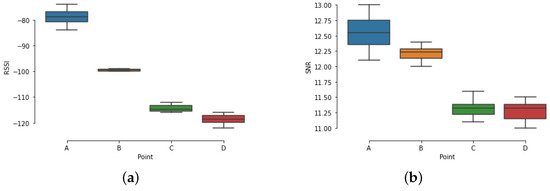
Figure 32.
Average RSSI and SNR per LoRaMESH point. (a) RSSI. (b) SNR.
Where the Figure 32a presents the RSSI for the distances of points A with 200 and B with 300 m that had a difference of almost 20 dBm, from point A to point C with 500 m, the difference was almost 15 dBm, and from point A to point D with 600 m the difference rises to almost 40 dBm. This means that as the distance increases, the RSSI will be reduced significantly until it reaches a level of no longer working. That is, these devices are made for long distance communication, but with little interference. In the city, these scenarios are represented by condominiums of houses and buildings, where the distances are long but the interference is smaller compared to the scenarios of cities, industries and public buildings. To conclude, the Figure 32b presents the SNR for each point, and like the RSSI, the SNR will be affected as the distance increases, having differences of almost 5 dBm per point, however, as already discussed, this technology is more resistant to the interference of the sinla in relation to the noise and barriers present in the scenario, for this protocol the main factor is distance between the devices. With this, the maximum range achieved was 600 m in the proposed scenario regardless of whether it is for the coordinator or for the other device that performs the mesh communication.
To analyze the range of SMs, the results of RSSI and SNR were also studied by SF configuration for each point determined in the LoRaWAN protocol. The Figure 33 presents this results in more detail.
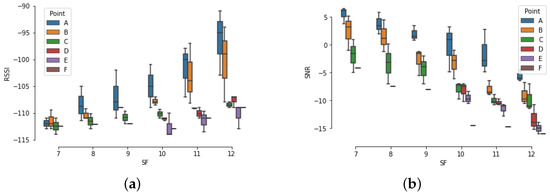
Figure 33.
Average RSSI and SNR per point and SF LoRaWAN. (a) RSSI. (b) SNR.
In the Figure 33a it is possible to observe that for each geographic point the SF works differently, being better for the points closest to the gateway, and this was expected. However, the difference between expensive SF is worth mentioning, because as the distance to the gateway is increased, the RSSI is affected with a value of approximately 3 dBm, being considered a minor difference. Of course, for larger distances it is better to use the larger SF due to its range and RSSI that will be much larger, however, for smaller distances the smaller SF settings will always be better options because of the SNR, which are much better and the difference is significant, since the greater the SF the greater its interference in relation to the SNR, as can be seen in the Figure 33b, and can reach a difference of up to 10 dBm between the SF. In the LoRaMESH scenario, the results of RSSI and SNR are presented in the Figure 34.
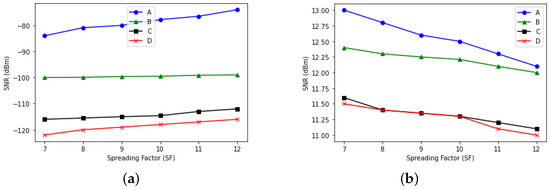
Figure 34.
Average RSSI and SNR per point and SF LoRaMESH. (a) RSSI. (b) SNR.
The RSSI was analyzed in the LoRaMESH protocol for each SF configuration in all four analyzed points, and the results are being represented in the Figure 34a, where it is possible to observe that the closer the node is, the better the RSSI, mainly by SF configuration. The difference of point A pro B is approximately 15 dBm, pro C is 30 dBm and 35 dBm for point D. The results behave as in LoRaWAN, however, the SNR is better for all points and configurations compared to LoRaWAN. It is noticeable that as the distance increases, the SNR will be affected because of the noise, allowing us to conclude that for small distances the smaller SFs are less affected and the RSSI is very close to the smaller configurations, when for larger distances the larger SFs have better RSSI and the SNR has a difference of only 0.5 dBm compared to the smaller SFs, making these the best SF configuration options for each distance, as can be seen in the Figure 34b.
Finally, the RSSI and SNR were analyzed by point, by side and by SF configuration as shown in the Figure 35. Where, the Figure 35a,b represent the devices present on the left side, the Figure 35c,d represent the SMs present on the front side of the gateway and the Figure 35e,f represent the SMs on the left side of the gateway.
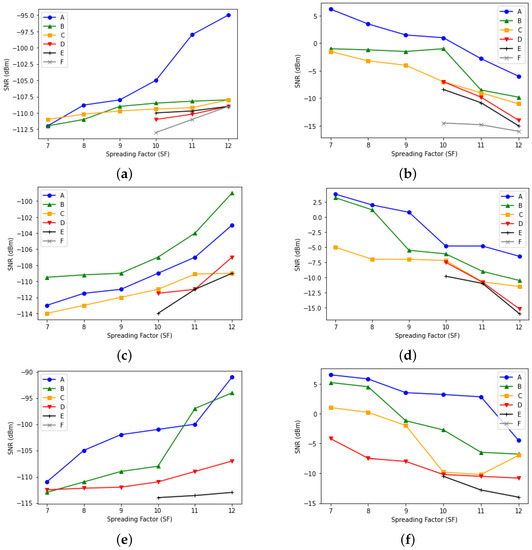
Figure 35.
Average RSSI and SNR per point and SF LoRaMESH. (a) SNR left side. (b) SNR left side. (c) SNR front side. (d) SNR front side. (e) SNR right side. (f) SNR right side.
In the figure, it can be observed that the communication on the left side behaves in the same way analyzed in the testbed, that is, as expected. For this side the RSSI varied between −95 and −112.5 dBm and the SRN at 6 and −15 dBm. For the devices in front of the gateway, the RSSI ranged from −100 to −114 dBm while the SNR ranged from 3 to −15 dBm. And for the right side the RSSI ranged from −90 to −114 dBm and the SNR at 6 and −15 dBm. Based on these results, it can be seen that the right side got the best results due to the presence of several open fields and land, as well as the existence of few buildings, the left side was 5 dBm worse than the right side, this because of the commercial buildings while the worst case went forward, due to the presence of several condominiums of buildings and businesses the inference was much higher with a difference of 10 dBm for the best case in terms of RSSI and 3 dBm for the SNR.
4.3. LoRaWAN or LoRaMESH Restricted Network Capacity
In order to find out the capacity of nodes that a gateway or coordinator will be able to support was used a formulation proposed by [121] to calculate theoretically the capacity of the LoRaWAN protocol proposed by this work. It is worth noting that the LoRaMESH network has a factory limitation which is the ability to connect to 1023 nodes in a mesh network.
In theory, a LoRaWAN network with class A configuration opens two communication windows, one downlink with a time of 1 second and the other of 2 s after the completion of the uplink [132]. Based on this, it is possible to calculate the capacity of the LoRaWAN network based on ToA between SMs and EPC. Considering the results obtained, for SF 7 to 9 the ToA was a maximum of 30 ms and for SF 10 to 12 a maximum of 260 ms round trip. With this, first the Daily Packet Quantity (DPQ) will be calculated based on the Equation (1), where the time is the period that a device will operate and ToA is the time that a packet sent by the device will take to reach the gateway, both in seconds. Therefore, considering that for smaller SFs the ToA obtained and the conversion from 1 h to seconds be presented for 60 m ∗ 60 s, in 1 hour of operation we have the following Equation (2),
or 120,000 package opportunities for the smaller SFs and, the following Equation (3),
or 13,840 package opportunities for larger SFs. This makes the daily capacity 2,880,000 packages for the smaller SFs and 332,160 packages for the larger SFs. Now to calculate the amount of nodes per gateway during a day considering that it is only one channel, the following calculation will be performed.
Based on the specifications of the Equation (4), the Table 6 presents a detail of each variable to be used. Considering that EPC will send on average up to 5 packets per day, and SMs will send up to 26 packets per day, being 24 packets with consumption data per hour and 2 booking packets for cases in which EPC will request some immediate return from the SM in question, in this case EPC will request up to two calls per SM per day which is mostly something specific and difficult to happen. Regarding the gateway used in this work, it has a hardware with 8 communication channels, being able to receive or send to up to 8 devices at the same time, thus multiplying the DPQ by 8. This way, we have the following equations.
Table 6.
Variable specifications.
For SF 7 to 9:
For SF 10 to 12:
From the Equations (5) and (6) 5,907,692 SMs can be connected to the gateway with only smaller SFs configurations, and 329,687 SMs with only larger SFs. At this moment the NP is not yet being calculated considering smaller and larger SMs in the same network as well as the calculation for the hybrid network, however these formulations will be made for the final version of the dissertation. It is worth mentioning that these are just numbers to be considered as base, there are still different variations such as package size, bandwidth configurations and among other factors that vary depending on their geographical position. From the results above, it can be concluded that LoRaWAN network capacity depends on several parameters such as number of gateway channels, SF configuration, bandwidth, number of packages required per day and per destination (EPC and SM) and the package size.
4.4. Final Application for EPC and Final Consumers
After the implementation of AMI using the proposed architecture and infrastructure, a business intelligence (BI) report was implemented using Microsoft Power BI to handle and visualize the data. The data was collected from two SMs for BI analysis. The energy price was based on the hourly energy price implemented in portugal, because in Brazil the pricing of energy consumption is done by flag. It is worth pointing out that for security reasons, each consumer will have his own personalized view, and will only be able to view the SMs registered in his register. For EPC, the view is more complete and robust, being able to have access to all the data from all its consumers. In Figure 36 the consumer’s BI view is presented, where it is possible to see a graph of energy consumption in real, current, voltage, and other consumption data, as well as energy generation data. Additionally, date filters are added so that users can see their historical data. In case the consumer has more than one SM or power generator, all will be presented in this BI, and the consumer will have the option to see all this data per SM or consolidated.
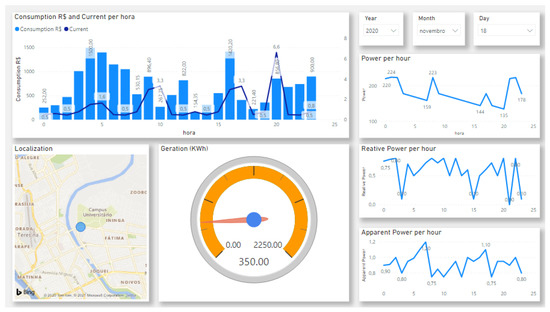
Figure 36.
Visualization of the final consumer’s energy consumption and generation data.
In Figure 37 the EPC BI is presented, in it you can see a more macro view of all energy consumption, energy price per hour, supplied energy data for consumers as well as filters by consumer, by city and by state. Additionally, EPC has a more detailed view of the data, and the map can be used as a filter so that one can click on the SM represented on the map and all the data will be filtered for it.
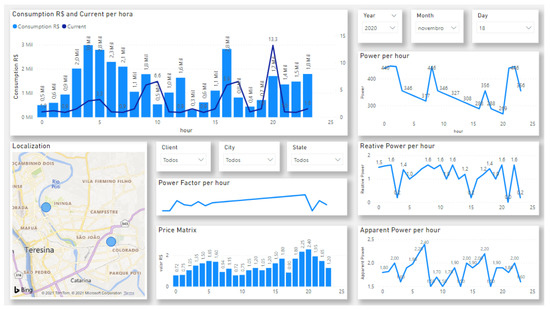
Figure 37.
Visualization of data from all consumers in the network to the EPC.
However, the BI visualization brings the product closer to the reality expected by EPC as well as it is a great vision for the consumer that until now does not have any control or visualization of their consumption and energy generation data. With AMI up and running and the BI report being constantly updated, both EPC and the consumers will have all the management of their energy consumption in their hands, and this will be of great value to the consumer, who will use energy more conscientiously, and to EPC, which will have consumers that are more aware of both their consumption and the value of energy.
4.5. Discussion about Strictly LoRaWAN, LoRaMESH or Hybrid Networks
As seen in the results obtained, the LoRaWAN protocol obtained better distances and greater range, however it was more affected as the distance increases and obstacles become more and more important variables for the effectiveness of communication or not. While in the LoRaMESH protocol implemented by Radioenge, it obtained a shorter distance, but was able to maintain communication significantly affecting the efficiency of communication. Thus, LoRaWAN becomes a better option to be used in cases where gateways will be spread throughout the city to promote coverage for SMs with LoRaWAN modules as well as hybrid DAPs that will play the role of connecting to a mesh network present in certain places. Meanwhile the LoRaWAN protocol becomes more suitable to promote a more controlled infrastructure in terms of distances between consumers, such as condominiums, public buildings and industries, as well as sets of houses that are clustered in quantity but in a specific region. However, this protocol will not be possible to use, with the configurations and results obtained, without the presence of LoRaWAN, in this case, hybridizing the network, unlike LoRaWAN.
In the case of the hybrid network, the main contribution is in the implementation of the DAP, because it will mediate between the mesh network and the LoRaWAN network. Furthermore, the results of a hybrid network are directly linked to the results of each network strictly, that is, if a network composed of LoRaMESH is operating efficiently and with connectivity capable of promoting communication, when hybridizing this network, the devices will operate in the same way, since the only difference is that the coordinator will no longer be alone, but with the final LoRaWAN device. In this case, the hybrid network has limitations, and the main ones are related to Radioende’s LoRaMESH protocol, such as not having access to the routing algorithm, distance limitations, as well as this causes more complexity for any extra implementation that has to change something in the main source code. Another important factor about the hybrid network is the implementation of the communication processing between the LoRaMESH coordinator and the LoRaWAN end device, even though it is a serial communication, via cables, the implementation of the packet queue, as well as the processing and temporary storage of this large amount of data, In this study this problem did not arise because the tests were performed with only five SMs, but it is worth analyzing the DAP with a larger amount and verify if it can really operate efficiently, or if it will not support such a large amount of processing and information flow.
However, the hybrid network allows AMI scalability, a wider coverage range as well as other advantages such as the possibility of using two different topologies to deploy in a real scenario, and this is a relevant contribution, since there are different scenarios and environments that possibly a strictly LoRaWAN or LoRaMESH network will not be able to reach efficiently.
4.6. Distribution of DSM Services by Communication Protocol
Based on the results obtained from individual LoRaWAN and LoRaMESH networks, the scenarios where each network can act and in which scenarios the hybrid network can be a more viable option have been collected in the Table 7 considering that DAP proposes this possibility of joining both topologies in only one AMI.
Table 7.
Scenarios and services to be used by topology.
As can be seen in the table, depending on the scenario to be implemented AMI, LoRaWAN or LoRaMESH topologies can be used either in a restricted or in a hybrid way. In the case of LoRaWAN, it is more suitable when the distribution of SMs is unregular (near or long the gateway), as well as more used when the SMs are in positions geographically distant from the gateway, and can reach up to approximately 2.35 km. LoRaMESH is best suited for scenarios with SMs distributed on a regular basis and with distances of up to 600 m between nodes, such as condominiums of houses and residential buildings. Hybridization will be recommended when the distance between the nodes exceeds the range distances of each restricted network, in this case, a LoRaWAN hybridization will be performed to reach greater distances and the use of LoRaMESH to connect several SMs that are nearby without overloading the LoRaWAN network.
In the case of Smart Home at greater distances, LoRaMESH can be an option in houses with distances of up to 600 m, LoRaWAN would be an option in cases with distances of up to 2.35 m and hybrid if the maximum distance between the houses is approximately 3 km. For the cases of condominiums of houses and buildings, a mesh topology can be used inside the condominium and the condo for the EEC a LoRaWAN network, thus making the hybrid network and implementing the DAP for the condominium. Another option could be LoRaWAN, if the entire condominium is within the gateway’s coverage area.
In case of public buildings and industry 4.0, two factors should be considered (A) it can be a building with many devices or a very large area with the distributed SMs, (B) Generally these scenarios are more distant or distant from the urban area, so LoRaWAN can be an option but the hybrid will make more possibilities either of distance as of quantity of devices present in the scenario.
The LoRa technology has by default the LoRaWAN protocol, however the Brazilian company Radioenge developed a new routing algorithm mesh for the LoRaMESH protocol based on RPL so that LoRa devices can operate under a mesh network. For reasons of industrial secrets this routing code is not open source, so it was not possible to make improvements or present a model that could become a standard to be used, however this work was limited only to apply it in practice in order to compare Radioenge’s LoRaMESH protocol with the world standard LoRaWAN protocol, and analyze its viability for the proposed scenario. Based on the results obtained, it is possible to analyze the LoRaWAN and LoRaMESH protocols in the urban scenario considering all the specifications that HyDSMaaS requires so that it can function in a complete way and without further losses in terms of AMI deployment and implementation, either with communication failures or due to the price of implementing AMI. From the results obtained in the LoRaWAN network, a range of 2 km to 2.35 km was achieved between the gateway and the more distant SMs, and in LoRaMESH a distance of up to 600 m between two devices could extend the network coverage area by connecting more mesh devices. Both results were obtained in an urban scenario with all the main barriers existing in the environment, as well as all the barriers present in a city that may or may not affect the communication infrastructure.
Thus, with the implementation of the hybrid network, it will be possible to cover long range areas with LoRaWAN, as well as to connect several nearby devices through the LoRaMESH protocol in order to reach a greater amount of distance between the SMs, in order to propose one more possibility of topology to be used to supply all the main different scenarios present in the SG according to the contexts cited in this work, such as SHs and buildings condominiums, industries 4.0, universities and commerce among other end consumers of the EEC. Using the DAP studied, implemented and proposed by this work AMI will be possible to be deployed in the real scenario keeping essential characteristics for this deployment as low cost and long range. In this way, the cost of AMI deployment will be significantly reduced compared to other technologies present in the market today. It is worth mentioning that the formulation implemented and modeled in this work considers that all SMs are synchronized without failures, however, it is known that in practice this synchronization is a challenge to be tackled in future work in order to think about the scalability of this infrastructure.
5. Conclusions and Future Work
This paper studies, implements and analyzes a Hybrid Communication Infrastructure with LoRaWAN and LoraMesh for the Demand Side Management as a Service (HyDSMaaS). The performance of a hybrid LoRa network using LoRaWAN and LoRaMESH protocols to provide a bidirectional AMI in the SG scenario enabling the provision of EPC services to end consumers on the demand side. In this paper, the main IoT technologies are listed and positive and negative points are analyzed in comparison with LP-WAN technologies, leading to justify the use of this technology due to the fact that it is low cost, long range, scalable and has more physical and network structure options. Five SMs were implemented, consisting of a voltage and current sensor, as well as LoRa communication devices. As tests, the operation of the two protocols LoRaWAN and LoRaMESH were analyzed on the bench. In the actual scenario they were analyzed for different points, sides and situations in an urban environment. With this, LoRaMESH was able to reach distances of approximately 600 m between two points, in addition, it is worth mentioning that the technology supports up to 1023 devices connected in the network mesh, with this, being able to increase the aucance of the network because of the hops that can occur between devices mesh composed of LoRaMESH protocol implemented and sold by the company Radioenge. This amount is not a limitation of the mesh network, nor of LoRaWAN, it is just a limitation of the technology used. With LoRaWAN, it was possible to achieve distances of up to 2.35 km between the gateway and the SMs. In addition, the devices were analyzed for different SFs, sides and positions, so the technology was able to operate fully up to approximately 2 km away from the gateway, and beyond that, only with larger SFs. Another point worth mentioning is the analysis and implementation of the packet breaking, this made the devices achieve a greater distance, having a difference of approximately 1km when the packet is broken. What is worth highlighting as one of the contributions of this work.
From the collected data, ToA, delay, RSSI and SNR are considered and analyzed for the different protocols, as well as distances between the SMs and the gateway, different sides, geographical positions and location within the city. What is worth noting is that the LoRaMESH protocol achieved secure communication up to 600 m distance from one SM to another, having as RSSI and SNR affected in a very reduced way and without affecting the communication infrastructure in terms of communication loss. In the case of LoRaWAN, the higher the SF the better the RSSI and lower the SNR, higher settings are better to achieve a greater range, the problem is that it becomes more prone to failures and the packet must be reduced or broken in order to reduce delay and ToA, otherwise, the communication will have a high delay reaching no communication. Considering the hybrid network, there can be a network with 1023 LoRaMESH nodes connected to a hybrid DAP, which is a LoRaWAN end device, communication onwards is done with LoRaWAN. In other words, the network becomes more scalable, and can easily get a large number of nodes without having a high investment in communication infrastructure.
This work has some limitations, and the main one is in relation to the LoRaMESH protocol that proposed more difficulties in terms of programming, as well as not obtaining a result as expected. The reason for this is that the routing algorithm is closed for reasons of factory protection, and this makes the algorithm a black box, so resources for implementations, improvements, modifications and other analyses are unfeasible. Thus, the LoRaMESH protocol will not be a standard to be used globally, only by Radioenge customers. With this, the results obtained are relative to the scenario and the technologies used in this work, and this does not mean that these will be standard results of the protocol. In addition, some tests were not performed, such as packet loss and power consumption for logistical reasons. However, these are studies that will be carried out later or possibly by the state of the art as a continuation of this research.
In terms of the number of nodes in the network, 5,907,692 SMs were obtained that can be connected to the gateway with only minor SF configurations, and 329,687 SMs with only major SFs, which is a very significant amount when dealing with a low cost communication infrastructure. Another important point is that these numbers are also valid for the devices in the mesh network, so whether from LoRaWAN or LoRaMESH, this is the approximate amount of devices that can be connected to a gateway with the configurations used in this work. Finally, HyDSMaaS services are considered and could be implemented in this communication infrastructure, because the packets are already modeled to receive and send information that these types of services need to travel between EPC and homes, so the infrastructure is already enabled to allow operating DSM services without further investment in the communication infrastructure. To validate the infrastructure, the service was modeled and implemented in the TTN network server, which will receive the data, transform them into JSON packets, and send them to the application server. In the application server, the microsoft Power BI service was used and a REST API was implemented that is able to receive these JSON packets, extract the data and register them in a database that will be used by Power BI to generate reports and visualize the BI data for both final consumers and EPC.
The main contribution of this work is the study, implementation and analysis of the LoRa network under LoRaWAN, LoRaMESH and hybrid protocols. The implementation was performed and tested on the bench and in a real scenario, which makes the work more consistent in terms of analysis of the technology itself for the proposed scenario. In addition, a proposal was made to implement a hybrid DAP, which is the device responsible for hybridizing the two networks and allowing data exchange between MESH and LoRaWAN. Another contribution of this work was the proposal of breaking the packets according to the network specifications, this division made the network achieve a range of 1 km more than it was reaching before, moreover, managing to reduce dealy and ToA. We implemented the routing services in the TTN using JSON, the REST API in Microsoft Power BI to receive these JSON and register them in the database, and an interactive dashboard for consumers and the EEC using the data from this database, thus validating one of the applications that will be present in the AMI proposed in this work. Finally, a mathematical modeling was presented to calculate the network scalability for the different SF, this will allow to budget or have a better notion of the network capacity.
As future work, it is intended to implement an algorithm for dynamic allocation of the DAPs, in order to hybridize the network in a scalable way with the least possible communication infrastructure cost. Furthermore, it is intended to analyze the behavior of DSM services on the infrastructure. Additionally, we intend to study the implementation of the mesh topology using the LoRaWAN protocol. Finally, we intend to collect packet loss and power consumption data that have not yet been collected in this work and the capacity is based on theoretical calculations, however, they will be worked on in more detail in future work.
Based on everything that was developed in this work, the lessons learned are (1) LoRaWAN is a technology that varies depending on several factors, including distances, barriers, type of antenna, type of configuration and even the type of hardware that is used. (2) the Radioenge modules are good, but there are better modules on the market. (3) The most laborious part of the work was the tests in the real scenario due to the measurements being in several different positions, besides this the gateway implementation was also one of the most time consuming points. Finally, it was not possible to perform tests and validations with the local EPC, which makes the testing and validation of the proposal a little difficult.
Author Contributions
A.F.d.S.V. collected and performed a deep analysis and reviewed the related literature on the topic, wrote the first draft of the document, performed the comparison study, and identified some open research issues. J.V.R.J. supervised all of the study, consolidated the comparison analysis and open issues, and reviewed the structure and the first draft. R.d.A.L.R., J.D.-f.S. and J.V.R.J. reviewed the text carefully, verified the comparison study, and reviewed the identified open issues. A.F.d.S.V., J.V.R.J., R.d.A.L.R. and J.D.-f.S. contributed equally to the scope definition, motivation, and focus of the paper. All authors have read and agreed to the published version of the manuscript.
Funding
This research received no external funding.
Data Availability Statement
Not Applicable, the study does not report any data.
Conflicts of Interest
The authors declare no conflict of interest.
References
- Kabalci, E.; Kabalci, Y. Introduction to smart grid architecture. In Smart Grids and Their Communication Systems; Springer: Berlin, Germany, 2019; pp. 3–45. [Google Scholar]
- Dileep, G. A survey on smart grid technologies and applications. Renew. Energy 2020, 146, 2589–2625. [Google Scholar] [CrossRef]
- Kumari, P.; Mishra, R.; Gupta, H.P.; Dutta, T.; Das, S.K. An Energy Efficient Smart Metering System using Edge Computing in LoRa Network. IEEE Trans. Sustain. Comput. 2021. [Google Scholar] [CrossRef]
- Almeida, V.A.; de AL Rabêlo, R.; Carvalho, A.; Rodrigues, J.J.; Solic, P. Aligning the interests of prosumers and utilities through a two-step demand-response approach. J. Clean. Prod. 2021, 323, 128993. [Google Scholar] [CrossRef]
- Li, M.; Zhang, K.; Liu, J.; Gong, H.; Zhang, Z. Blockchain-based anomaly detection of electricity consumption in smart grids. Pattern Recognit. Lett. 2020, 138, 476–482. [Google Scholar] [CrossRef]
- Bagdadee, A.H.; Hoque, M.Z.; Zhang, L. IoT Based Wireless Sensor Network for Power Quality Control in Smart Grid. Procedia Comput. Sci. 2020, 167, 1148–1160. [Google Scholar] [CrossRef]
- Azarova, V.; Cohen, J.J.; Kollmann, A.; Reichl, J. Reducing household electricity consumption during evening peak demand times: Evidence from a field experiment. Energy Policy 2020, 144, 111657. [Google Scholar] [CrossRef]
- Ourahou, M.; Ayrir, W.; Hassouni, B.E.; Haddi, A. Review on smart grid control and reliability in presence of renewable energies: Challenges and prospects. Math. Comput. Simul. 2020, 167, 19–31. [Google Scholar] [CrossRef]
- Ahmad, T.; Zhang, H.; Yan, B. A review on renewable energy and electricity requirement forecasting models for smart grid and buildings. Sustain. Cities Soc. 2020, 55, 102052. [Google Scholar] [CrossRef]
- Mohassel, R.R.; Fung, A.; Mohammadi, F.; Raahemifar, K. A survey on advanced metering infrastructure. Int. J. Electr. Power Energy Syst. 2014, 63, 473–484. [Google Scholar] [CrossRef] [Green Version]
- Kabalci, Y. A survey on smart metering and smart grid communication. Renew. Sustain. Energy Rev. 2016, 57, 302–318. [Google Scholar] [CrossRef]
- Sani, A.S.; Yuan, D.; Bao, W.; Dong, Z.Y. A Universally Composable Key Exchange Protocol for Advanced Metering Infrastructure in the Energy Internet. IEEE Trans. Ind. Inform. 2020, 17, 534–546. [Google Scholar] [CrossRef]
- Wang, Y.; Chen, Q.; Hong, T.; Kang, C. Review of smart meter data analytics: Applications, methodologies, and challenges. IEEE Trans. Smart Grid 2018, 10, 3125–3148. [Google Scholar] [CrossRef] [Green Version]
- Oh, S.; Haberl, J.S.; Baltazar, J.C. Analysis methods for characterizing energy saving opportunities from home automation devices using smart meter data. Energy Build. 2020, 216, 109955. [Google Scholar] [CrossRef]
- Xia, Z.; Zhou, H.; Gu, K.; Yin, B.; Zeng, Y.; Xu, M. Secure session key management scheme for meter-reading system based on lora technology. IEEE Access 2018, 6, 75015–75024. [Google Scholar] [CrossRef]
- Liu, F.; Liang, C.; He, Q. Remote Malfunctional Smart Meter Detection in Edge Computing Environment. IEEE Access 2020, 8, 67436–67443. [Google Scholar] [CrossRef]
- Qian, Y.; Shi, L.; Li, J.; Zhou, X.; Shu, F.; Wang, J. An Edge-Computing Paradigm for Internet of Things over Power Line Communication Networks. IEEE Netw. 2020, 34, 262–269. [Google Scholar] [CrossRef]
- Hallak, G.; Berners, M.; Mengi, A. Planning Approach Towards Optimal Performance and Cost of G. hn Broadband PLC Access Networks. In Proceedings of the 2020 IEEE International Symposium on Power Line Communications and Its Applications (ISPLC), Malaga, Spain, 11–13 May 2020; pp. 1–6. [Google Scholar]
- Ercan, S.U.; Ozgonenel, O.; Thomas, D.W. Power line communication channel for smart grid. In Proceedings of the 2018 6th International Istanbul Smart Grids and Cities Congress and Fair (ICSG), Istanbul, Turkey, 25–26 April 2018; pp. 208–212. [Google Scholar]
- Rekik, S.; Baccour, N.; Jmaiel, M.; Drira, K. Wireless sensor network based smart grid communications: Challenges, protocol optimizations, and validation platforms. Wirel. Pers. Commun. 2017, 95, 4025–4047. [Google Scholar] [CrossRef] [Green Version]
- Ghosal, A.; Conti, M. Key management systems for smart grid advanced metering infrastructure: A survey. IEEE Commun. Surv. Tutor. 2019, 21, 2831–2848. [Google Scholar] [CrossRef] [Green Version]
- Flauzac, O.; Hérard, J.; Nolot, F.; Cola, P. A Fault Tolerant LoRa/LoRaWAN Relay Protocol Using LoRaWAN Class A Devices. In Proceedings of the International Conference on Ad-Hoc Networks and Wireless, Bari, Italy, 19–21 October 2020; Springer: Berlin, Germany, 2020; pp. 295–302. [Google Scholar]
- Rokan, A.B.; Kotb, Y. Towards a Real IoT-Based Smart Meter System. In First International Conference on Sustainable Technologies for Computational Intelligence; Springer: Berlin, Germany, 2020; pp. 139–154. [Google Scholar]
- Zhang, J.; Hasandka, A.; Wei, J.; Alam, S.; Elgindy, T.; Florita, A.R.; Hodge, B.M. Hybrid communication architectures for distributed smart grid applications. Energies 2018, 11, 871. [Google Scholar] [CrossRef] [Green Version]
- Zhang, J.; Hasandka, A.; Alam, S.S.; Elgindy, T.; Florita, A.R.; Hodge, B.M. Analysis of Hybrid Smart Grid Communication Network Designs for Distributed Energy Resources Coordination. In Proceedings of the 2019 IEEE Power & Energy Society Innovative Smart Grid Technologies Conference (ISGT), Washington, DC, USA, 18–21 February 2019; pp. 1–5. [Google Scholar]
- Molla, T. Smart Home Energy Management System. In Handbook of Research on New Solutions and Technologies in Electrical Distribution Networks; IGI Global: Hershey, PA, USA, 2020; pp. 191–206. [Google Scholar]
- Rathor, S.K.; Saxena, D. Energy management system for smart grid: An overview and key issues. Int. J. Energy Res. 2020, 44, 4067–4109. [Google Scholar] [CrossRef]
- Ravikumar, G.; Nicklaus, A.; Govindarasu, M. Cyber-Physical Smart Light Control System Integration with Smart Grid using Zigbee. In Proceedings of the 2020 IEEE Power & Energy Society Innovative Smart Grid Technologies Conference (ISGT), Washington, DC, USA, 17–20 February 2020; pp. 1–5. [Google Scholar]
- Talaat, M.; Alsayyari, A.S.; Alblawi, A.; Hatata, A. Hybrid-cloud-based data processing for power system monitoring in smart grids. Sustain. Cities Soc. 2020, 55, 102049. [Google Scholar] [CrossRef]
- Horsmanheimo, S.; Tuomimäki, L.; Sanchez, R.R.; Andrén, F.P.; Andersen, C.A. ICT Requirements in a Smart Grid Environment. In TSO-DSO Interactions and Ancillary Services in Electricity Transmission and Distribution Networks; Springer: Berlin, Germany, 2020; pp. 61–91. [Google Scholar]
- Tightiz, L.; Yang, H. A Comprehensive Review on IoT Protocols’ Features in Smart Grid Communication. Energies 2020, 13, 2762. [Google Scholar] [CrossRef]
- McKeever, P.; Sadu, A.; Rohilla, S.; Mehdi, Z.; Monti, A. Ensuring Uninterrupted MTC Service Availability during Emergencies Using LTE/5G Public Mobile Land Networks. In Telecom; Multidisciplinary Digital Publishing Institute: Basel, Switzerland, 2020; Volume 1, pp. 181–195. Available online: https://www.mdpi.com/2673-4001/1/3/13 (accessed on 14 October 2021).
- Sobhani, S.O.; Sheykhha, S.; Madlener, R. An integrated two-level demand-side management game applied to smart energy hubs with storage. Energy 2020, 206, 118017. [Google Scholar] [CrossRef]
- Mendes, D.L.; Rabelo, R.A.; Veloso, A.F.; Rodrigues, J.J.; dos Reis Junior, J.V. An adaptive data compression mechanism for smart meters considering a demand side management scenario. J. Clean. Prod. 2020, 255, 120190. [Google Scholar] [CrossRef]
- Sarker, E.; Halder, P.; Seyedmahmoudian, M.; Jamei, E.; Horan, B.; Mekhilef, S.; Stojcevski, A. Progress on the demand side management in smart grid and optimization approaches. Int. J. Energy Res. 2020, 45, 36–64. [Google Scholar] [CrossRef]
- Almeida, N.C.; Rolle, R.P.; Godoy, E.P.; Ferrari, P.; Sisinni, E. Proposal of a Hybrid LoRa Mesh/LoRaWAN Network. In Proceedings of the 2020 IEEE International Workshop on Metrology for Industry 4.0 & IoT, Roma, Italy, 3–5 June 2020; pp. 702–707. [Google Scholar]
- Osorio, A.; Calle, M.; Soto, J.D.; Candelo-Becerra, J.E. Routing in LoRaWAN: Overview and Challenges. IEEE Commun. Mag. 2020, 58, 72–76. [Google Scholar] [CrossRef]
- Ertürk, M.A.; Aydın, M.A.; Büyükakkaşlar, M.T.; Evirgen, H. A Survey on LoRaWAN Architecture, Protocol and Technologies. Future Internet 2019, 11, 216. [Google Scholar] [CrossRef] [Green Version]
- Liang, C.W.; Wu, Y.L.; Shi, C.Y.; Lu, S.M.; Lee, H.C. Evaluation of a LoRa mesh wireless networking system supporting time-critical transmission and data lost recovery. In Proceedings of the 18th International Conference on Information Processing in Sensor Networks, Montreal, QC, Canada, 16–18 April 2019; pp. 317–318. [Google Scholar]
- Alaqeel, T.; Suryanarayanan, S. A comprehensive cost-benefit analysis of the penetration of Smart Grid technologies in the Saudi Arabian electricity infrastructure. Util. Policy 2019, 60, 100933. [Google Scholar] [CrossRef]
- Dranka, G.G.; Ferreira, P. Towards a smart grid power system in Brazil: Challenges and opportunities. Energy Policy 2020, 136, 111033. [Google Scholar] [CrossRef]
- Gwerder, Y.V.; Figueiredo, N.C.; da Silva, P.P. Investing in smart grids: Assessing the influence of regulatory and market factors on investment level. Energy J. 2019, 40. [Google Scholar] [CrossRef]
- LoRaWAN™ 1.0 Specification. Available online: https://www.rs-online.com/designspark/rel-assets/ds-assets/uploads/knowledge-items/application-notes-for-the-internet-of-things/LoRaWAN%20Specification%201R0.pdf (accessed on 14 October 2021).
- LoRaWAN™ 1.1 Specification. Available online: https://net868.ru/assets/pdf/LoRaWAN-v1.1.pdf (accessed on 14 October 2021).
- LoRaWAN™ 1.0.3 Specification. Available online: https://lora-alliance.org/wp-content/uploads/2020/11/lorawan1.0.3.pdf (accessed on 14 October 2021).
- Sundaram, J.P.S.; Du, W.; Zhao, Z. A survey on lora networking: Research problems, current solutions, and open issues. IEEE Commun. Surv. Tutor. 2019, 22, 371–388. [Google Scholar] [CrossRef] [Green Version]
- Li, L.L.; Liu, Y.W.; Tseng, M.L.; Lin, G.Q.; Ali, M.H. Reducing environmental pollution and fuel consumption using optimization algorithm to develop combined cooling heating and power system operation strategies. J. Clean. Prod. 2020, 247, 119082. [Google Scholar] [CrossRef]
- Wang, W.; Huang, H.; Zhang, L.; Su, C. Secure and efficient mutual authentication protocol for smart grid under blockchain. Peer-to-Peer Netw. Appl. 2021, 14, 2681–2693. [Google Scholar] [CrossRef]
- Badal, F.R.; Das, P.; Sarker, S.K.; Das, S.K. A survey on control issues in renewable energy integration and microgrid. Prot. Control. Mod. Power Syst. 2019, 4, 8. [Google Scholar] [CrossRef] [Green Version]
- Masnicki, R. Validation of the measurement characteristics in an instrument for power quality estimation—A case study. Energies 2017, 10, 536. [Google Scholar] [CrossRef]
- Anthi, E.; Williams, L.; Słowińska, M.; Theodorakopoulos, G.; Burnap, P. A supervised intrusion detection system for smart home IoT devices. IEEE Internet Things J. 2019, 6, 9042–9053. [Google Scholar] [CrossRef]
- Essiet, I.O.; Sun, Y.; Wang, Z. Optimized energy consumption model for smart home using improved differential evolution algorithm. Energy 2019, 172, 354–365. [Google Scholar] [CrossRef]
- Patil, K.; Laad, M.; Kamble, A.; Laad, S. A consumer-based smart home with indoor air quality monitoring system. IETE J. Res. 2019, 65, 758–770. [Google Scholar] [CrossRef]
- Khan, S.; Khan, Z.A.; Javaid, N.; Shuja, S.M.; Abdullah, M.; Chand, A. Energy efficient scheduling of smart home. In Proceedings of the Workshops of the International Conference on Advanced Information Networking and Applications, Matsue, Japan, 27–29 March 2019; Springer: Berlin, Germany, 2019; pp. 67–79. [Google Scholar]
- Veras, J.M.; Silva, I.R.S.; Pinheiro, P.R.; Rabêlo, R.A.; Veloso, A.F.S.; Borges, F.A.S.; Rodrigues, J.J. A multi-objective demand response optimization model for scheduling loads in a home energy management system. Sensors 2018, 18, 3207. [Google Scholar] [CrossRef] [Green Version]
- Ju, L.; Wu, J.; Lin, H.; Tan, Q.; Li, G.; Tan, Z.; Li, J. Robust purchase and sale transactions optimization strategy for electricity retailers with energy storage system considering two-stage demand response. Appl. Energy 2020, 271, 115155. [Google Scholar] [CrossRef]
- Almusaylim, Z.A.; Zaman, N. A review on smart home present state and challenges: Linked to context-awareness internet of things (IoT). Wirel. Netw. 2019, 25, 3193–3204. [Google Scholar] [CrossRef]
- Veloso, A.F.d.S.; Rodrigues, A.A.; Sobral, J.V.; Rodrigues, J.J.; Feitosa, M.S.; Rabelo, R.A. An IoT Smart Metering Solution Based on IEEE 802.15. 4. In Proceedings of the 2018 IEEE Global Communications Conference (GLOBECOM), Abu Dhabi, United Arab Emirates, 9–13 December 2018; pp. 1–6. [Google Scholar]
- Andreadou, N.; Lucas, A.; Tarantola, S.; Poursanidis, I. Design of Experiments in the Methodology for Interoperability Testing: Evaluating AMI Message Exchange. Appl. Sci. 2019, 9, 1221. [Google Scholar] [CrossRef] [Green Version]
- Siqueira de Carvalho, R.; Kumar Sen, P.; Nag Velaga, Y.; Feksa Ramos, L.; Neves Canha, L. Communication system design for an advanced metering infrastructure. Sensors 2018, 18, 3734. [Google Scholar] [CrossRef]
- Bharathi, C.; Rekha, D.; Vijayakumar, V. Genetic algorithm based demand side management for smart grid. Wirel. Pers. Commun. 2017, 93, 481–502. [Google Scholar] [CrossRef]
- Atif, H.; ul Hassan, H.T. Demand side Management for SMART Grid. Pak. J. Eng. Technol. 2019, 2, 9–17. [Google Scholar]
- Klavsuts, I.L.; Dvortsevoi, A.I.; Khayrullina, M.V.; Klavsuts, D.A. Resource Consumption Monitoring on the Basis of Devices of Demand Side Management in Smart Grids. In Proceedings of the 2019 54th International Universities Power Engineering Conference (UPEC), Bucharest, Romania, 3–6 September 2019; pp. 1–6. [Google Scholar]
- Qin, H.; Wu, Z.; Wang, M. Demand-side management for smart grid networks using stochastic linear programming game. Neural Comput. Appl. 2020, 32, 139–149. [Google Scholar] [CrossRef]
- Xu, S.; Qian, Y.; Hu, R.Q. Reliable and resilient access network design for advanced metering infrastructures in smart grid. IET Smart Grid 2018, 1, 24–30. [Google Scholar] [CrossRef]
- Zhou, B.; Li, W.; Chan, K.W.; Cao, Y.; Kuang, Y.; Liu, X.; Wang, X. Smart home energy management systems: Concept, configurations, and scheduling strategies. Renew. Sustain. Energy Rev. 2016, 61, 30–40. [Google Scholar] [CrossRef]
- Kang, W.M.; Moon, S.Y.; Park, J.H. An enhanced security framework for home appliances in smart home. Hum.-Cent. Comput. Inf. Sci. 2017, 7, 6. [Google Scholar] [CrossRef] [Green Version]
- Mallikarjuna, B. Feedback-Based Resource Utilization for Smart Home Automation in Fog Assistance IoT-Based Cloud. Int. J. Fog Comput. (IJFC) 2020, 3, 41–63. [Google Scholar] [CrossRef]
- Bahshm, Y.; Aldhaibani, A. Designing a Smart Home Automation System Using Internet of Things and Mobile Application. J. Netw. Commun. Emerg. Technol. (JNCET) 2020, 10. Available online: https://d1wqtxts1xzle7.cloudfront.net/62515323/Vol-10-issue-3-M-0120200328-121820-5u3khx-with-cover-page-v2.pdf?Expires=1635237129&Signature=Z58DMtCMjHw4NBcMTsnec5BMGBMyZwb9lyMyDd4FgD5YprhpcRXZrhDBOO17D05uaBAF2vKmg0wnwZyDyW3A~eUdqSURYOaTJiD8mbdLchFLu~xYjXnADA9pg6SsRYN5kdXfrI-CRogLPG3OdukOissKnfaTZ-J5C3ash4EdGQ7pSCWLC6j88iPrBSp6pFVu4Gsgyc~f-o-DkGOx0lSH3bF3a4bvHjaVnRL73-K7hWdCXFh8JE3UnzmdjEsQmIwhuj-2d09heV1oL0vpuMWyfUVET4OO25BJGz8KMR6v-AeQPqUvsK-1xFtVOftWHQQKWlsHmV3RJl8sodzLngWgBg__&Key-Pair-Id=APKAJLOHF5GGSLRBV4ZA (accessed on 14 October 2021).
- Janita, B.; Kannan, R.J.; Kumaratharan, N. Enhancing Security in Smart Homes-A Review. In Intelligent Computing in Engineering; Springer: Berlin, Germany, 2020; pp. 361–369. [Google Scholar]
- Fadhil, J.A.; Omar, O.A.; Sarhan, Q.I. A Survey on the Applications of Smart Home Systems. In Proceedings of the 2020 International Conference on Computer Science and Software Engineering (CSASE), Duhok, Iraq, 16–18 April 2020; pp. 168–173. [Google Scholar]
- Alam, T.; A Salem, A.; Alsharif, A.O.; Alhujaili, A.M. Smart home automation towards the development of smart cities. Comput. Sci. Inf. Technol. 2020, 5, 13–20. [Google Scholar]
- Bhamidi, L.; Sivasubramani, S. Optimal sizing of smart home renewable energy resources and battery under prosumer-based energy management. IEEE Syst. J. 2020, 15, 105–113. [Google Scholar] [CrossRef]
- Xu, Z.; Gao, Y.; Hussain, M.; Cheng, P. Demand Side Management for Smart Grid Based on Smart Home Appliances with Renewable Energy Sources and an Energy Storage System. Math. Probl. Eng. 2020, 2020. [Google Scholar] [CrossRef]
- Zemrane, H.; Baddi, Y.; Hasbi, A. Internet of Things smart home ecosystem. In Emerging Technologies for Connected Internet of Vehicles and Intelligent Transportation System Networks; Springer: Berlin, Germany, 2020; pp. 101–125. [Google Scholar]
- Wu, T.D.; Chen, Z.J.; Chang, C.C.; Wang, H.F. Design of a Wireless Sensor Network for Open Ocean Aquaculture Based on 802.11 ac Wireless Bridge and LoRa™ Technology. In Proceedings of the 2020 International Workshop on Electromagnetics: Applications and Student Innovation Competition (iWEM), Makung, Taiwan, 26–28 August 2020; pp. 1–2. [Google Scholar]
- Ren, Y.; Tan, S.; Zhang, L.; Wang, Z.; Wang, Z.; Yang, J. Liquid Level Sensing Using Commodity WiFi in a Smart Home Environment. Proc. ACM Interact. Mob. Wearable Ubiquitous Technol. 2020, 4, 1–30. [Google Scholar] [CrossRef] [Green Version]
- Veloso, A.F.d.S.; de Oliveira, R.G.; Rodrigues, A.A.; Rabelo, R.A.; Rodrigues, J.J. Cognitive Smart Plugs for Signature Identification of Residential Home Appliance Load using Machine Learning: From Theory to Practice. In Proceedings of the 2019 IEEE International Conference on Communications Workshops (ICC Workshops), Shanghai, China, 20–24 May 2019; pp. 1–6. [Google Scholar]
- Lee, S.; Choi, D.H. Energy Management of Smart Home with Home Appliances, Energy Storage System and Electric Vehicle: A Hierarchical Deep Reinforcement Learning Approach. Sensors 2020, 20, 2157. [Google Scholar] [CrossRef] [PubMed] [Green Version]
- Kuo, C.T. A novel condominium management mode in Taiwan. J. Urban Manag. 2020, 9, 6–18. [Google Scholar] [CrossRef]
- Kisiel, E. Solar Panels in Condominium Communities. LSU J. Energy Law Resour. 2020, 8, 9. [Google Scholar]
- Susowake, Y.; Masrur, H.; Yabiku, T.; Senjyu, T.; Motin Howlader, A.; Abdel-Akher, M.; M Hemeida, A. A multi-objective optimization approach towards a proposed smart apartment with demand-response in Japan. Energies 2020, 13, 127. [Google Scholar] [CrossRef] [Green Version]
- Rebelatto, B.G.; Salvia, A.L.; Reginatto, G.; Branldi, L.L.; Frandoloso, M.A.L. Energy efficiency initiatives at universities: A systematic literature revie. Rev. Gestão Sustentabilidade Ambient. 2020, 9, 503–524. [Google Scholar] [CrossRef]
- Jain, R.; Gupta, M.; Nayyar, A.; Sharma, N. Adoption of Fog Computing in Healthcare 4.0. In Fog Computing for Healthcare 4.0 Environments; Springer: Berlin, Germany, 2021; pp. 3–36. [Google Scholar]
- Qarabsh, N.A.; Sabry, S.S.; Qarabash, H.A. Smart grid in the context of industry 4.0: An overview of communications technologies and challenges. Indones. J. Electr. Eng. Comput. Sci. 2020, 18, 656–665. [Google Scholar] [CrossRef]
- Ferrero, R.; Collotta, M.; Bueno-Delgado, M.V.; Chen, H.C. Smart Management Energy Systems in Industry 4.0. Energies 2020, 13, 382. [Google Scholar] [CrossRef] [Green Version]
- Esther, B.P.; Kumar, K.S. A survey on residential demand side management architecture, approaches, optimization models and methods. Renew. Sustain. Energy Rev. 2016, 59, 342–351. [Google Scholar] [CrossRef]
- Chen, Y.Y.; Lin, Y.H.; Kung, C.C.; Chung, M.H.; Yen, I. Design and implementation of cloud analytics-assisted smart power meters considering advanced artificial intelligence as edge analytics in demand-side management for smart homes. Sensors 2019, 19, 2047. [Google Scholar] [CrossRef] [Green Version]
- Junior, W.L.R.; Borges, F.A.; Veloso, A.F.d.S.; de AL Rabêlo, R.; Rodrigues, J.J. Low voltage smart meter for monitoring of power quality disturbances applied in smart grid. Measurement 2019, 147, 106890. [Google Scholar] [CrossRef]
- Washizu, A.; Nakano, S.; Ishii, H.; Hayashi, Y. Willingness to pay for home energy management systems: A survey in New York and Tokyo. Sustainability 2019, 11, 4790. [Google Scholar] [CrossRef] [Green Version]
- Mahmud, S.; Ahmed, S.; Shikder, K. A smart home automation and metering system using internet of things (IoT). In Proceedings of the 2019 International Conference on Robotics, Electrical and Signal Processing Techniques (ICREST), Dhaka, Bangladesh, 10–12 January 2019; pp. 451–454. [Google Scholar]
- Wang, K.; Wu, J.; Zheng, X.; Jolfaei, A.; Li, J.; Yu, D. Leveraging Energy Function Virtualization with Game Theory for Fault-Tolerant Smart Grid. IEEE Trans. Ind. Inform. 2020, 17, 678–687. [Google Scholar] [CrossRef]
- Sheha, M.; Mohammadi, K.; Powell, K. Solving the duck curve in a smart grid environment using a non-cooperative game theory and dynamic pricing profiles. Energy Convers. Manag. 2020, 220, 113102. [Google Scholar] [CrossRef]
- Luo, X.; Oyedele, L.O.; Ajayi, A.O.; Akinade, O.O.; Owolabi, H.A.; Ahmed, A. Feature extraction and genetic algorithm enhanced adaptive deep neural network for energy consumption prediction in buildings. Renew. Sustain. Energy Rev. 2020, 131, 109980. [Google Scholar] [CrossRef]
- Reda, F.; Fatima, Z. Northern European nearly zero energy building concepts for apartment buildings using integrated solar technologies and dynamic occupancy profile: Focus on Finland and other Northern European countries. Appl. Energy 2019, 237, 598–617. [Google Scholar] [CrossRef]
- Cugurullo, F.; Acheampong, R.A.; Gueriau, M.; Dusparic, I. The transition to autonomous cars, the redesign of cities and the future of urban sustainability. Urban Geogr. 2020, 1–27. [Google Scholar] [CrossRef]
- Ray, P.P. A survey on Internet of Things architectures. J. King Saud Univ.-Comput. Inf. Sci. 2018, 30, 291–319. [Google Scholar]
- Viswanath, S.K.; Yuen, C.; Tushar, W.; Li, W.T.; Wen, C.K.; Hu, K.; Chen, C.; Liu, X. System design of the internet of things for residential smart grid. IEEE Wirel. Commun. 2016, 23, 90–98. [Google Scholar] [CrossRef] [Green Version]
- Fadlullah, Z.M.; Pathan, A.S.K.; Singh, K. Smart grid internet of things. Mob. Netw. Appl. 2018, 23, 879–880. [Google Scholar] [CrossRef] [Green Version]
- Yoldaş, Y.; Önen, A.; Muyeen, S.; Vasilakos, A.V.; Alan, İ. Enhancing smart grid with microgrids: Challenges and opportunities. Renew. Sustain. Energy Rev. 2017, 72, 205–214. [Google Scholar] [CrossRef]
- Zhilenkov, A.A.; Gilyazov, D.D.; Matveev, I.I.; Krishtal, Y.V. Power line communication in IoT-systems. In Proceedings of the 2017 IEEE Conference of Russian Young Researchers in Electrical and Electronic Engineering (EIConRus), St. Petersburg/Moscow, Russia, 1–3 February 2017; pp. 242–245. [Google Scholar]
- Van, D.P.; Rimal, B.P.; Maier, M. Fiber optic vs. wireless sensors in energy-efficient integrated FiWi smart grid networks: An energy-delay and TCO comparison. In Proceedings of the IEEE INFOCOM 2016-The 35th Annual IEEE International Conference on Computer Communications, San Francisco, CA, USA, 10–14 April 2016; pp. 1–9. [Google Scholar]
- Shahryari, K.; Anvari-Moghaddam, A. Demand side management using the internet of energy based on fog and cloud computing. In Proceedings of the 2017 IEEE International Conference on Internet of Things (iThings) and IEEE Green Computing and Communications (GreenCom) and IEEE Cyber, Physical and Social Computing (CPSCom) and IEEE Smart Data (SmartData), Exeter, UK, 21–23 June 2017; pp. 931–936. [Google Scholar]
- Kalair, A.R.; Abas, N.; Hasan, Q.U.; Seyedmahmoudian, M.; Khan, N. Demand side management in hybrid rooftop photovoltaic integrated smart nano grid. J. Clean. Prod. 2020, 258, 120747. [Google Scholar] [CrossRef]
- Suryadevara, N.K.; Biswal, G.R. Smart plugs: Paradigms and applications in the smart City-and-Smart grid. Energies 2019, 12, 1957. [Google Scholar] [CrossRef] [Green Version]
- Neagu, O.; Hamouda, W. Performance of WiMAX for smart grid applications. In Proceedings of the 2016 International Conference on Selected Topics in Mobile & Wireless Networking (MoWNeT), Cairo, Egypt, 11–13 April 2016; pp. 1–5. [Google Scholar]
- de Ferreira, E.R.; Barros, R.M.; da Silva, T.A.; de Rabêlo, R.A.; Júnior, V.R.; Lage, G.G. Application of a Data Communication Infrastructure for the Voltage Magnitude Control in Transmission Power Systems. In Proceedings of the 2019 IEEE International Conference on Systems, Man and Cybernetics (SMC), Bari, Italy, 6–9 October 2019; pp. 4308–4315. [Google Scholar]
- Kavithakumari, K.; Paul, P.P.; CatherineAmalaPriya, E. Advance metering infrastructure for smart grid using GSM. In Proceedings of the 2017 Third International Conference on Science Technology Engineering & Management (ICONSTEM), Chennai, India, 23–24 March 2017; pp. 619–622. [Google Scholar]
- Huo, Y.; Dong, X.; Beatty, S. Cellular communications in ocean waves for maritime internet of things. IEEE Internet Things J. 2020, 7, 9965–9979. [Google Scholar] [CrossRef] [Green Version]
- Rahman, M.M.; Mou, J.R.; Tara, K.; Sarkar, M.I. Real time Google map and Arduino based vehicle tracking system. In Proceedings of the 2016 2nd International Conference on Electrical, Computer & Telecommunication Engineering (ICECTE), Rajshahi, Bangladesh, 8–10 December 2016; pp. 1–4. [Google Scholar]
- Mir, S.H.; Sahreen Ashruf, S.; Bhat, Y.; Beigh, N. Review on Smart Electric Metering System Based on GSM/IOT. Asian J. Electr. Sci. 2019, 8, 1–6. [Google Scholar]
- Viciana, E.; Alcayde, A.; Montoya, F.G.; Baños, R.; Arrabal-Campos, F.M.; Zapata-Sierra, A.; Manzano-Agugliaro, F. Openzmeter: An efficient low-cost energy smart meter and power quality analyzer. Sustainability 2018, 10, 4038. [Google Scholar] [CrossRef] [Green Version]
- Hui, H.; Ding, Y.; Shi, Q.; Li, F.; Song, Y.; Yan, J. 5G network-based Internet of Things for demand response in smart grid: A survey on application potential. Appl. Energy 2020, 257, 113972. [Google Scholar] [CrossRef]
- Salem, M.A.; Abd El-Kader, S.M.; Youssef, M.I.; Tarrad, I.F. M2M in 5G Communication Networks: Characteristics, Applications, Taxonomy, Technologies, and Future Challenges. In Fundamental and Supportive Technologies for 5G Mobile Networks; IGI Global: Hershey, PA, USA, 2020; pp. 309–321. [Google Scholar]
- Reddy, G.P.; Kumar, Y.P. Future Wireless Communication Technologies for Smart Grids: A LPWAN Prospective. Future 2020. Available online: https://smartgrid.ieee.org/newsletters/august-2020/future-wireless-communication-technologies-for-smart-grids-a-lpwan-prospective (accessed on 14 October 2021).
- Shahjalal, M.; Hasan, M.K.; Islam, M.M.; Alam, M.M.; Ahmed, M.F.; Jang, Y.M. An Overview of AI-Enabled Remote Smart-Home Monitoring System Using LoRa. In Proceedings of the 2020 International Conference on Artificial Intelligence in Information and Communication (ICAIIC), Fukuoka, Japan, 19–21 February 2020; pp. 510–513. [Google Scholar]
- Abbasi, M.; Khorasanian, S.; Yaghmaee, M.H. Low-Power Wide Area Network (LPWAN) for Smart grid: An in-depth study on LoRaWAN. In Proceedings of the 2019 5th Conference on Knowledge Based Engineering and Innovation (KBEI), Tehran, Iran, 28 February–1 March 2019; pp. 22–29. [Google Scholar]
- Mekki, K.; Bajic, E.; Chaxel, F.; Meyer, F. A comparative study of LPWAN technologies for large-scale IoT deployment. ICT Express 2019, 5, 1–7. [Google Scholar] [CrossRef]
- Ilderyakov, M.S.; Stepanov, N.V. Using a small number of devices to experimentally estimate the packet delivery ratio on a LoRaWAN network with a large number of end devices. In Proceedings of the 2019 Wave Electronics and its Application in Information and Telecommunication Systems (WECONF), St. Petersburg, Russia, 3–7 June 2019; pp. 1–4. [Google Scholar]
- Ortiz, F.M.; Almeida, T.; Ferreira, A.E.L.A.; Costa, L.H.M.K. Caracterização de Desempenho de uma Rede LoRa em Ambientes Urbanos: Simulação vs. Prática. In Anais do III Workshop de Computação Urbana; SBC: Singapore, 2019; pp. 167–180. [Google Scholar]
- Rafi, M.N.; Muaaz, M. Performance Evaluation of the LoRa Protocol in the context of Smart Meter. arXiv 2019, arXiv:1907.12355. [Google Scholar]
- Cotrim, J.R.; Kleinschmidt, J.H. LoRaWAN Mesh Networks: A Review and Classification of Multihop Communication. Sensors 2020, 20, 4273. [Google Scholar] [CrossRef]
- Maksimova, R.; Kolev, K. LoRaWAN applications-“Leonardo tasting LoRaWINE”. IOP Conf. Ser. Mater. Sci. Eng. 2020, 878, 012032. [Google Scholar] [CrossRef]
- Guizar, A.; Ochoa, M.N.; Mannoni, V.; Maman, M. LPWA Deployment for Factory of the Future: LoRa or Turbo-FSK Based Technology? In Proceedings of the 2019 IEEE 30th Annual International Symposium on Personal, Indoor and Mobile Radio Communications (PIMRC), Istanbul, Turkey, 8–11 September 2019; pp. 1–6. [Google Scholar]
- Martinez, I.; Tanguy, P.; Nouvel, F. On the performance evaluation of LoRaWAN under Jamming. In Proceedings of the 2019 IEEE 12th IFIP Wireless and Mobile Networking Conference (WMNC), Paris, France, 11–13 September 2019; pp. 141–145. [Google Scholar]
- Martín-Lopo, M.M.; Boal, J.; Sánchez-Miralles, Á. A literature review of IoT energy platforms aimed at end users. Comput. Netw. 2020, 171, 107101. [Google Scholar] [CrossRef]
- Goratti, L.; Haapola, J.; Kato, S. Highly reliable star and sub-mesh hybrid sensor network for smart grid monitoring. In Proceedings of the 2012 IEEE Globecom Workshops, Anaheim, CA, USA, 3–7 December 2012; pp. 1480–1485. [Google Scholar]
- da Silveira, J.D.F.; Martins, T.R.; da Silva, C.N.; dos Reis, J.V. New Solution based on Fuzzy System for Planning IoT Communication Infrastructure for Rural Areas. In Proceedings of the 2021 IEEE International Conference on Fuzzy Systems (FUZZ-IEEE), Luxembourg, 11–14 July 2021; pp. 1–6. [Google Scholar]
- Arduino Specification. Available online: https://www.tomsonelectronics.com/blogs/news/arduino-uno-specification (accessed on 14 October 2021).
- Šikić, L.; Janković, J.; Afrić, P.; Šilić, M.; Ilić, Ž.; Pandžić, H.; Živić, M.; Džanko, M. A Comparison of Application Layer Communication Protocols in IoT-enabled Smart Grid. In Proceedings of the 2020 International Symposium ELMAR, Zadar, Croatia, 14–15 September 2020; pp. 83–86. [Google Scholar]
- Jaison, A.M.; Benadit, J. Smart Metering System with Google Assistant. Int. Res. J. Multidiscip. Technovation 2020, 2, 7–13. [Google Scholar] [CrossRef]
- Mikhaylov, K.; Petäjäjärvi, J.; Pouttu, A. Effect of downlink traffic on performance of LoRaWAN LPWA networks: Empirical study. In Proceedings of the 2018 IEEE 29th Annual International Symposium on Personal, Indoor and Mobile Radio Communications (PIMRC), Bologna, Italy, 9–12 September 2018; pp. 1–6. [Google Scholar]

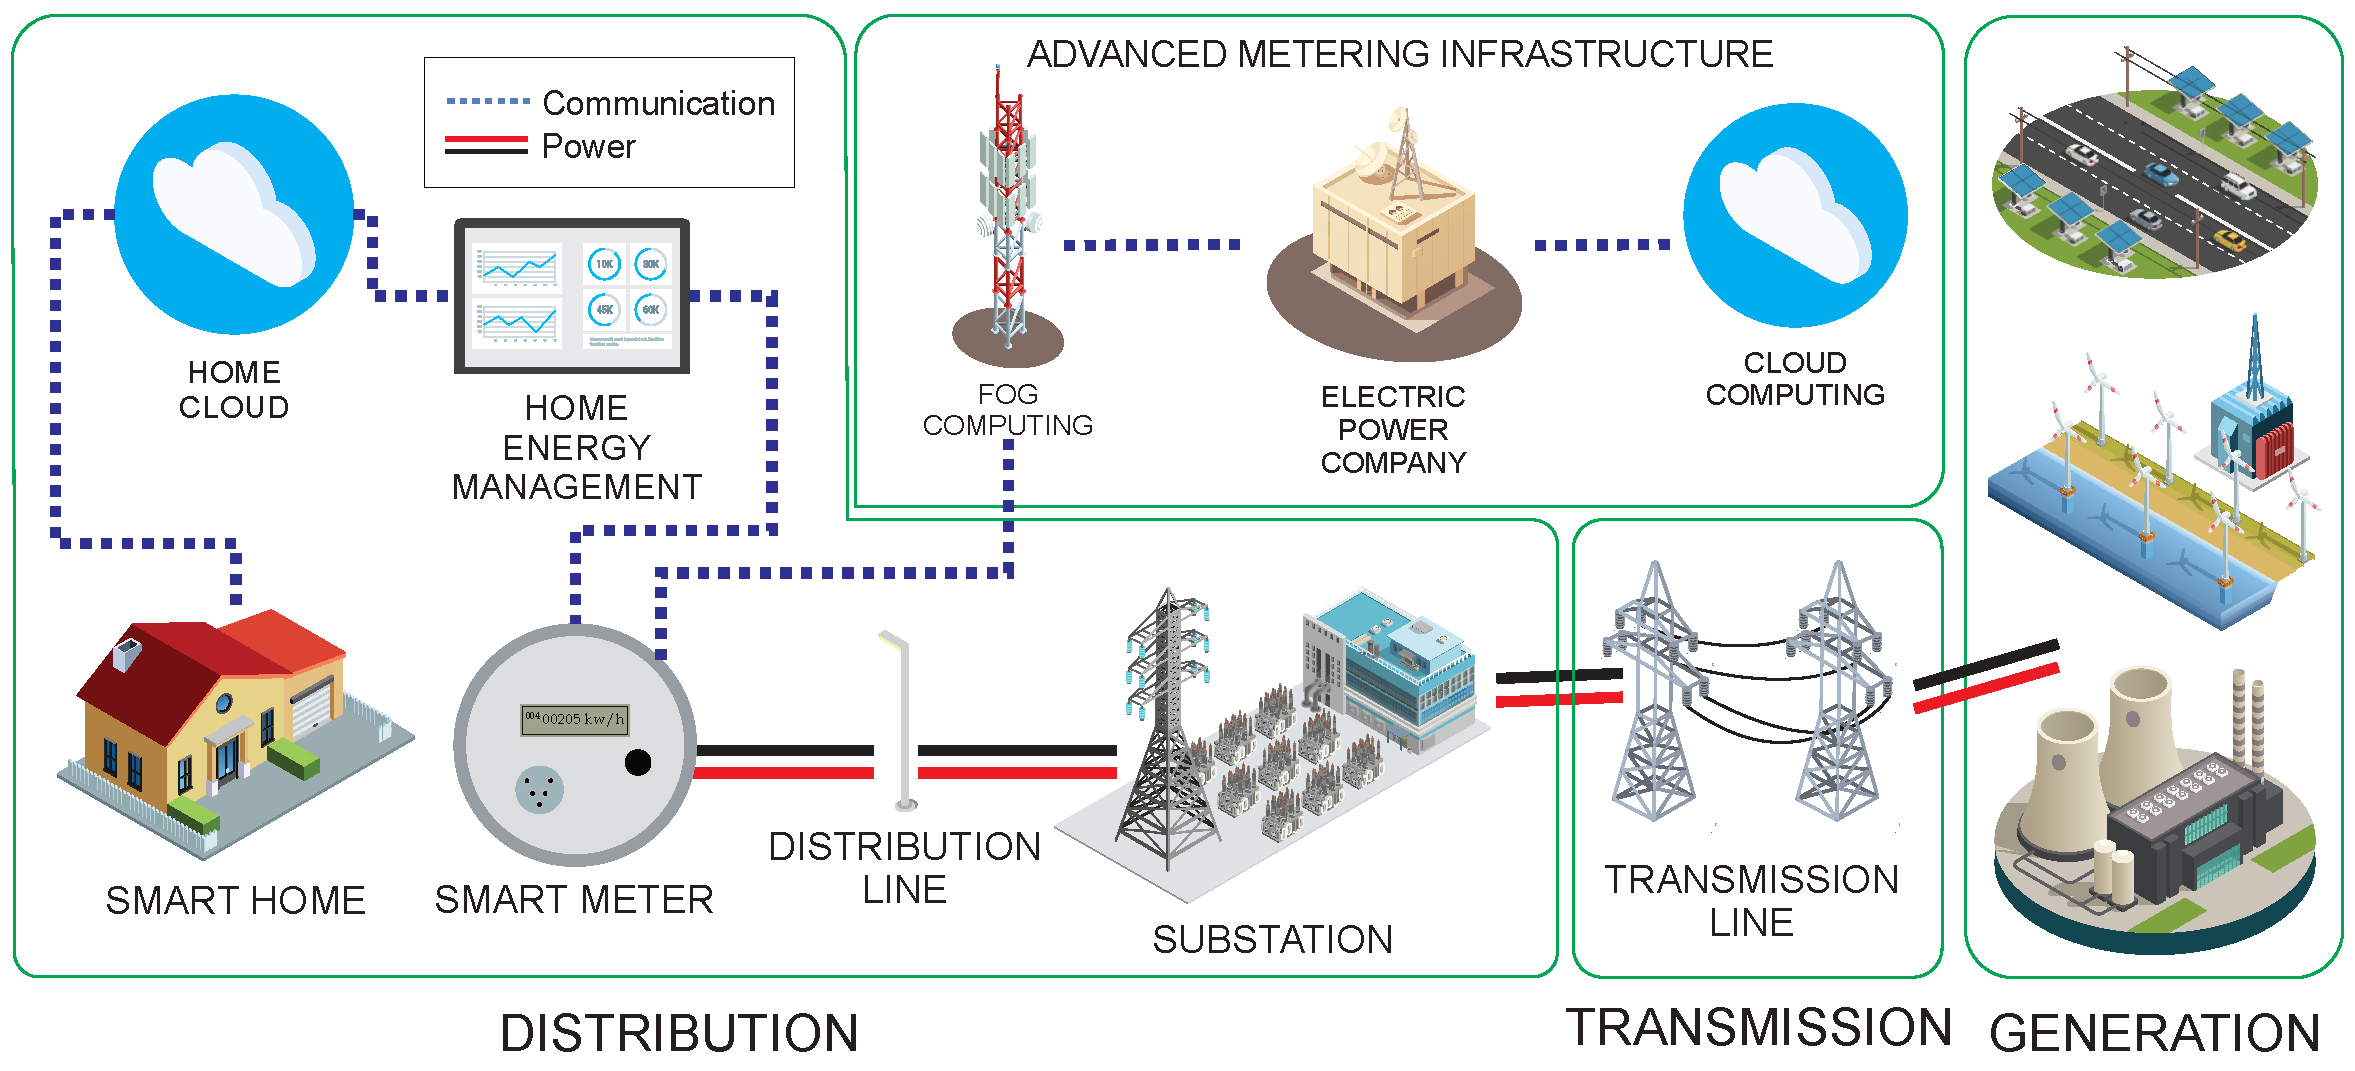
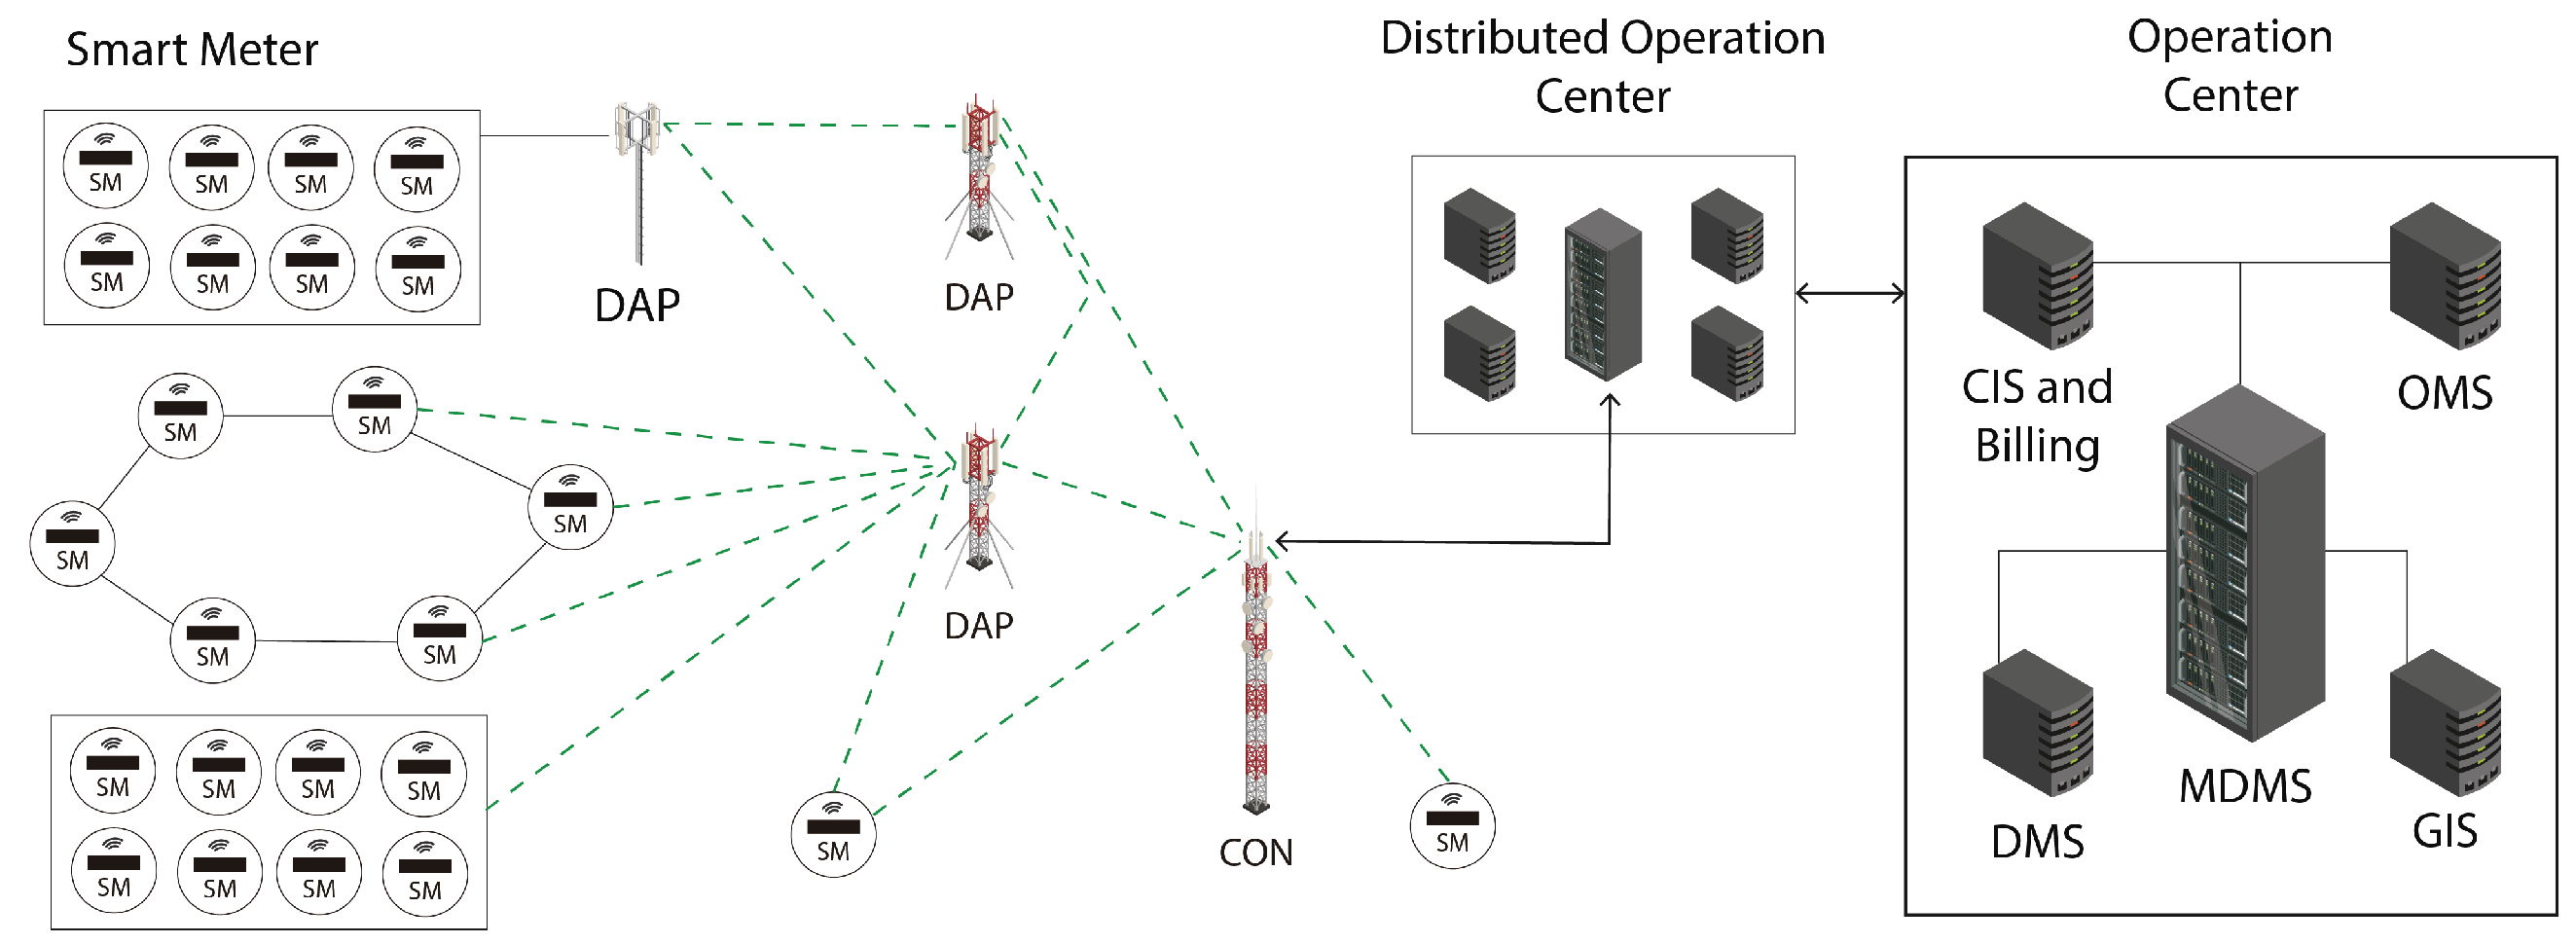

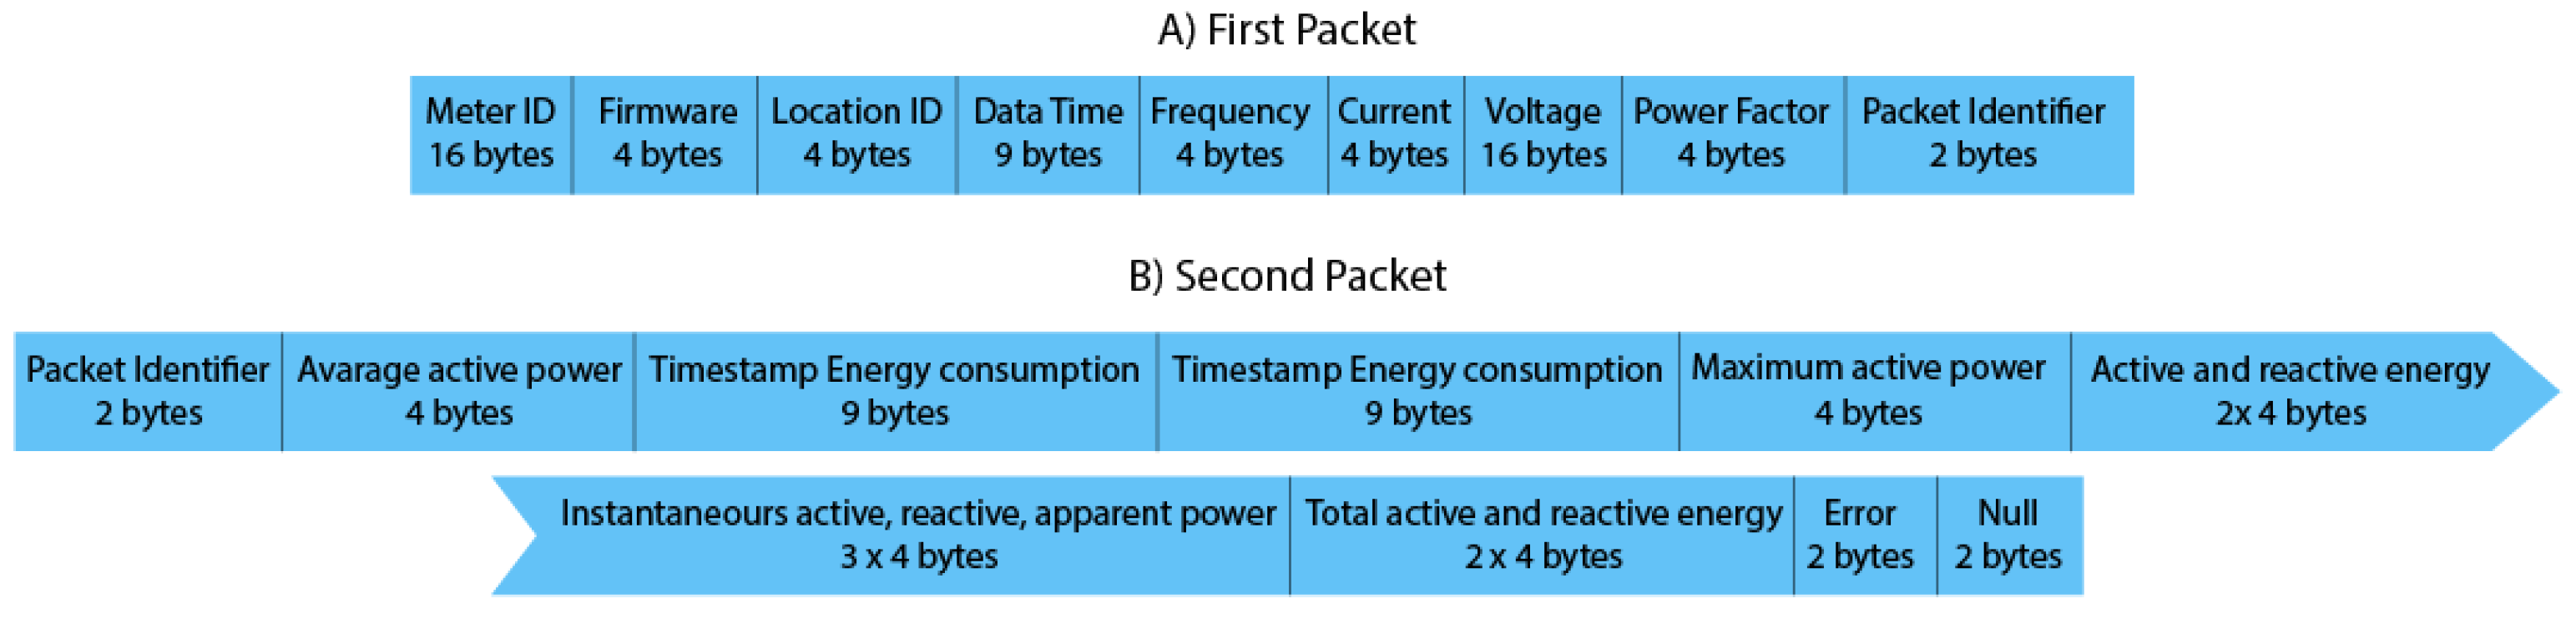

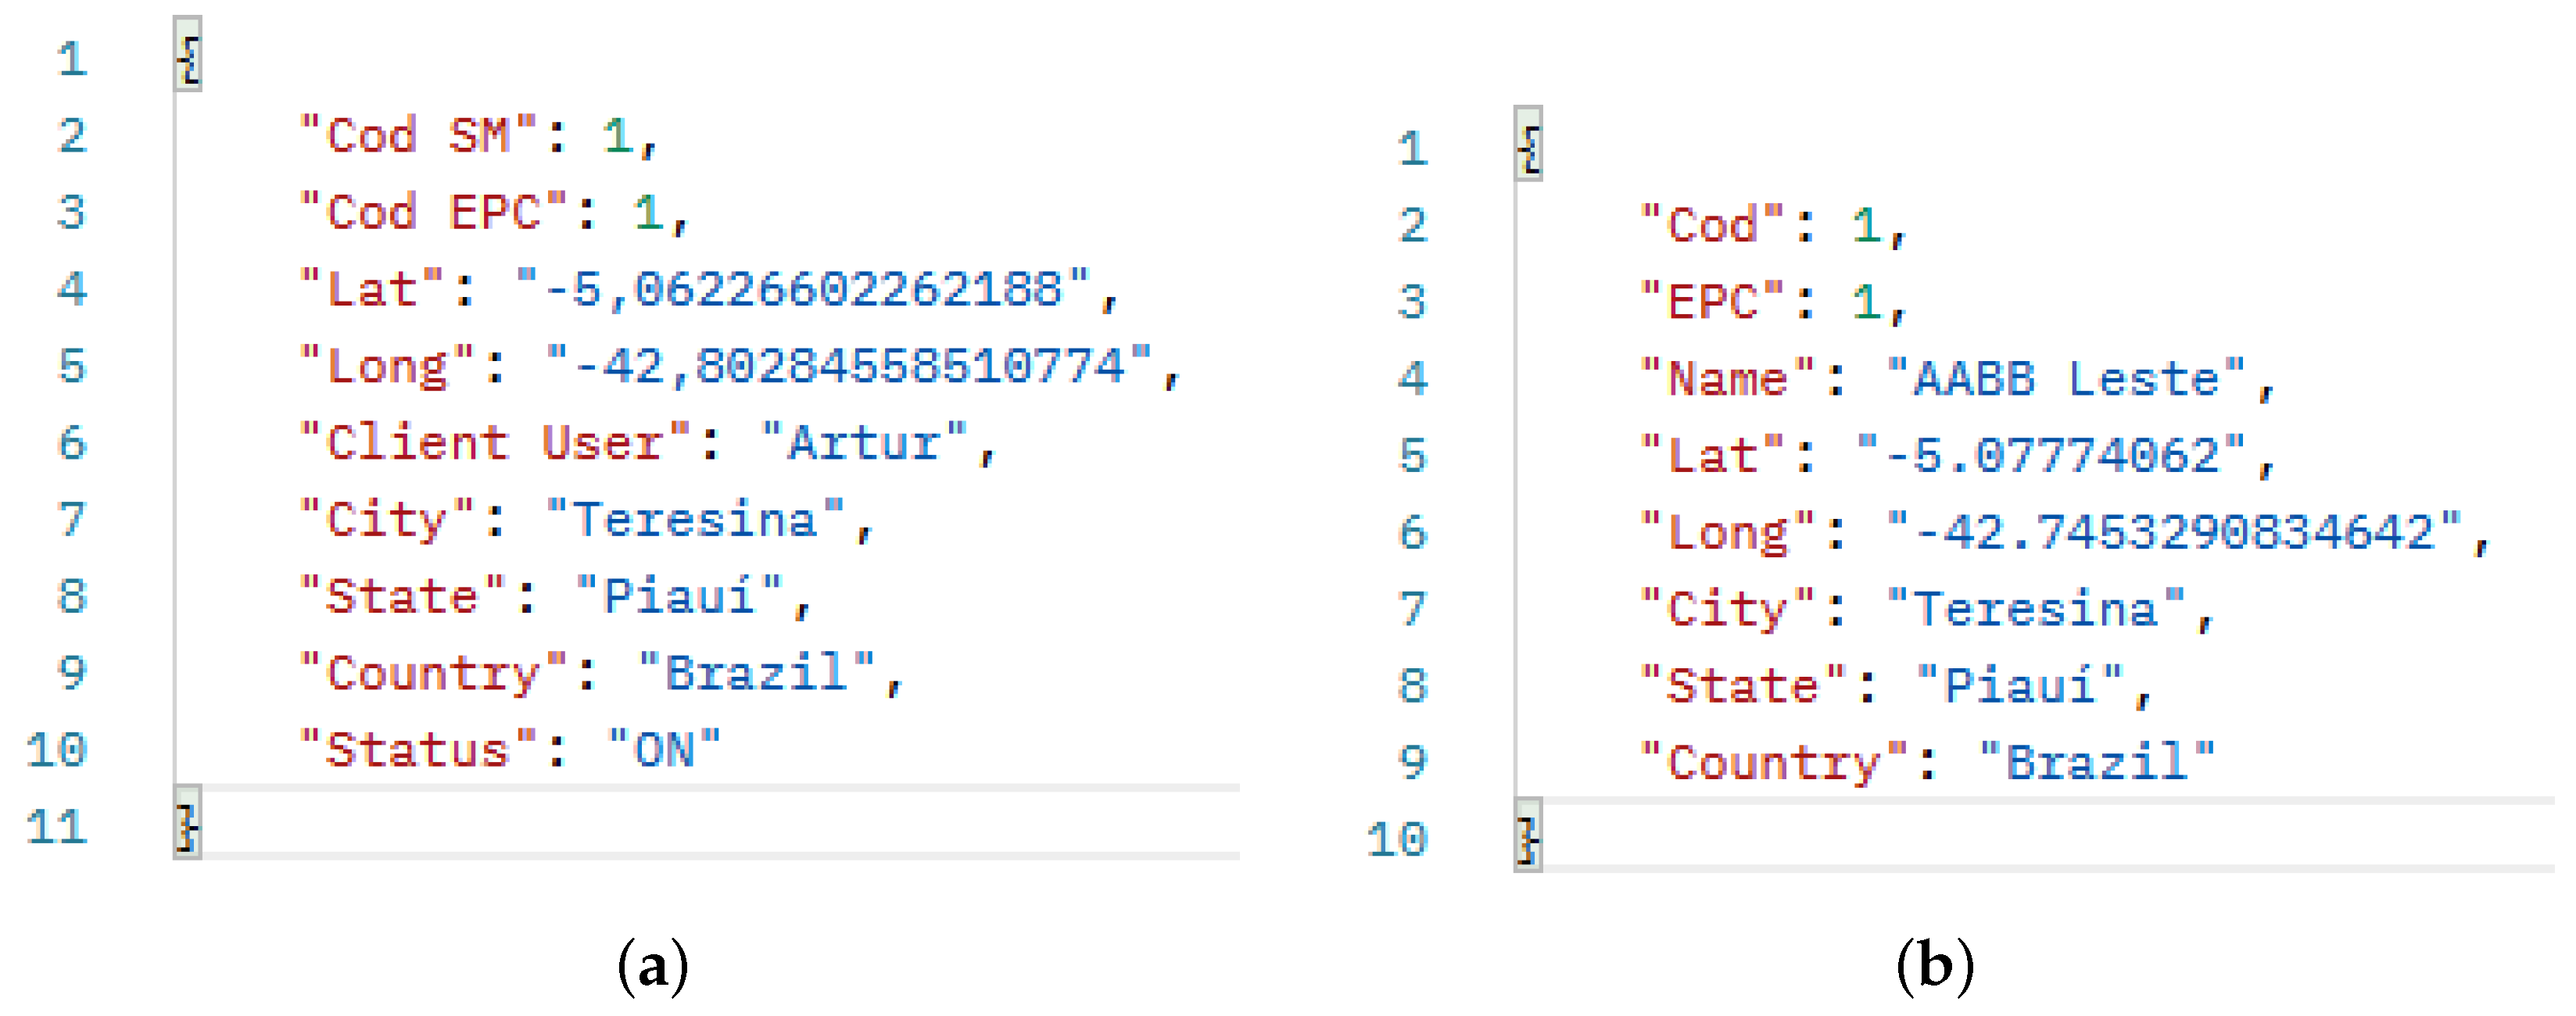
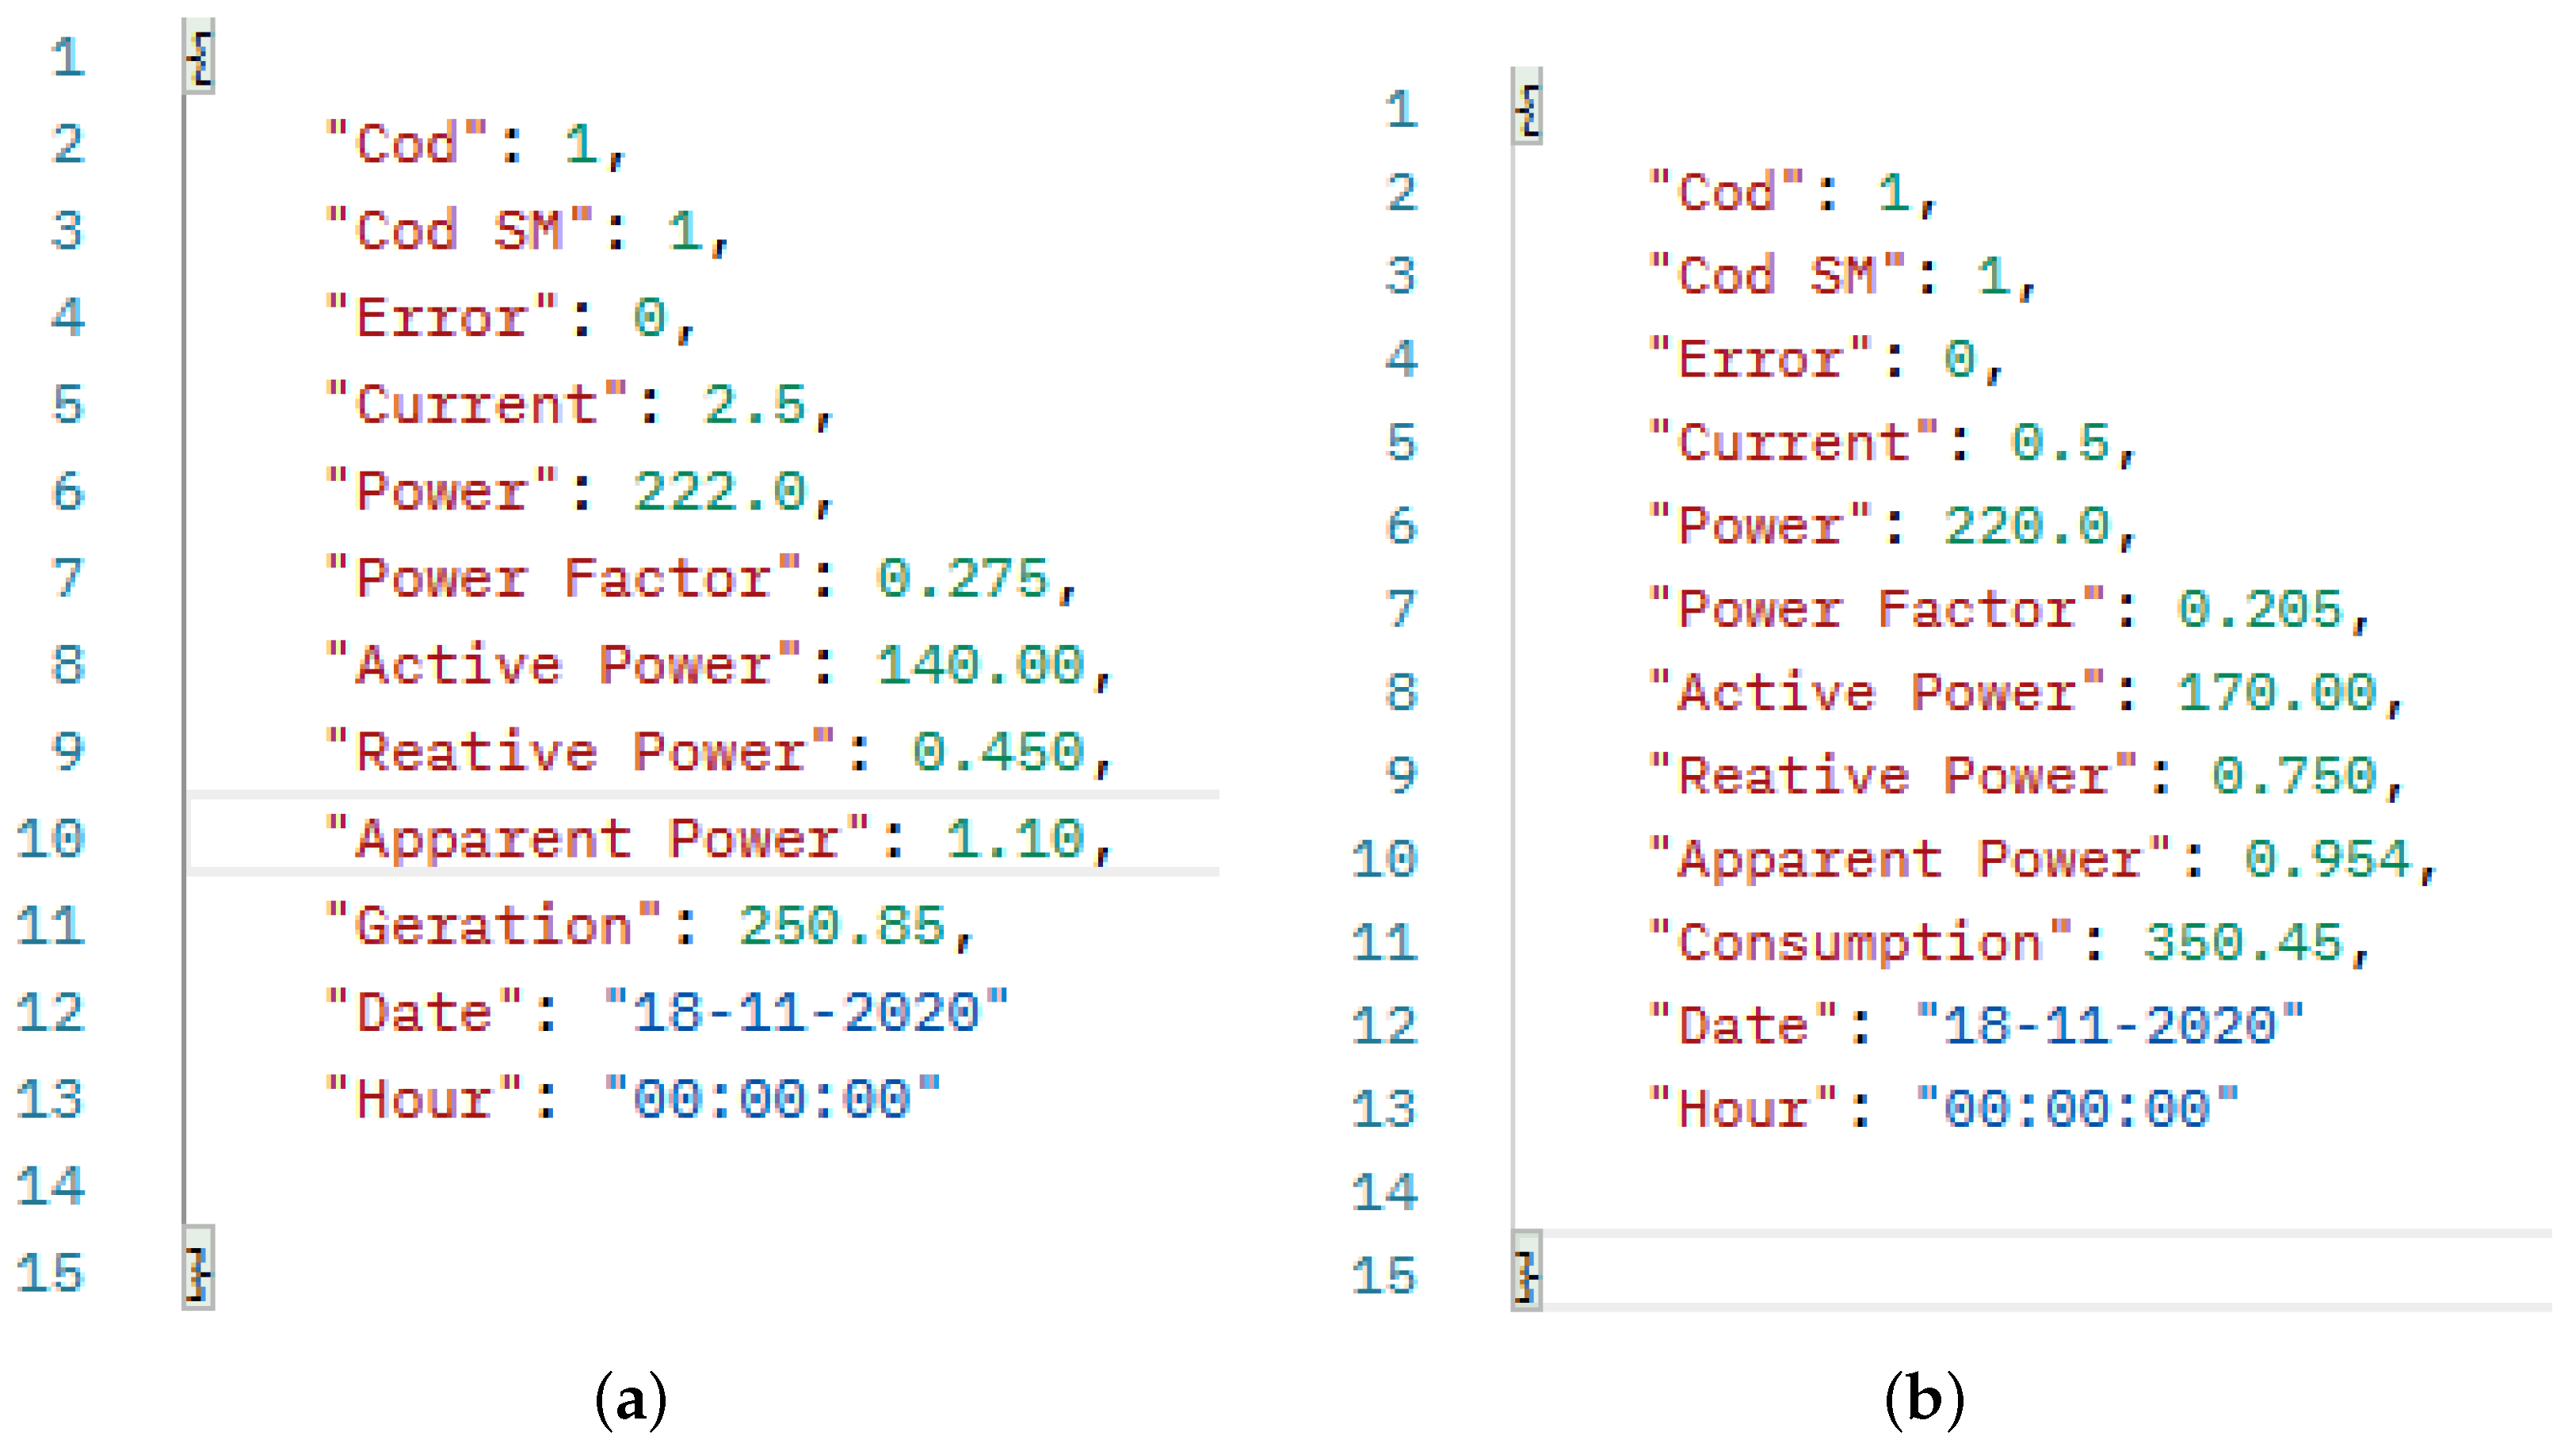
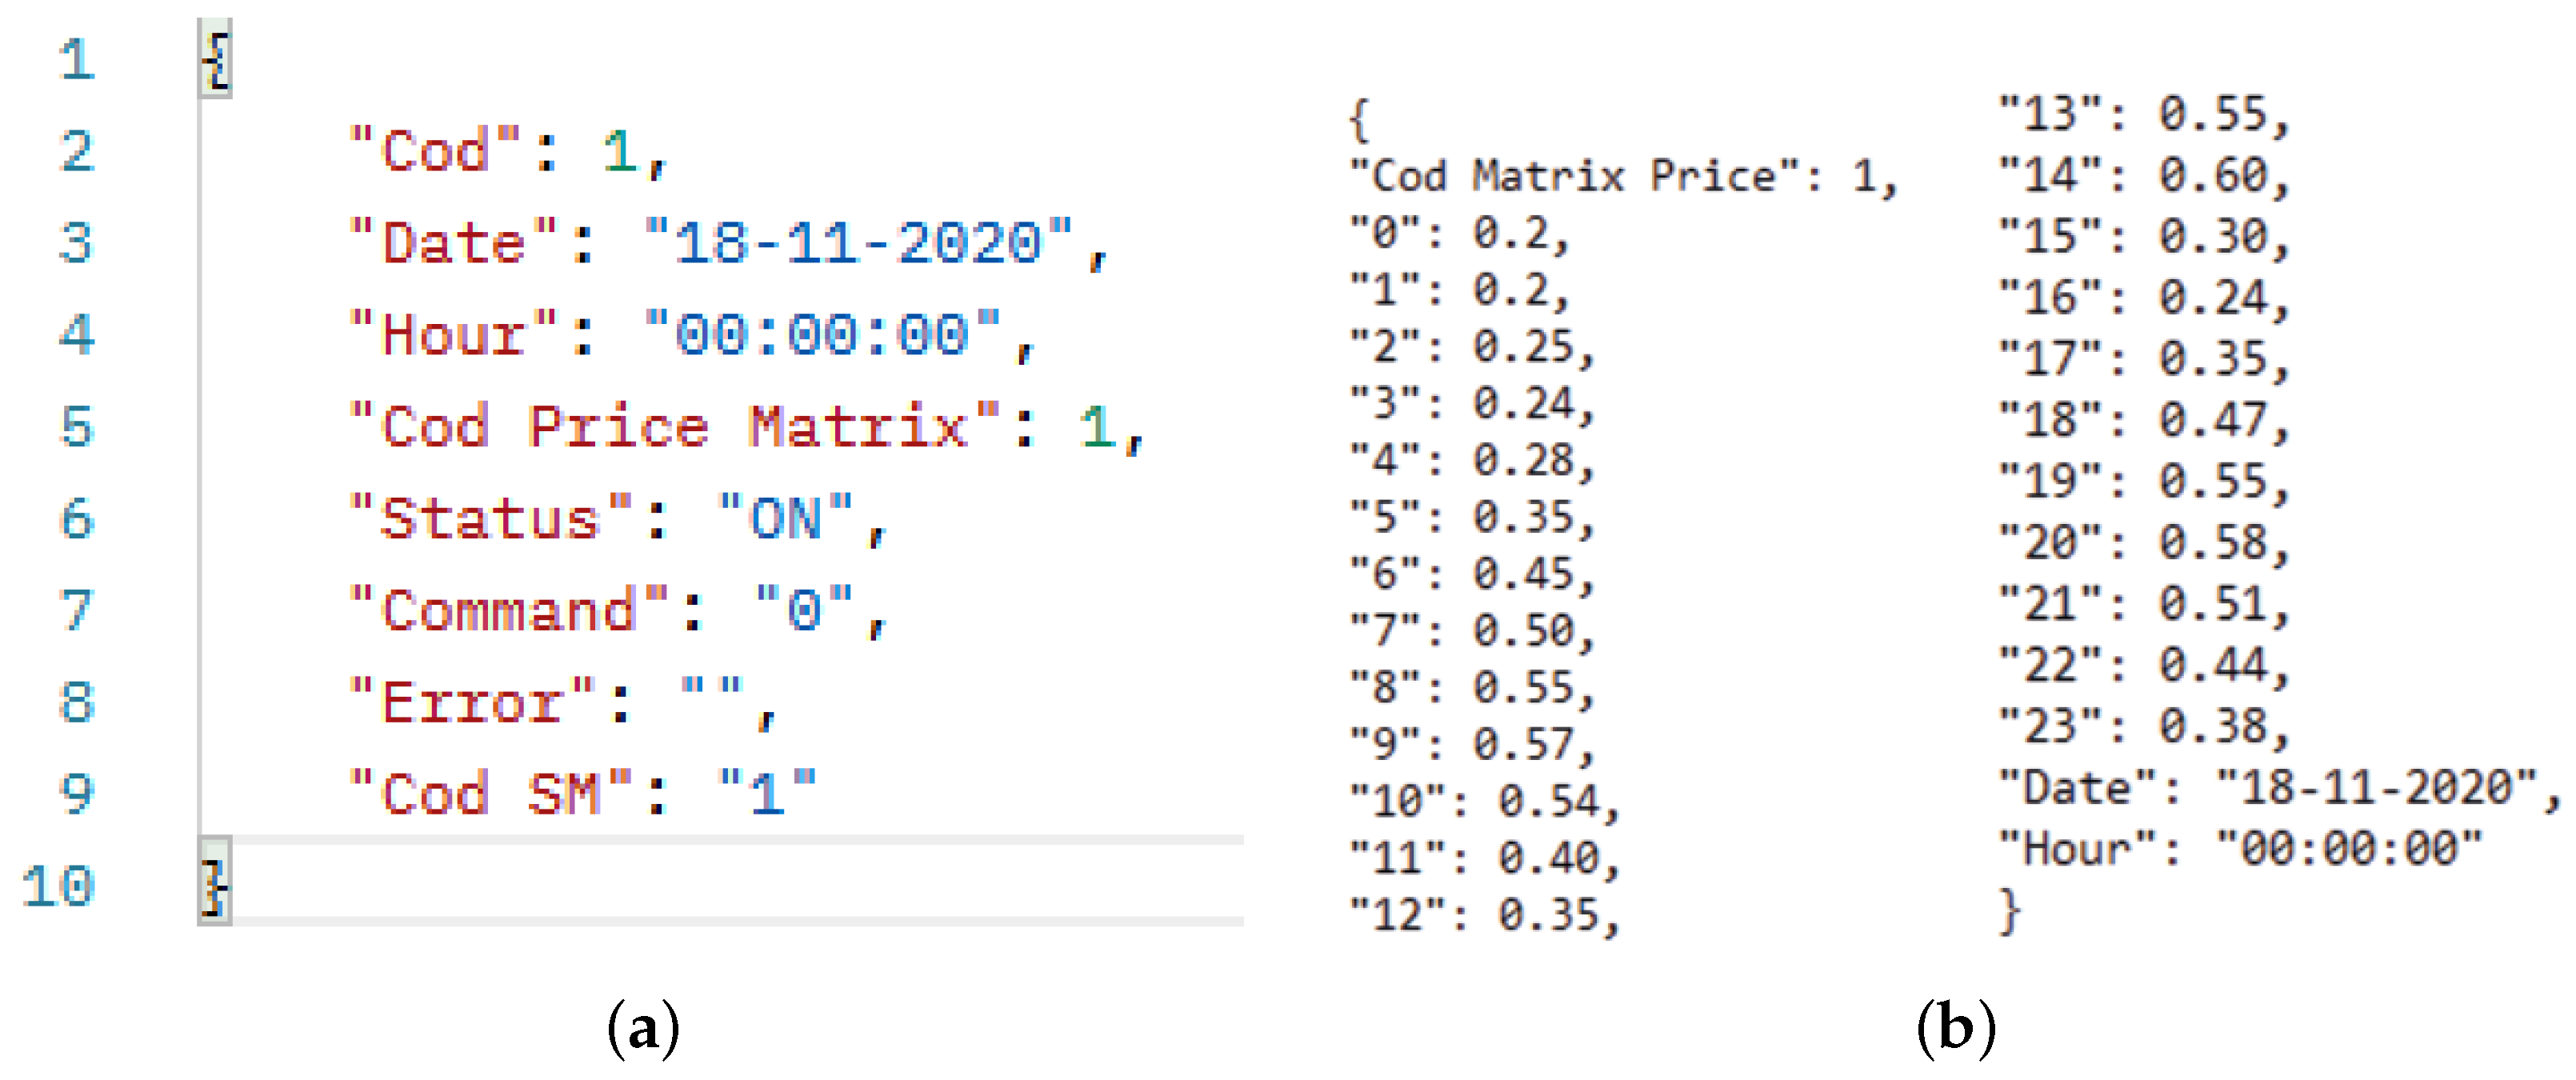
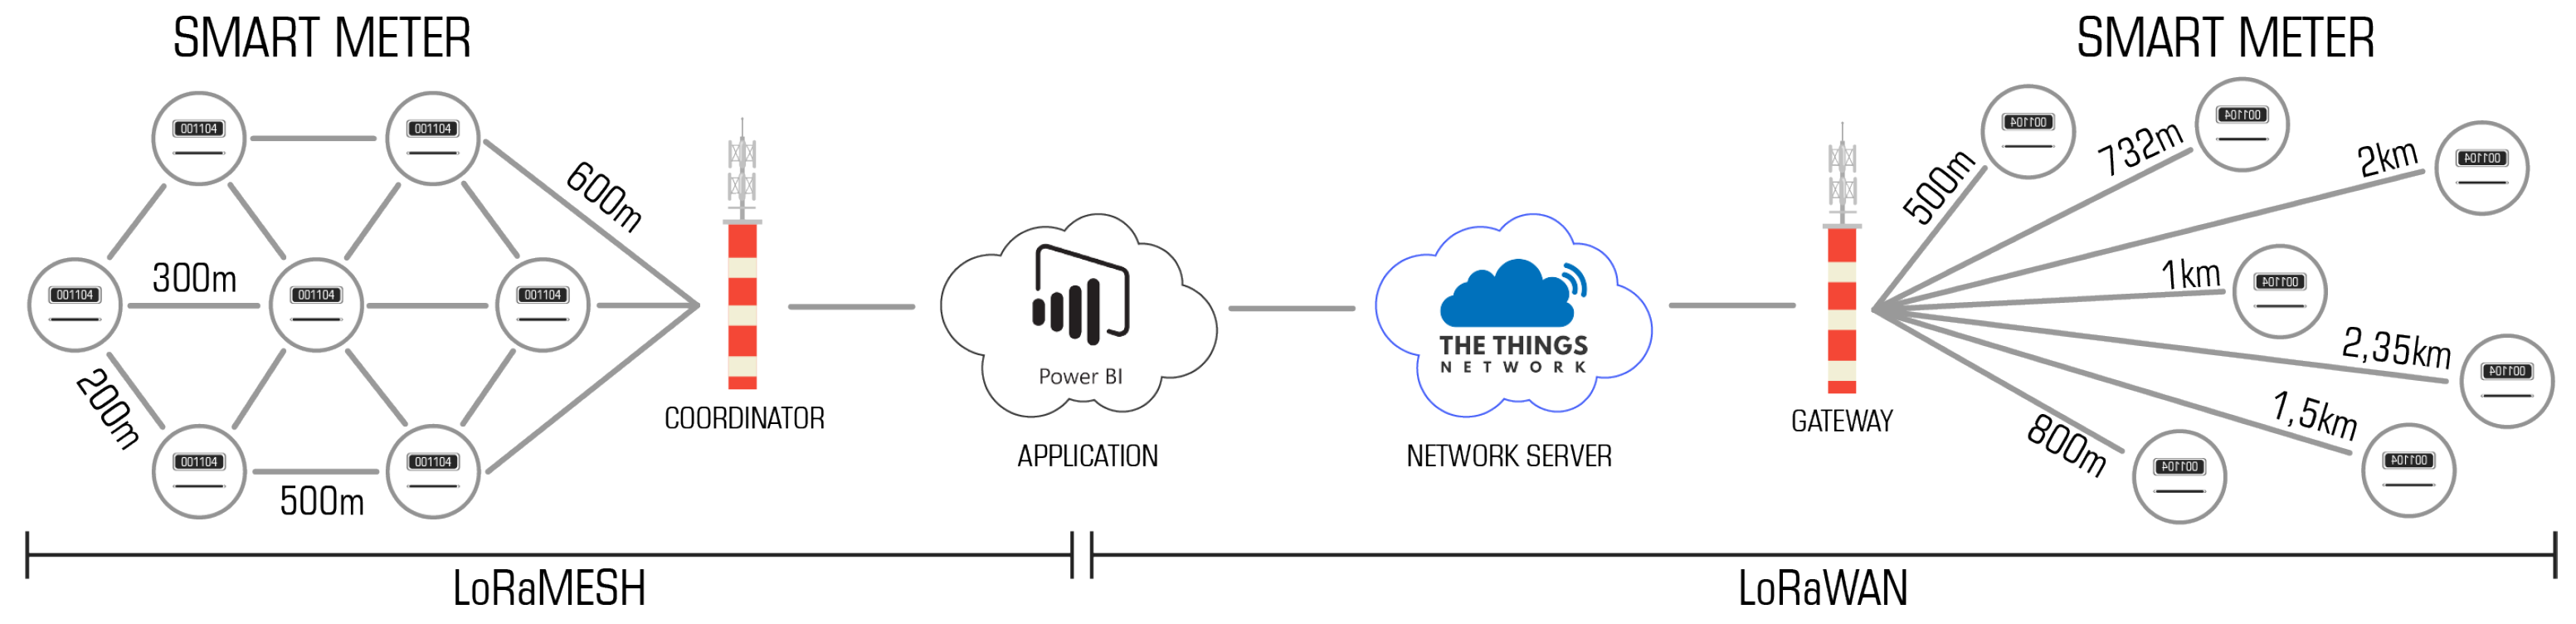
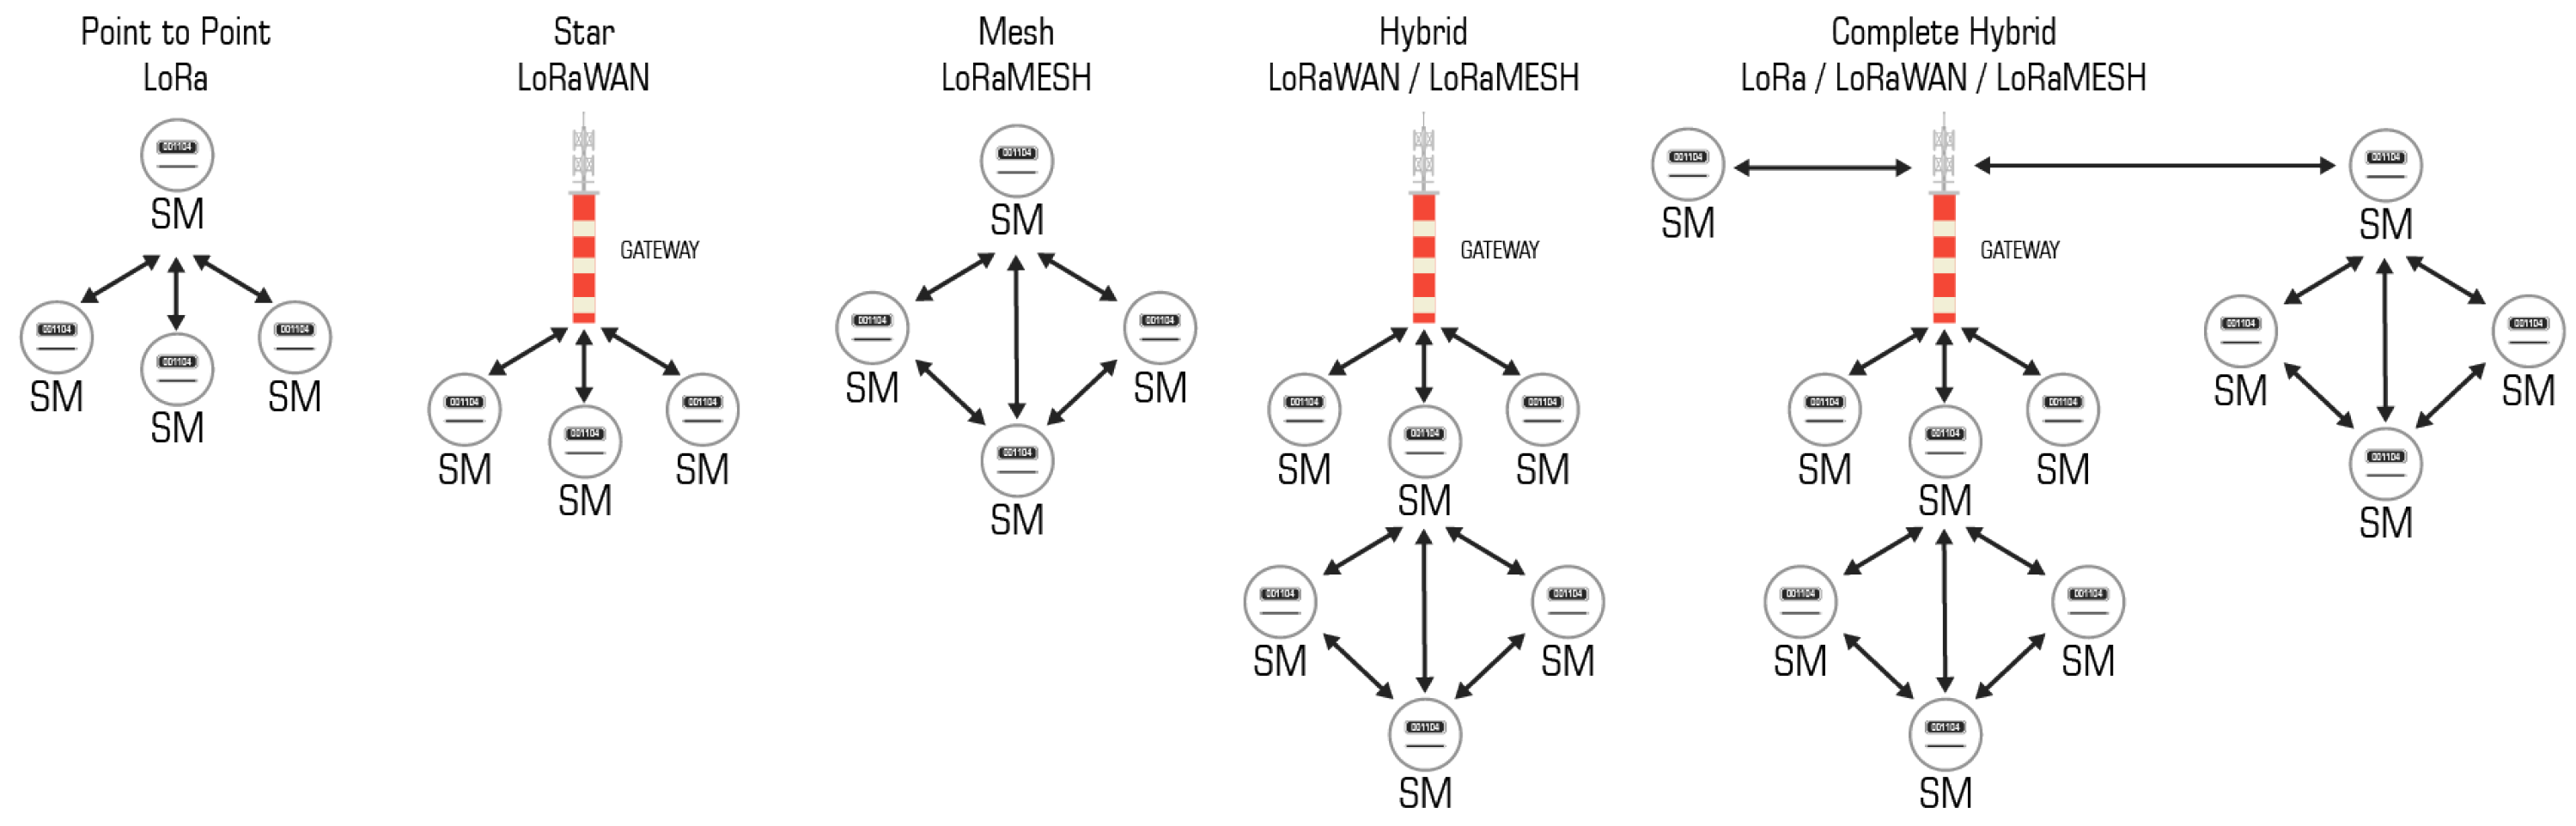
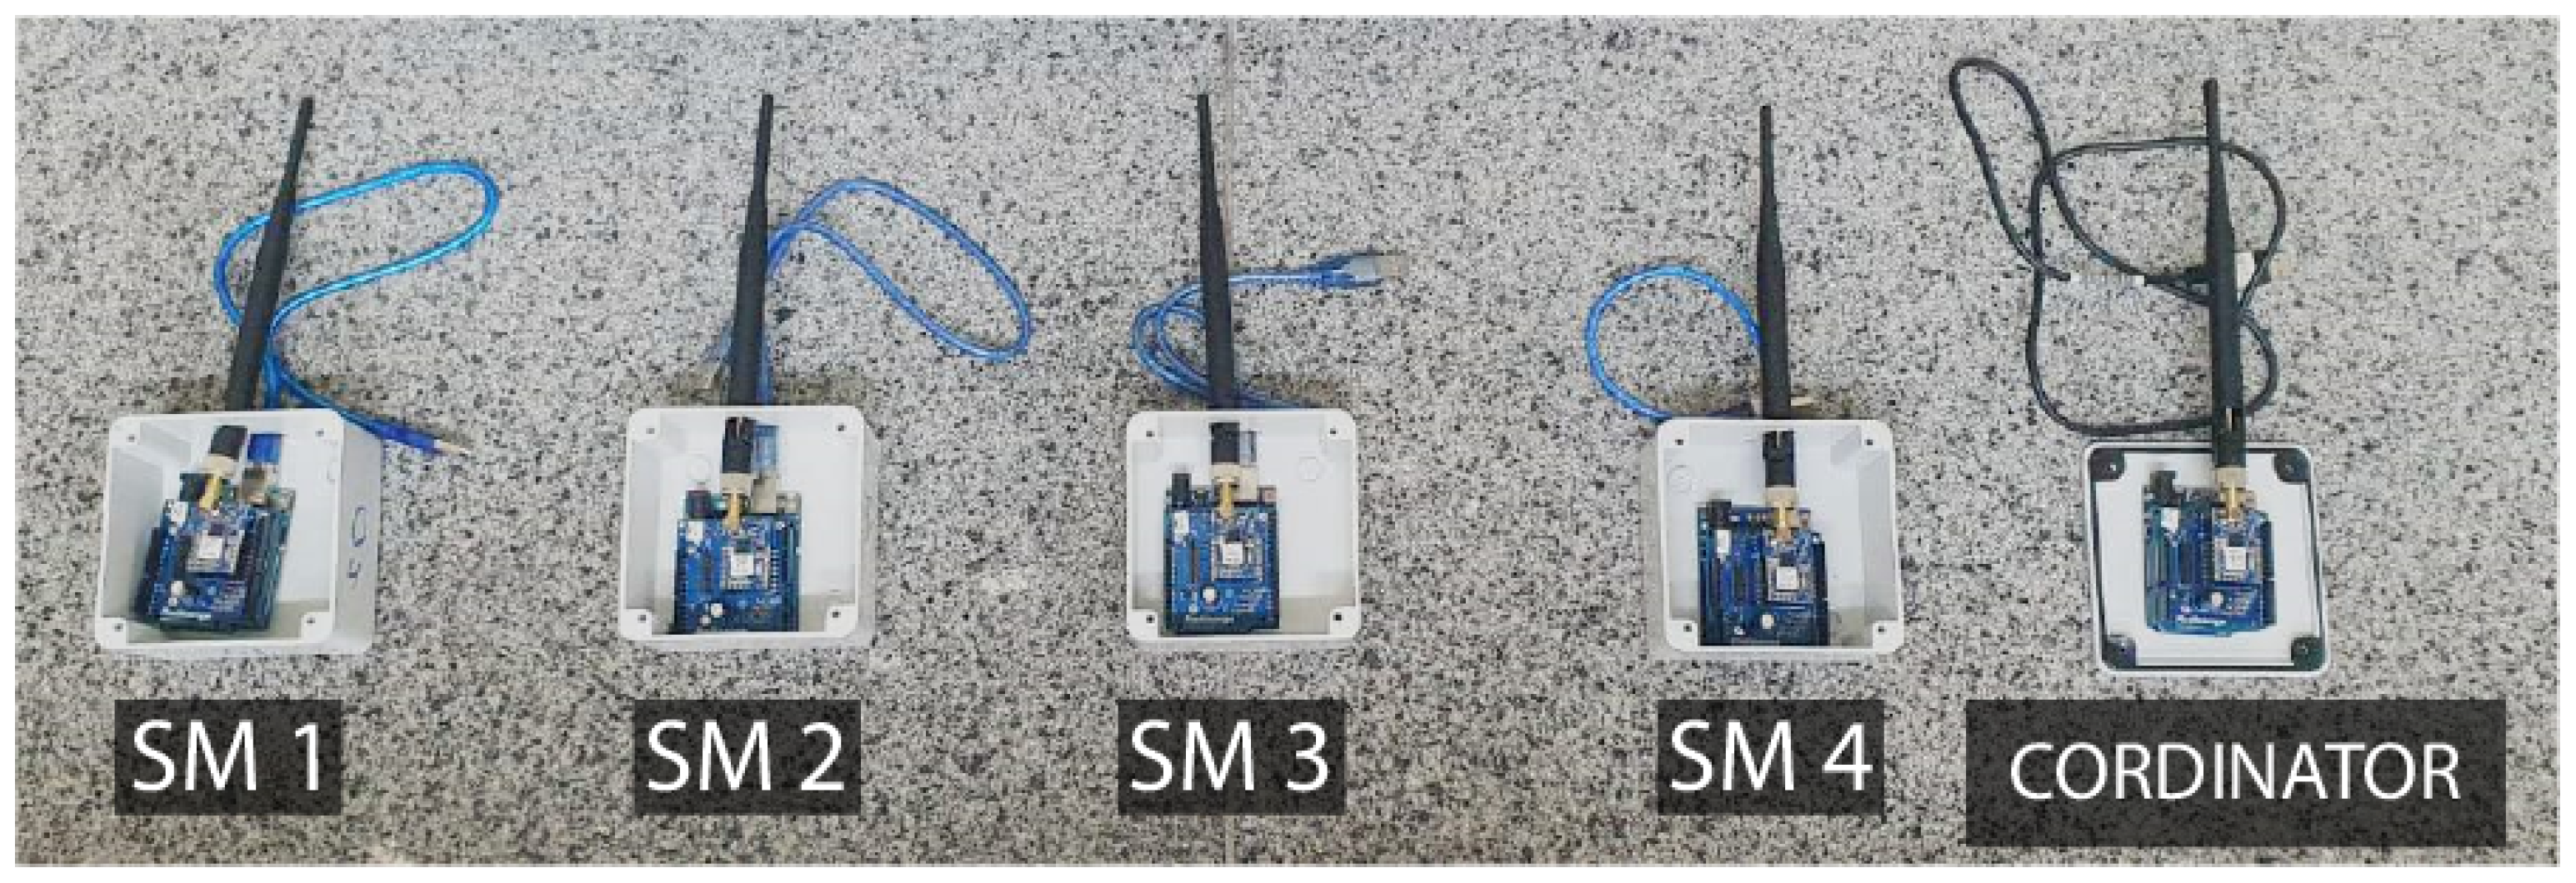
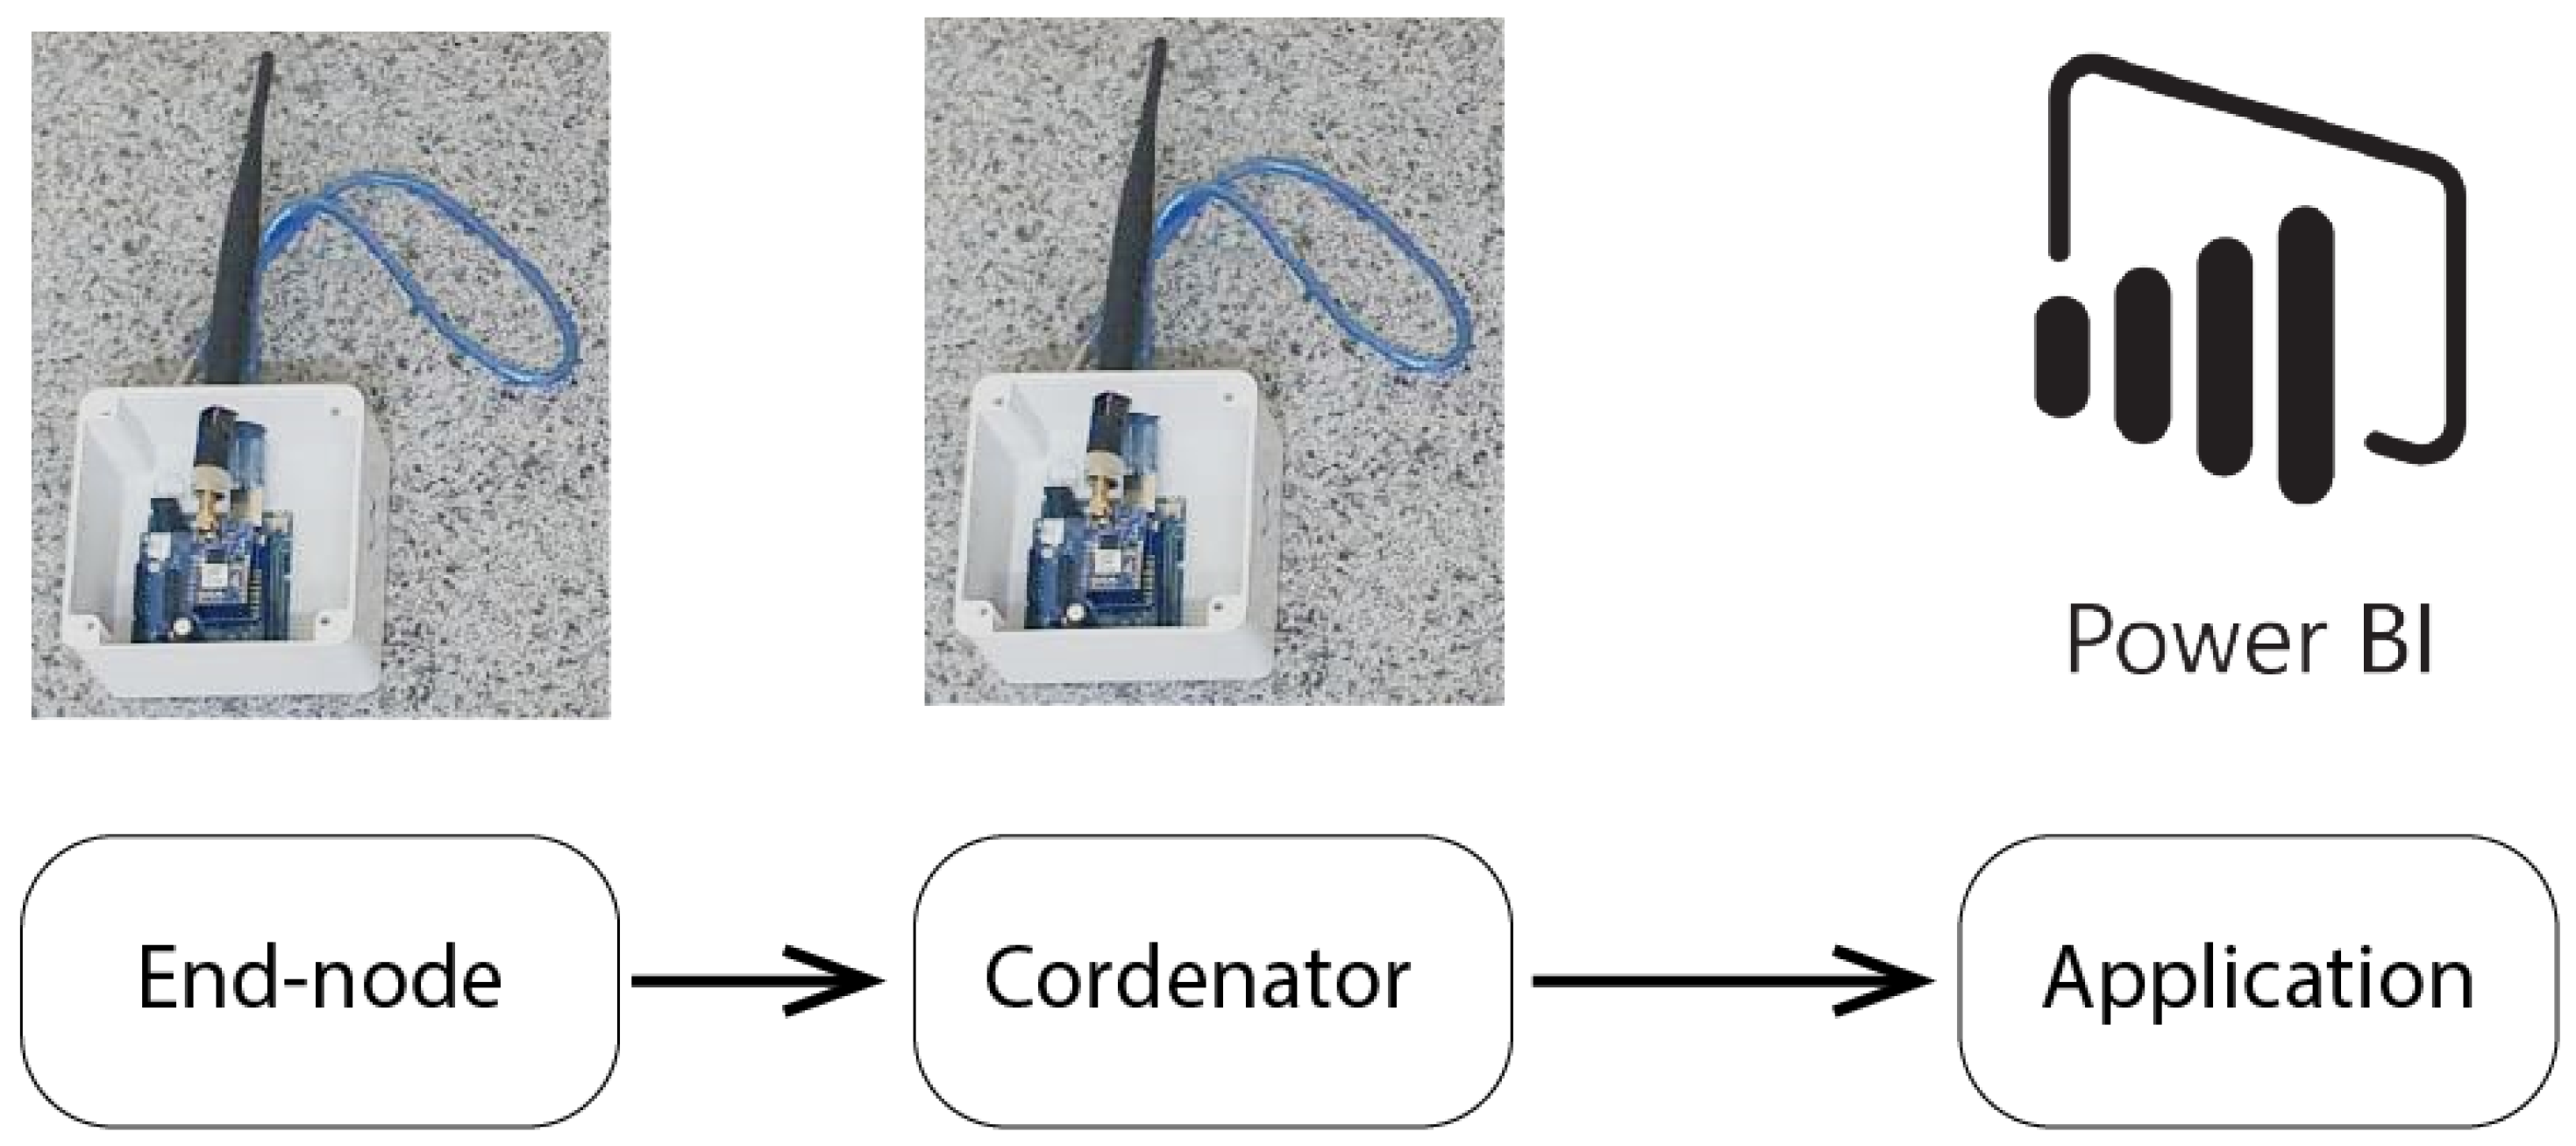
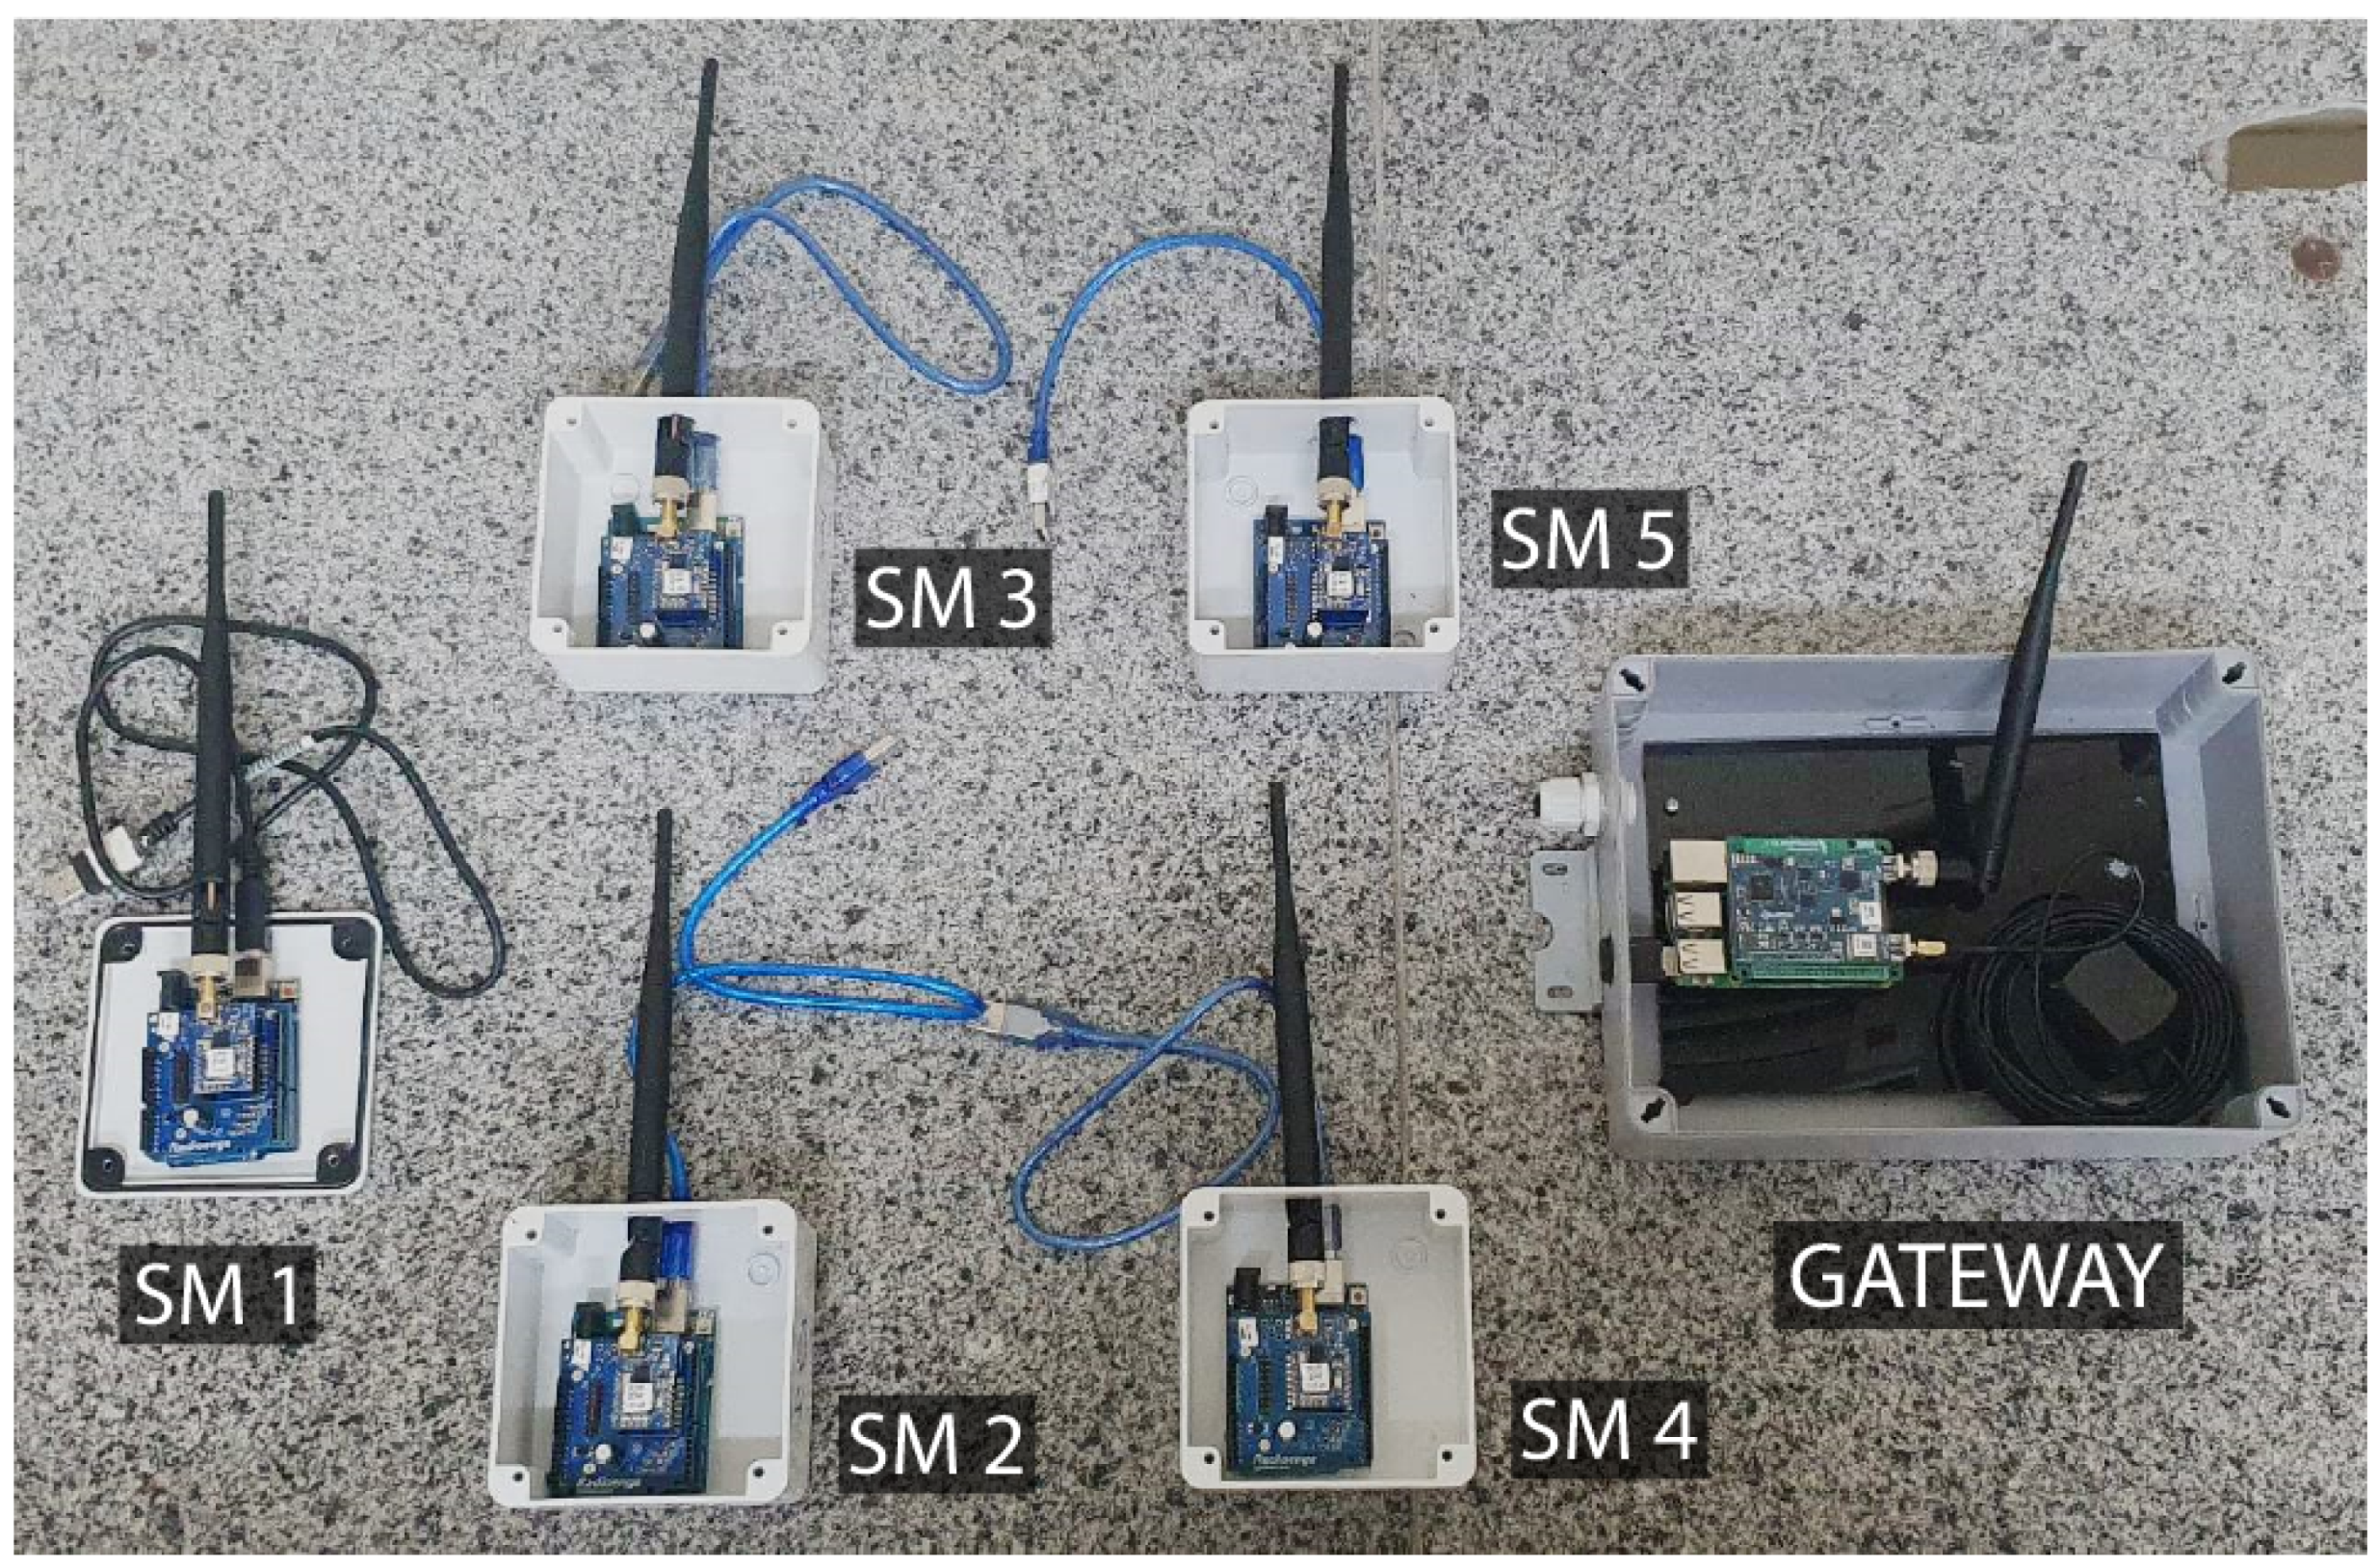
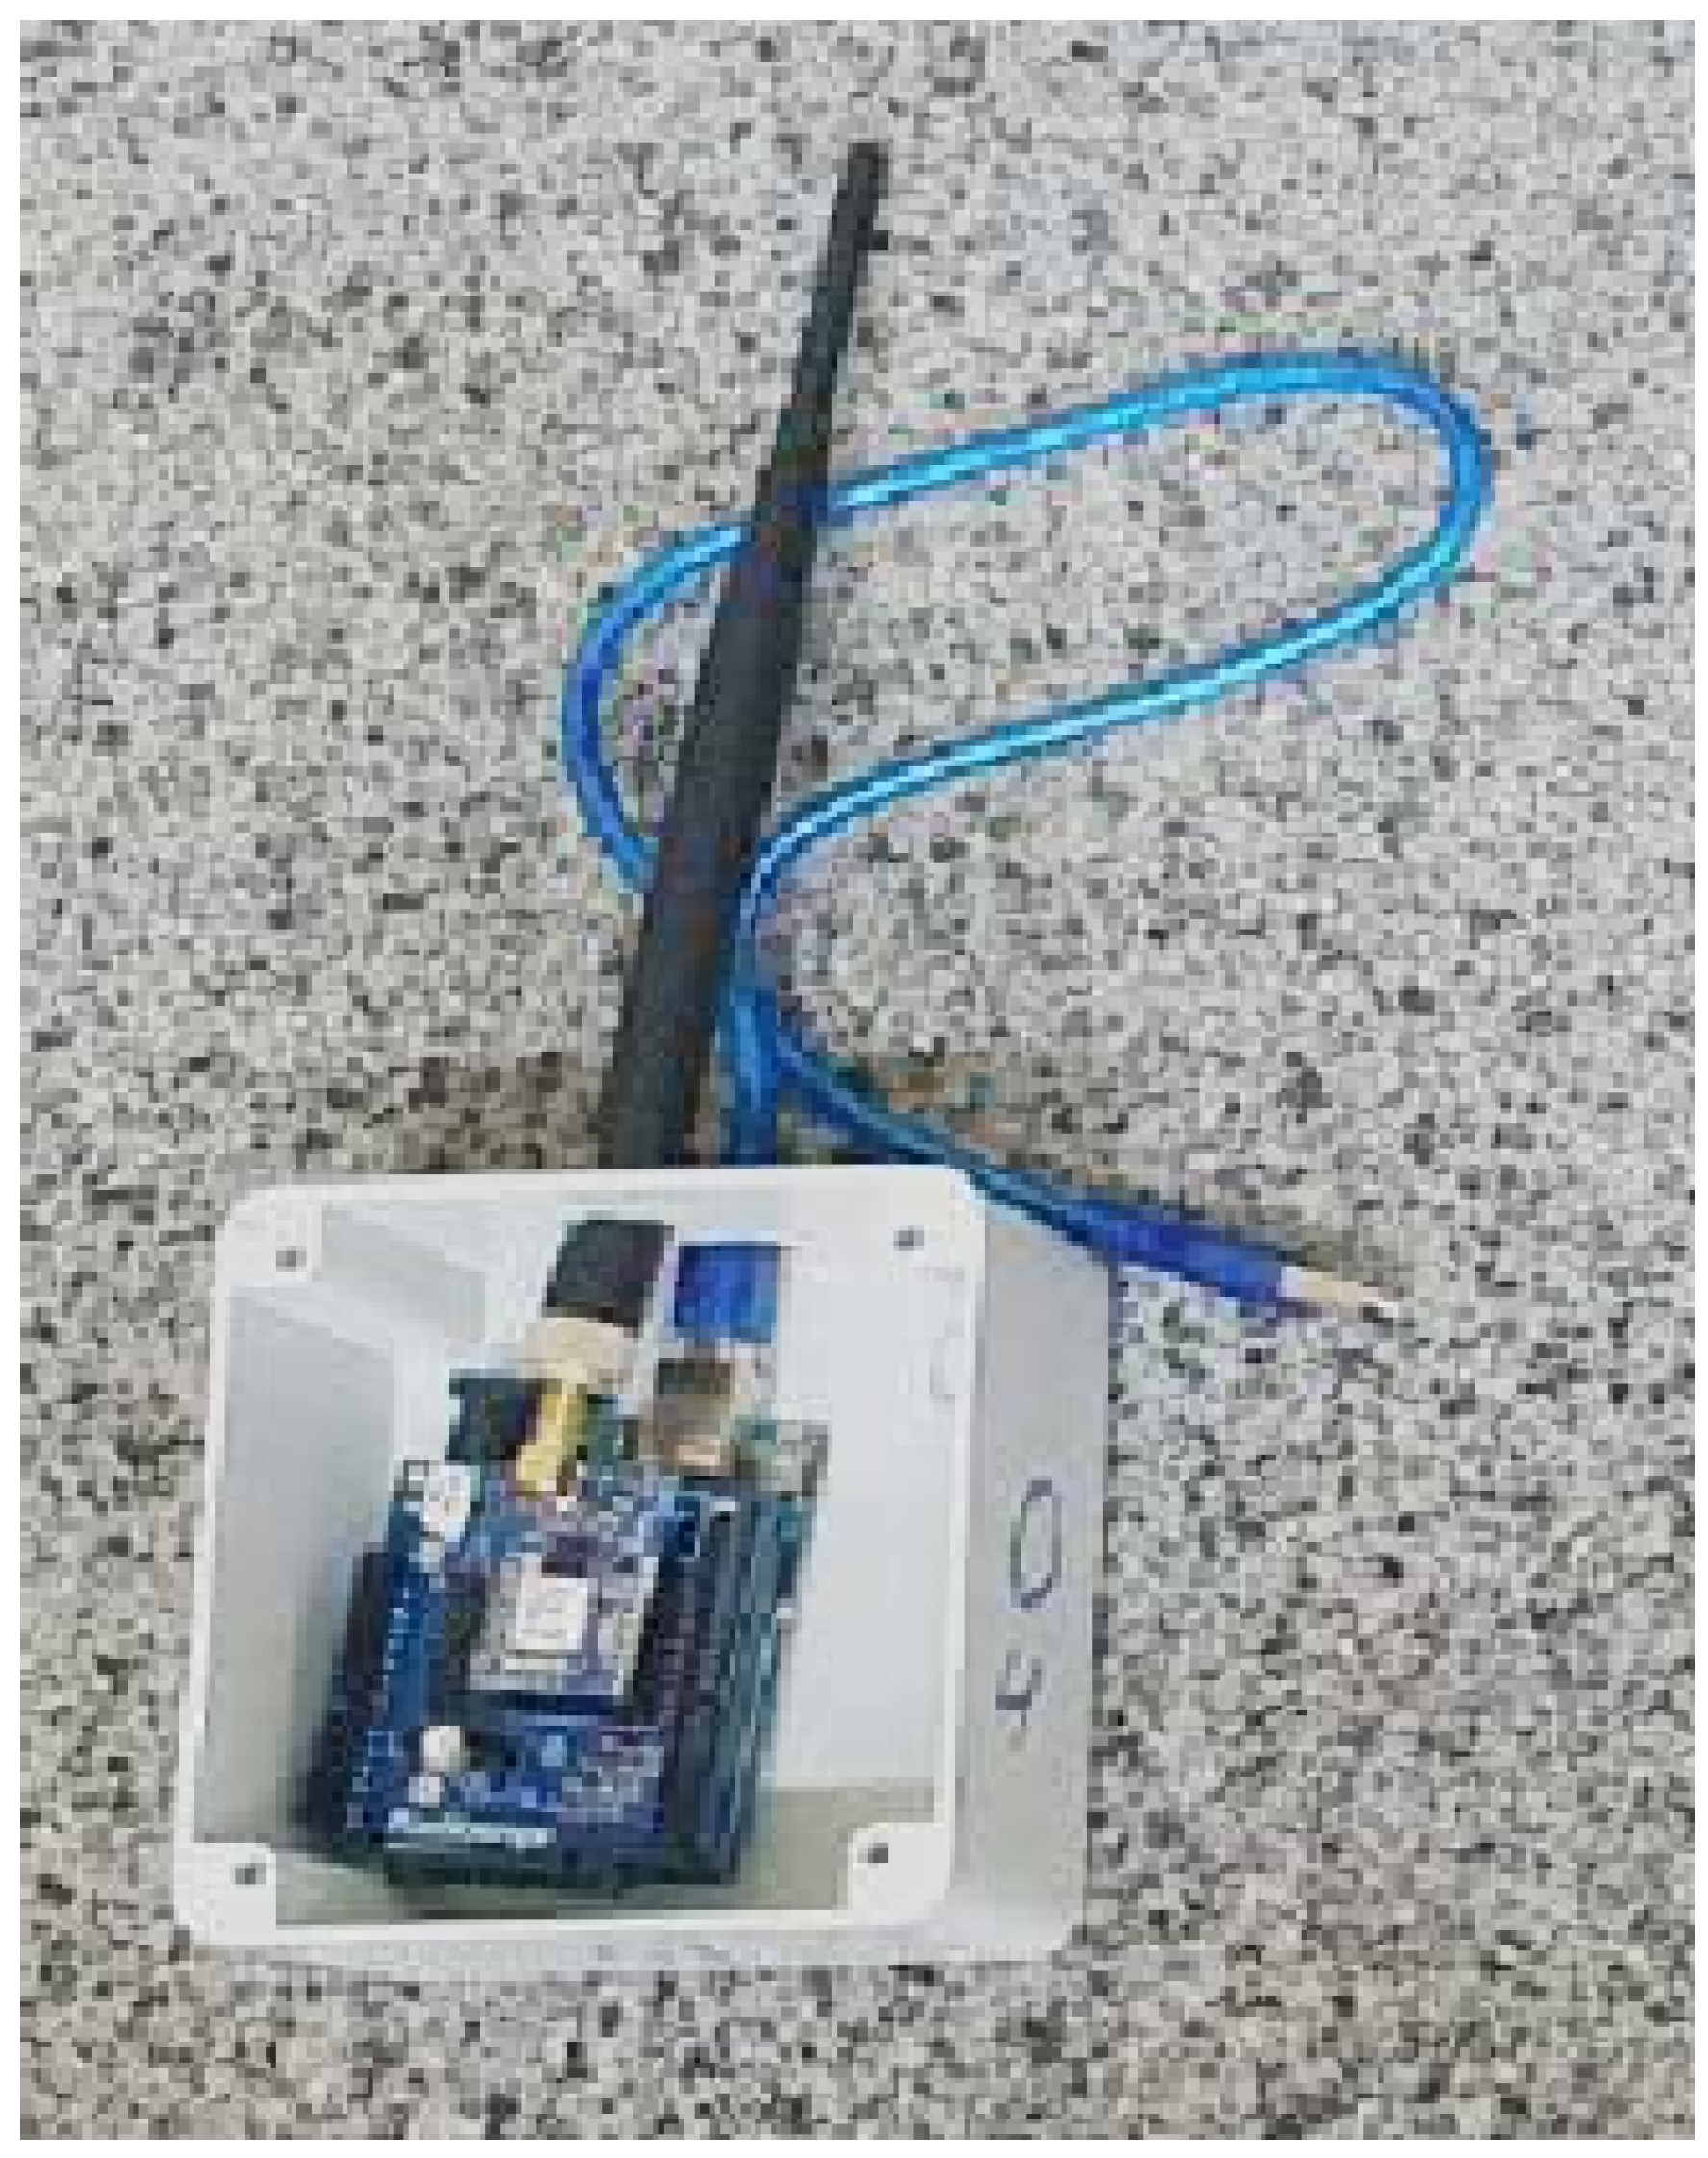
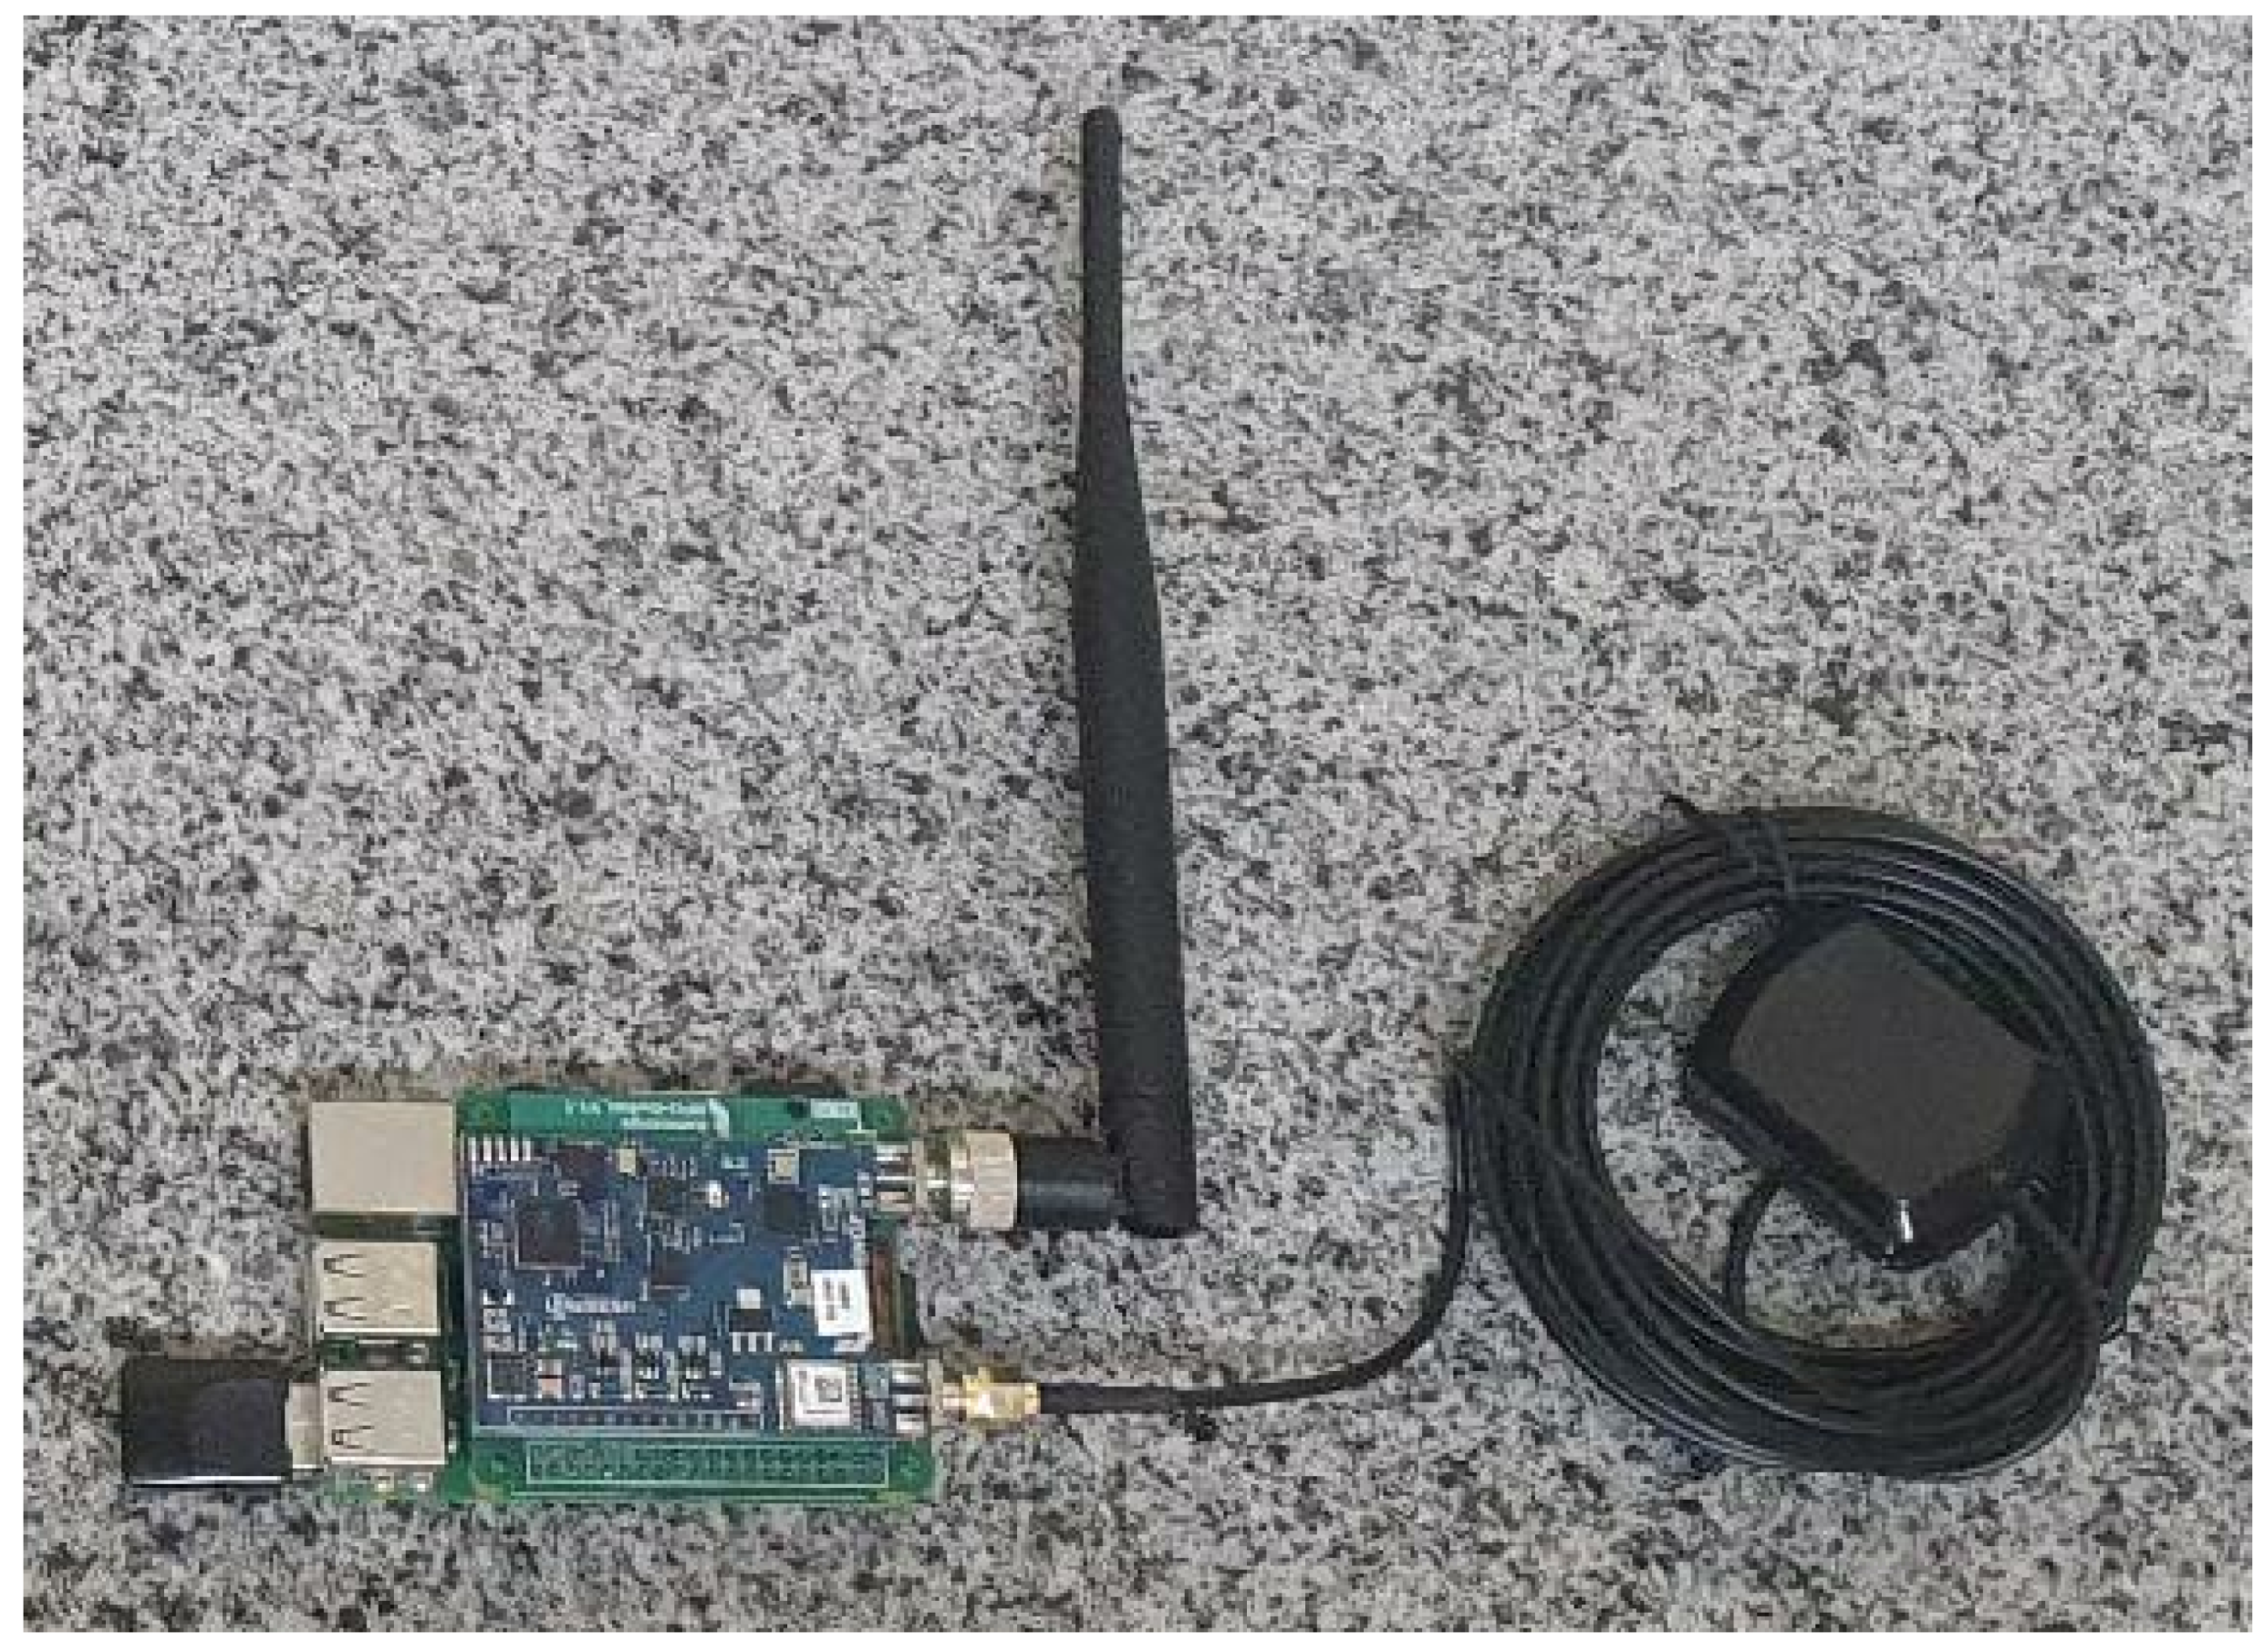

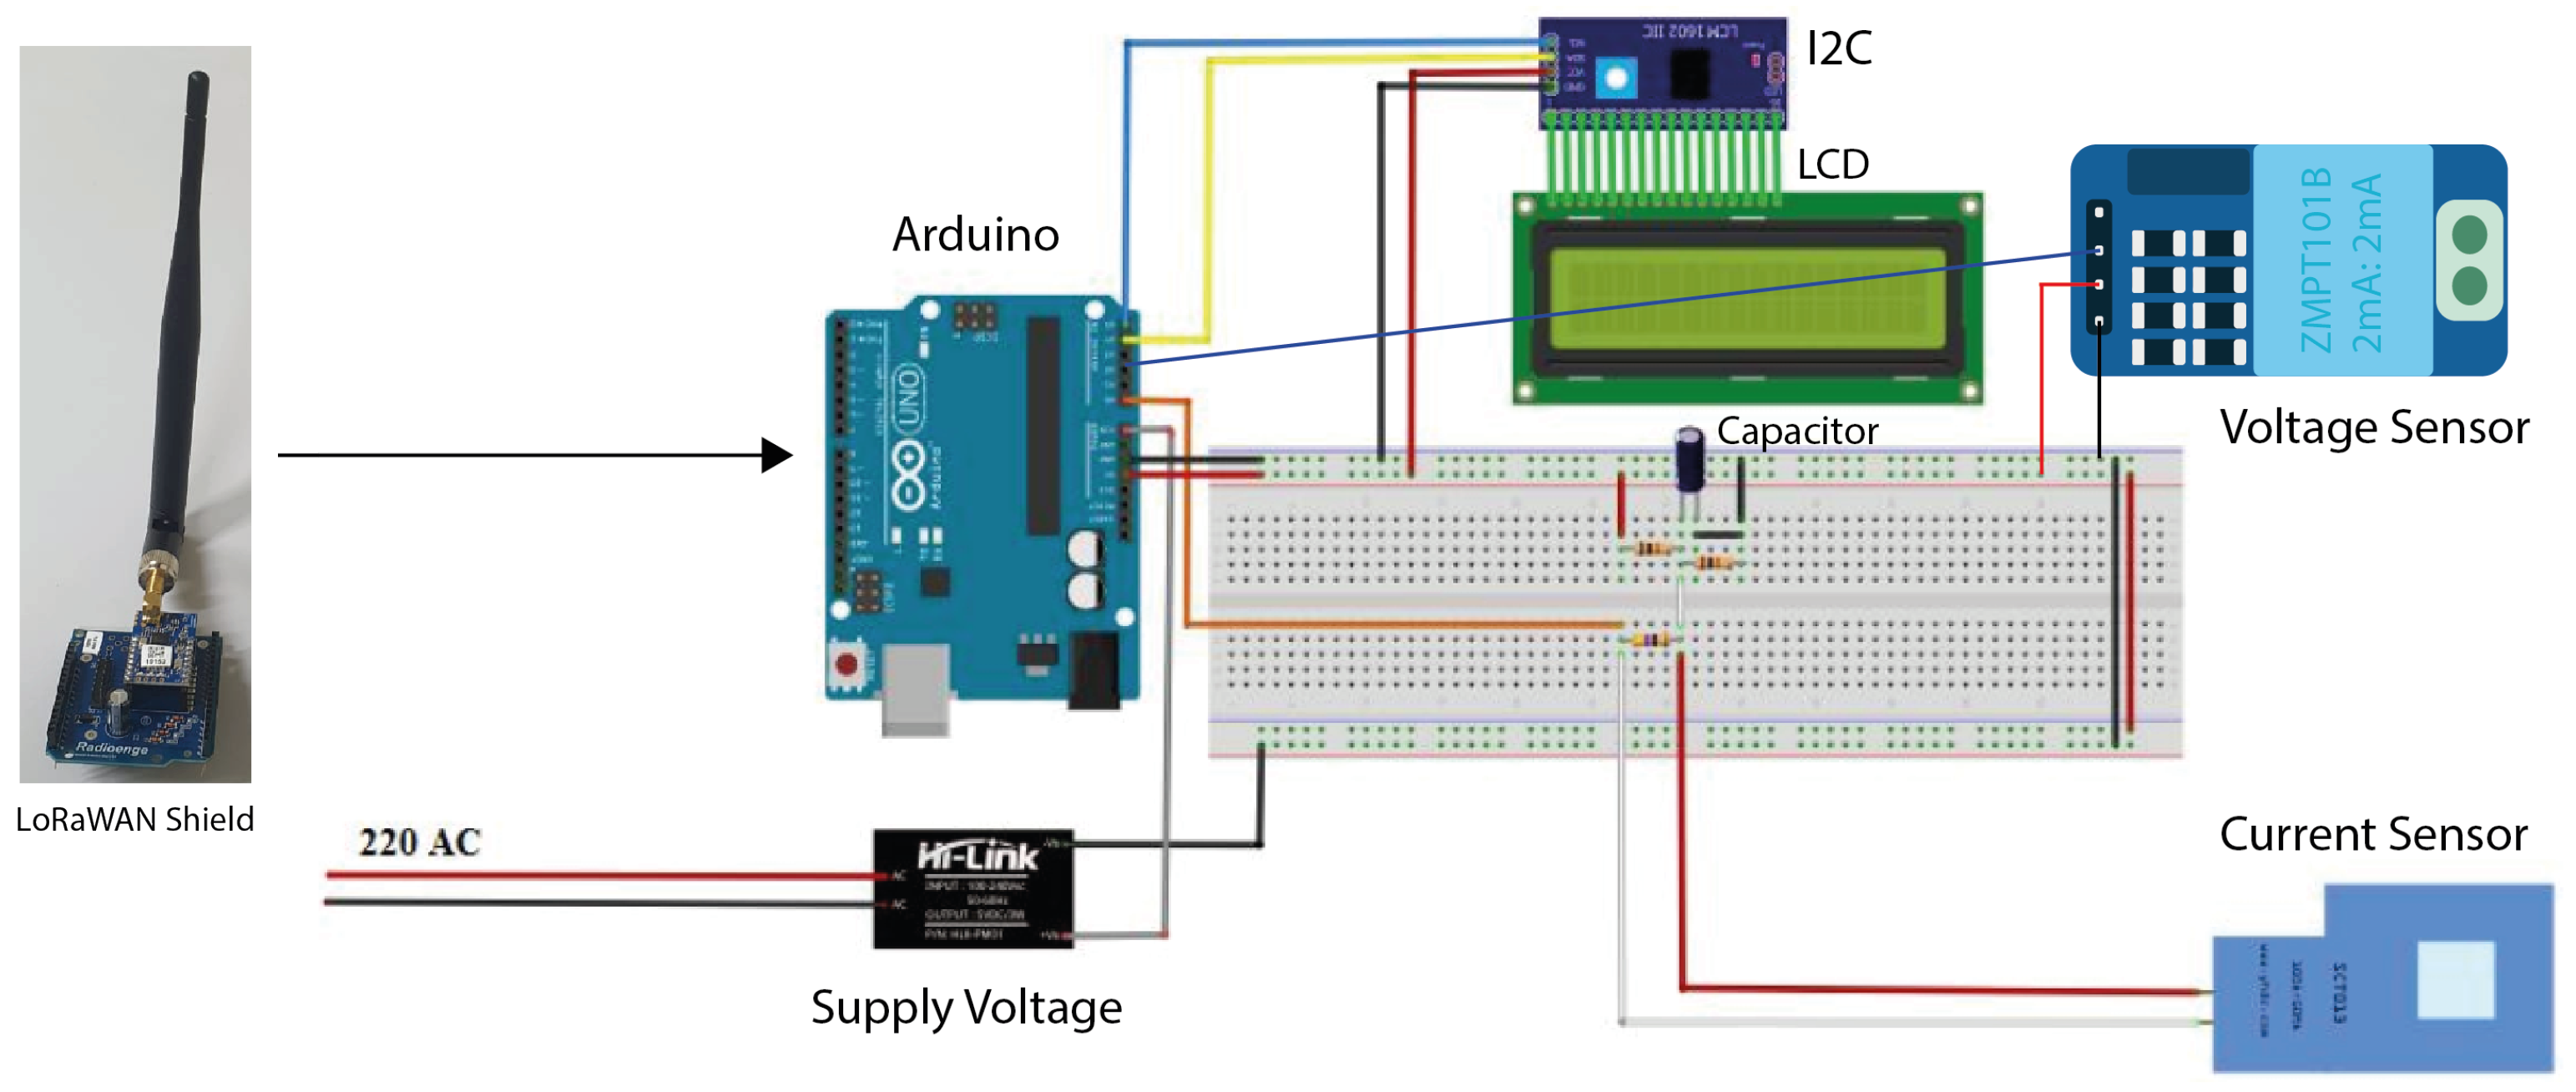

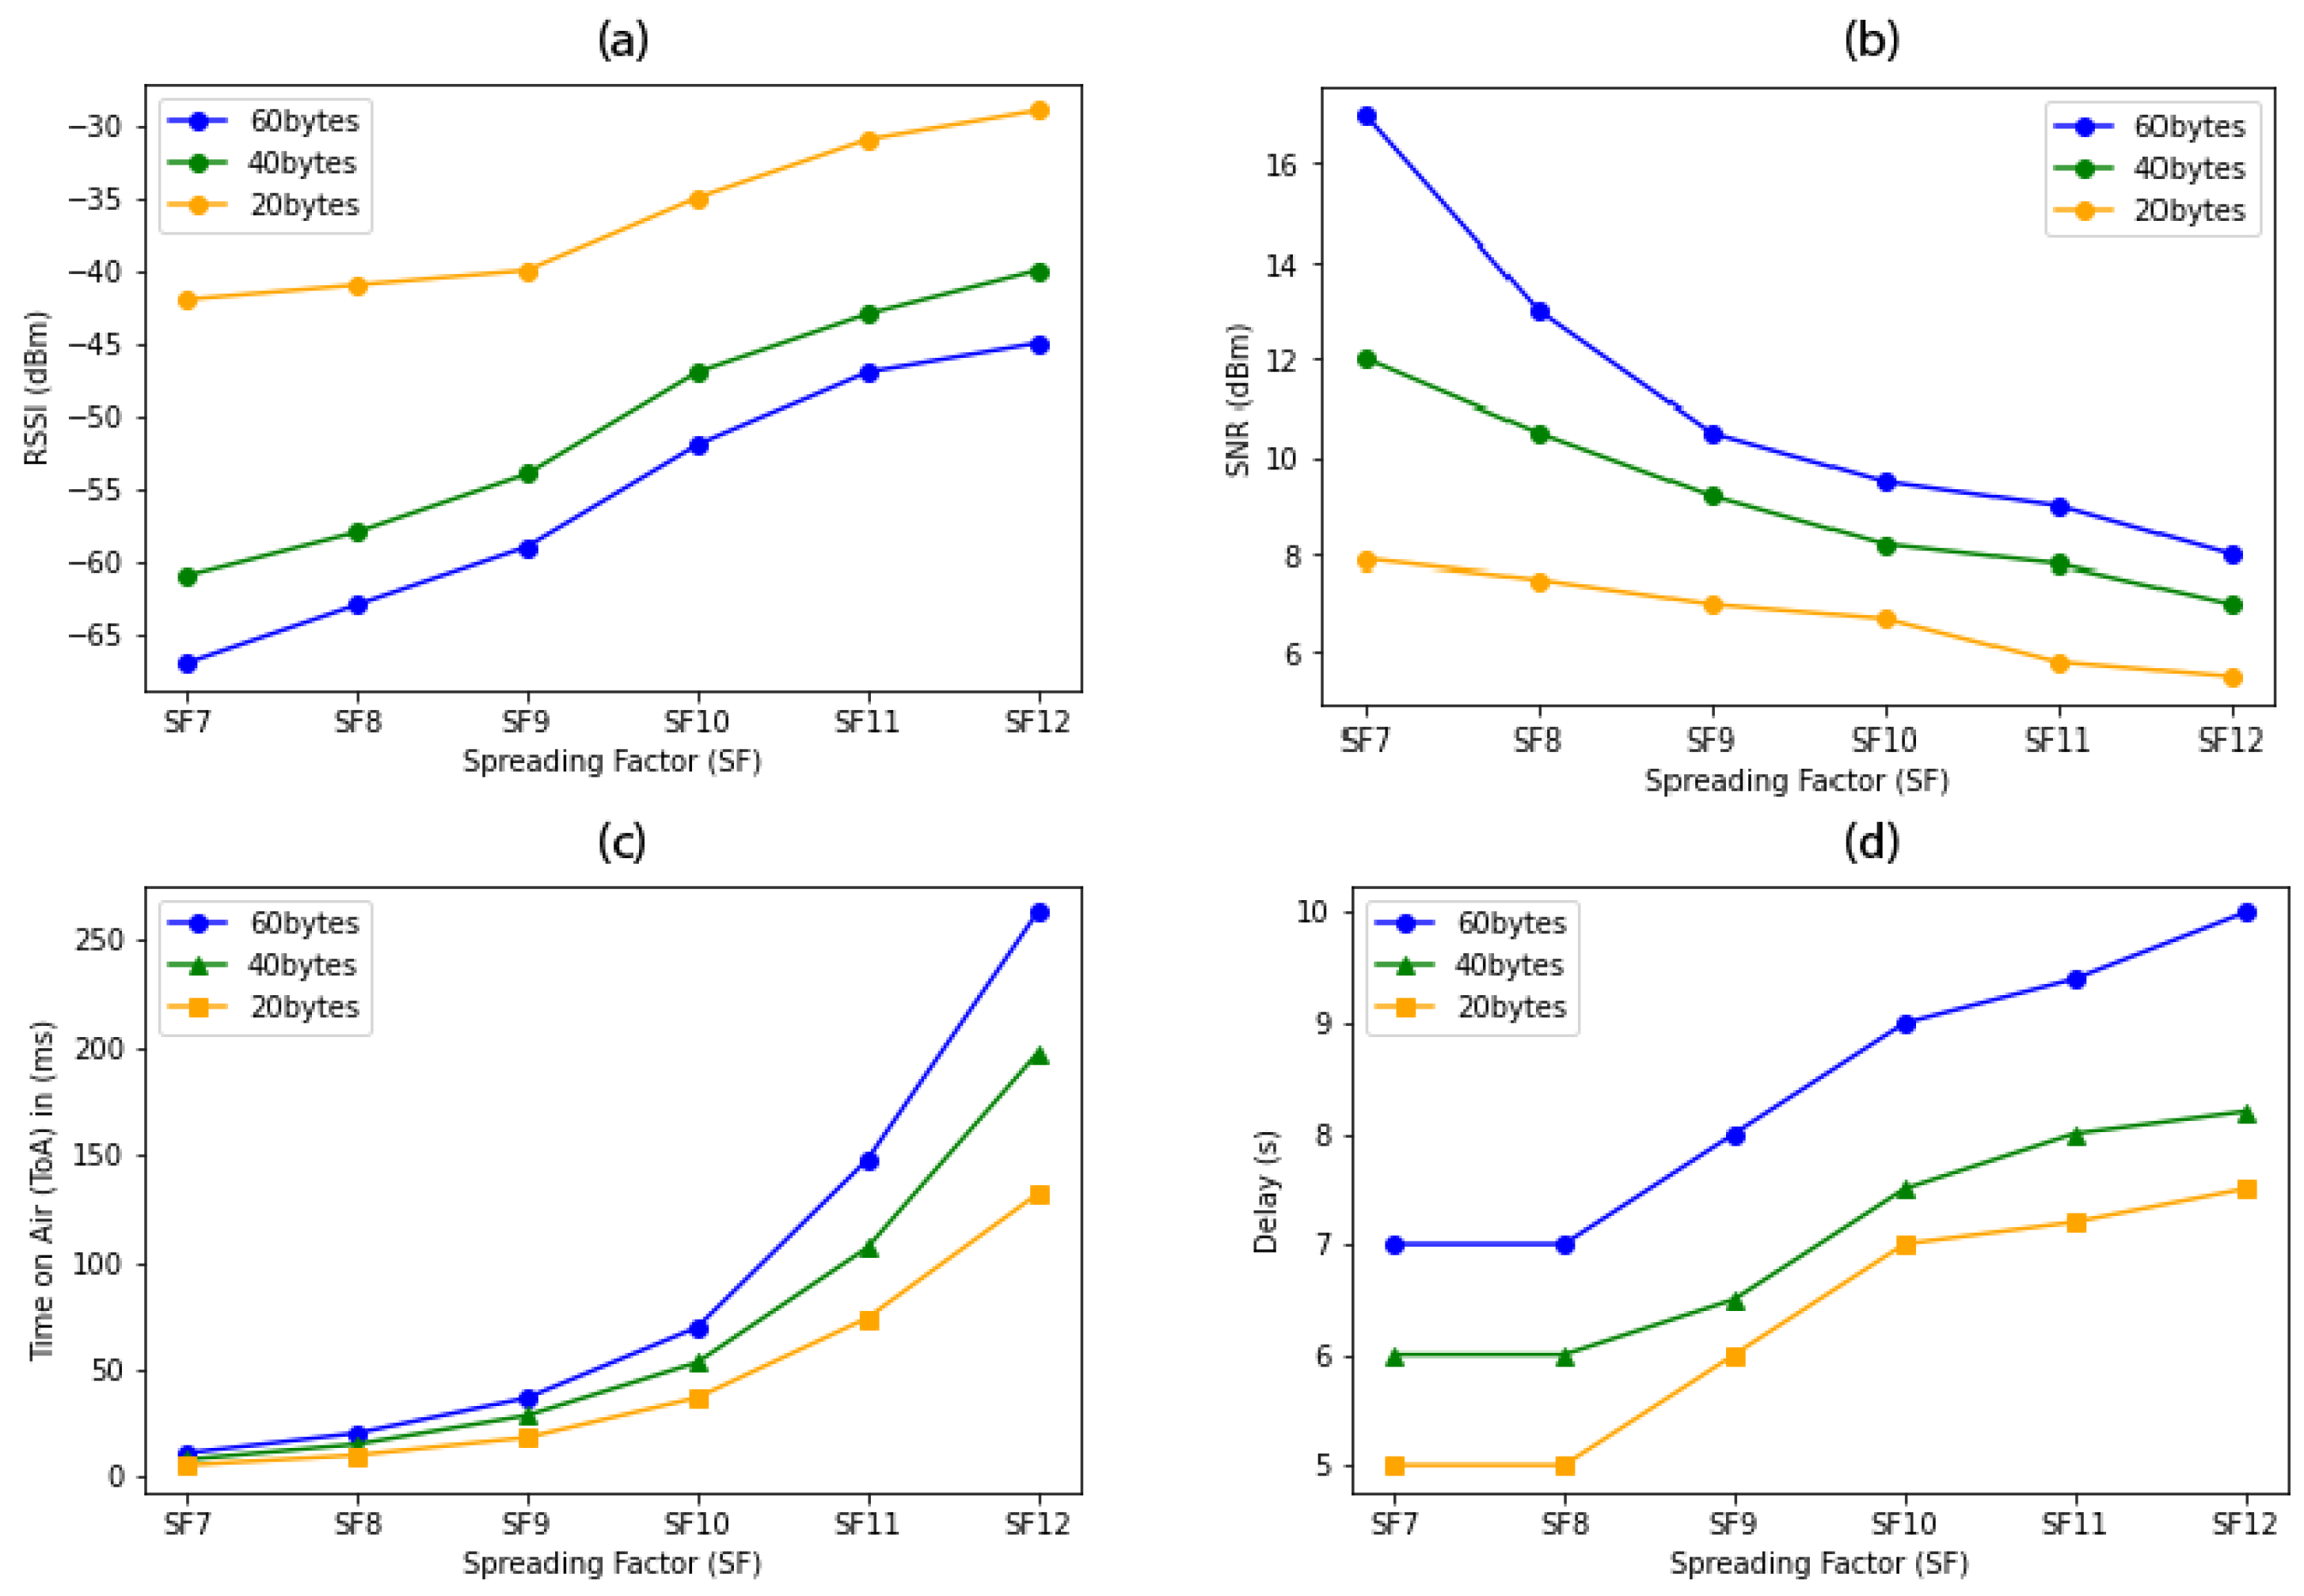
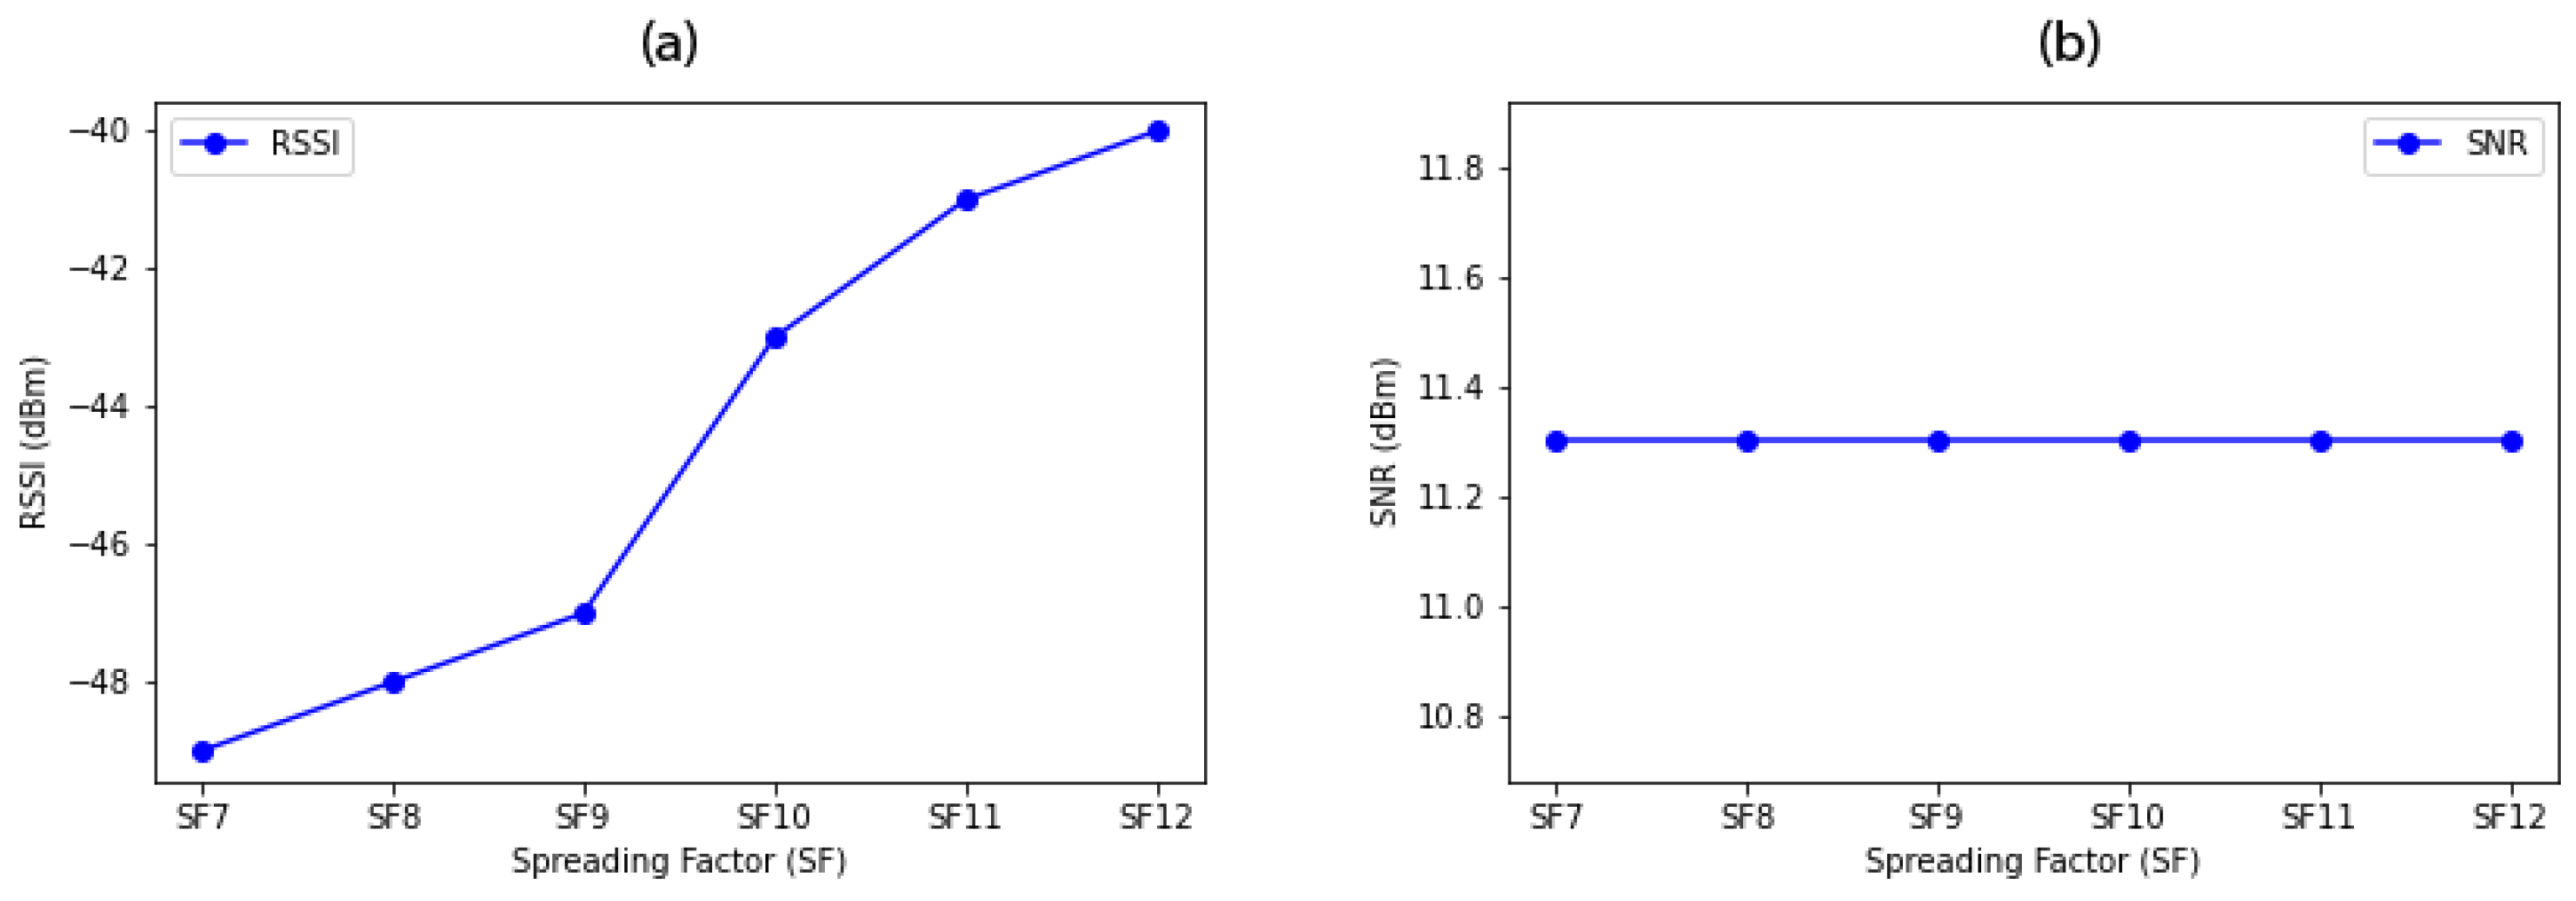
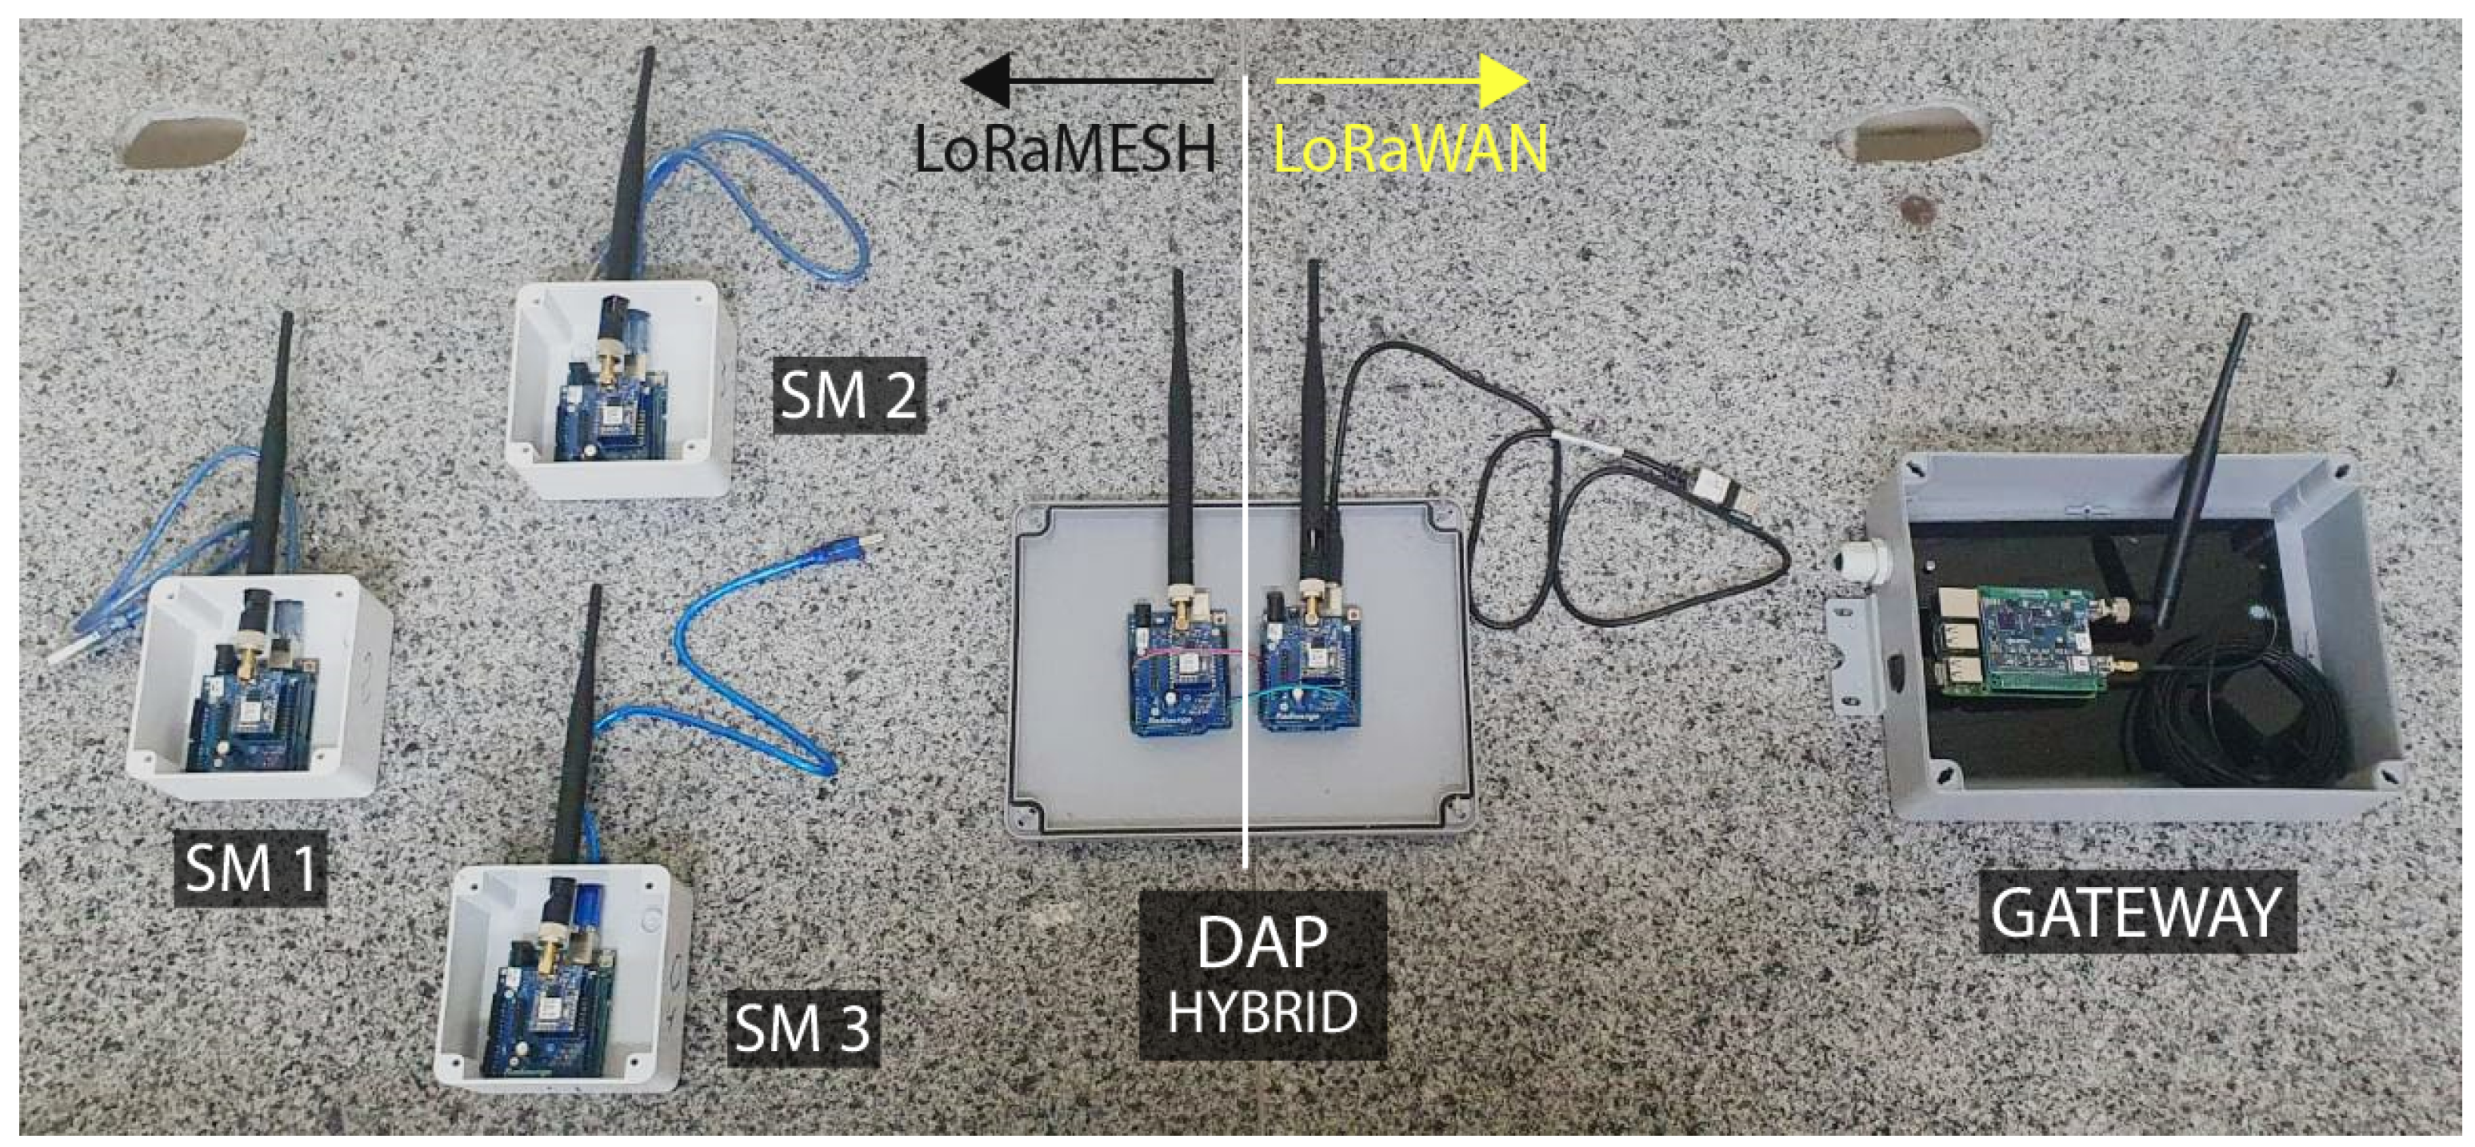
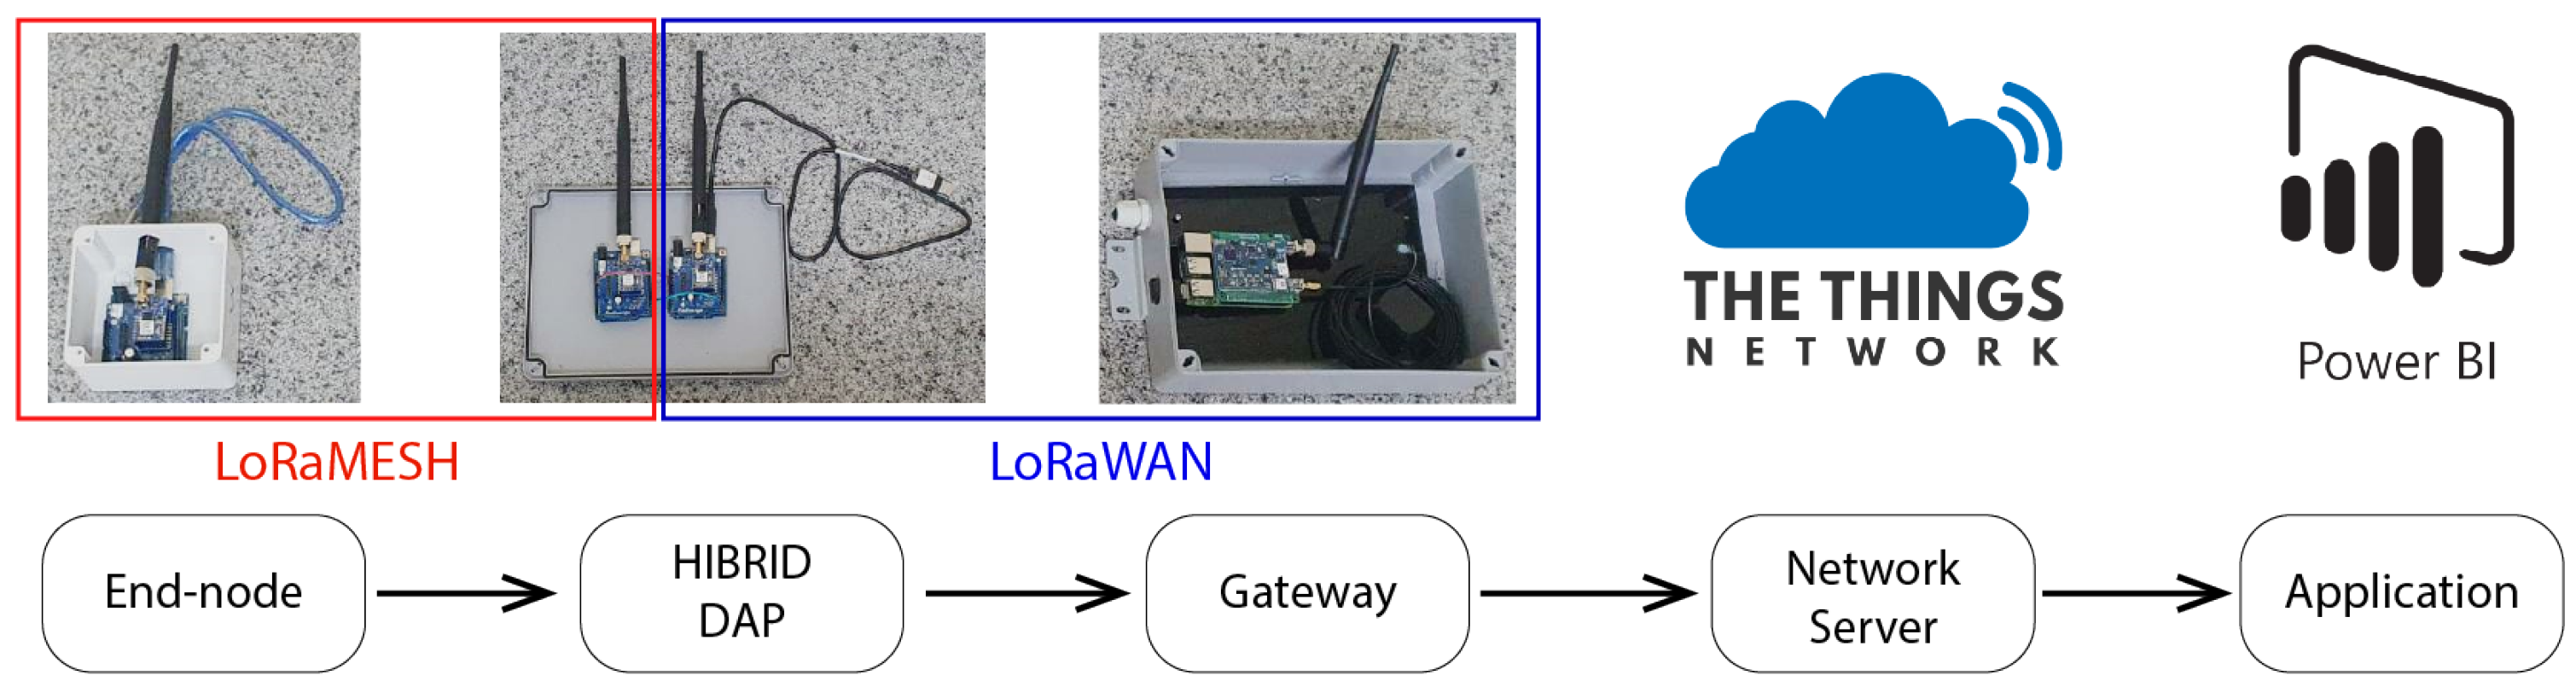
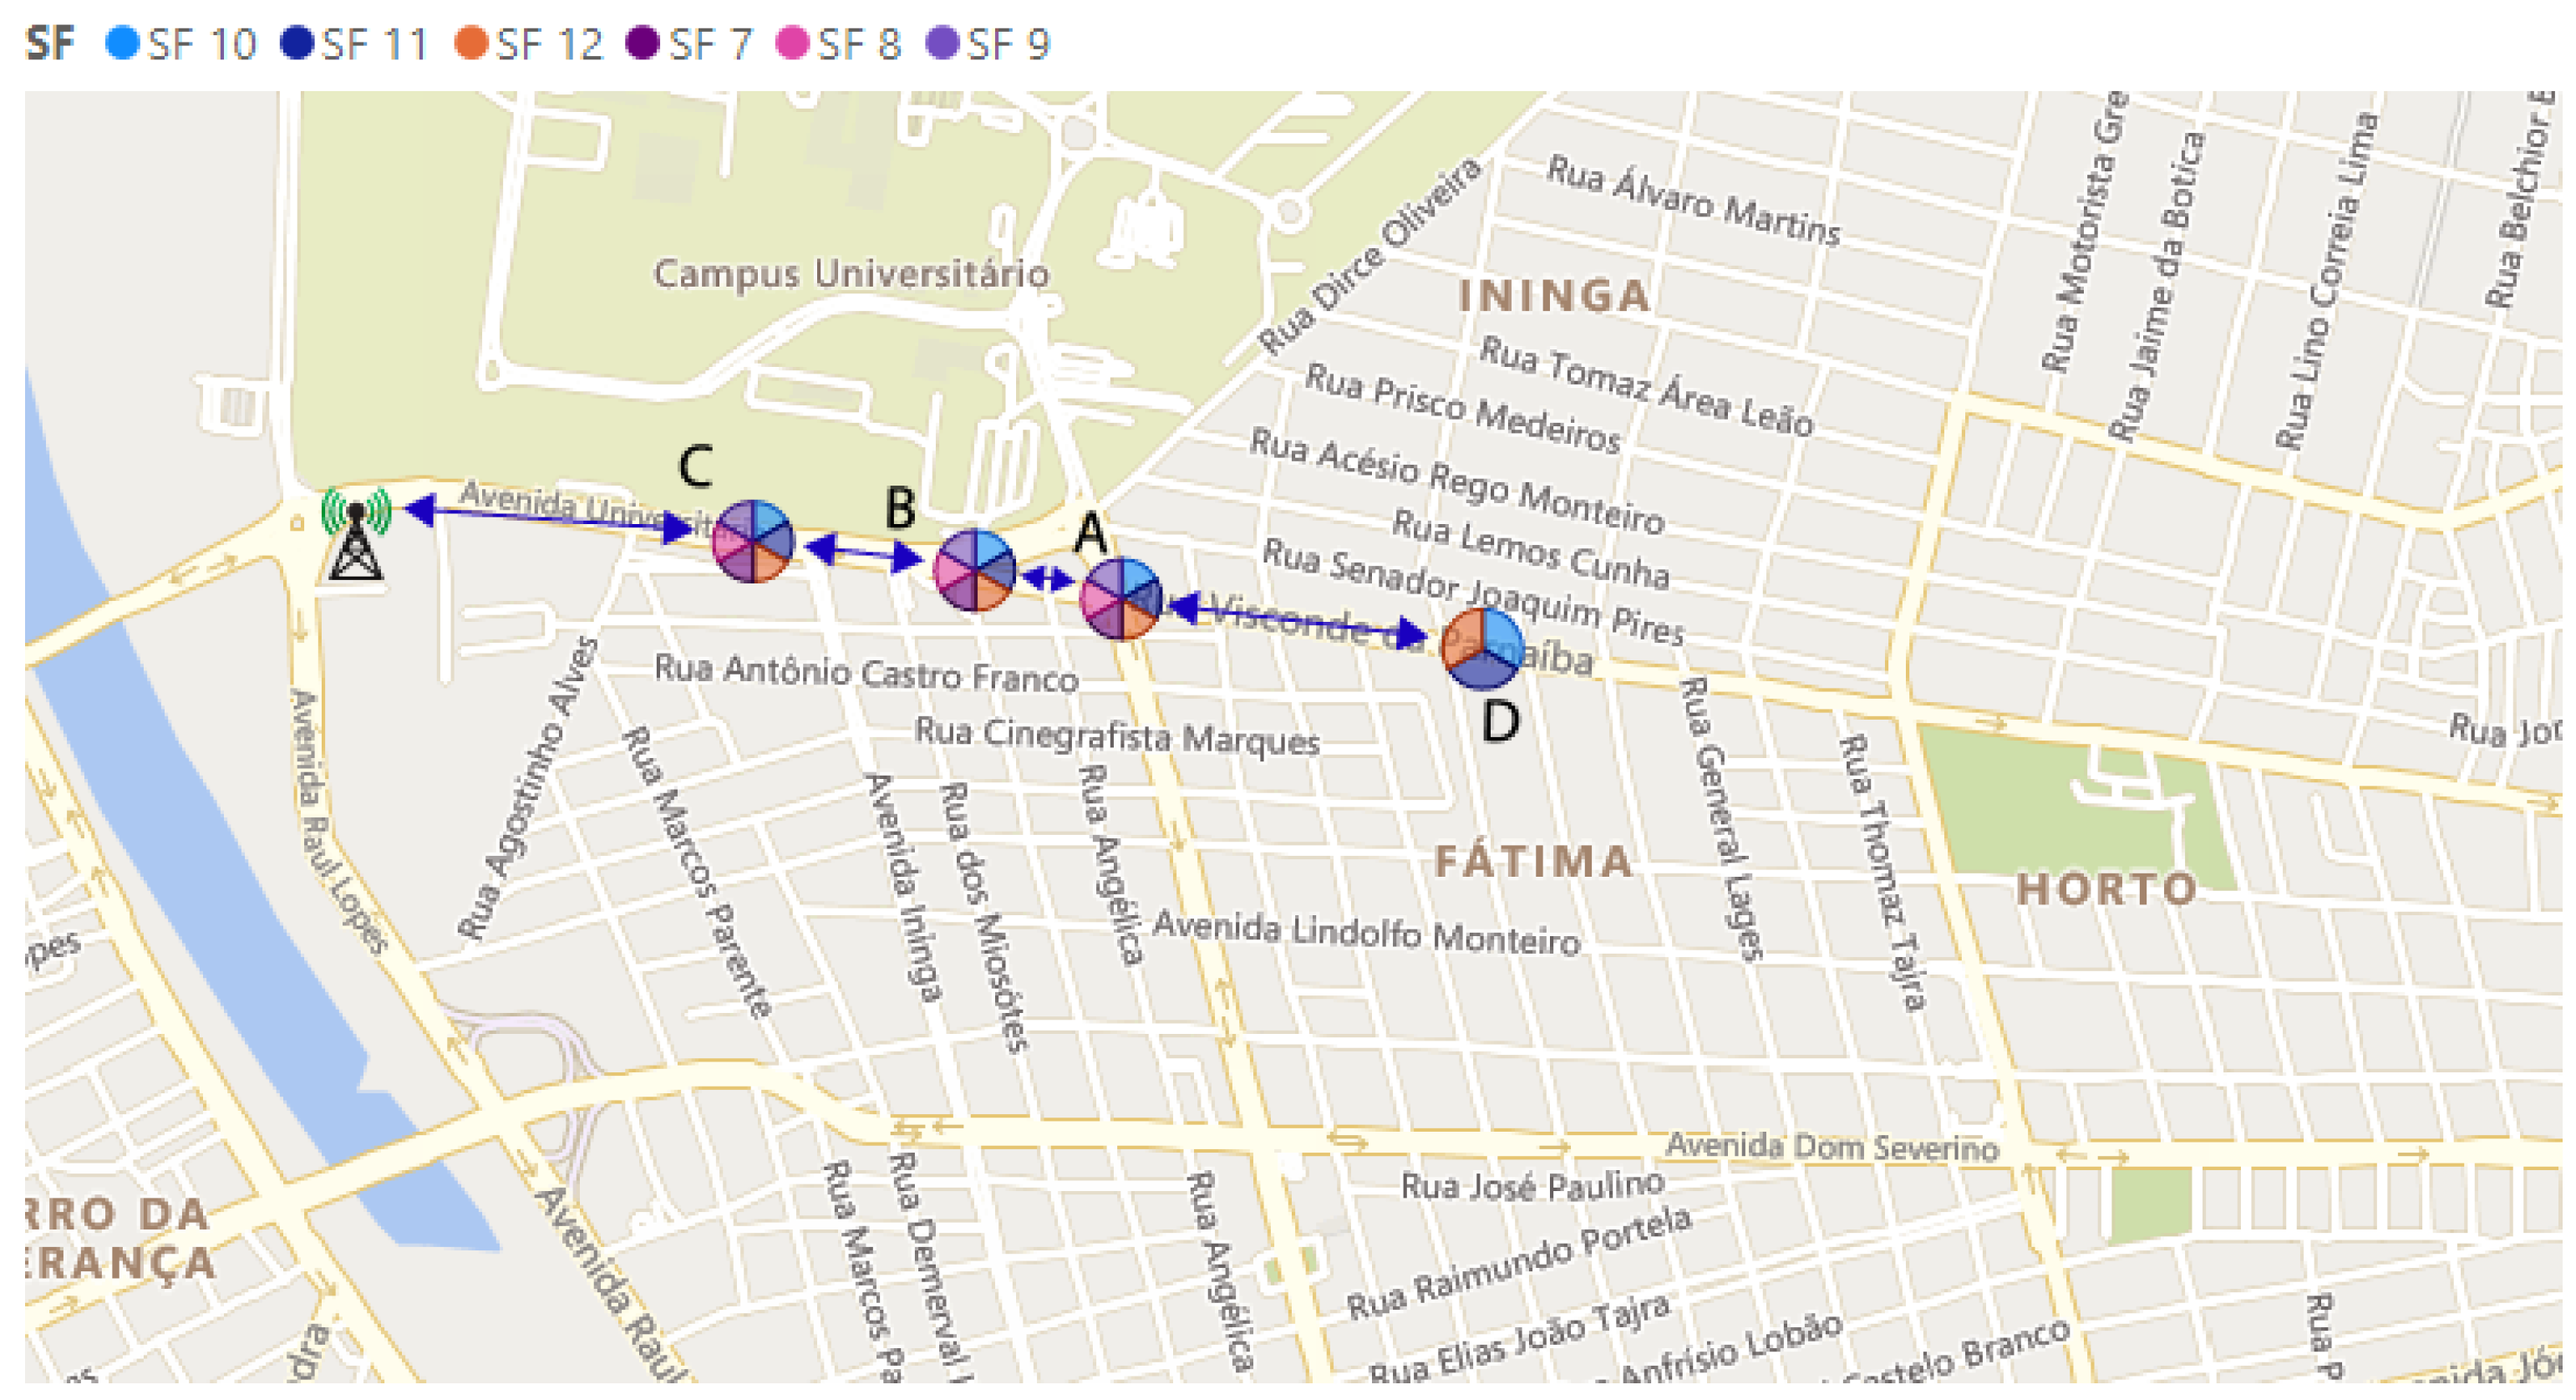
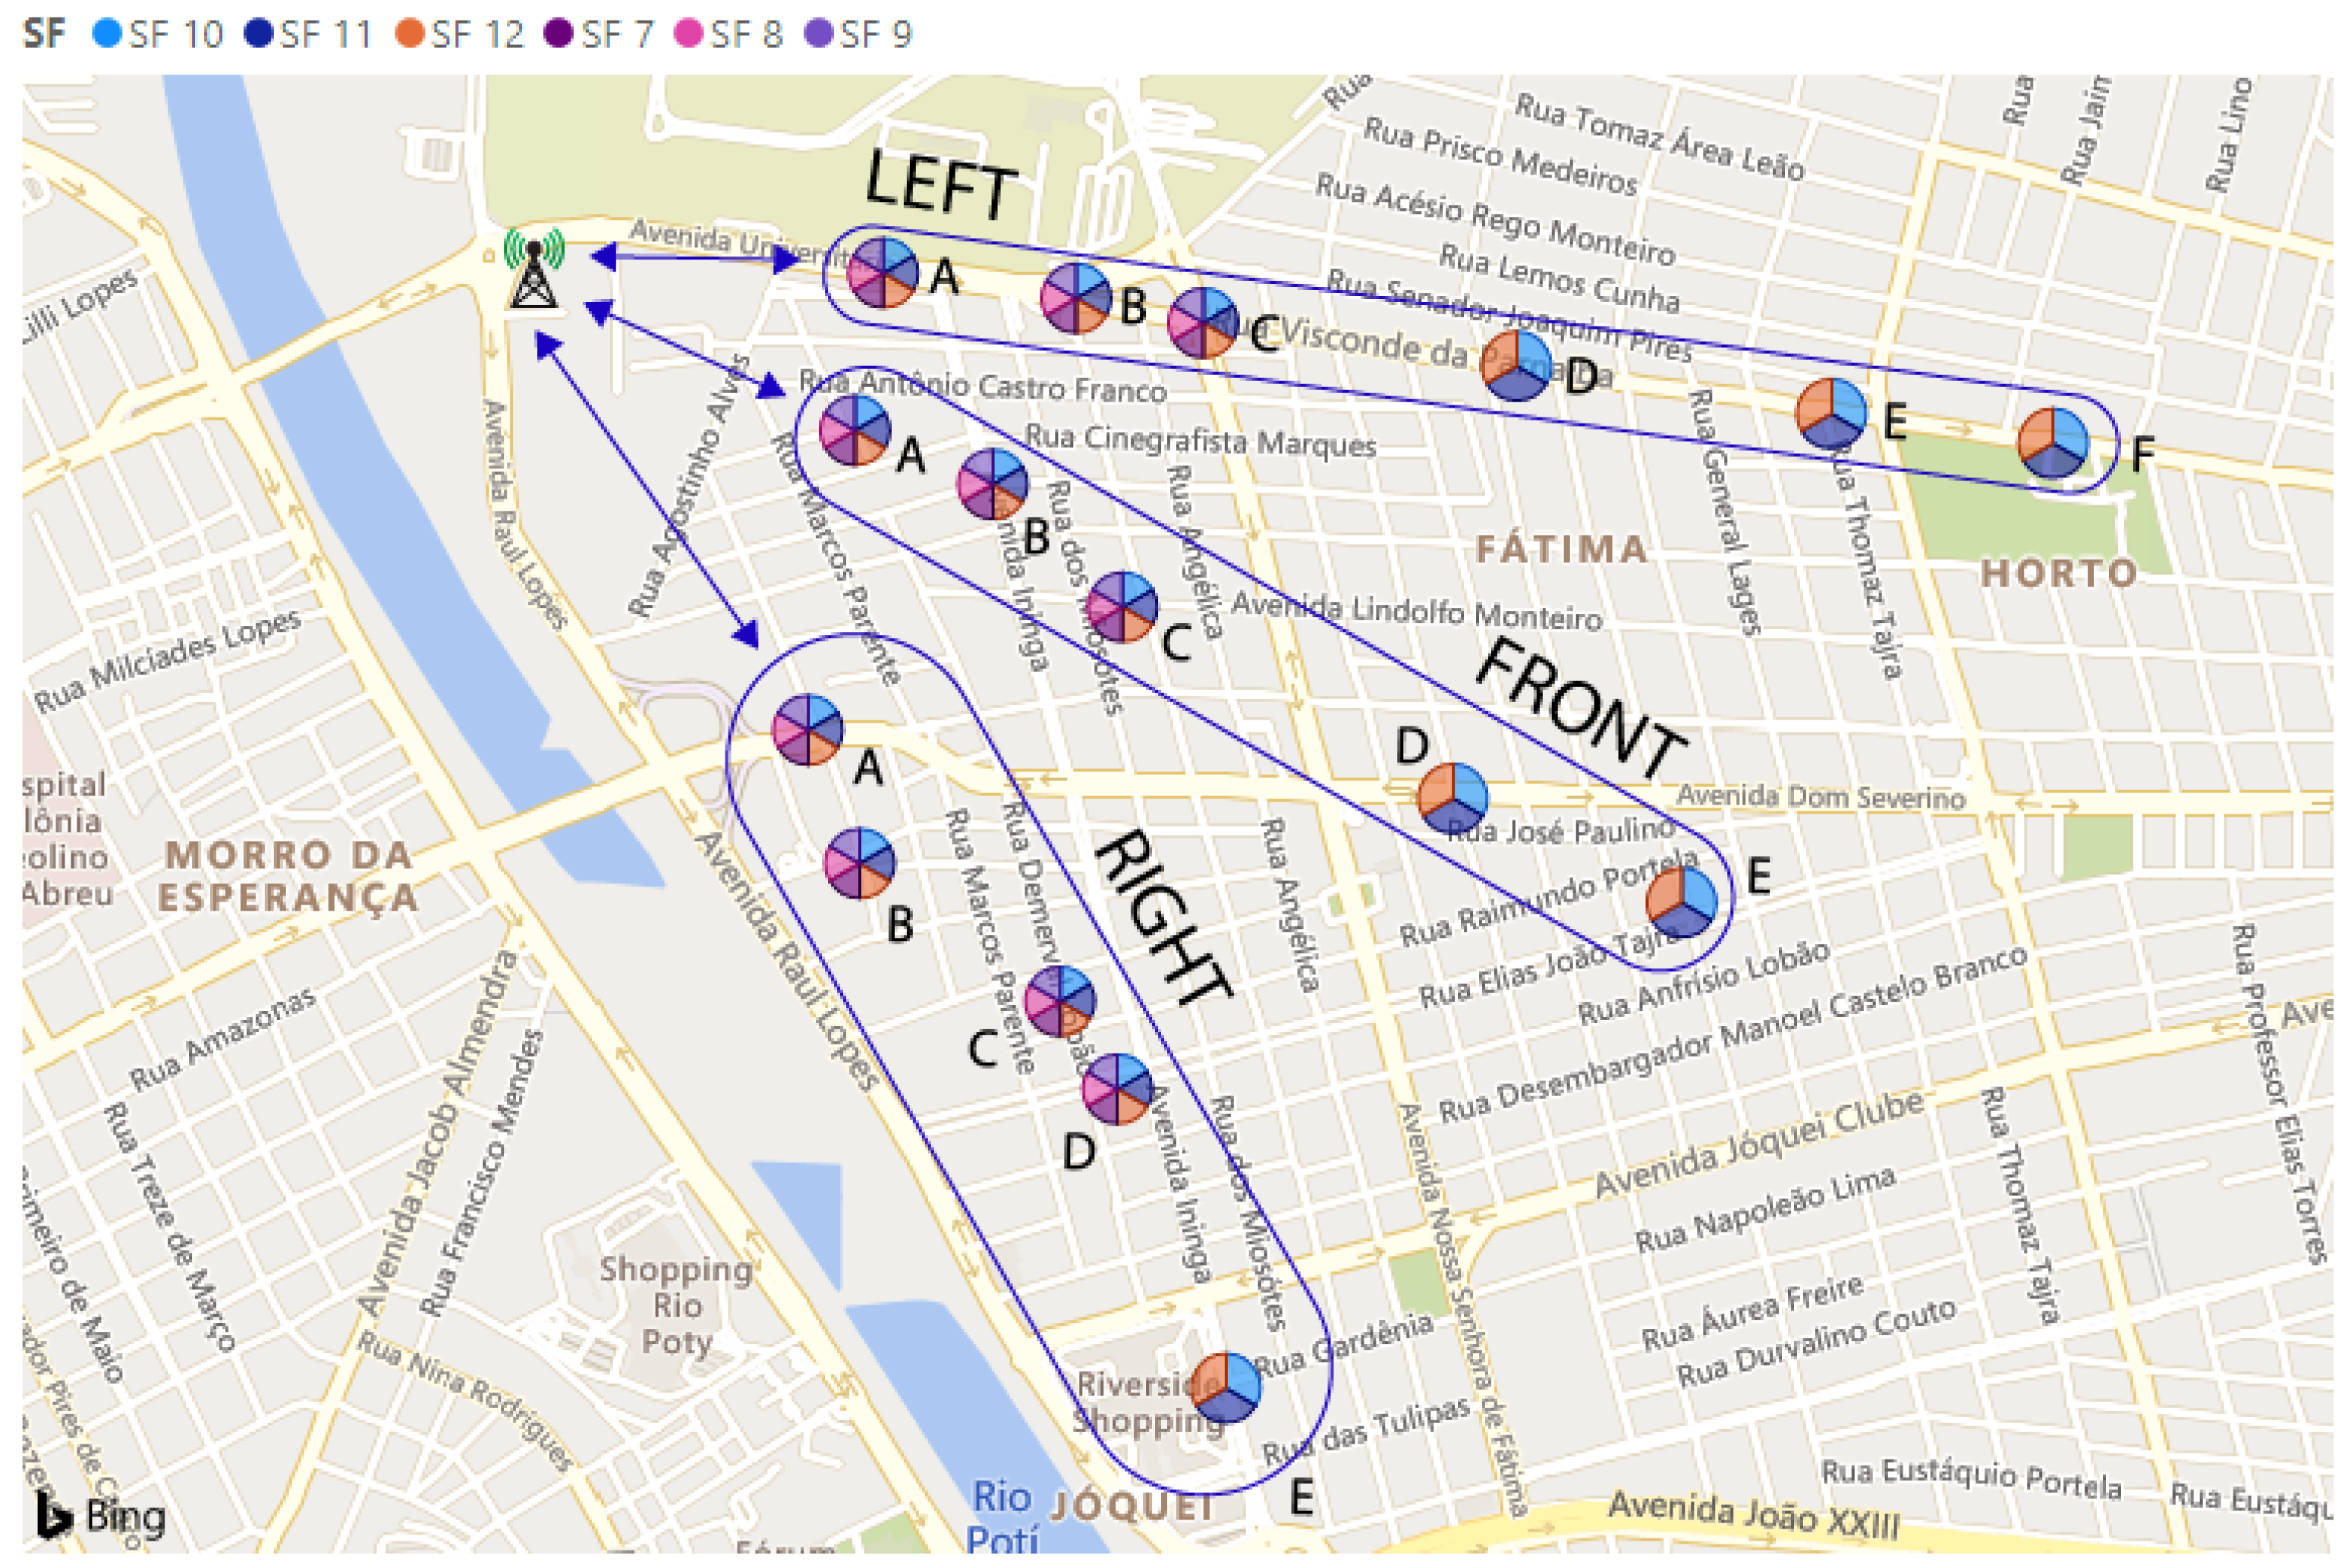
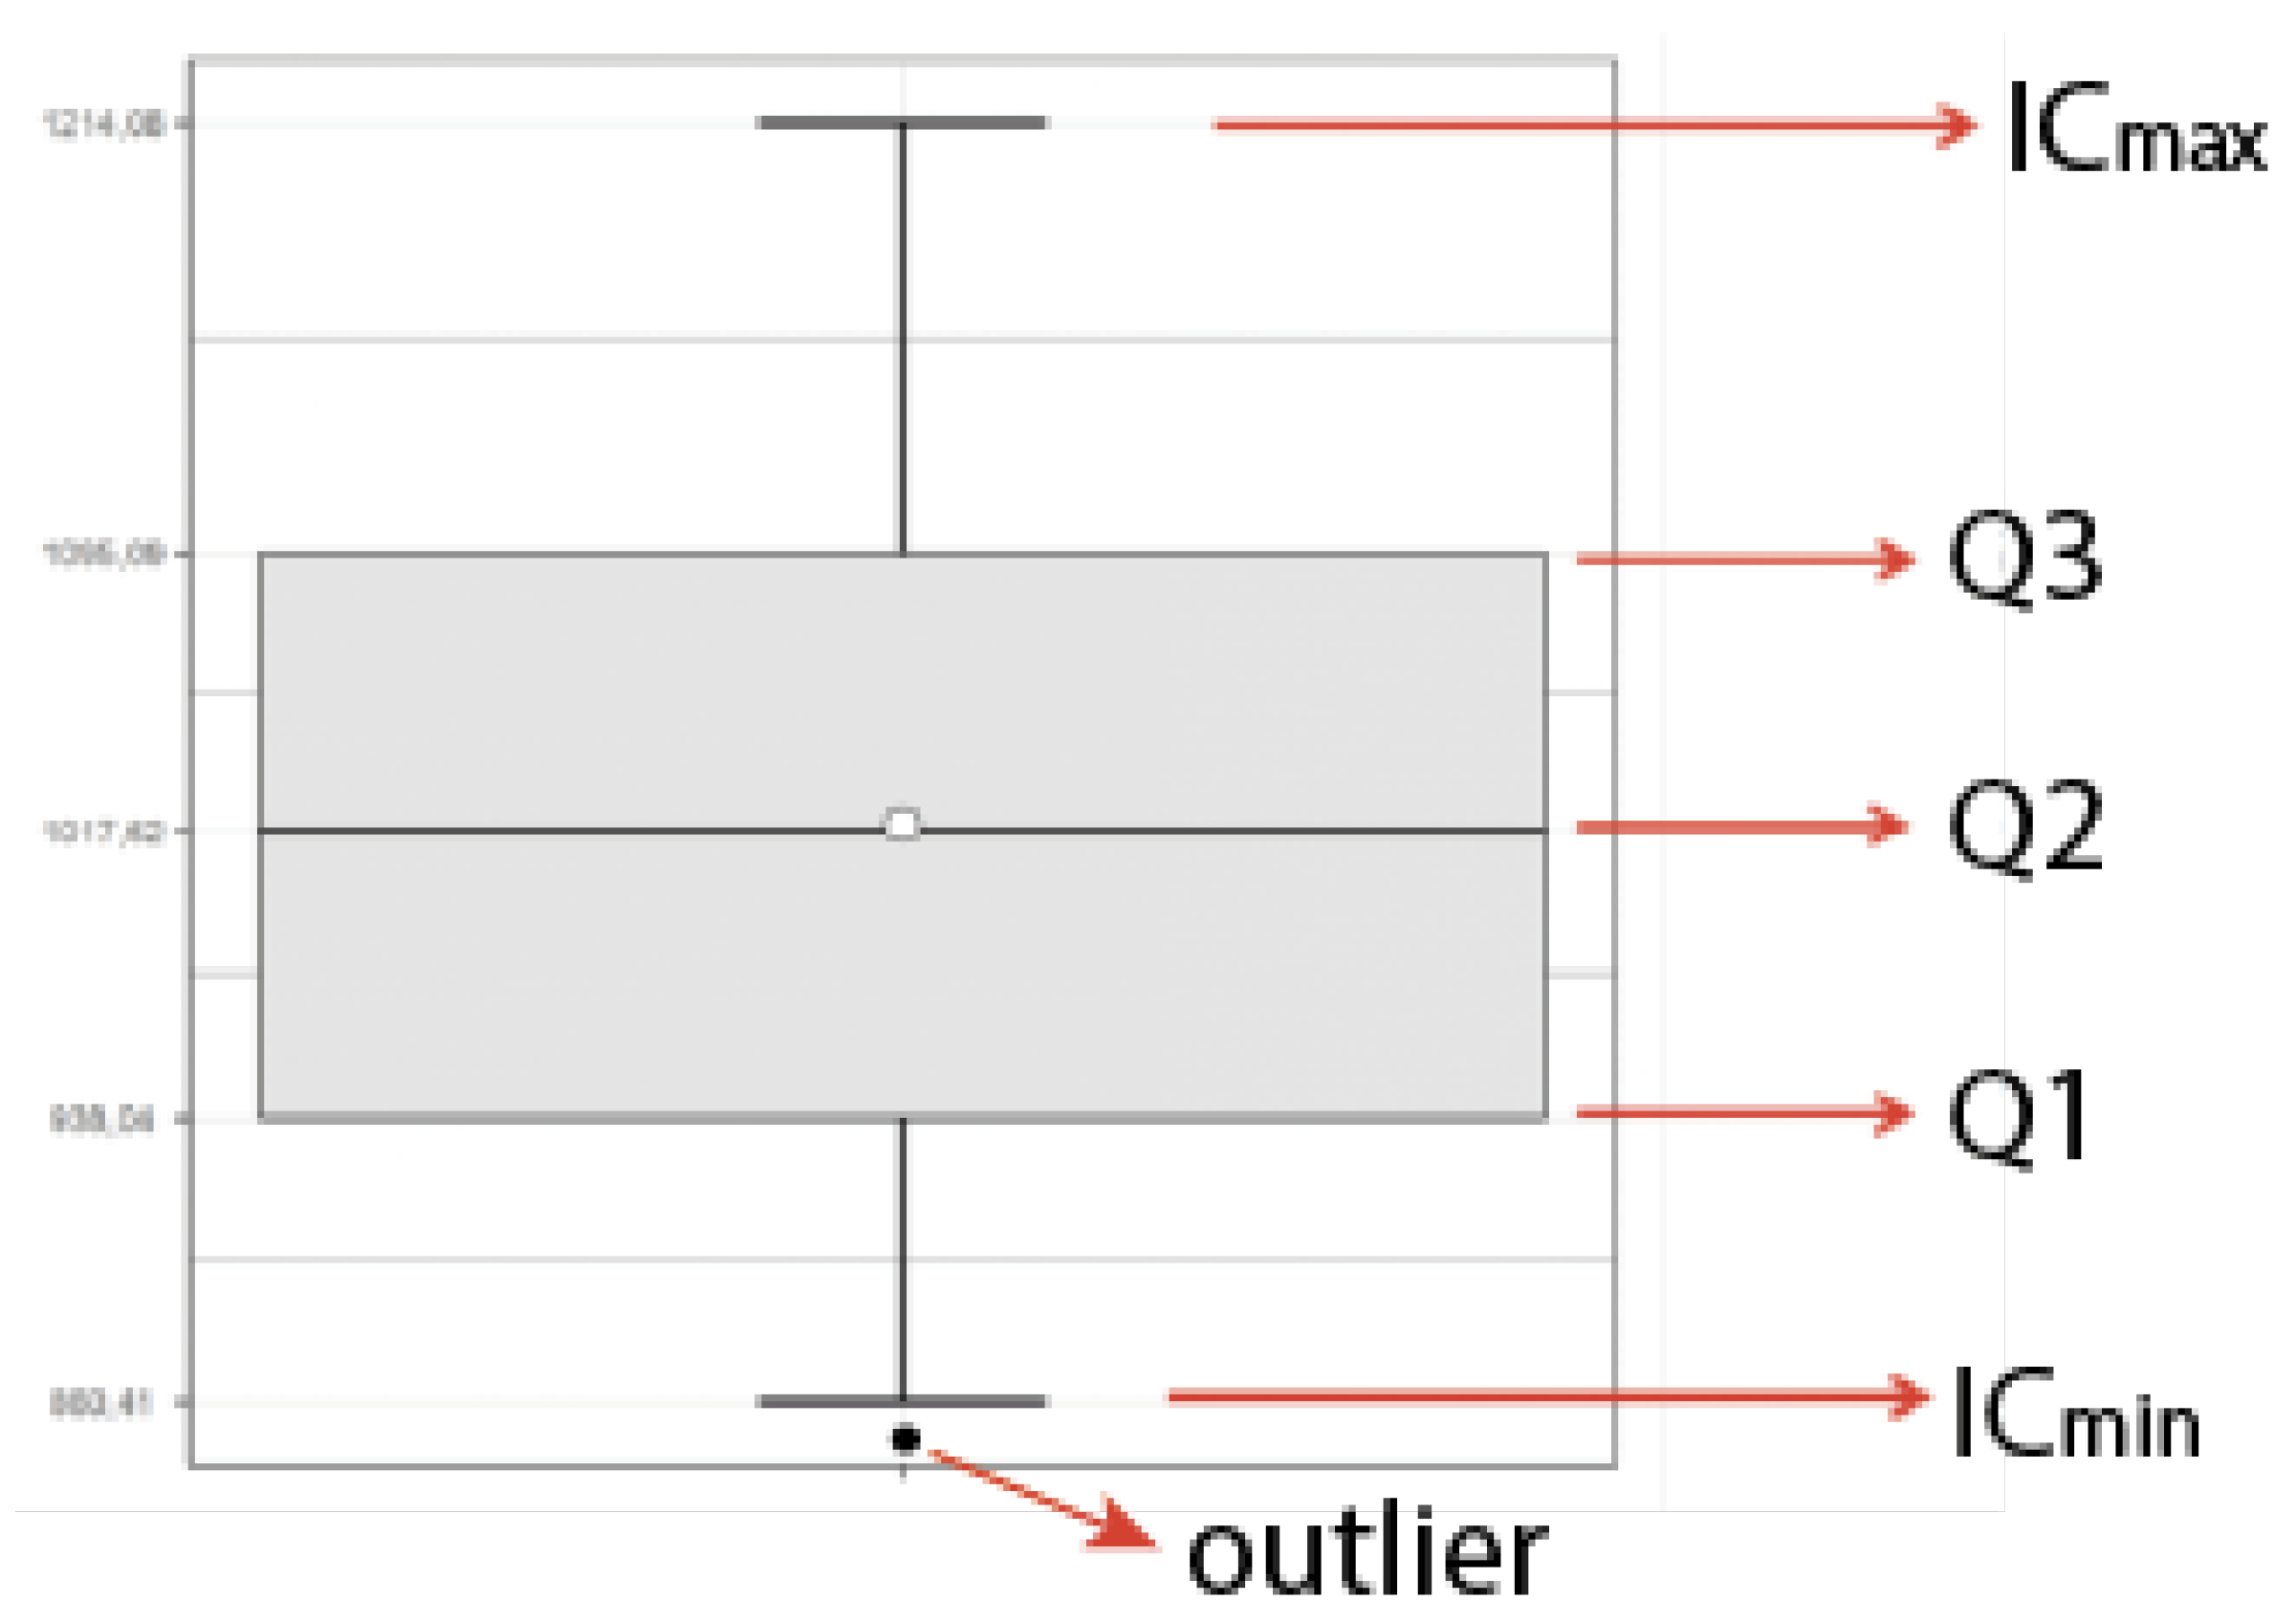
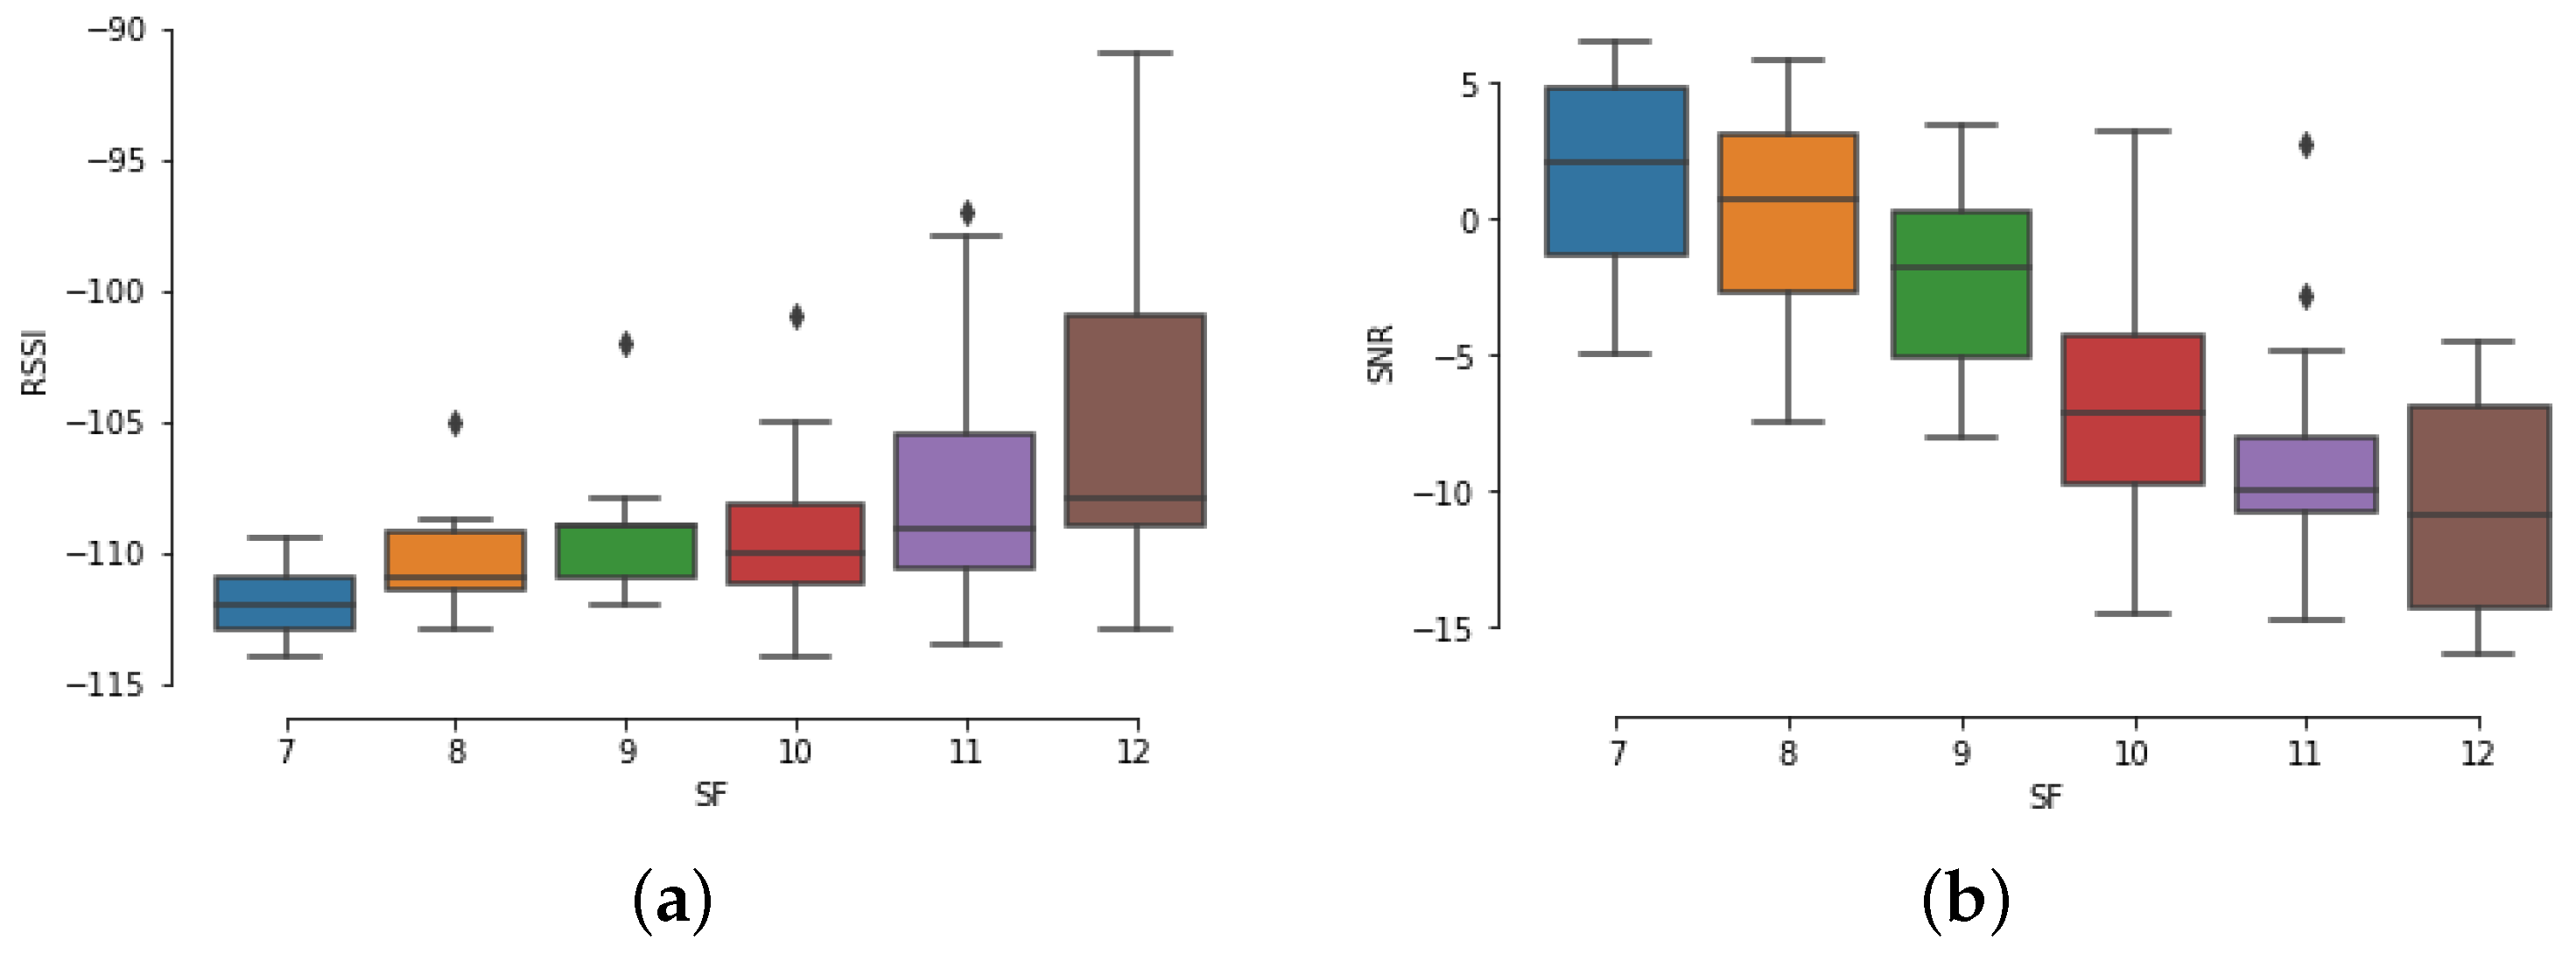
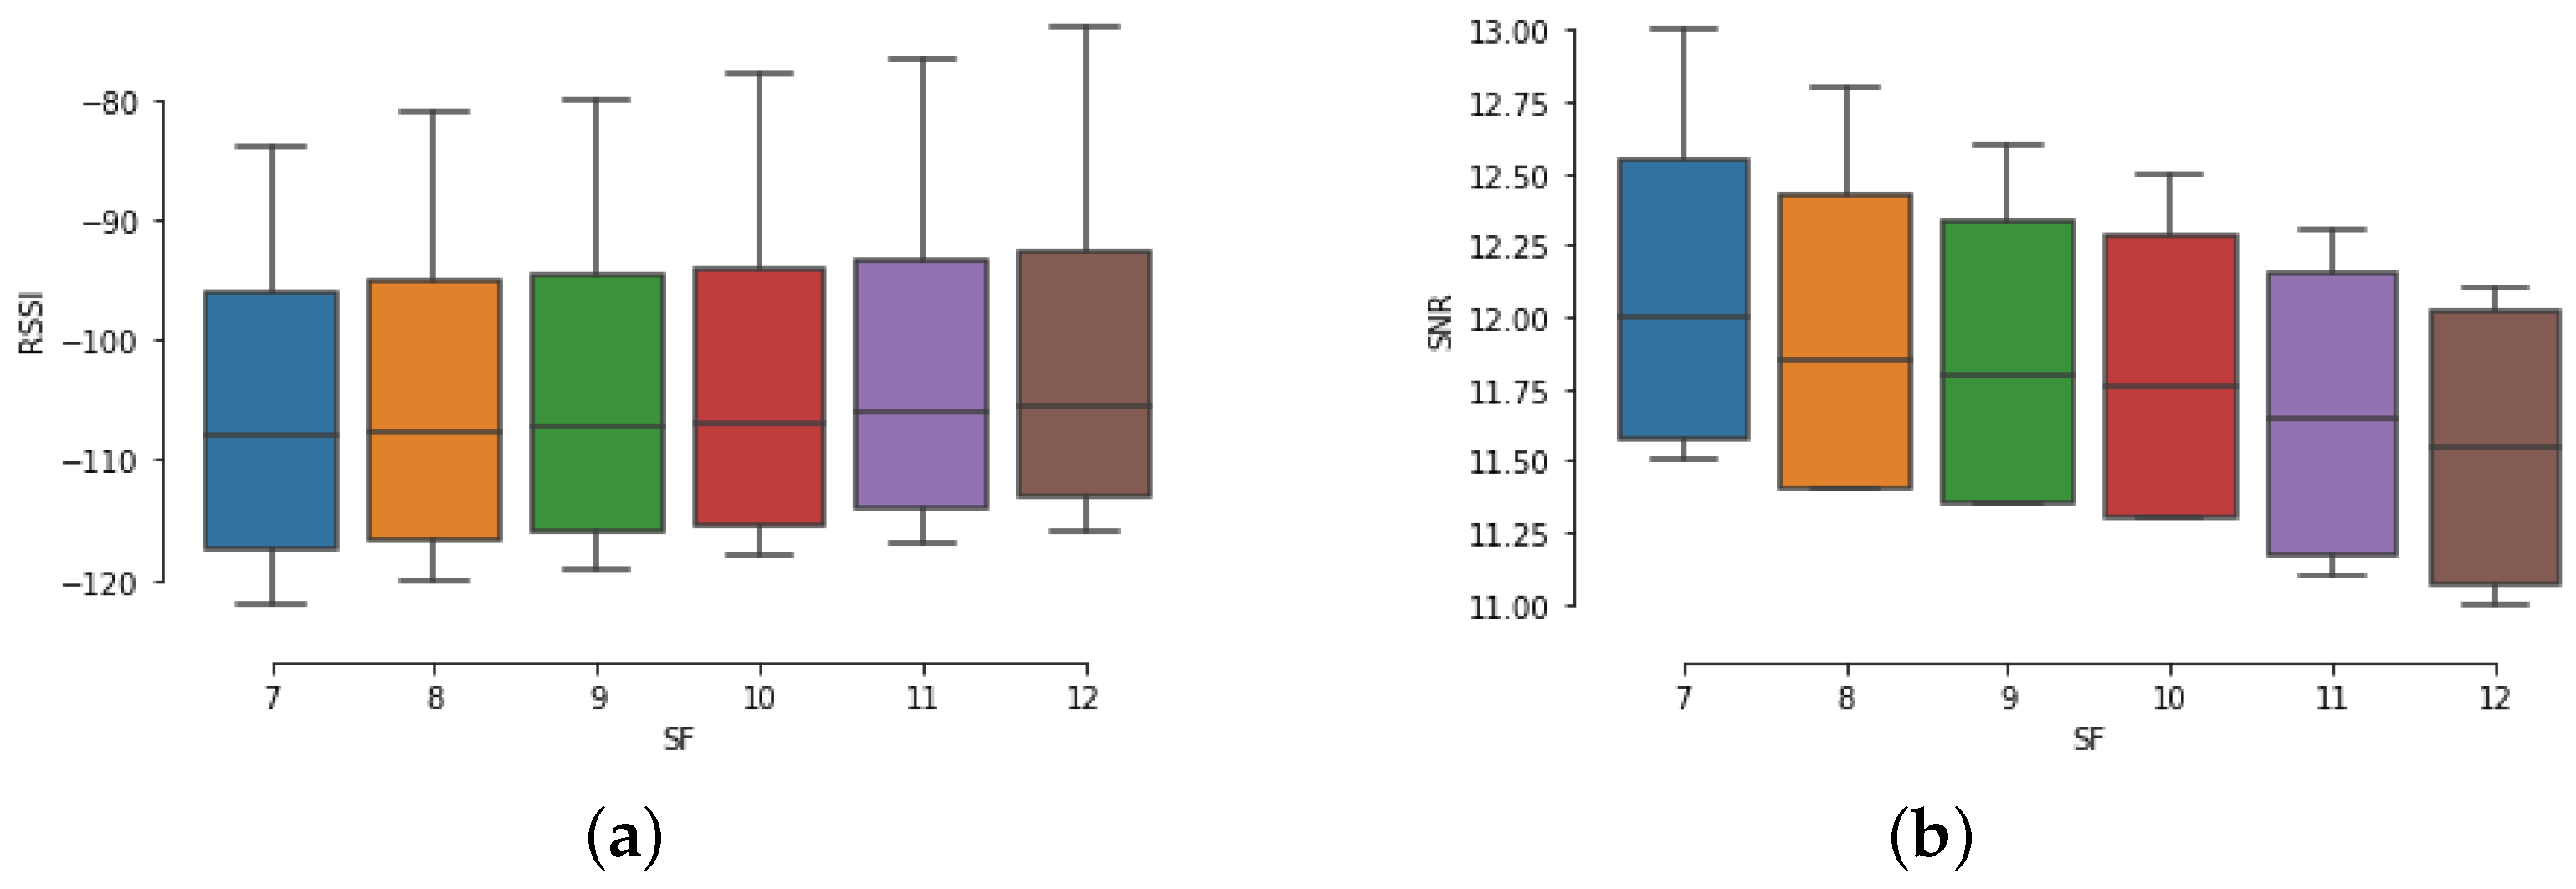

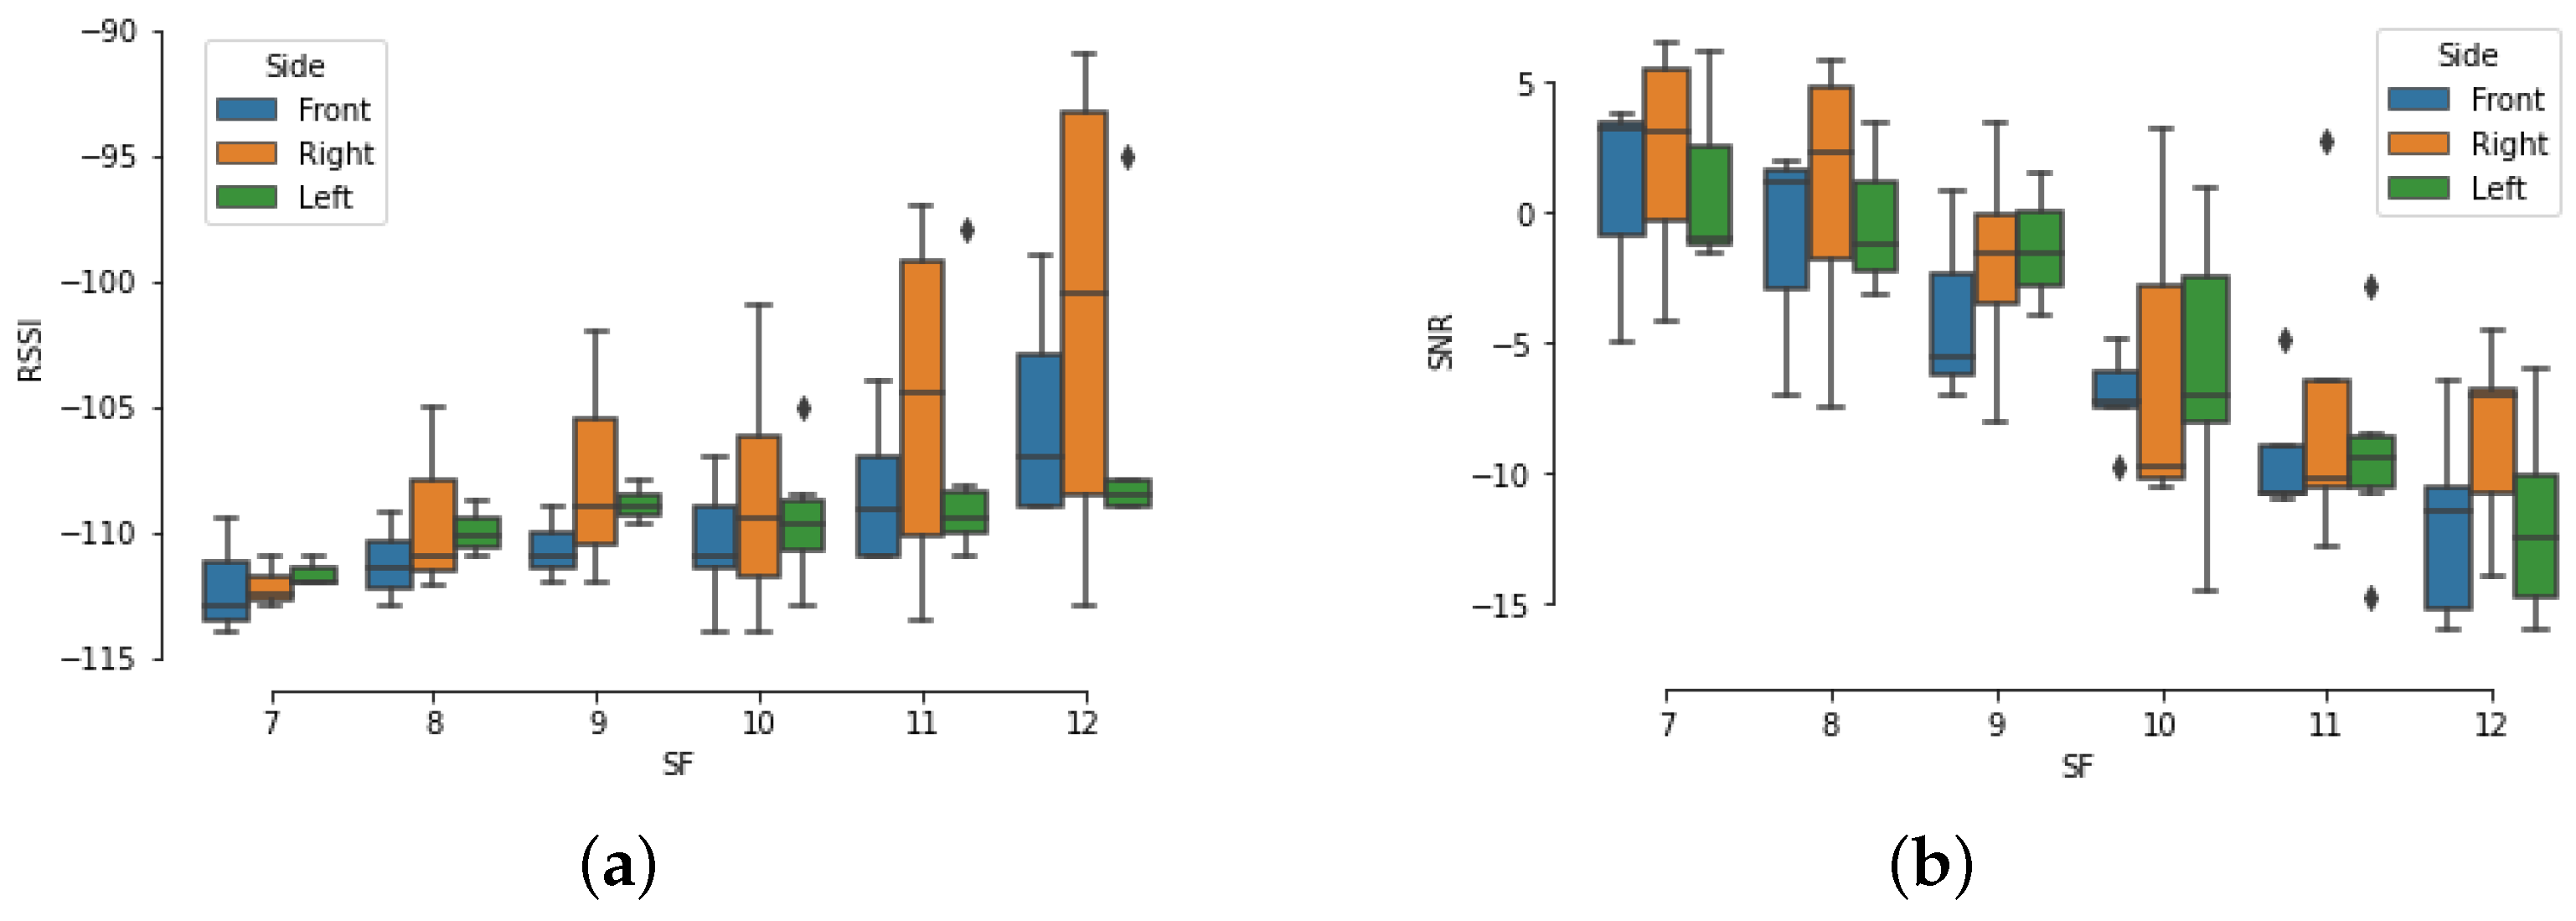

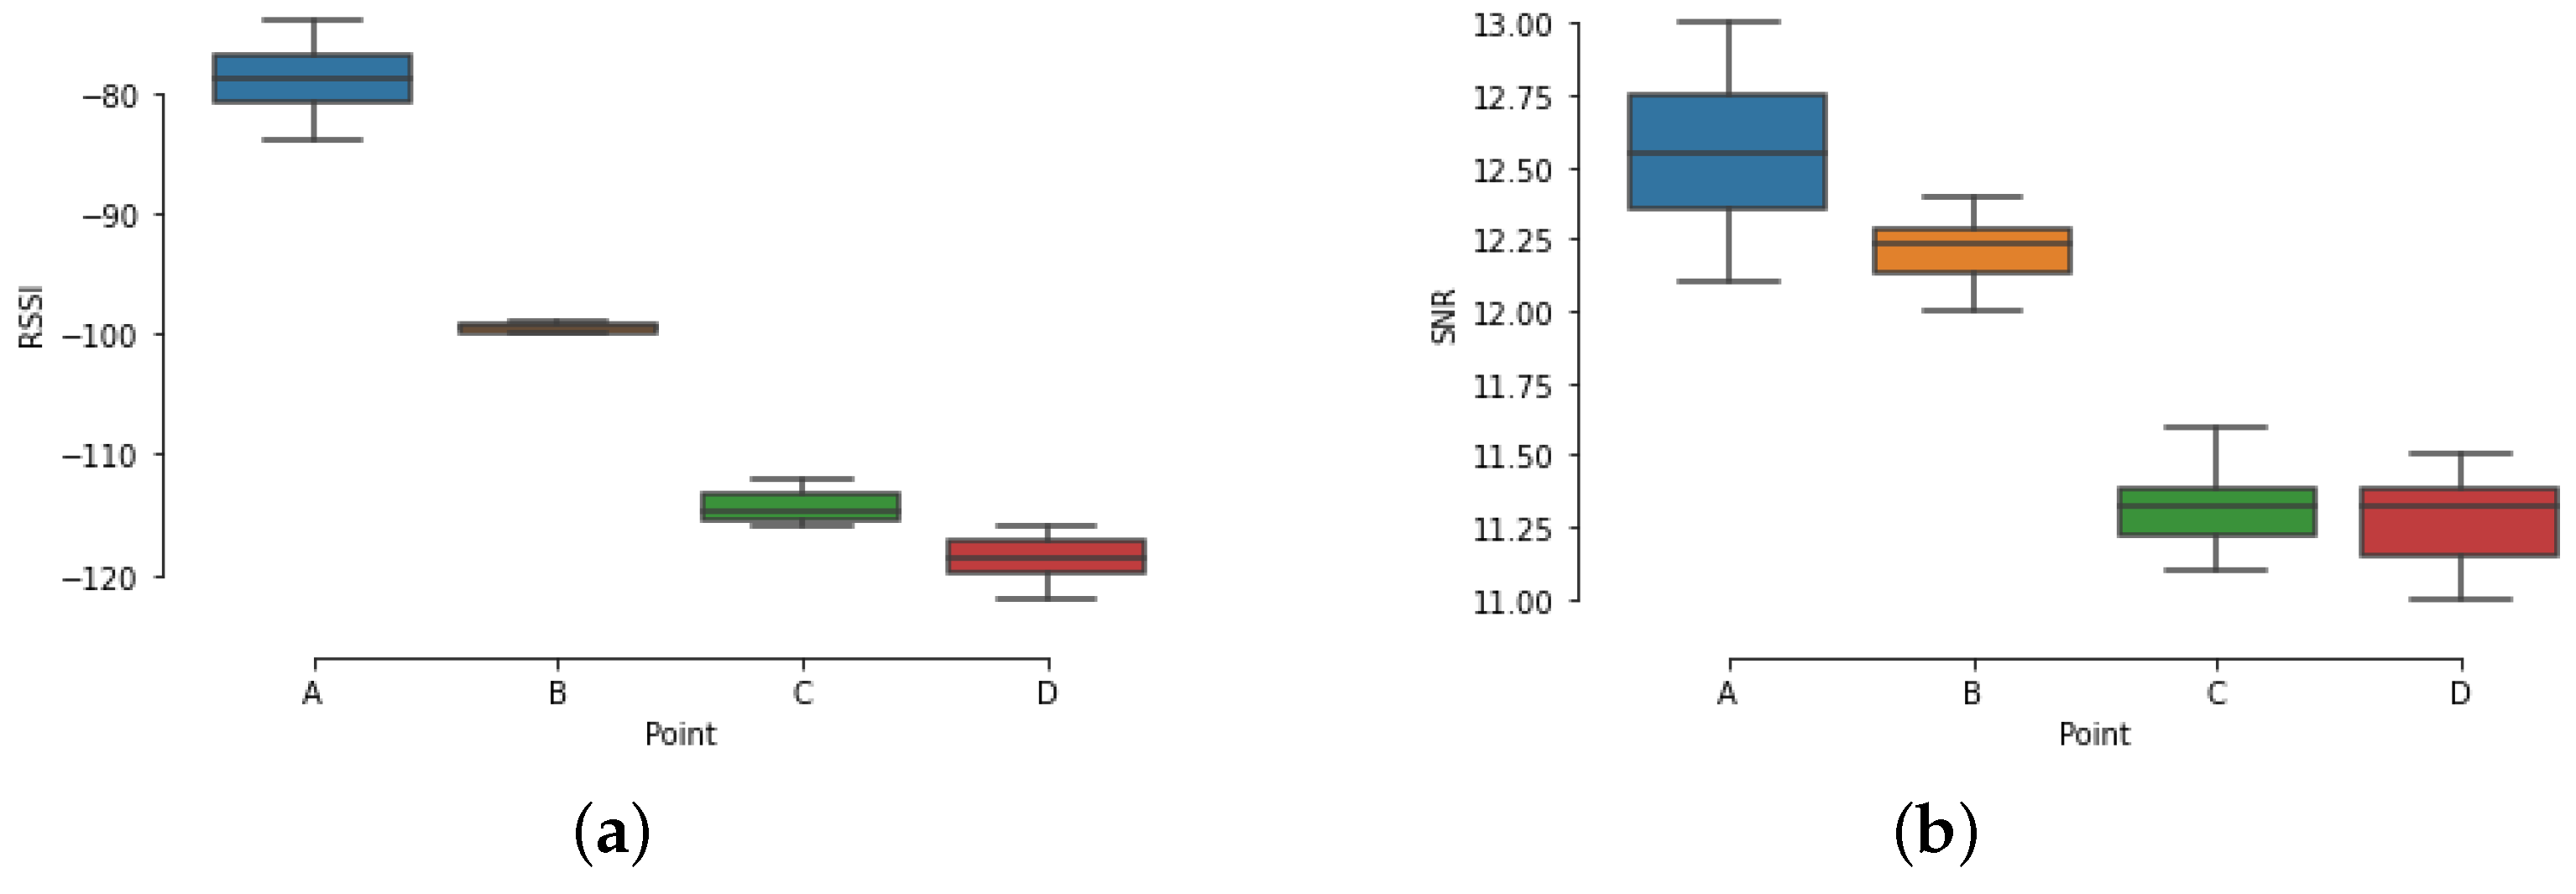
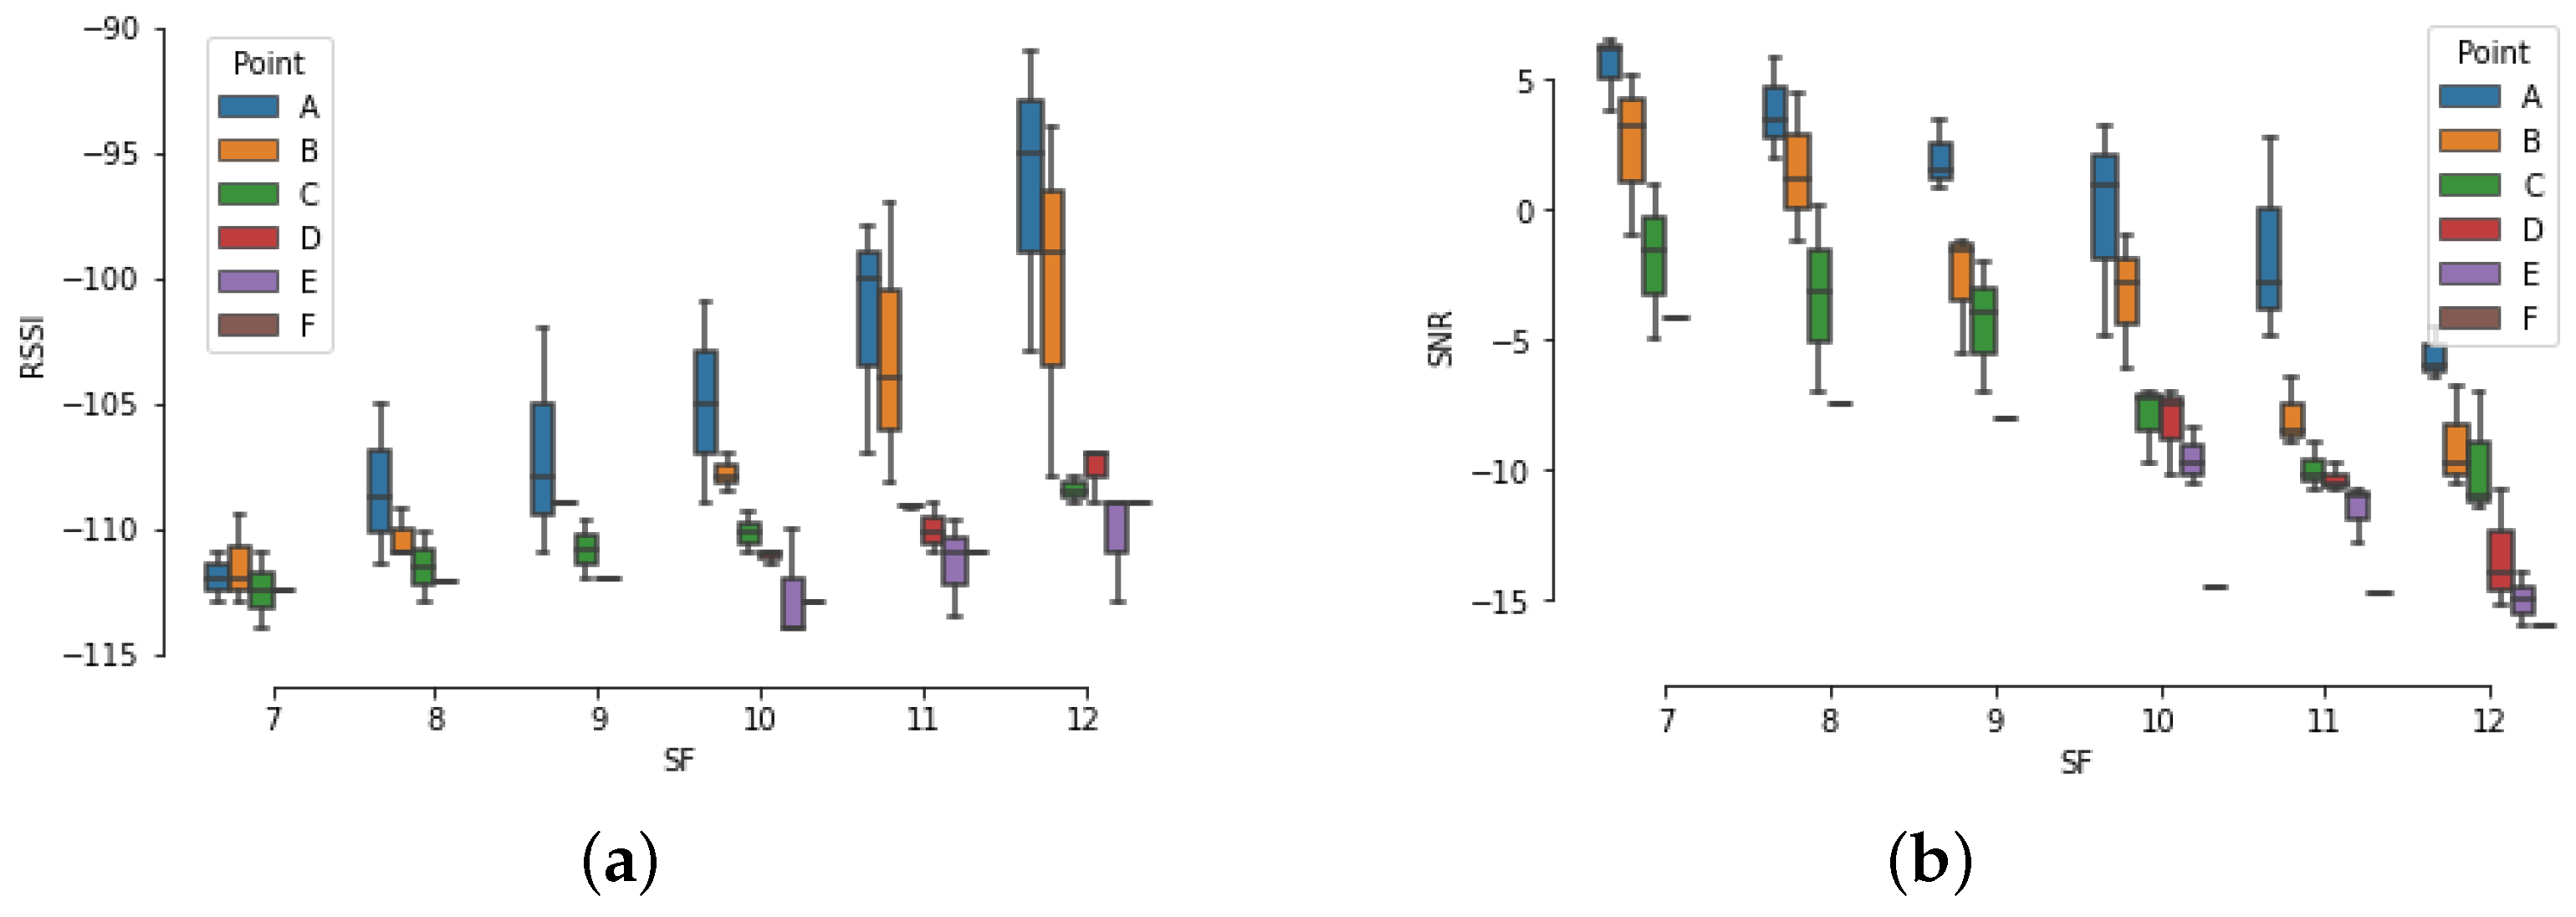

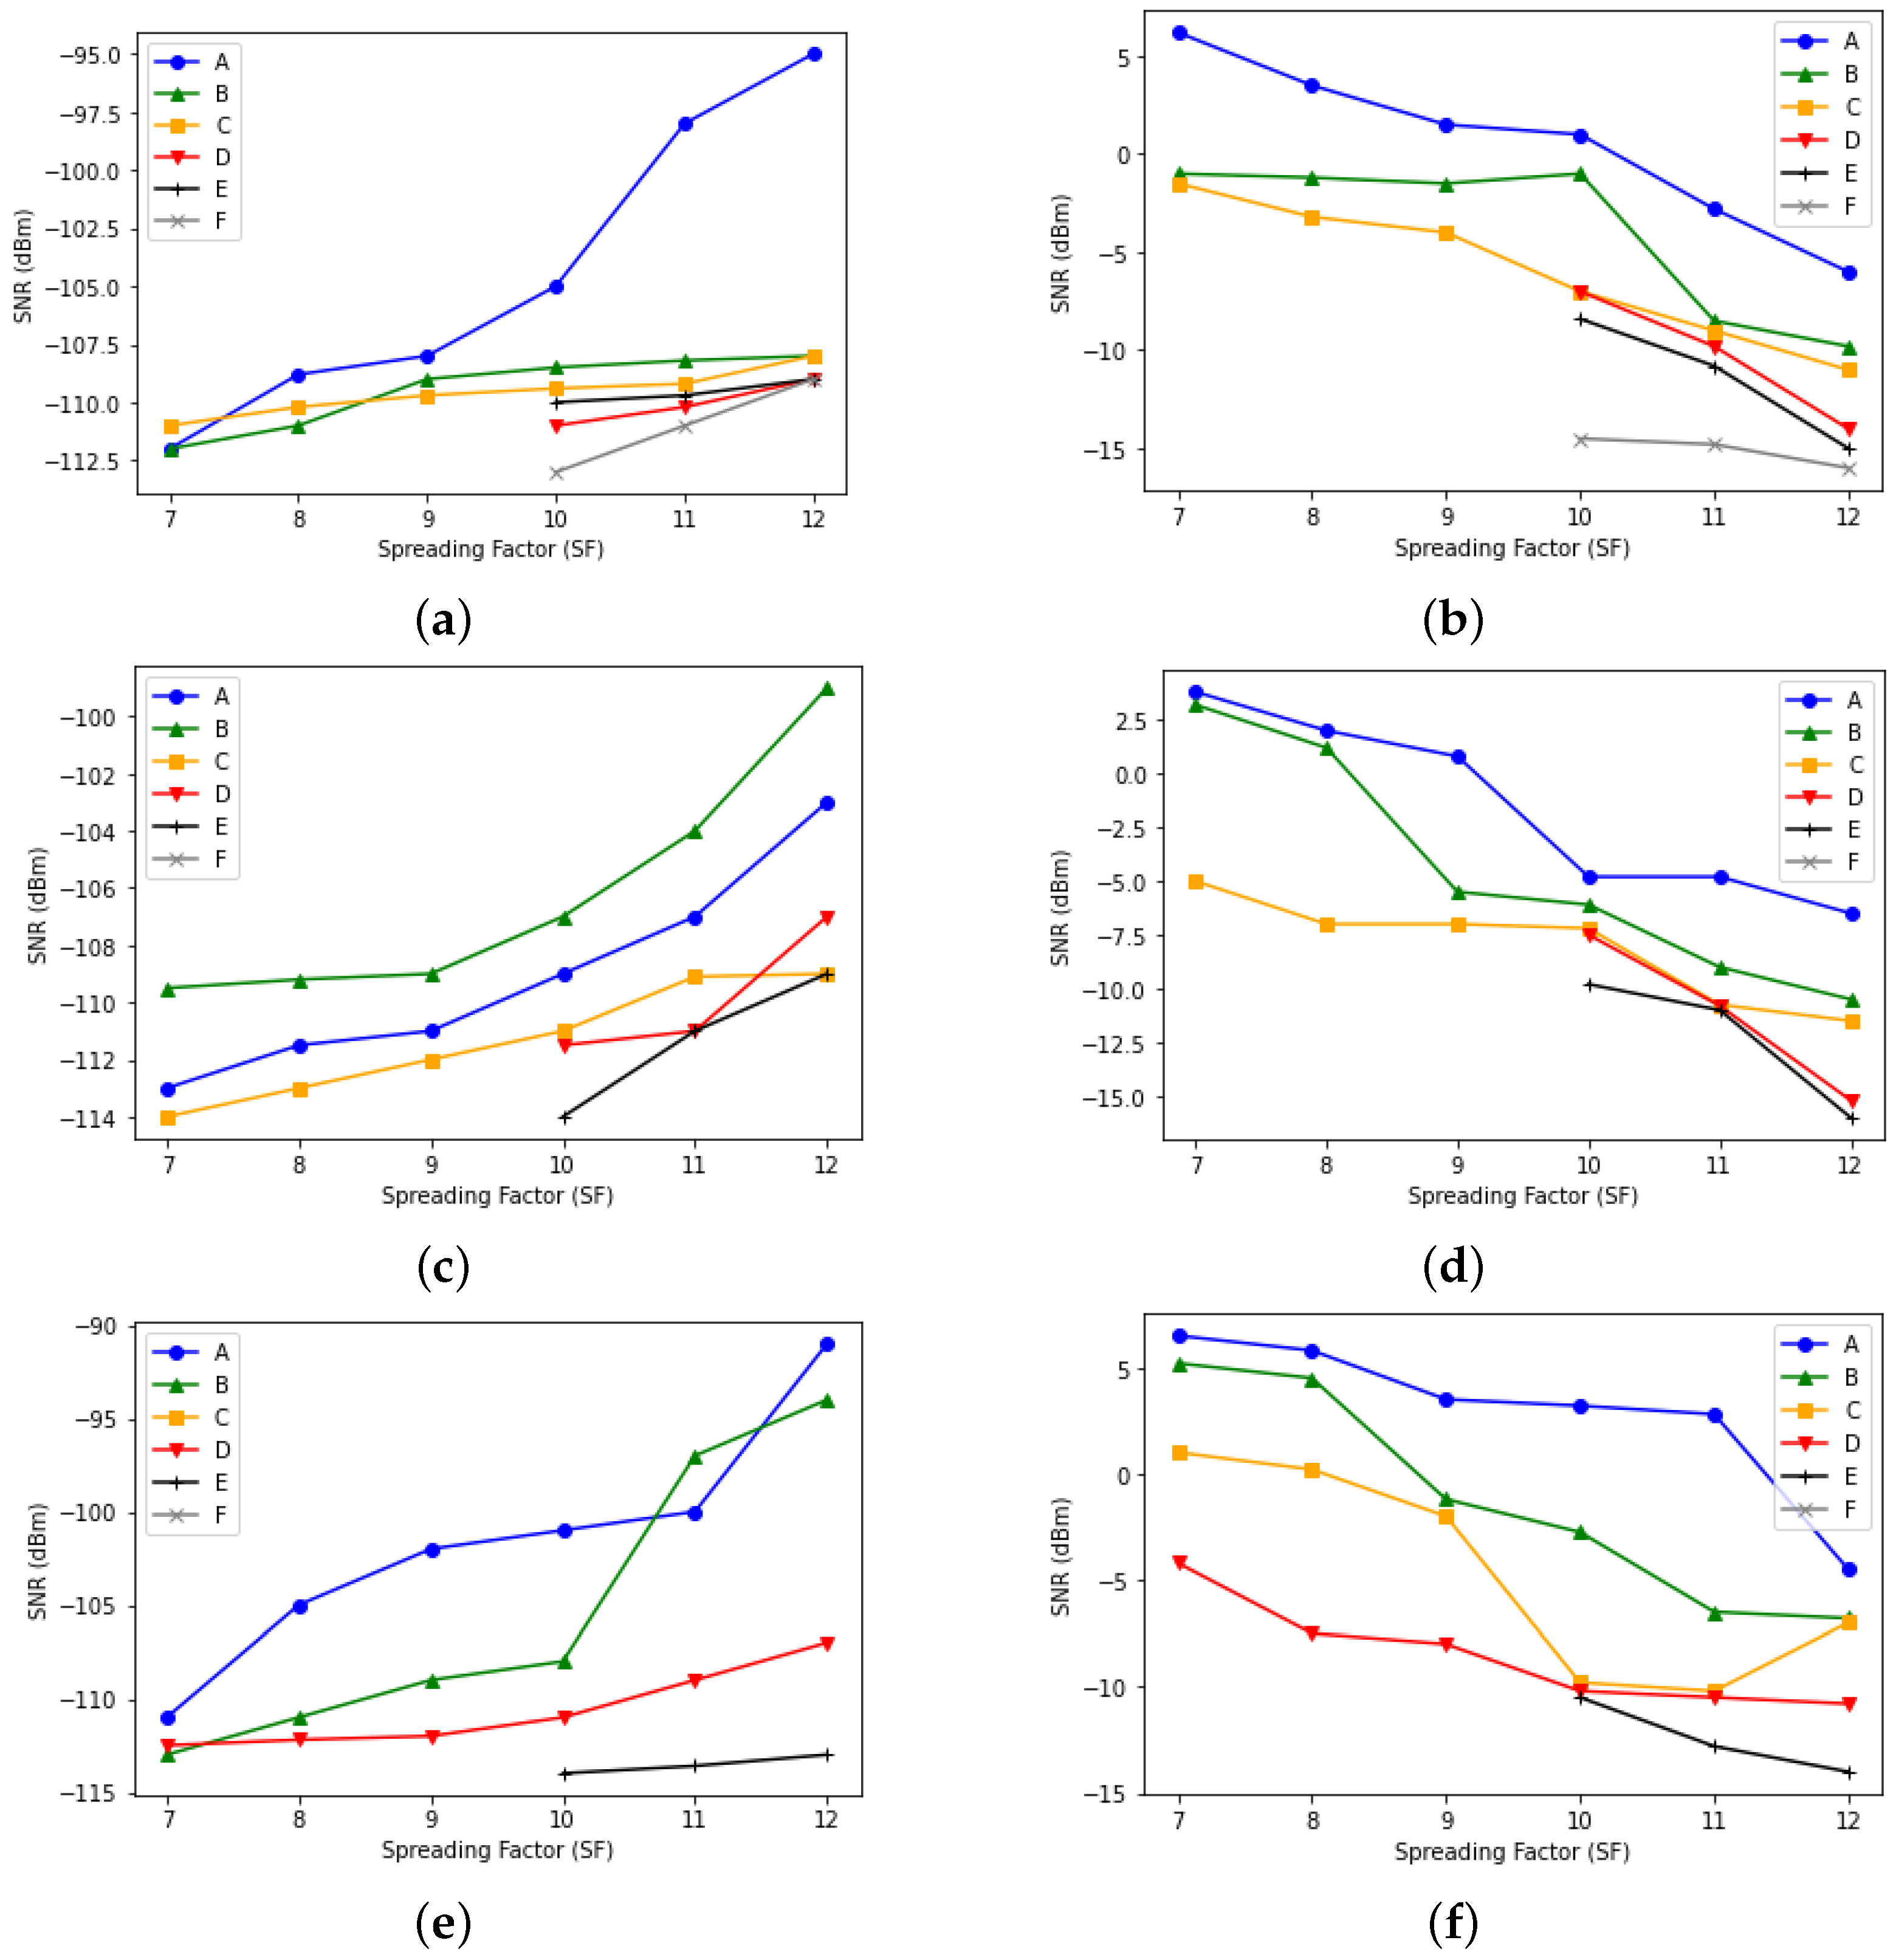

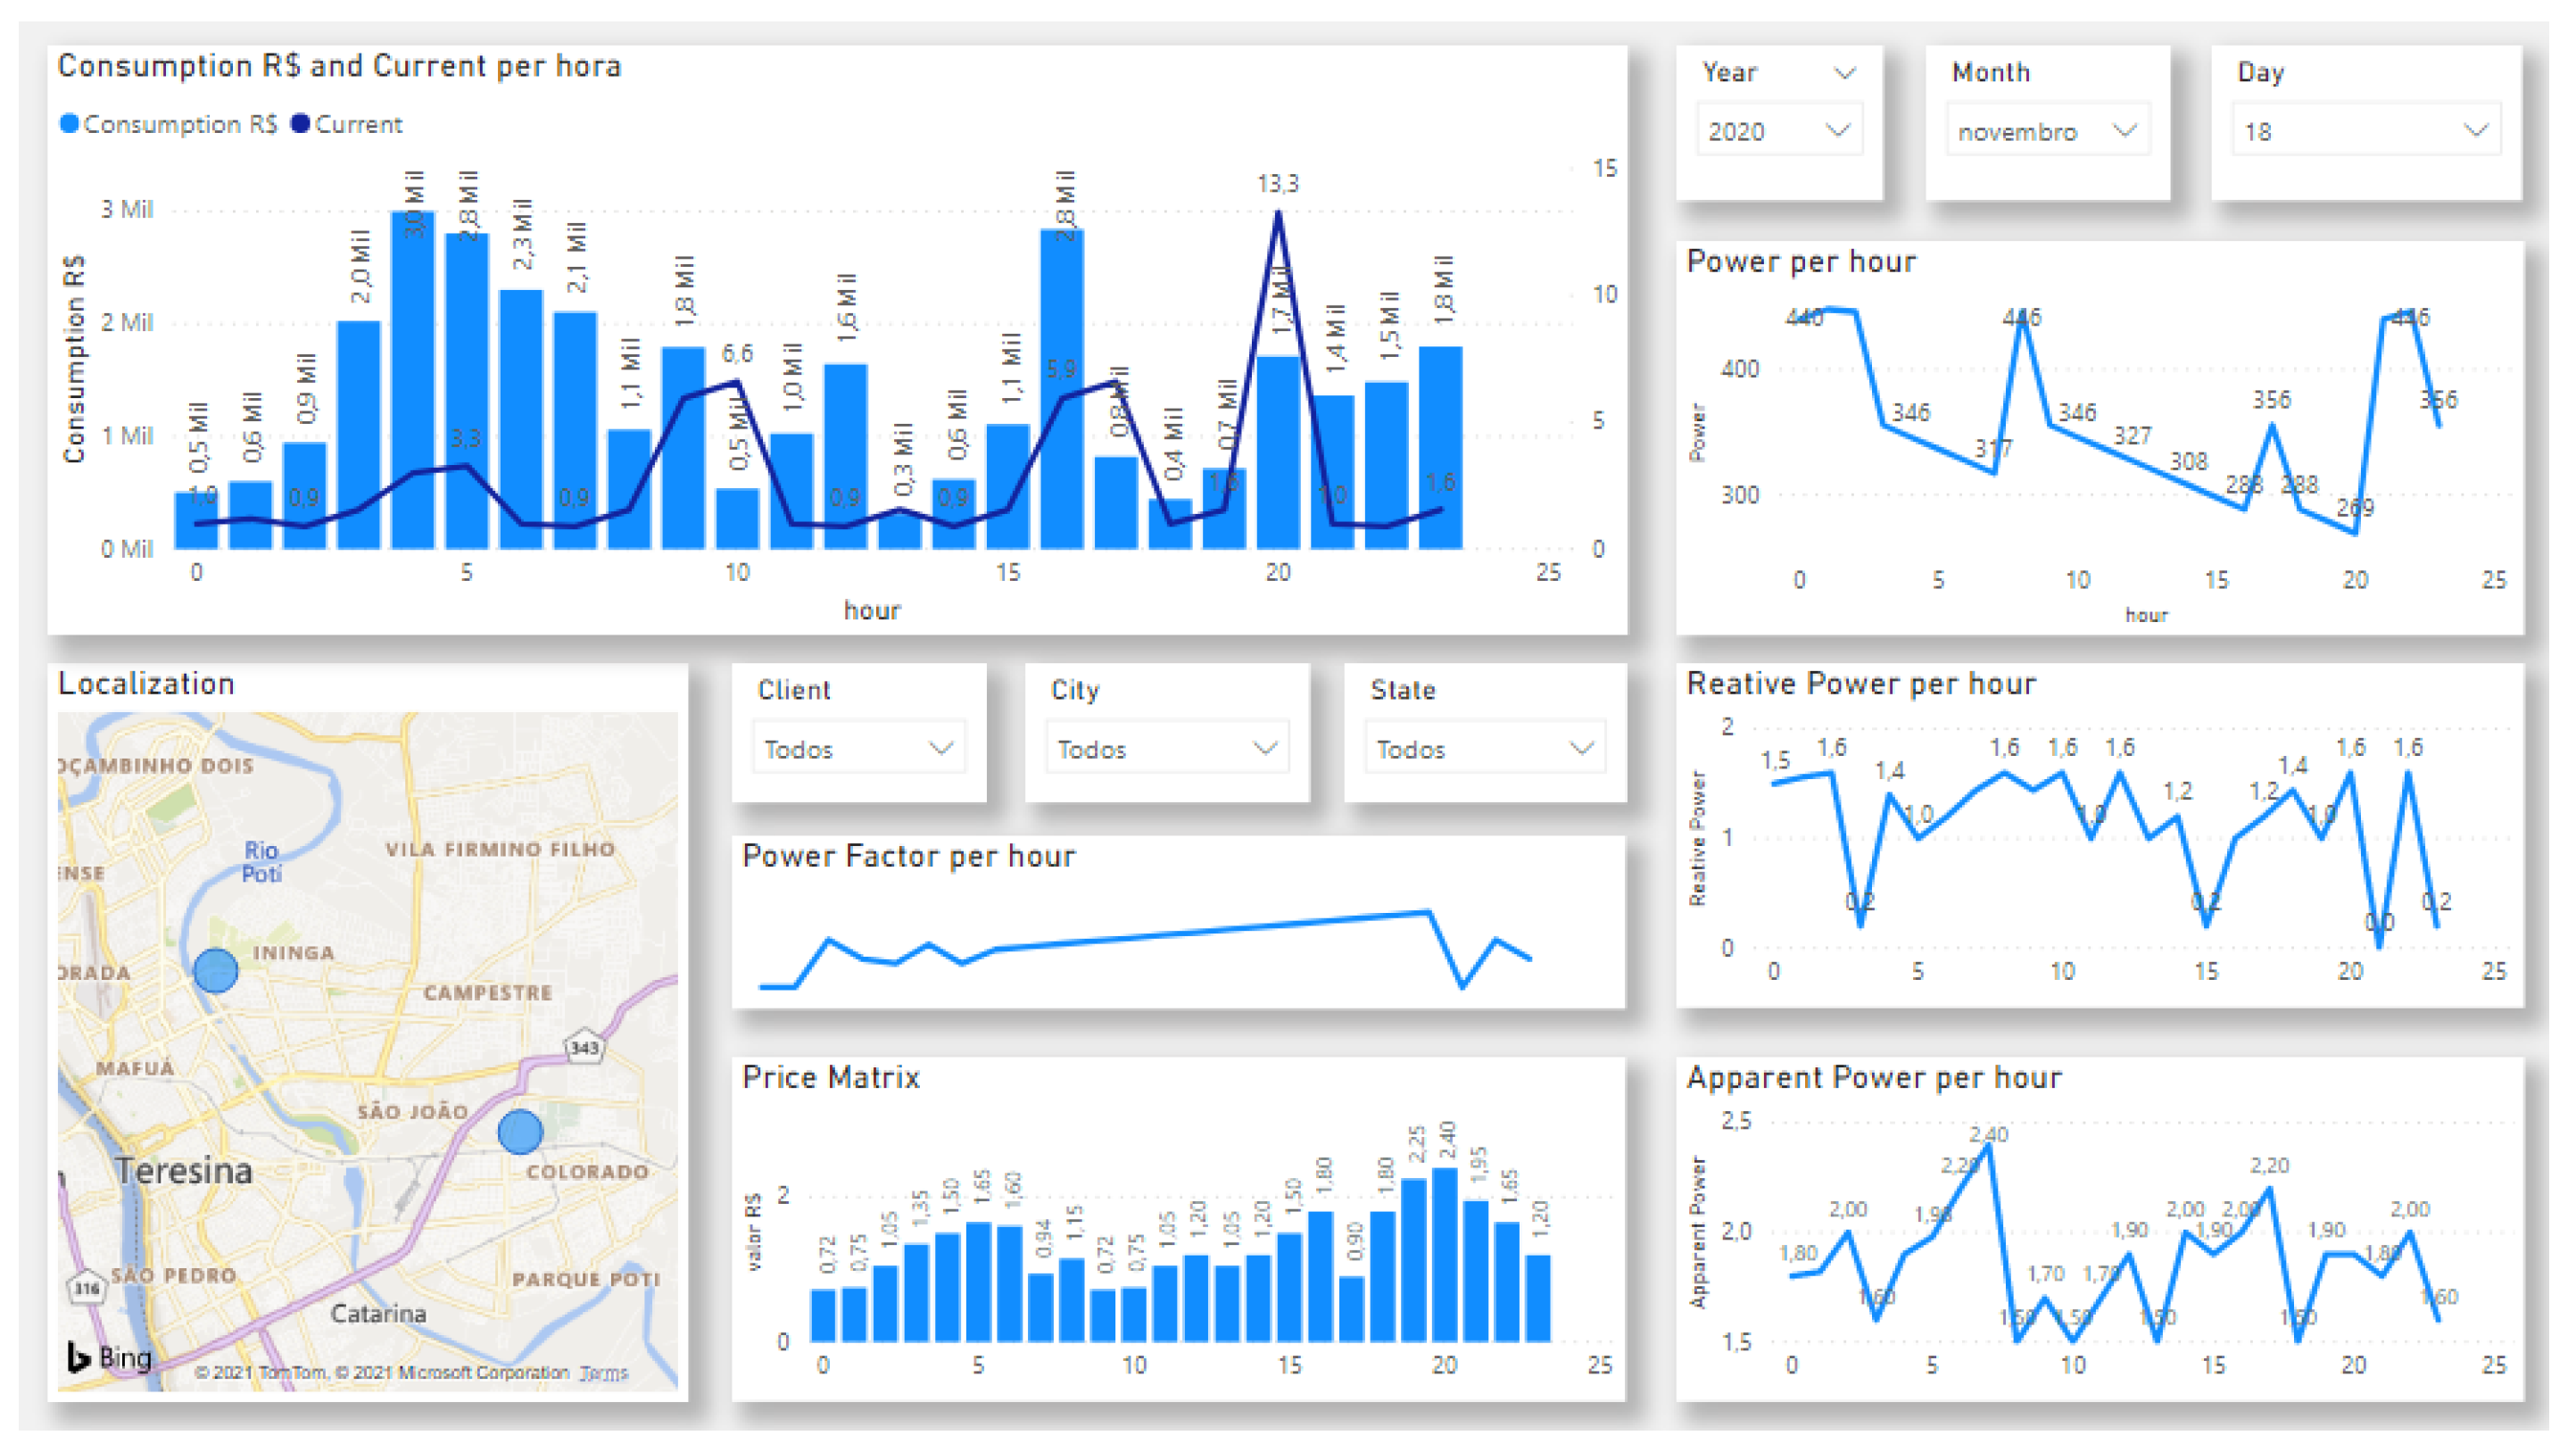
Publisher’s Note: MDPI stays neutral with regard to jurisdictional claims in published maps and institutional affiliations. |
© 2021 by the authors. Licensee MDPI, Basel, Switzerland. This article is an open access article distributed under the terms and conditions of the Creative Commons Attribution (CC BY) license (https://creativecommons.org/licenses/by/4.0/).