
Molecular Organisation of Tick-Borne Encephalitis Virus

 , , , , and
Abstract
:1. Introduction
2. Materials and Methods
2.1. Cell Culture
2.2. Virus Propagation and Titration
2.3. Virus Purification
2.4. Inactivation and Cryo-EM Sample Preparation
2.5. Cryo-EM Data Collection
2.6. Cryo-EM Reconstruction
2.7. Model Building
2.8. Bioinformatic Analyses
3. Results
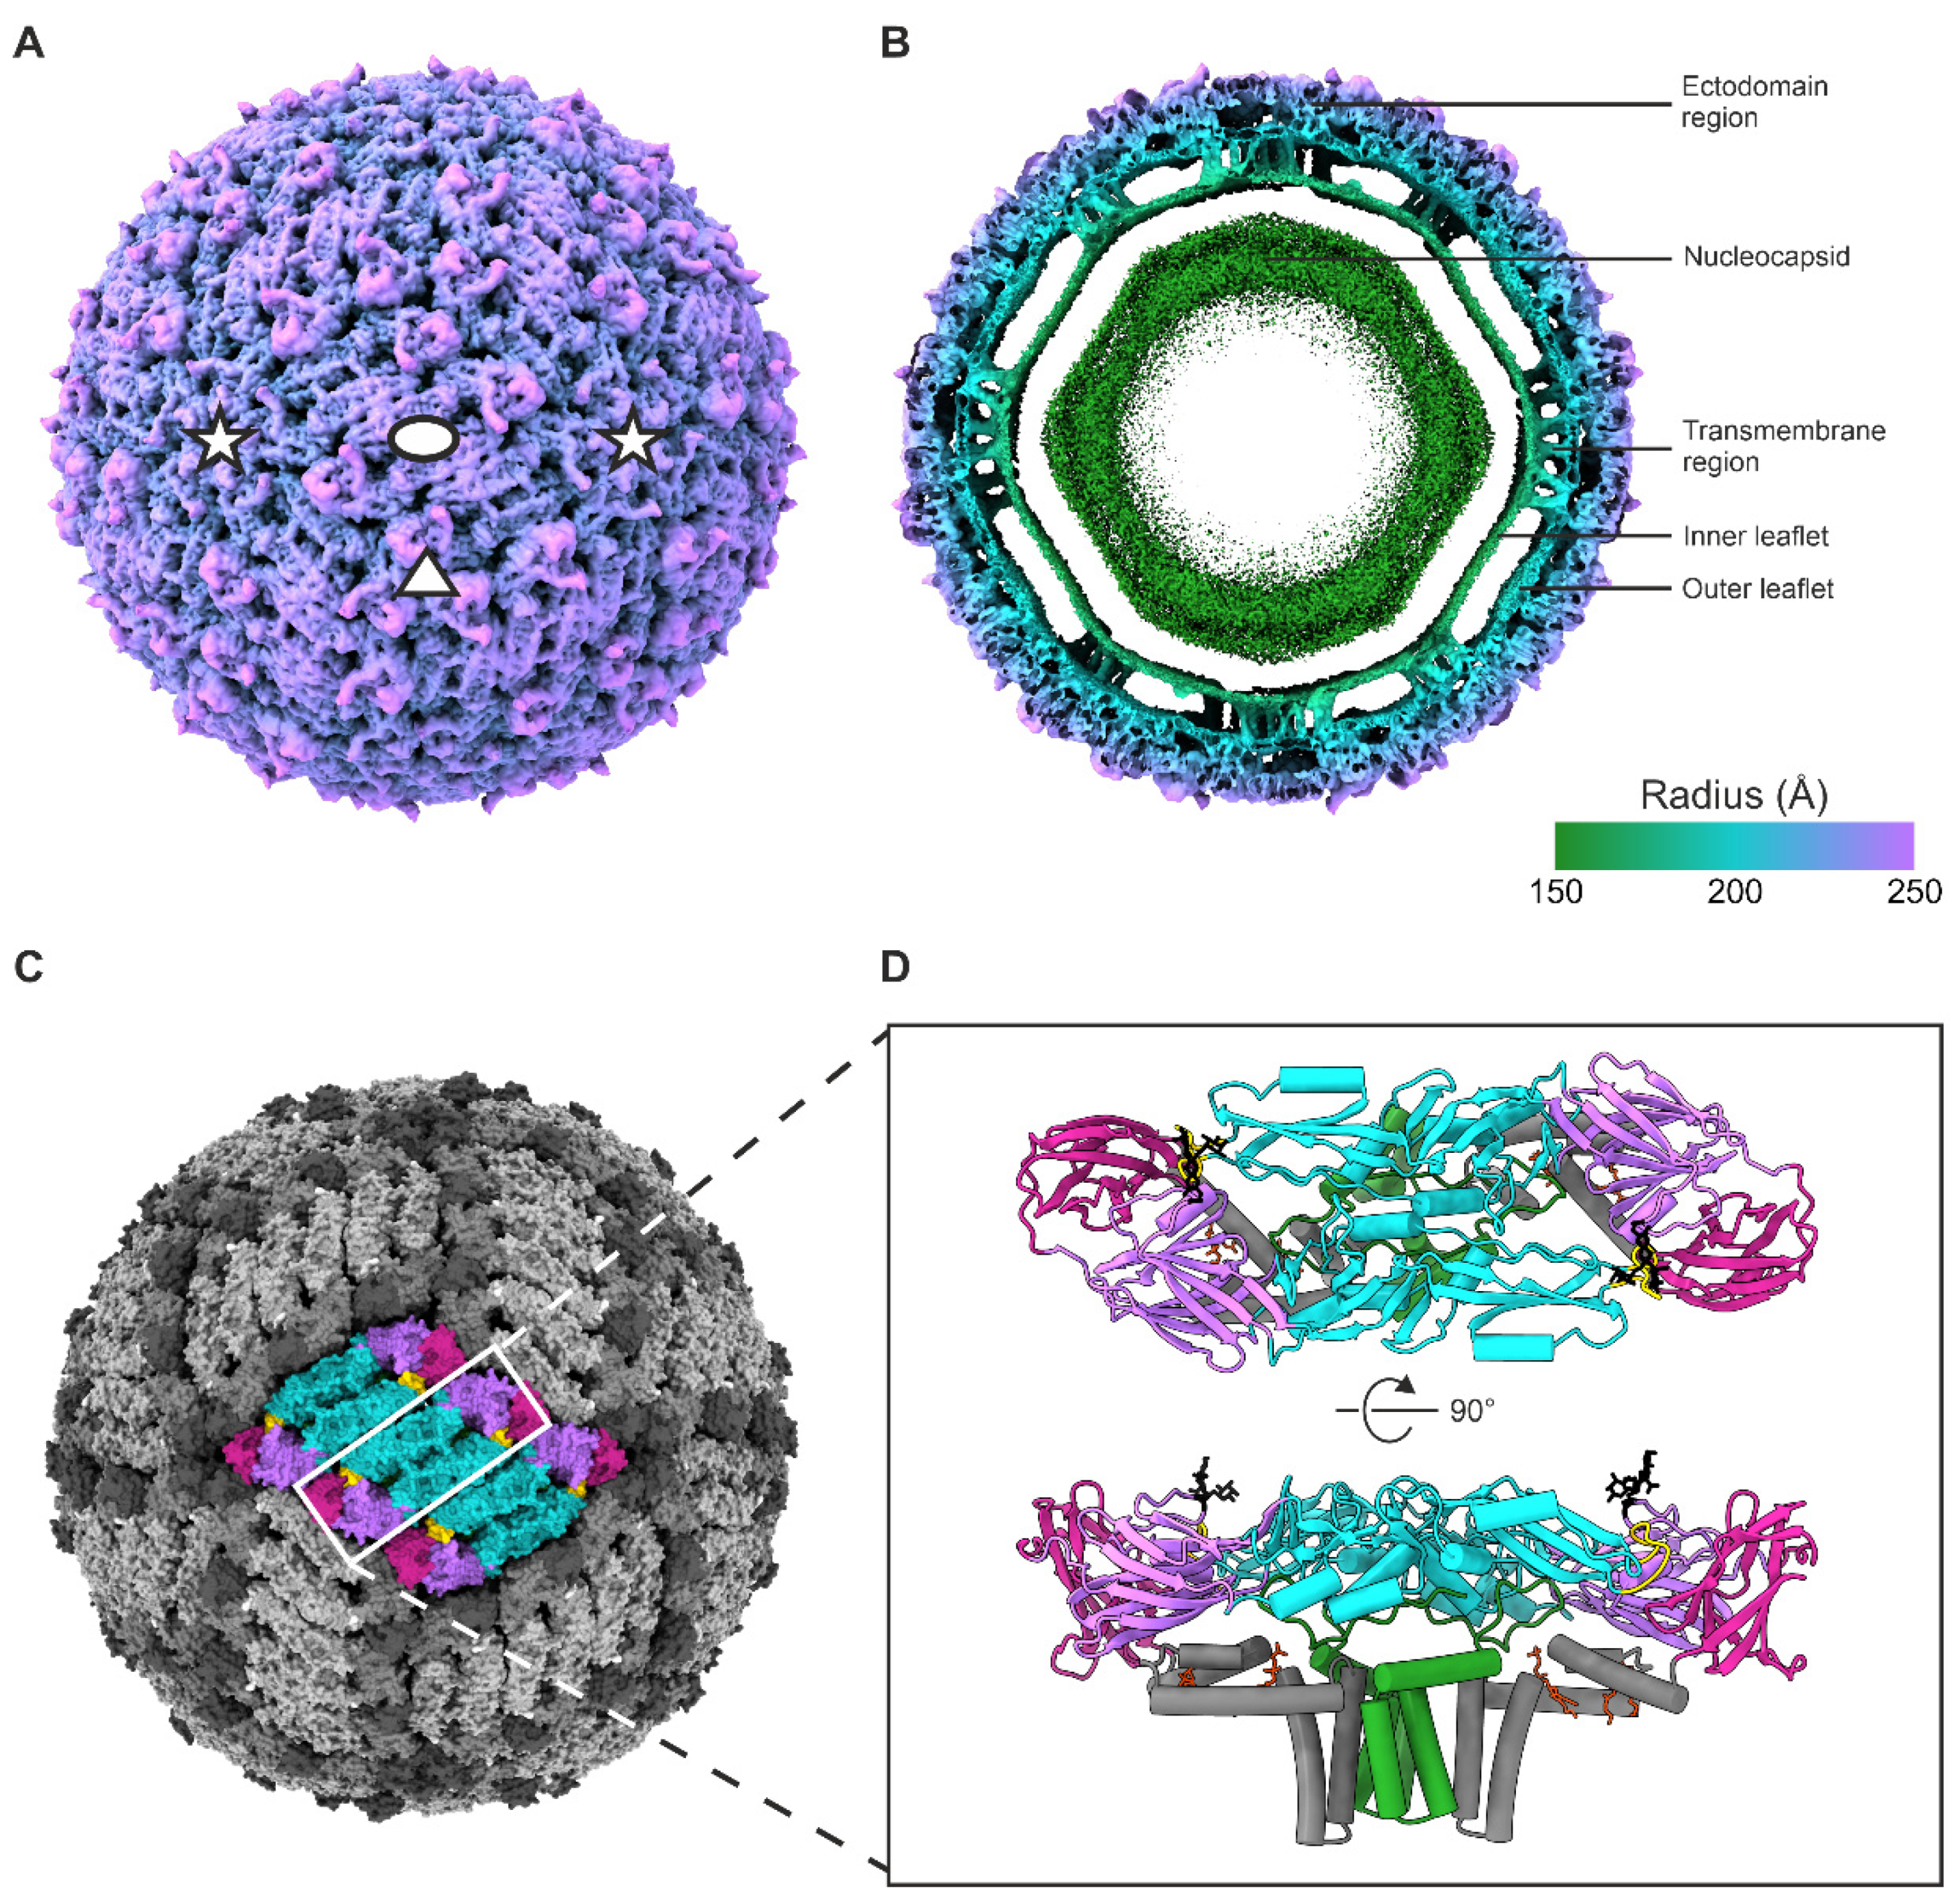
3.1. Cryo-EM Reconstruction of the UV-Inactivated TBEV Virion
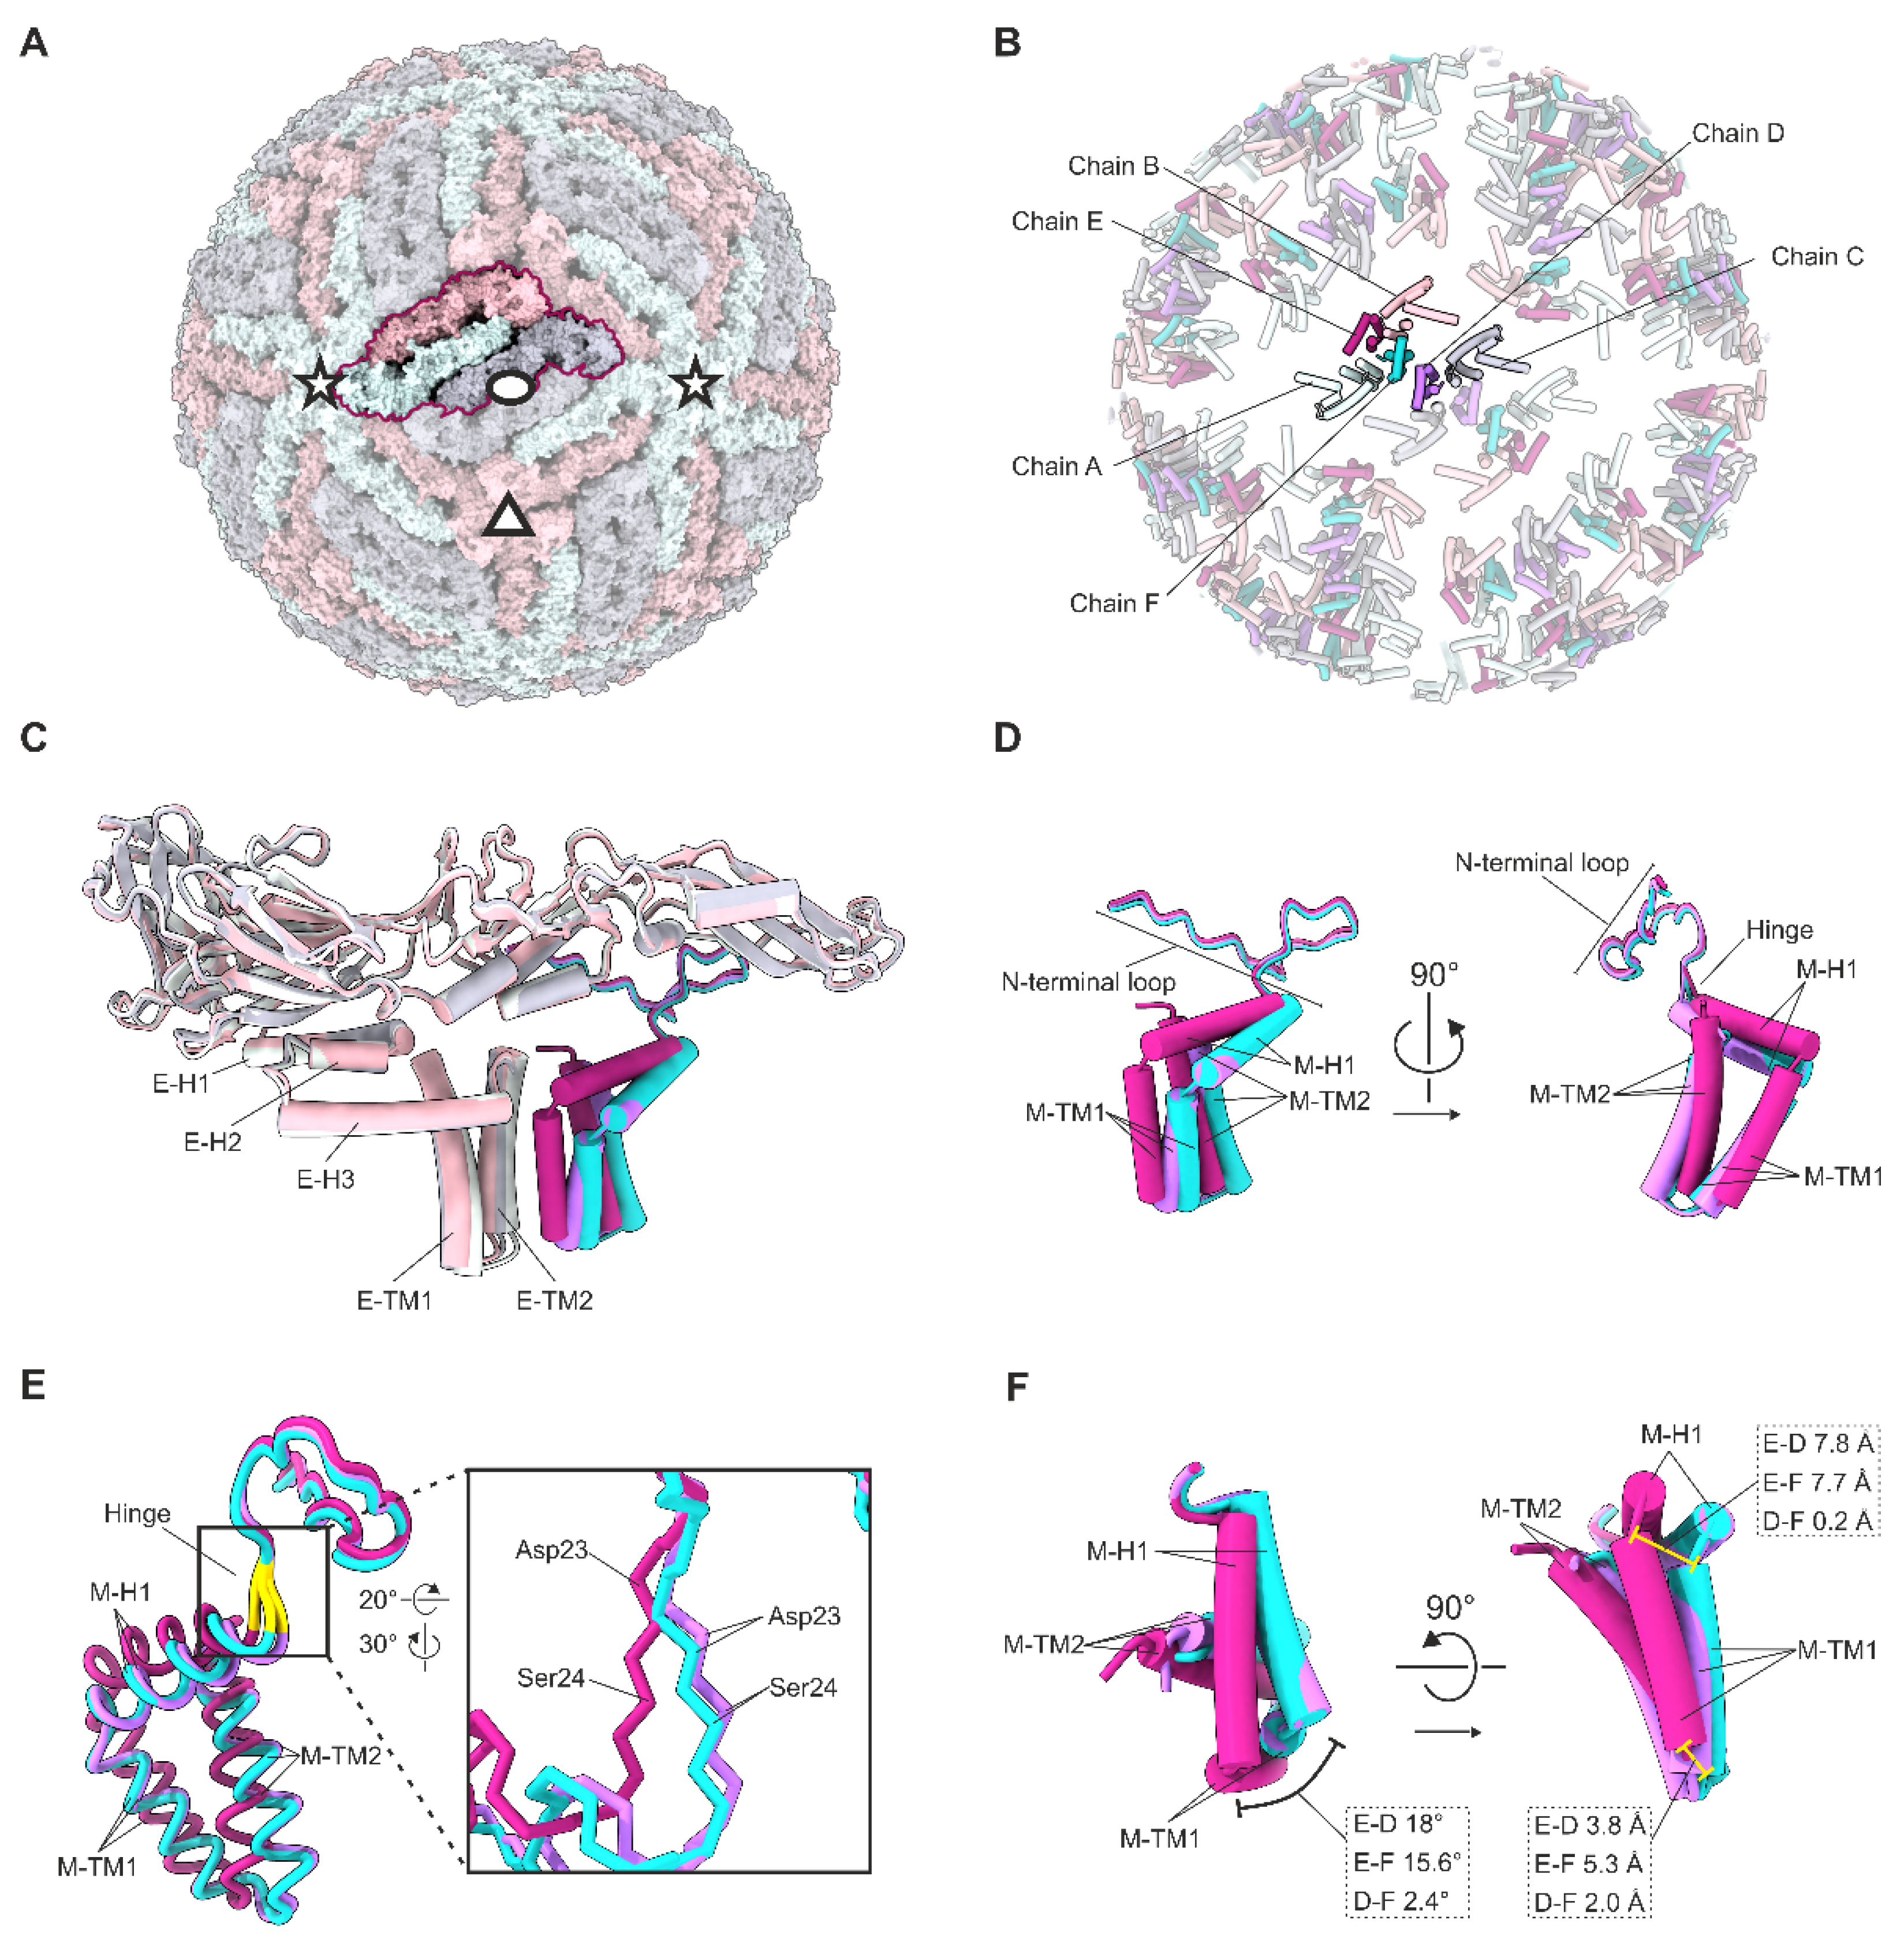
3.2. Quasi-Equivalence within the Asymmetric Unit
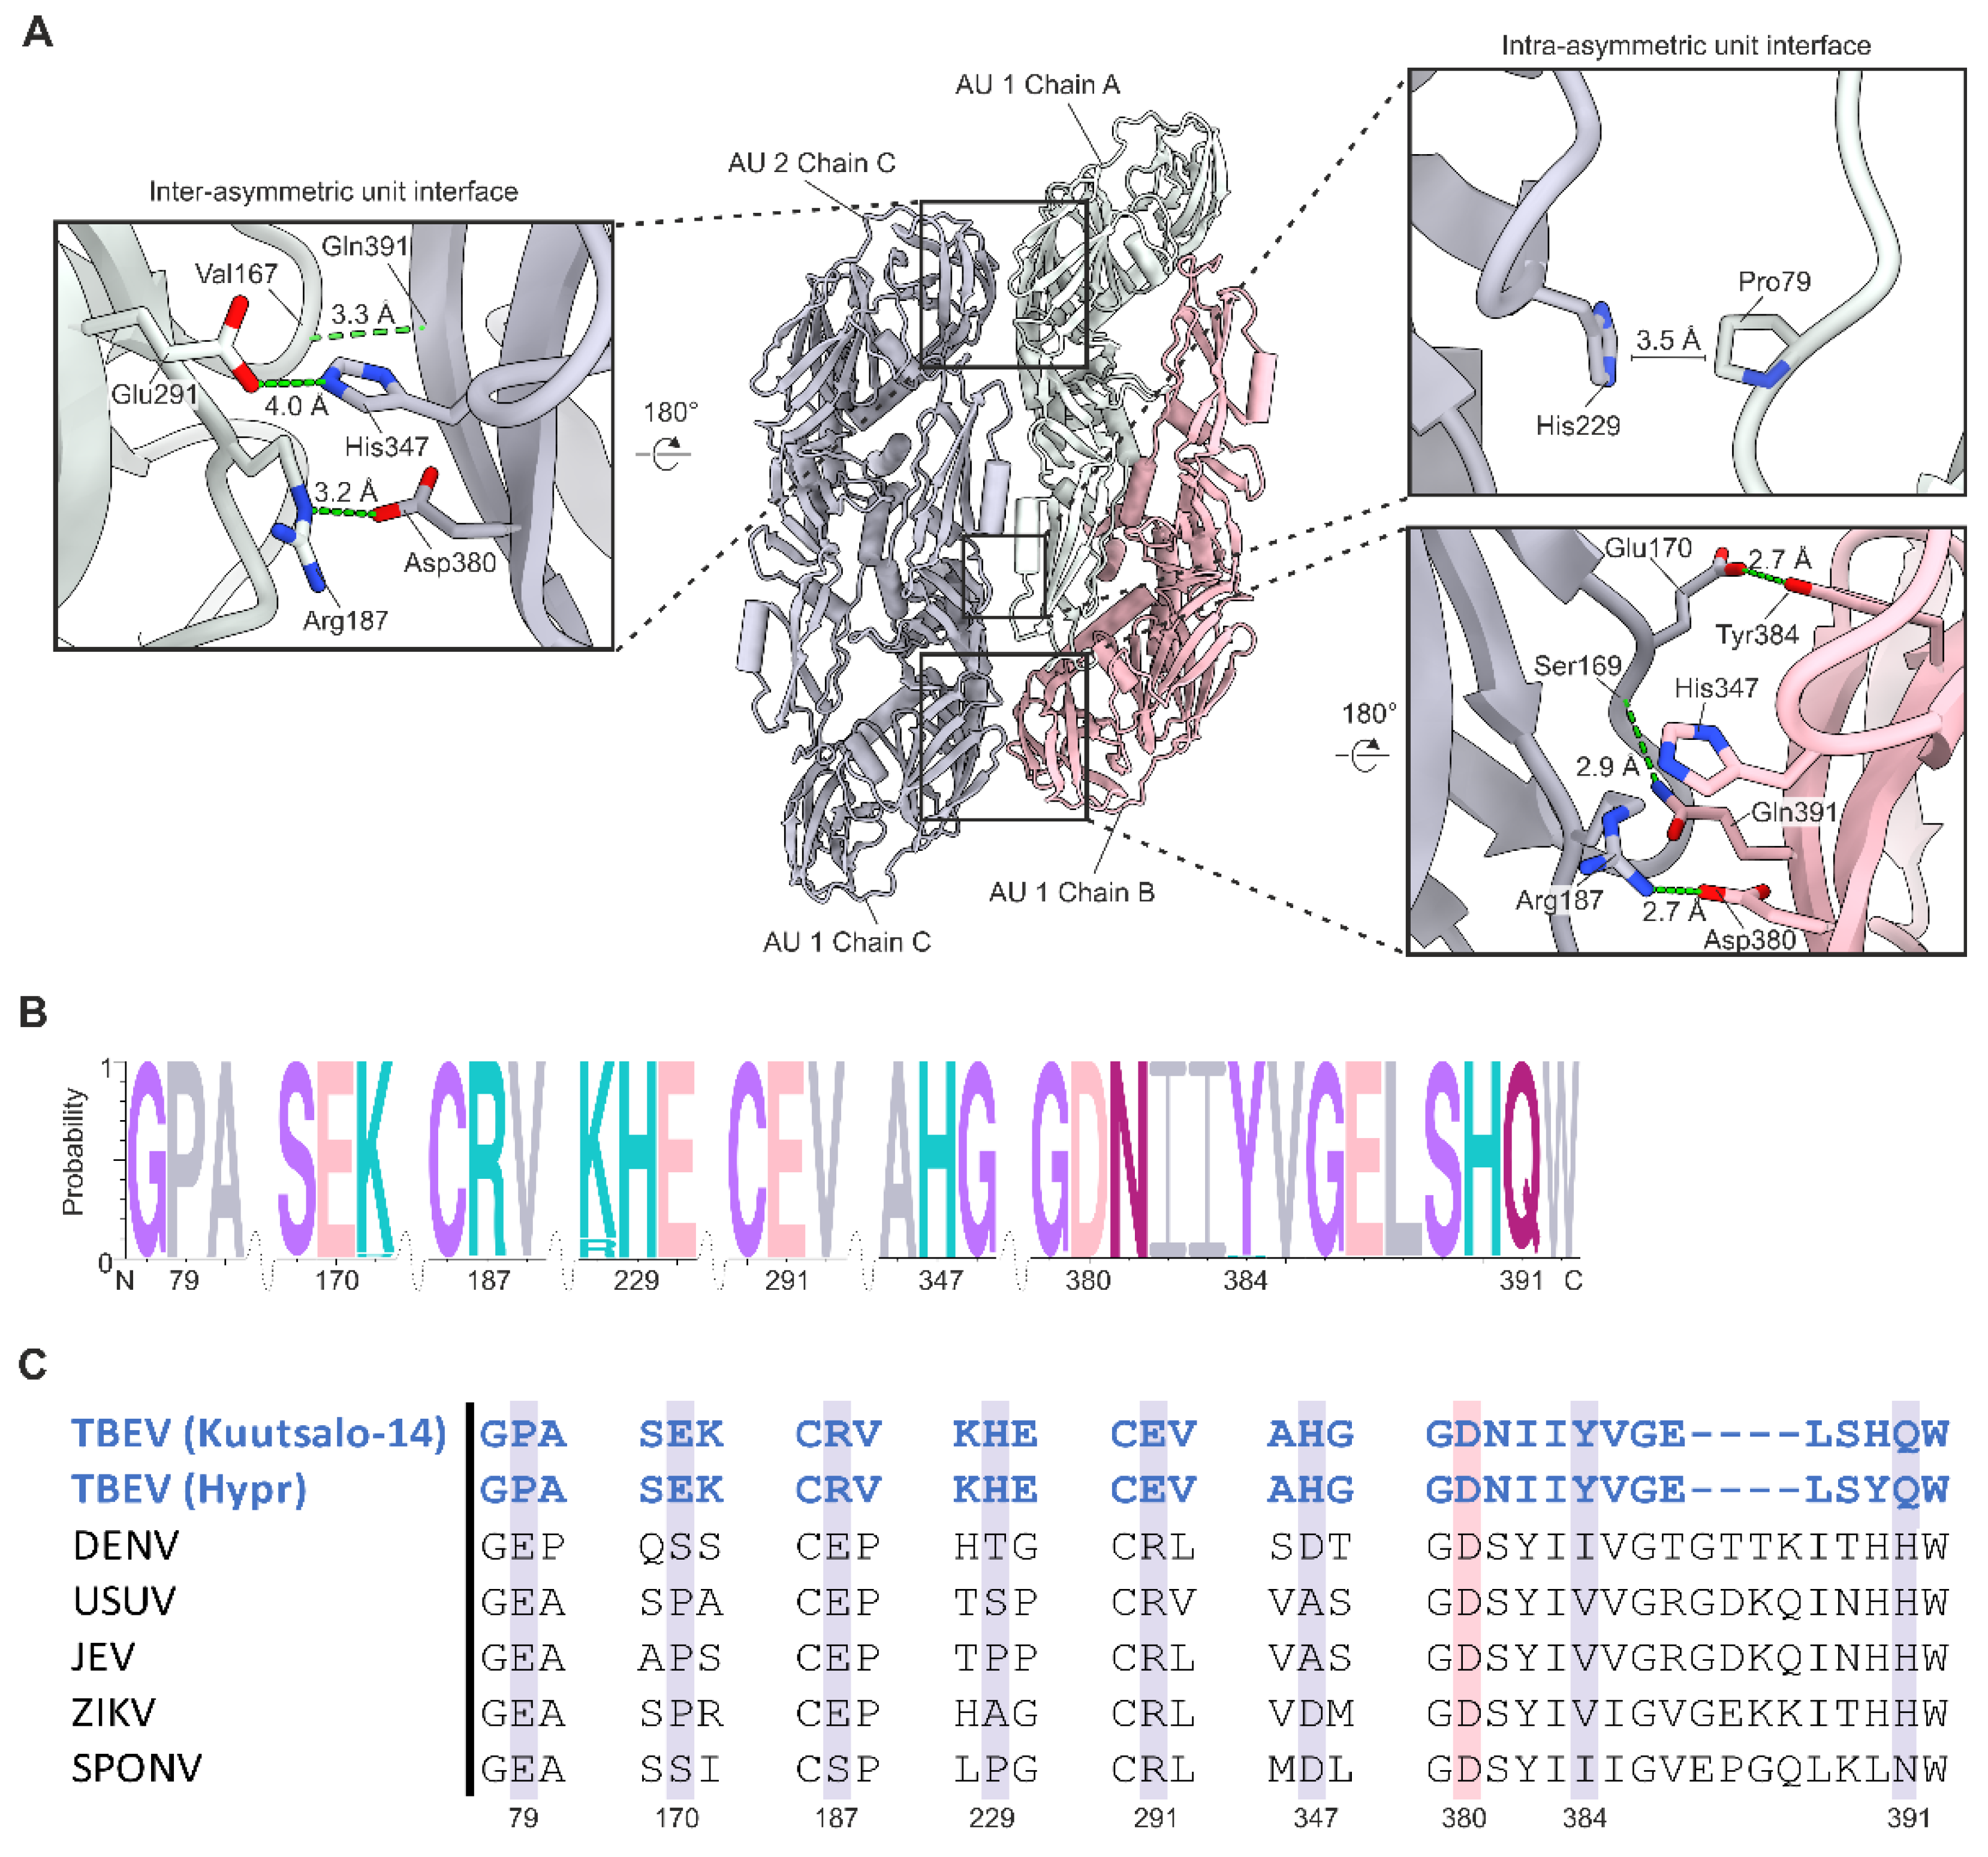
3.3. Stabilising the Raft Structure—Interactions between the Heterotetramer Complexes
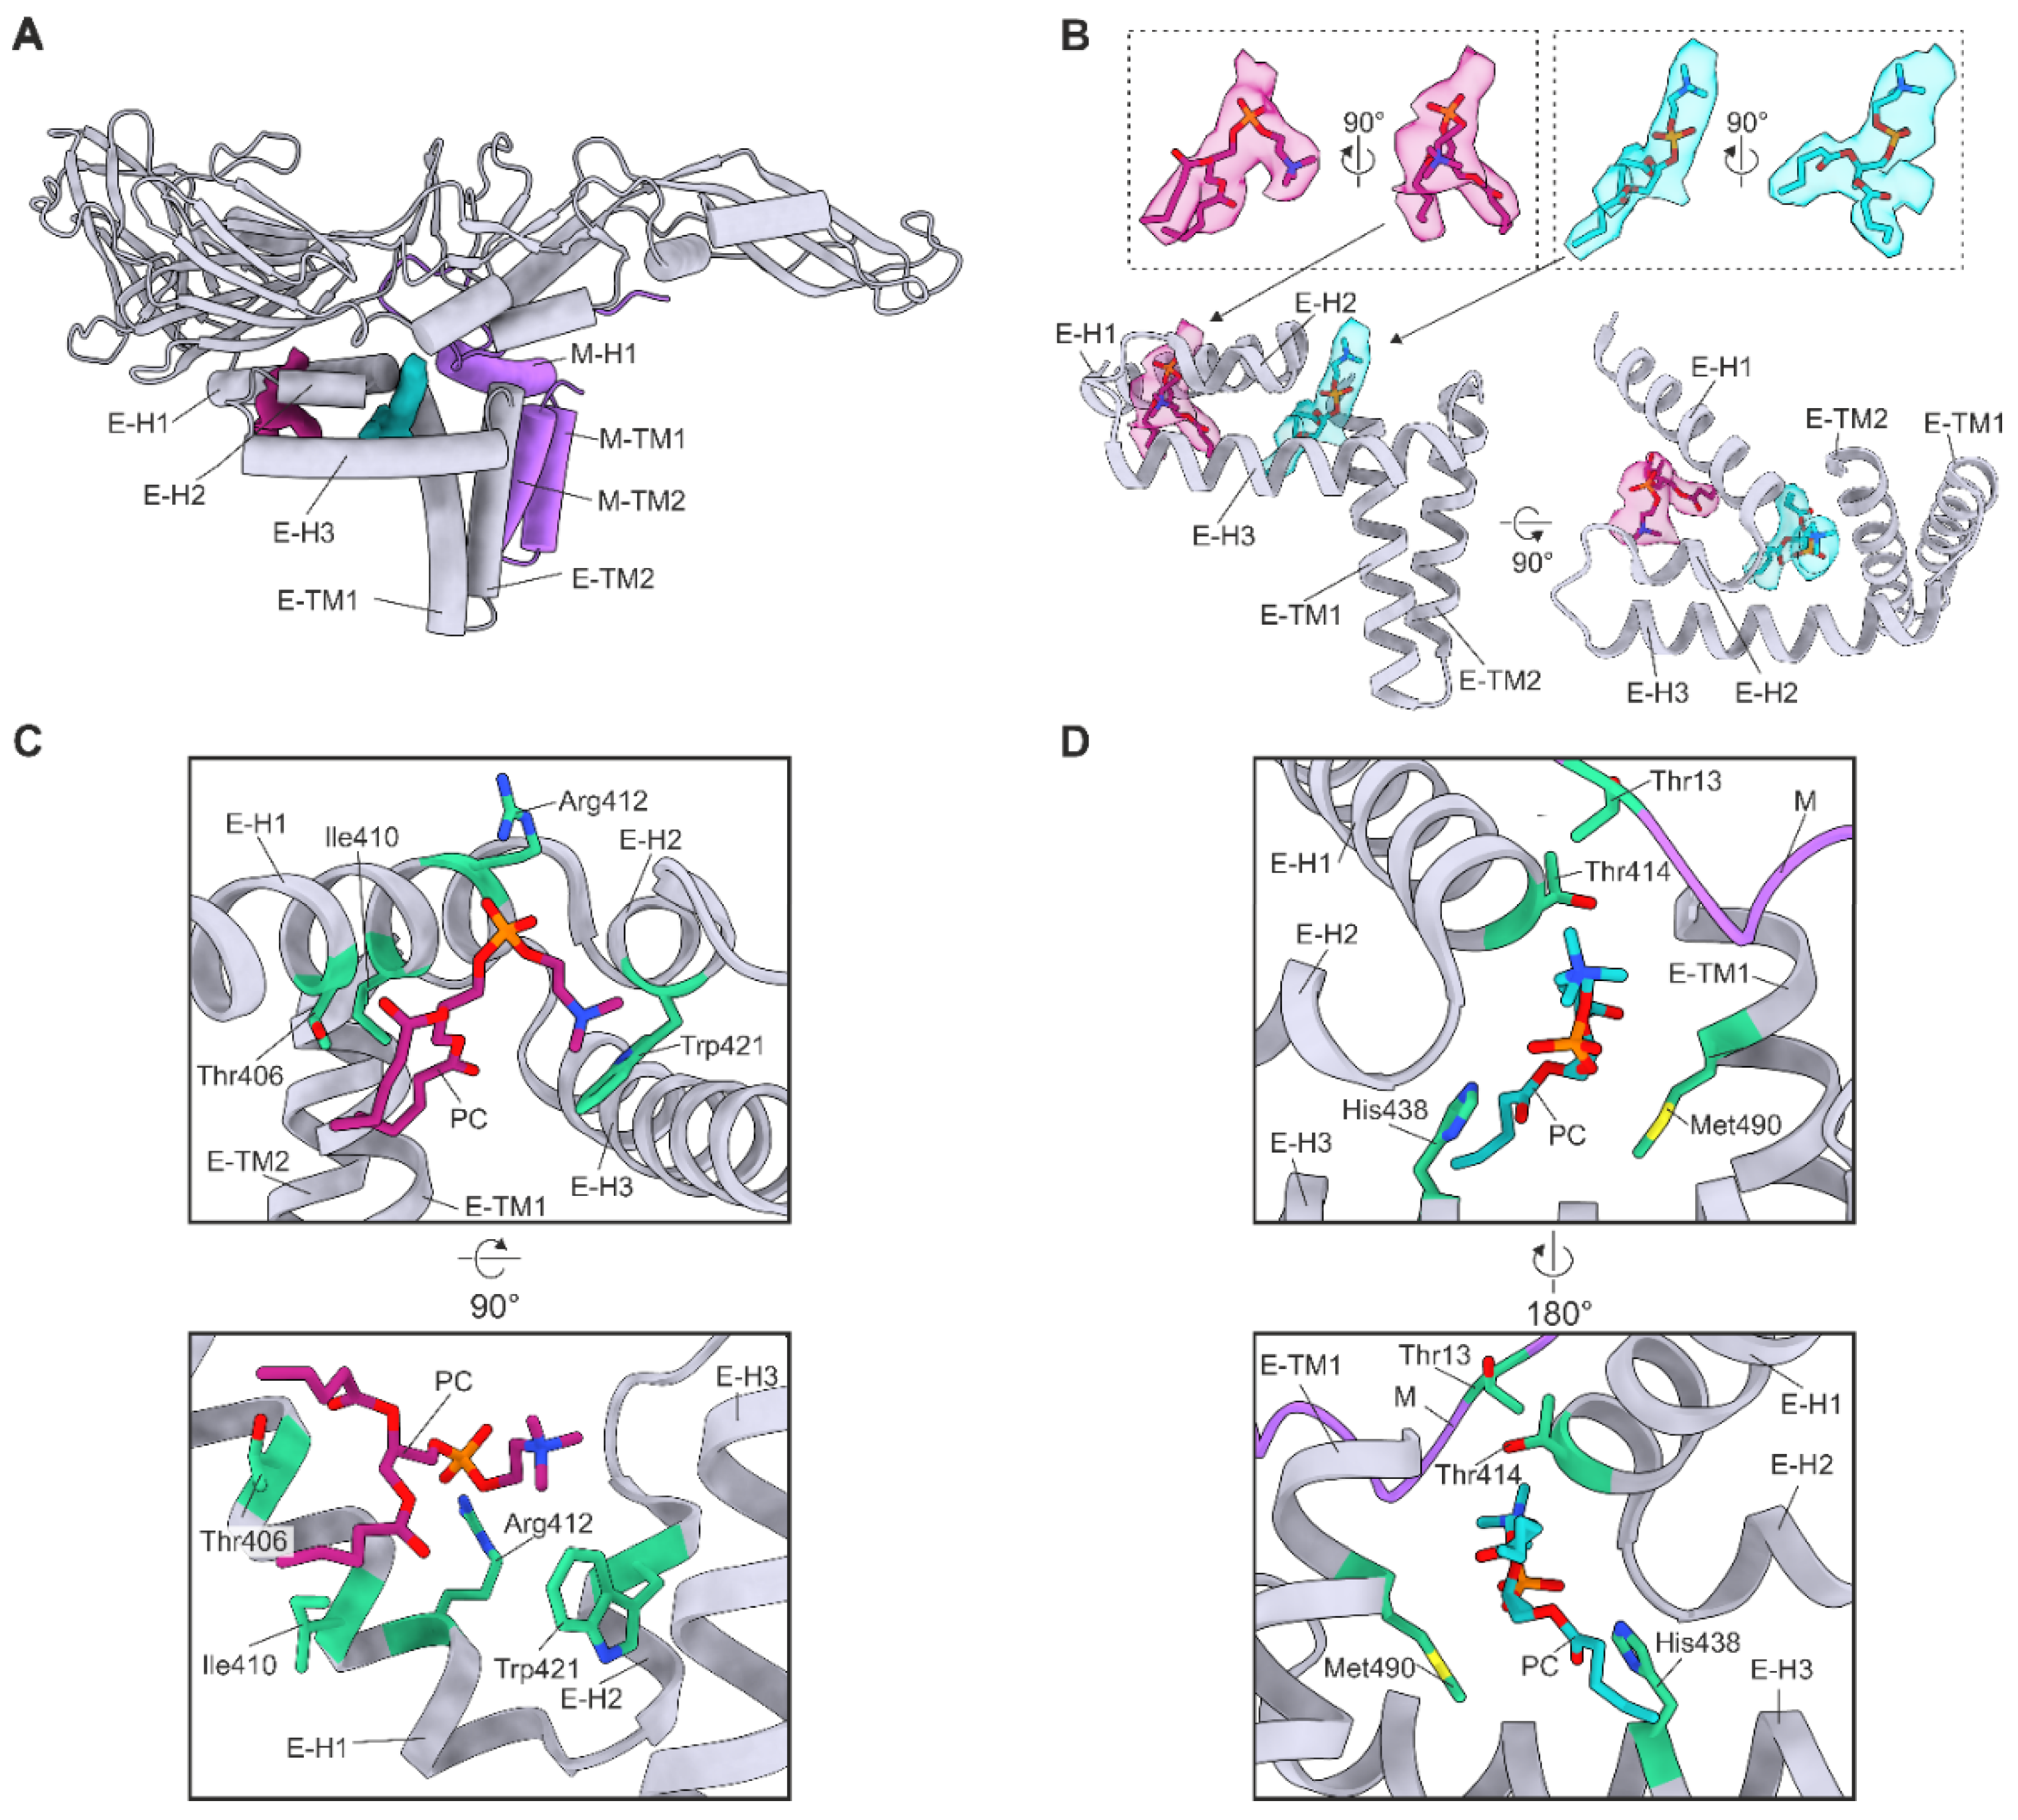
3.4. Lipid Factors
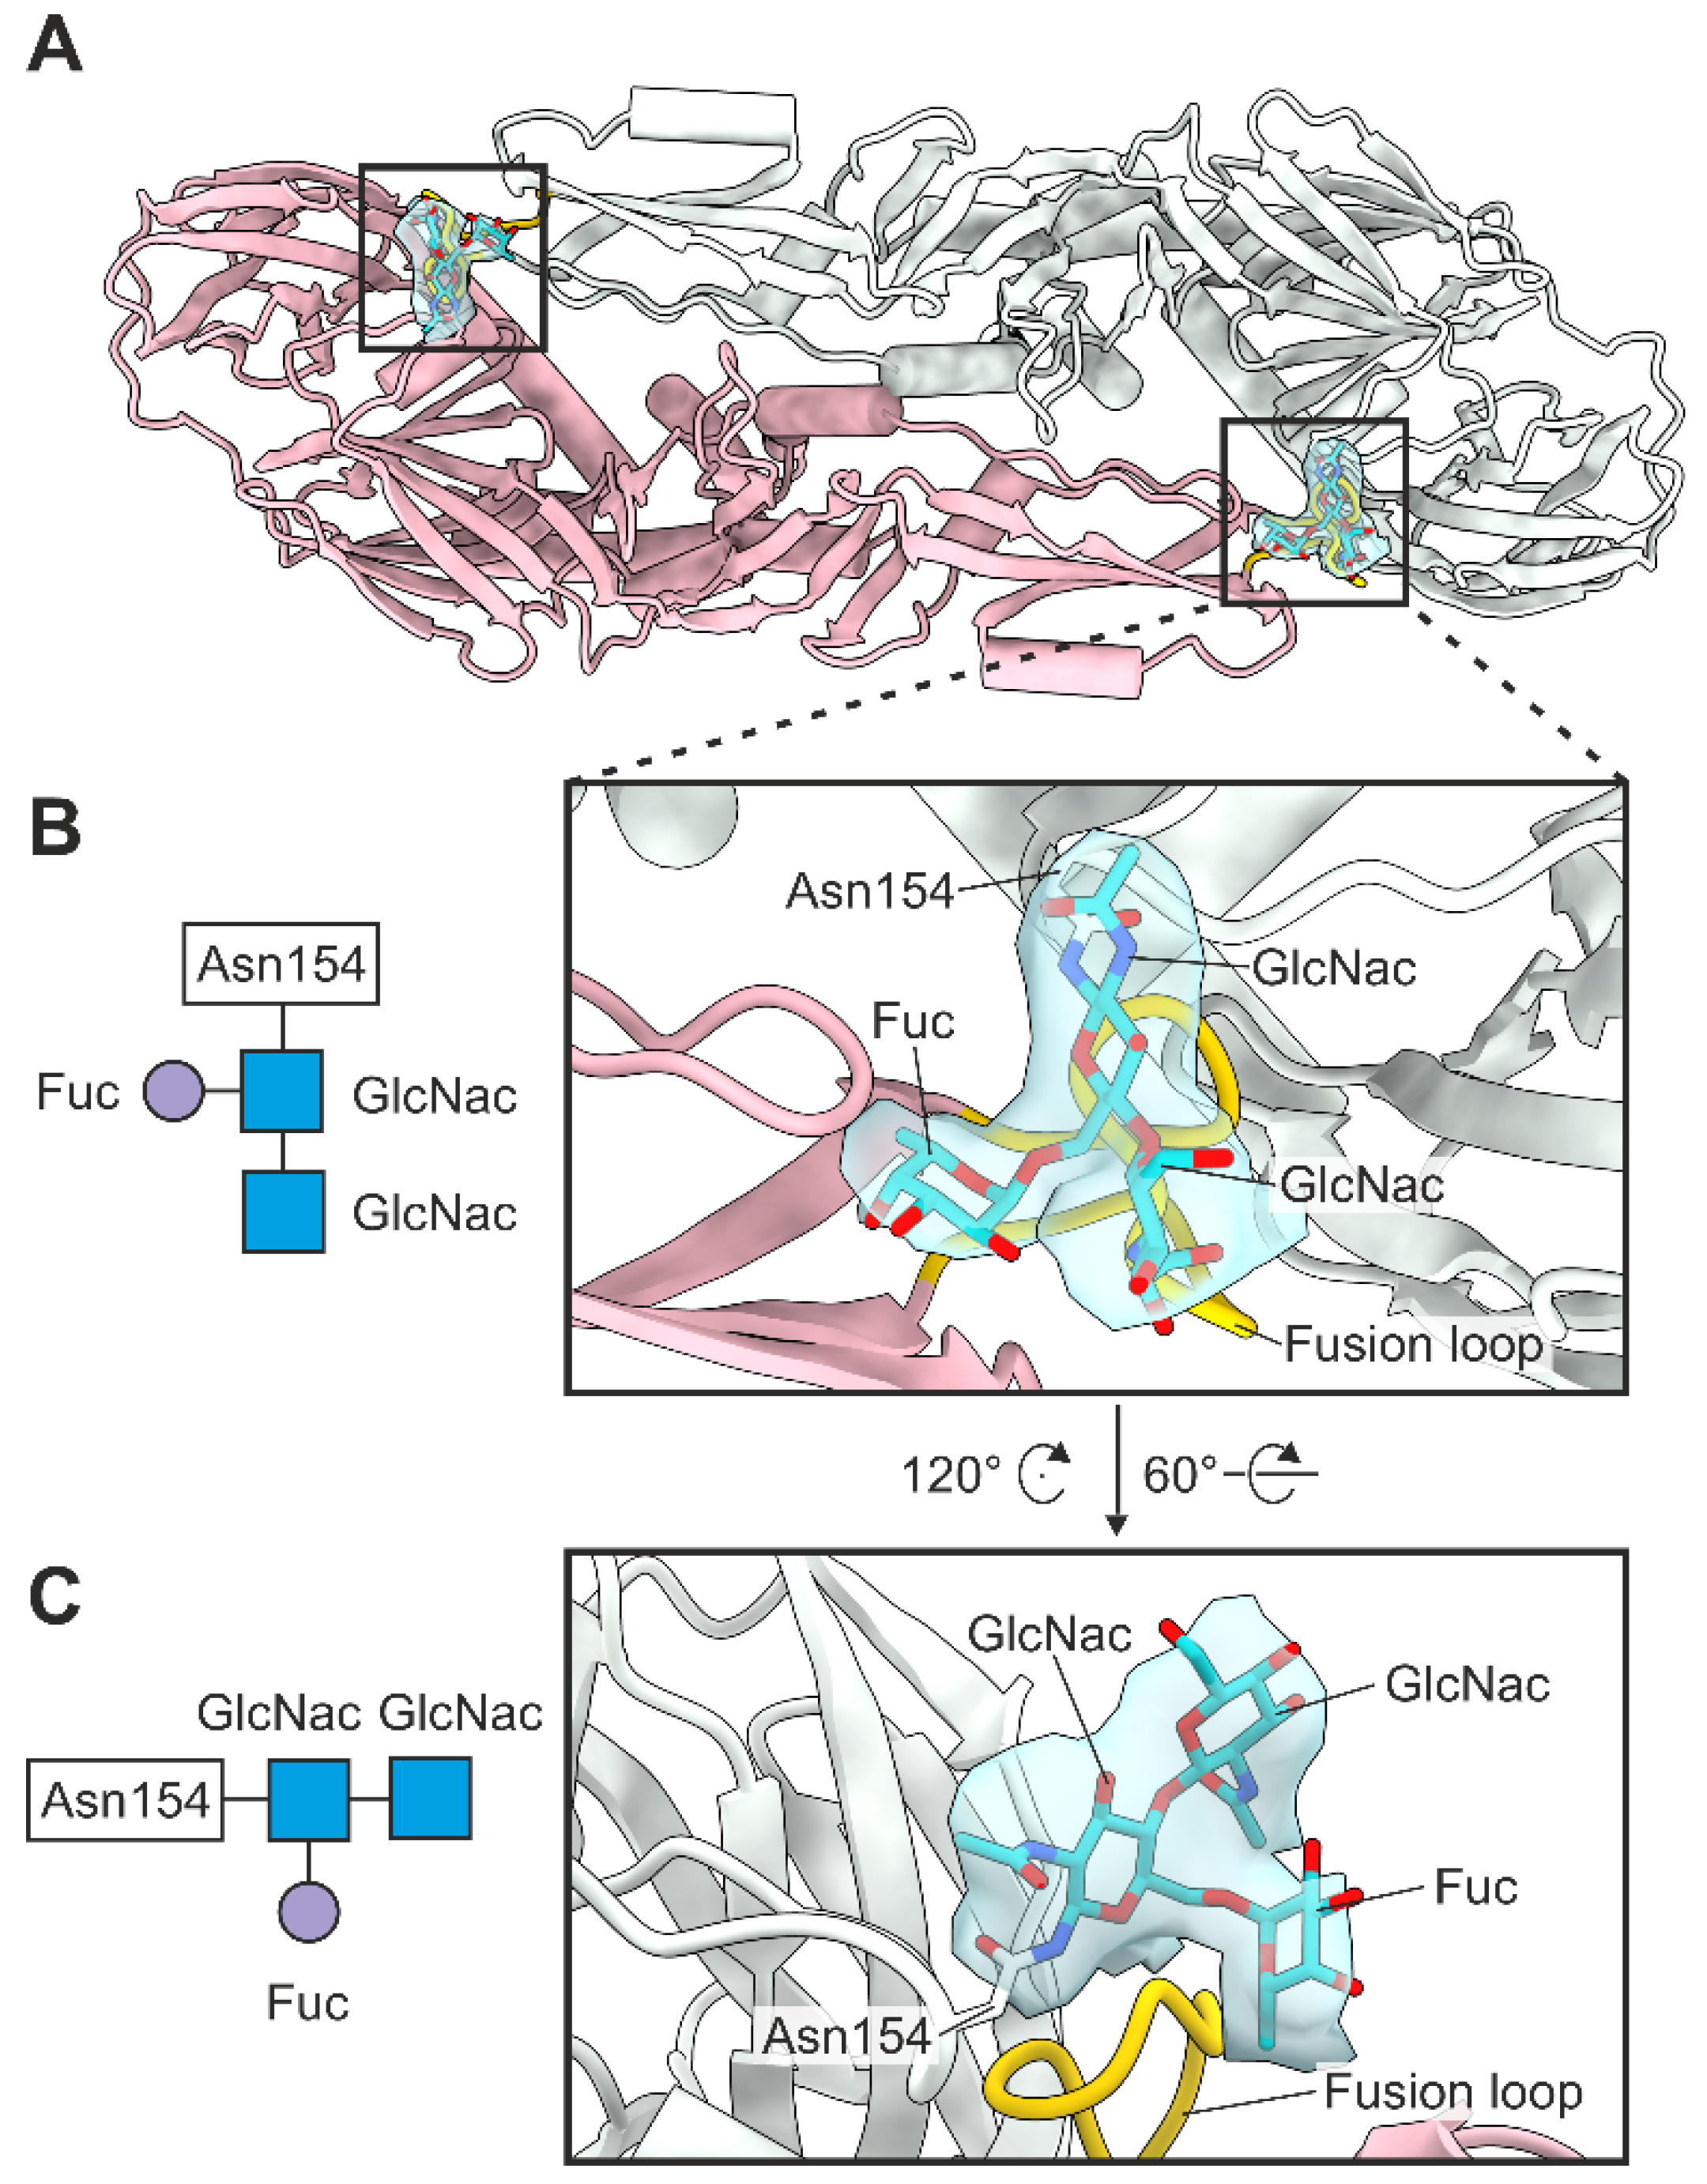
3.5. Glycosylation
4. Discussion
Supplementary Materials
Author Contributions
Funding
Institutional Review Board Statement
Informed Consent Statement
Data Availability Statement
Acknowledgments
Conflicts of Interest
References
- Lindenbach, B.D.; Murray, C.L.; Thiel, H.-J.; Rice, C.M. Flaviviridae. In Fields Virology; Knipe, D., Howley, P., Eds.; Lippincott Williams & Wilkins: Philadelphia, PA, USA, 2013. [Google Scholar]
- Bogovic, P.; Strle, F. Tick-borne encephalitis: A review of epidemiology, clinical characteristics, and management. World J. Clin. Cases 2015, 3, 430. [Google Scholar] [CrossRef] [PubMed]
- Ruzek, D.; Županc, T.A.; Borde, J.; Chrdle, A.; Eyer, L.; Karganova, G.; Kholodilov, I.; Knap, N.; Kozlovskaya, L.; Matveev, A.; et al. Tick-borne encephalitis in Europe and Russia: Review of pathogenesis, clinical features, therapy, and vaccines. Antivir. Res. 2019, 164, 23–51. [Google Scholar] [CrossRef] [PubMed]
- Füzik, T.; Formanová, P.; Růžek, D.; Yoshii, K.; Niedrig, M.; Plevka, P. Structure of tick-borne encephalitis virus and its neutralization by a monoclonal antibody. Nat. Commun. 2018, 9, 436. [Google Scholar] [CrossRef] [Green Version]
- Guirakhoo, F.; Heinz, F.X.; Kunz, C. Epitope model of tick-borne encephalitis virus envelope glycoprotein E: Analysis of structural properties, role of carbohydrate side chain, and conformational changes occurring at acidic pH. Virology 1989, 169, 90–99. [Google Scholar] [CrossRef]
- Protopopova, E.V.; Sorokin, A.V.; Konovalova, S.N.; Kachko, A.V.; Netesov, S.V.; Loktev, V.B. Human laminin binding protein as a cell receptor for the tick-borne encephalitis virus. Zent. Für Bakteriol. 1999, 289, 632–638. [Google Scholar] [CrossRef]
- Malygin, A.A.; Bondarenko, E.I.; Ivanisenko, V.A.; Protopopova, E.V.; Karpova, G.G.; Loktev, V.B. C-terminal fragment of human laminin-binding protein contains a receptor domain for Venezuelan equine encephalitis and tick-borne encephalitis viruses. Biochem 2009, 74, 1328–1336. [Google Scholar] [CrossRef]
- Zaitsev, B.N.; Benedetti, F.; Mikhaylov, A.G.; Korneev, D.V.; Sekatskii, S.K.; Karakouz, T.; Belavin, P.A.; Netesova, N.A.; Protopopova, E.V.; Konovalova, S.N.; et al. Force-induced globule-coil transition in laminin binding protein and its role for viral-cell membrane fusion. J. Mol. Recognit. 2014, 27, 727–738. [Google Scholar] [CrossRef]
- Bressanelli, S.; Stiasny, K.; Allison, S.L.; Stura, E.A.; Duquerroy, S.; Lescar, J.; Heinz, F.X.; Rey, F.A. Structure of a flavivirus envelope glycoprotein in its low-pH-induced membrane fusion conformation. EMBO J. 2004, 23, 728–738. [Google Scholar] [CrossRef] [Green Version]
- Barrass, S.V.; Pulkkinen, L.I.A.; Vapalahti, O.; Kuivanen, S.; Anastasina, M.; Happonen, L.; Butcher, S.J. Proteome-wide cross-linking mass spectrometry to identify specific virus capsid-host interactions between tick-borne encephalitis virus and neuroblastoma cells. BioRxiv 2021. [CrossRef]
- Stadler, K.; Allison, S.L.; Schalich, J.; Heinz, F.X. Proteolytic activation of tick-borne encephalitis virus by furin. J. Virol. 1997, 71, 8475–8481. [Google Scholar] [CrossRef] [Green Version]
- Rey, F.A.; Heinz, F.X.; Mandl, C.; Kunz, C.; Harrison, S.C. The envelope glycoprotein from tick-borne encephalitis virus at 2 Å resolution. Nature 1995, 375, 291–298. [Google Scholar] [CrossRef] [PubMed]
- Hobson-Peters, J.; Harrison, J.J.; Watterson, D.; Hazlewood, J.E.; Vet, L.J.; Newton, N.D.; Warrilow, D.; Colmant, A.M.G.; Taylor, C.; Huang, B.; et al. A recombinant platform for flavivirus vaccines and diagnostics using chimeras of a new insect-specific virus. Sci. Transl. Med. 2019, 11, 7888. [Google Scholar] [CrossRef] [PubMed]
- Pulkkinen, L.I.A.; Butcher, S.; Anastasina, M. Tick-borne encephalitis virus: A Structural View. Viruses 2018, 10, 350. [Google Scholar] [CrossRef] [PubMed] [Green Version]
- Newton, N.D.; Hardy, J.M.; Modhiran, N.; Hugo, L.E.; Amarilla, A.A.; Bibby, S.; Venugopal, H.; Harrison, J.J.; Traves, R.J.; Hall, R.A.; et al. The structure of an infectious immature flavivirus redefines viral architecture and maturation. Sci. Adv. 2021, 7, 4507–4521. [Google Scholar] [CrossRef]
- DiNunno, N.M.; Goetschius, D.J.; Narayanan, A.; Majowicz, S.A.; Moustafa, I.; Bator, C.M.; Hafenstein, S.L.; Jose, J. Identification of a pocket factor that is critical to Zika virus assembly. Nat. Commun. 2020, 11, 1–8. [Google Scholar] [CrossRef] [PubMed]
- Hardy, J.M.; Newton, N.D.; Modhiran, N.; Scott, C.A.P.; Venugopal, H.; Vet, L.J.; Young, P.R.; Hall, R.A.; Hobson-Peters, J.; Coulibaly, F.; et al. A unified route for flavivirus structures uncovers essential pocket factors conserved across pathogenic viruses. Nat. Commun. 2021, 12, 3266. [Google Scholar] [CrossRef]
- Khare, B.; Klose, T.; Fang, Q.; Rossmann, M.G.; Kuhn, R.J. Structure of Usutu virus SAAR-1776 displays fusion loop asymmetry. Proc. Natl. Acad. Sci. USA 2021, 9, 118. [Google Scholar] [CrossRef]
- Renner, M.; Dejnirattisai, W.; Carrique, L.; Martin, I.S.; Karia, D.; Ilca, S.L.; Ho, S.F.; Kotecha, A.; Keown, J.R.; Mongkolsapaya, J.; et al. Flavivirus maturation leads to the formation of an occupied lipid pocket in the surface glycoproteins. Nat. Commun. 2021, 12, 1–9. [Google Scholar] [CrossRef]
- Kuivanen, S.; Smura, T.; Rantanen, K.; Kämppi, L.; Kantonen, J.; Kero, M.; Jääskeläinen, A.; Jääskeläinen, A.J.; Sane, J.; Myllykangas, L.; et al. Fatal tick-borne encephalitis virus infections caused by Siberian and European subtypes, Finland, 2015. Emerg. Infect. Dis. 2018, 24, 946–948. [Google Scholar] [CrossRef] [Green Version]
- Bílý, T.; Palus, M.; Eyer, L.; Elsterová, J.; Vancová, M.; Růžek, D. Electron tomography analysis of tick-borne encephalitis virus infection in human neurons. Sci. Rep. 2015, 5, 10745. [Google Scholar] [CrossRef] [Green Version]
- Iacono-Connors, L.C.; Smith, J.F.; Ksiazek, T.G.; Kelley, C.L.; Schmaljohn, C.S. Characterization of Langat virus antigenic determinants defined by monoclonal antibodies to E, NS1 and preM and identification of a protective, non-neutralizing preM-specific monoclonal antibody. Virus Res. 1996, 43, 125–136. [Google Scholar] [CrossRef]
- Vasilenko, D.A.; Dueva, E.V.; Kozlovskaya, L.I.; Zefirov, N.A.; Grishin, Y.K.; Butov, G.M.; Palyulin, V.A.; Kuznetsova, T.S.; Karganova, G.G.; Zefirova, O.N.; et al. Tick-borne flavivirus reproduction inhibitors based on isoxazole core linked with adamantane. Bioorg. Chem. 2019, 87, 629–637. [Google Scholar] [CrossRef] [PubMed]
- De La Rosa-Trevín, J.M.; Quintana, A.; Del Cano, L.; Zaldívar, A.; Foche, I.; Gutiérrez, J.; Gómez-Blanco, J.; Burguet-Castell, J.; Cuenca-Alba, J.; Abrishami, V.; et al. Scipion: A software framework toward integration, reproducibility and validation in 3D electron microscopy. J. Struct. Biol. 2016, 195, 93–99. [Google Scholar] [CrossRef] [Green Version]
- Zivanov, J.; Nakane, T.; Forsberg, B.O.; Kimanius, D.; Hagen, W.J.; Lindahl, E.; Scheres, S.H. New tools for automated high-resolution cryo-EM structure determination in RELION-3. Elife 2018, 7, e42166. [Google Scholar] [CrossRef]
- De la Rosa-Trevín, J.M.; Otón, J.; Marabini, R.; Zaldívar, A.; Vargas, J.; Carazo, J.M.; Sorzano, C.O.S. Xmipp 3.0: An improved software suite for image processing in electron microscopy. J. Struct. Biol. 2013, 184, 321–328. [Google Scholar] [CrossRef] [PubMed]
- Sorzano, C.O.; De La Rosa Trevín, J.M.; Otón, J.; Vega, J.J.; Cuenca, J.; Zaldívar-Peraza, A.; Gómez-Blanco, J.; Vargas, J.; Quintana, A.; Marabini, R.; et al. Semiautomatic, high-throughput, high-resolution protocol for three-dimensional reconstruction of single particles in electron microscopy. Methods Mol. Biol. 2013, 950, 171–193. [Google Scholar] [PubMed]
- Rohou, A.; Grigorieff, N. CTFFIND4: Fast and accurate defocus estimation from electron micrographs. J. Struct. Biol. 2015, 192, 216–221. [Google Scholar] [CrossRef]
- Vilas, J.L.; Gómez-Blanco, J.; Conesa, P.; Melero, R.; Miguel de la Rosa-Trevín, J.; Otón, J.; Cuenca, J.; Marabini, R.; Carazo, J.M.; Vargas, J.; et al. MonoRes: Automatic and accurate estimation of local resolution for electron microscopy maps. Structure 2018, 26, 337–344.e4. [Google Scholar] [CrossRef] [Green Version]
- Ramírez-Aportela, E.; Vilas, J.L.; Glukhova, A.; Melero, R.; Conesa, P.; Martínez, M.; Maluenda, D.; Mota, J.; Jiménez, A.; Vargas, J.; et al. Automatic local resolution-based sharpening of cryo-EM maps. Bioinformatics 2020, 36, 765–772. [Google Scholar] [CrossRef]
- Emsley, P.; Lohkamp, B. Features and development of Coot. Acta Crystallogr. Sect. D Biol. Crystallogr. 2010, D66, 486–501. [Google Scholar] [CrossRef] [Green Version]
- Goddard, T.D.; Huang, C.C.; Meng, E.C.; Pettersen, E.F.; Couch, G.S.; Morris, J.H.; Ferrin, T.E. UCSF ChimeraX: Meeting modern challenges in visualization and analysis. Protein Sci. 2018, 27, 14–25. [Google Scholar] [CrossRef] [PubMed]
- Pettersen, E.F.; Goddard, T.D.; Huang, C.C.; Meng, E.C.; Couch, G.S.; Croll, T.I.; Morris, J.H.; Ferrin, T.E. UCSF ChimeraX: Structure visualization for researchers, educators, and developers. Protein Sci. 2021, 30, 70–82. [Google Scholar] [CrossRef] [PubMed]
- Liebschner, D.; Afonine, P.V.; Baker, M.L.; Bunkó, G.; Chen, V.B.; Croll, T.I.; Hintze, B.; Hung, L.-W.; Jain, S.; McCoy, A.G.; et al. Macromolecular structure determination using X-rays, neutrons and electrons: Recent developments in Phenix. Acta Cryst. 2019, 75, 861–877. [Google Scholar] [CrossRef] [PubMed] [Green Version]
- Croll, T.I. ISOLDE: A physically realistic environment for model building into low-resolution electron-density maps. Res. Pap. Acta Cryst. 2018, 74, 519–530. [Google Scholar] [CrossRef] [PubMed] [Green Version]
- Williams, C.J.; Headd, J.J.; Moriarty, N.W.; Prisant, M.G.; Videau, L.L.; Deis, L.N.; Verma, V.; Keedy, D.A.; Hintze, B.J.; Chen, V.B.; et al. MolProbity: More and better reference data for improved all-atom structure validation. Protein Sci. 2018, 27, 293–315. [Google Scholar] [CrossRef]
- Krissinel, E.; Henrick, K. Inference of macromolecular assemblies from crystalline state. J. Mol. Biol. 2007, 372, 774–797. [Google Scholar] [CrossRef]
- Pei, J.; Kim, B.-H.; Grishin, N. V PROMALS3D: A tool for multiple protein sequence and structure alignments. Nucleic Acids Res. 2008, 36, 2295–2300. [Google Scholar] [CrossRef]
- Prlí, A.; Bliven, S.; Rose, P.W.; Bluhm, W.F.; Bizon, C.; Godzik, A.; Bourne, P.E. Pre-calculated protein structure alignments at the RCSB PDB website. Bioinforma. Appl. Note 2010, 26, 2983–2985. [Google Scholar] [CrossRef]
- Crooks, G.E.; Hon, G.; Chandonia, J.M.; Brenner, S.E. WebLogo: A sequence logo generator. Genome Res. 2004, 14, 1188–1190. [Google Scholar] [CrossRef] [Green Version]
- Zhang, W.; Kaufmann, B.; Chipman, P.R.; Kuhn, R.J.; Rossmann, M.G. Membrane curvature in flaviviruses. J. Struct. Biol. 2013, 183, 86–94. [Google Scholar] [CrossRef] [Green Version]
- Kostyuchenko, V.A.; Lim, E.X.Y.; Zhang, S.; Fibriansah, G.; Ng, T.-S.; Ooi, J.S.G.; Shi, J.; Lok, S.-M. Structure of the thermally stable Zika virus. Nature 2016, 533, 425–428. [Google Scholar] [CrossRef] [PubMed] [Green Version]
- Lim, X.X.; Shu, B.; Zhang, S.; Tan, A.W.K.; Ng, T.S.; Lim, X.N.; Chew, V.S.Y.; Shi, J.; Screaton, G.R.; Lok, S.M.; et al. Human antibody C10 neutralizes by diminishing Zika but enhancing dengue virus dynamics. Cell 2021, 184, 6067–6080. [Google Scholar] [CrossRef] [PubMed]
- Sevvana, M.; Long, F.; Miller, A.S.; Klose, T.; Buda, G.; Sun, L.; Kuhn, R.J.; Rossmann, M.G. Refinement and analysis of the mature Zika virus cryo-EM structure at 3.1 Å resolution. Structure 2018, 26, 1169–1177.e3. [Google Scholar] [CrossRef] [PubMed] [Green Version]
- Sirohi, D.; Chen, Z.; Sun, L.; Klose, T.; Pierson, T.C.; Rossmann, M.G.; Kuhn, R.J. The 3.8 Å resolution cryo-EM structure of Zika virus. Science 2016, 352, 467–470. [Google Scholar] [CrossRef] [Green Version]
- Zhang, X.; Ge, P.; Yu, X.; Brannan, J.M.; Bi, G.; Zhang, Q.; Schein, S.; Zhou, Z.H. Cryo-EM structure of the mature dengue virus at 3.5-Å resolution. Nat. Struct. Mol. Biol. 2012, 20, 105–110. [Google Scholar] [CrossRef] [Green Version]
- Martín-Acebes, M.A.; Merino-Ramos, T.; Blázquez, A.-B.; Casas, J.; Escribano-Romero, E.; Sobrino, F.; Saiz, J.-C. The composition of West Nile virus lipid envelope unveils a role of sphingolipid metabolism in flavivirus biogenesis. J. Virol. 2014, 88, 12041–12054. [Google Scholar] [CrossRef] [Green Version]
- Dougherty, D.A. Cation-p interactions involving aromatic amino acids. J. Nutr. 2007, 137, 1504S–1508S. [Google Scholar] [CrossRef] [Green Version]
- Mandl, C.W.; Heinz, F.X.; Kunz, C. Sequence of the structural proteins of tick-borne encephalitis virus (Western subtype) and comparative analysis with other flaviviruses. Virology 1988, 166, 197–205. [Google Scholar] [CrossRef]
- Lattová, E.; Straková, P.; Pokorná-Formanová, P.; Grubhoffer, L.; Bell-Sakyi, L.; Zdráhal, Z.; Palus, M.; Ruzek, D. comprehensive N-glycosylation mapping of envelope glycoprotein from tick-borne encephalitis virus grown in human and tick cells. Sci. Rep. 2020, 10, 13204. [Google Scholar] [CrossRef]
- Flocco, M.M.; Mowbray, S.L. Planar stacking interactions of arginine and aromatic side-chains in proteins. J. Mol. Biol. 1994, 235, 709–717. [Google Scholar] [CrossRef]
- Duarte, F.; Paton, R.S.; Kumar, K.; Woo, S.M.; Siu, T.; Cortopassi, W.A. Cation-π interactions in protein-ligand binding: Theory and data-mining reveal different roles for lysine and arginine. Chem. Sci. 2018, 9, 2655–2665. [Google Scholar]
- Li, L.; Lok, S.M.; Yu, I.M.; Zhang, Y.; Kuhn, R.J.; Chen, J.; Rossmann, M.G. The flavivirus precursor membrane-envelope protein complex: Structure and maturation. Science 2008, 319, 1830–1834. [Google Scholar] [CrossRef] [PubMed] [Green Version]
- Yu, I.-M.; Zhang, W.; Holdaway, H.A.; Li, L.; Kostyuchenko, V.A.; Chipman, P.R.; Kuhn, R.J.; Rossmann, M.G.; Chen, J. Structure of the immature Dengue virus at low pH primes proteolytic maturation. Science 2008, 319, 1834–1837. [Google Scholar] [CrossRef]
- Kostyuchenko, V.A.; Zhang, Q.; Tan, J.L.; Ng, T.-S.; Lok, S.-M. Immature and mature Dengue serotype 1 virus structures provide insight into the maturation process. J. Virol. 2013, 87, 7700–7707. [Google Scholar] [CrossRef] [Green Version]
- Mcmahon, H.T.; Boucrot, E. Membrane curvature at a glance. J. Cell Sci. 2015, 128, 1065–1070. [Google Scholar] [CrossRef] [Green Version]
- Koller, D.; Lohner, K. The role of spontaneous lipid curvature in the interaction of interfacially active peptides with membranes. Biochim. Biophys. Acta Biomembr. 2014, 1838, 2250–2259. [Google Scholar] [CrossRef] [Green Version]
- Simons, K.; Ikonen, E. Functional rafts in cell membranes. Nature 1997, 387, 569–572. [Google Scholar] [CrossRef]
- Laurinmäki, P.A.; Huiskonen, J.T.; Bamford, D.H.; Butcher, S.J. Membrane proteins modulate the bilayer curvature in the bacterial virus Bam35. Structure 2005, 13, 1819–1828. [Google Scholar] [CrossRef] [Green Version]
- Medits, I.; Heinz, F.X.; Stiasny, K. An absolutely conserved tryptophan in the stem of the envelope protein E of flaviviruses is essential for the formation of stable particles. Viruses 2021, 13, 1727. [Google Scholar] [CrossRef]
- Yoshii, K.; Yanagihara, N.; Ishizuka, M.; Sakai, M.; Kariwa, H. N-linked glycan in tick-borne encephalitis virus envelope protein affects viral secretion in mammalian cells, but not in tick cells. J. Gen. Virol. 2013, 94, 2249–2258. [Google Scholar] [CrossRef]
- Jiang, W.R.; Lowe, A.; Higgs, S.; Reid, H.; Gould, E.A. Single amino acid codon changes detected in louping ill virus antibody-resistant mutants with reduced neurovirulence. J. Gen. Virol. 1993, 74, 931–935. [Google Scholar] [CrossRef] [PubMed]
- Mossenta, M.; Marchese, S.; Poggianella, M.; Slon Campos, J.L.L.; Burrone, O.R.R. Role of N-glycosylation on Zika virus E protein secretion, viral assembly and infectivity. Biochem. Biophys. Res. Commun. 2017, 492, 579–586. [Google Scholar] [CrossRef] [PubMed]
- Winkler, G.; Heinz, F.X.; Kunz, C. Studies on the glycosylation of flavivirus E proteins and the role of carbohydrate in antigenic structure. Virology 1987, 159, 237–243. [Google Scholar] [CrossRef]
- Hanna, S.L.; Pierson, T.C.; Sanchez, M.D.; Ahmed, A.A.; Murtadha, M.M.; Doms, R.W. N-linked glycosylation of West Nile virus envelope proteins influences particle assembly and infectivity. J. Virol. 2005, 79, 13262–13274. [Google Scholar] [CrossRef] [PubMed] [Green Version]
- Beasley, D.W.C.; Whiteman, M.C.; Zhang, S.; Huang, C.Y.-H.; Schneider, B.S.; Smith, D.R.; Gromowski, G.D.; Higgs, S.; Kinney, R.M.; Barrett, A.D.T. Envelope protein glycosylation status influences mouse neuroinvasion phenotype of genetic lineage 1 West Nile virus strains. J. Virol. 2005, 79, 8339–8347. [Google Scholar] [CrossRef] [PubMed] [Green Version]
- Annamalai, A.S.; Pattnaik, A.; Sahoo, B.R.; Muthukrishnan, E.; Natarajan, S.K.; Steffen, D.; Vu, H.L.X.; Delhon, G.; Osorio, F.A.; Petro, T.M.; et al. Zika virus encoding nonglycosylated envelope protein is attenuated and defective in neuroinvasion. J. Virol. 2017, 91, e01348-17. [Google Scholar] [CrossRef] [PubMed] [Green Version]

Publisher’s Note: MDPI stays neutral with regard to jurisdictional claims in published maps and institutional affiliations. |
© 2022 by the authors. Licensee MDPI, Basel, Switzerland. This article is an open access article distributed under the terms and conditions of the Creative Commons Attribution (CC BY) license (https://creativecommons.org/licenses/by/4.0/).
Share and Cite
Pulkkinen, L.I.A.; Barrass, S.V.; Domanska, A.; Överby, A.K.; Anastasina, M.; Butcher, S.J. Molecular Organisation of Tick-Borne Encephalitis Virus. Viruses 2022, 14, 792. https://doi.org/10.3390/v14040792
Pulkkinen LIA, Barrass SV, Domanska A, Överby AK, Anastasina M, Butcher SJ. Molecular Organisation of Tick-Borne Encephalitis Virus. Viruses. 2022; 14(4):792. https://doi.org/10.3390/v14040792
Chicago/Turabian StylePulkkinen, Lauri I. A., Sarah V. Barrass, Aušra Domanska, Anna K. Överby, Maria Anastasina, and Sarah J. Butcher. 2022. "Molecular Organisation of Tick-Borne Encephalitis Virus" Viruses 14, no. 4: 792. https://doi.org/10.3390/v14040792
APA StylePulkkinen, L. I. A., Barrass, S. V., Domanska, A., Överby, A. K., Anastasina, M., & Butcher, S. J. (2022). Molecular Organisation of Tick-Borne Encephalitis Virus. Viruses, 14(4), 792. https://doi.org/10.3390/v14040792