1. Introduction
Infectious laryngotracheitis (ILT) is a highly contagious acute respiratory disease of chickens caused by the avian alphaherpesvirus,
Gallid alpha herpesvirus 1 (GaHV-1), commonly known as infectious laryngotracheitis virus (ILTV). The disease has a worldwide distribution and is frequently observed in densely populated poultry production areas. Intervention strategies to control the disease rely on the implementation of biosecurity measures and vaccination with live-attenuated and/or recombinant viral vector vaccines expressing ILTV proteins [
1]. Among live-attenuated vaccines, there are two main types: the tissue culture origin (TCO) vaccine [
2] and chicken embryo origin (CEO) vaccines [
3]. Both, CEO and TCO vaccines can be administered through the ocular, oral or intranasal mucosal routes to elicit local and systemic immunity [
4,
5], are capable of protecting chickens against clinical signs and mortality, and suppress replication of the challenge virus [
6]. However, it has been demonstrated that live attenuated vaccine strains, most commonly the CEO vaccine strains, can revert to virulence if allowed to circulate in naïve chickens and give rise to outbreak viruses, such as the virulent strain 63140 [
1]. Although live attenuated vaccines are routinely used in the field, there is little definitive knowledge about the molecular and cellular immune response associated with ocular vaccine-induced protection.
Early seminal studies demonstrated a critical role for the cell-mediated arm of the immune system in ILTV protection. In particular, it appears that specific T cell subsets play a role in vaccine protection and resistance against the disease [
7,
8,
9]. More recent studies suggest that the local inflammatory processes contribute to the pathology of the disease, and eventually modulate the responses of the adaptive immune system to facilitate viral replication [
10]. Furthermore, ILTV infection appears to down-regulate type I interferon transcription and delays the early transcription of inflammatory genes to favor initial virus replication in the trachea [
11,
12].
Unlike the mammalian immune system, the avian immune system lacks a discrete lymphatic network. Lymph nodes in mammals are the principal sites for initial antigen presentation in mounting naive responses. In contrast, chickens have a distributed immune network featuring clusters of mucosal-associated lymphoid tissues (MALTs) that appear to fill the role of organizing naïve responses [
13]. The head-associated lymphoid tissue (HALT) is comprised of the nasal-associated lymphoid tissue (NALT), the eye-associated lymphoid tissues organized in the conjunctiva-associated lymphoid tissue (CALT) and the Harderian gland (HG). Despite the absence of a direct anatomic connection to the respiratory system, the HG, CALT, and NALT serve as major contributors of immunity for the upper respiratory airways. For example, in the NALT, cells capable of taking up Newcastle disease virus (NDV)-coated beads following intranasal administration were identified as potential antigen presenting cells (APCs) [
14]. In the HG, the number of IgA- and IgY-producing cells increased after the ocular inoculation of an adenovirus 5 vector expressing the avian influenza H5 protein [
15], and T effector cells (CD3
+, CD44
+) were detected in the HG and the CALT after infectious bronchitis virus (IBV) ocular inoculation [
16].
Currently, little is known about the components of the cell-mediated immune responses associated with resistance against ILT that develops within the eye-associated lymphoid tissues. Recent findings indicate that the mucosal route of viral entry—ocular, oral, or nasal—can greatly influence the levels of ILTV lytic replication and lymphocyte infiltration in the trachea and conjunctiva [
17]. Therefore, assessing the changes in immune cell populations within the eye-associated lymphoid tissues (CALT and HG) after ILTV exposure may help identify important features occurring in mucosal tissues that are involved in ILTV pathogenesis and host immune responses. To this end, the objective of the present study was to assess differences in immune cell dynamics by monitoring the number of T and B lymphocytes, the number of MHC class I and MHC class II antigen surface expressing cells, and transcript profile of interleukin
(IL)-12p40, interferon
(IFN)-γ, and
Granzyme A genes in CALT and HG after ocular inoculation with the CEO vaccine strain or the virulent strain 63140. Collectively, this study highlights the important role of the eye-associated lymphoid tissue and the immunity elicited against ILTV infection. It provides evidence that the CALT and HG play different roles in the development of ILTV immune responses which were greatly influenced by the viral strain virulence.
2. Materials and Methods
2.1. Ethical Statement
All animal experiments conducted in this study were performed under the Animal Use Proposal A2018 06-009-Y1-A0 approved by the Animal Care and Use Committee (IACUC) in accordance with regulations of the Office of the Vice President for Research at the University of Georgia.
2.2. ILTV Strains and Virus Titration
The 63140 virulent strain [
18] and the CEO vaccine strain (Trachivax
® MERCK, Animal Health, Madison, NJ, USA) were utilized in this study. The virulent strain 63140 was propagated in chicken kidney cells obtained from 3 to 4-week-old specific pathogen-free (SPF) chickens [
19]. The CEO vaccine strain was reconstituted as recommended by the manufacturers. Both viral strains were titrated in chicken kidney cells prepared from 3- to 4-wk-old SPF chickens. Kidney cells were disassociated in a 0.25% trypsin solution (Corning, Cellgro) at 37 °C. After trypsinization, cell pellets were resuspended in incomplete media (1x Ham’s media (Corning, Cellgro), 1× M 199 (Gibco), 2% tryptose phosphate broth, 0.62% 1M Hepes buffer, 1.2% Sodium bicarbonate (Sigma)). Chicken kidney (CK) cells density was adjusted to 8 × 10
5 cells/mL in incomplete media with the addition of 10% fetal bovine serum (Atlanta Biologicals, Lawrenceville, GA, USA) and 2% antibiotic-antimycotic (Gibco). Fifty microliters of CK cells was seeded in 96-well plates. Twenty-four hours post-seeding, the complete medium was replaced with incomplete media, and plates were used 48 h after seeding. Five replicates of virus dilutions ranging from 10
−1 to 10
−9 were inoculated per well with 50 microliters of each virus dilution. Plates were incubated at 39 °C and 5% CO
2 for 5 days. The 50% tissue culture infective dose (TCID
50) was determined by the presence of virus-induced cytopathic effect and estimated by the Reed and Muench method [
20].
2.3. Experimental Design and Time Line
A total of 215 specific pathogen-free (SPF) fertile White Leghorn eggs obtained from Charles River (Norwich, CT, USA) were incubated and hatched at the Poultry Diagnostic Research Center (PDRC, Athens, GA, USA), University of Georgia hatchery facilities. One-day-old chicks were housed in isolation units, with filtered air and negative pressure, and provided with feed and water ad libitum. At five weeks-of-age, chickens were arbitrarily divided in three groups. One group of chickens was inoculated with virulent strain 63140 (
n = 75); a second group was inoculated with the CEO vaccine strain (
n = 75). Both virus strains were administered via the ocular route. Viruses were diluted in incomplete media and a total dose of 10
3.5 TCID
50 was administered per chicken in a 60 μL volume, 30 μL per eye. The third group of chickens (
n = 65) was mock inoculated with cell culture media in a similar fashion and used as negative control. At 1, 3, 5, 7, and 9 days post-inoculation (dpi), conjunctiva-associated lymphoid tissue (CALT) of the lower eyelids, Harderian gland (HG) from both eyes, and upper trachea sections were collected from five chickens from each of the three treatment groups. CALT and HG samples were used for flow cytometry analysis, while the upper trachea sections were used to determine viral genome load by real-time PCR. Additionally, CALT and HG samples were collected from 4 to 6 chickens per group at 1, 3, 5, 7, and 9 dpi and utilized to assess viral genome load and host cytokines genes transcription levels. At 1, 3, 5, and 7 dpi conjunctiva samples were collected from five chickens from each group for histopathology examination. Clinical signs were obtained from days 2 to 7 post-inoculation (pi) from 6 to 7 randomly selected chickens per group. Signs of respiratory distress, lethargy and conjunctivitis were scored as previously described [
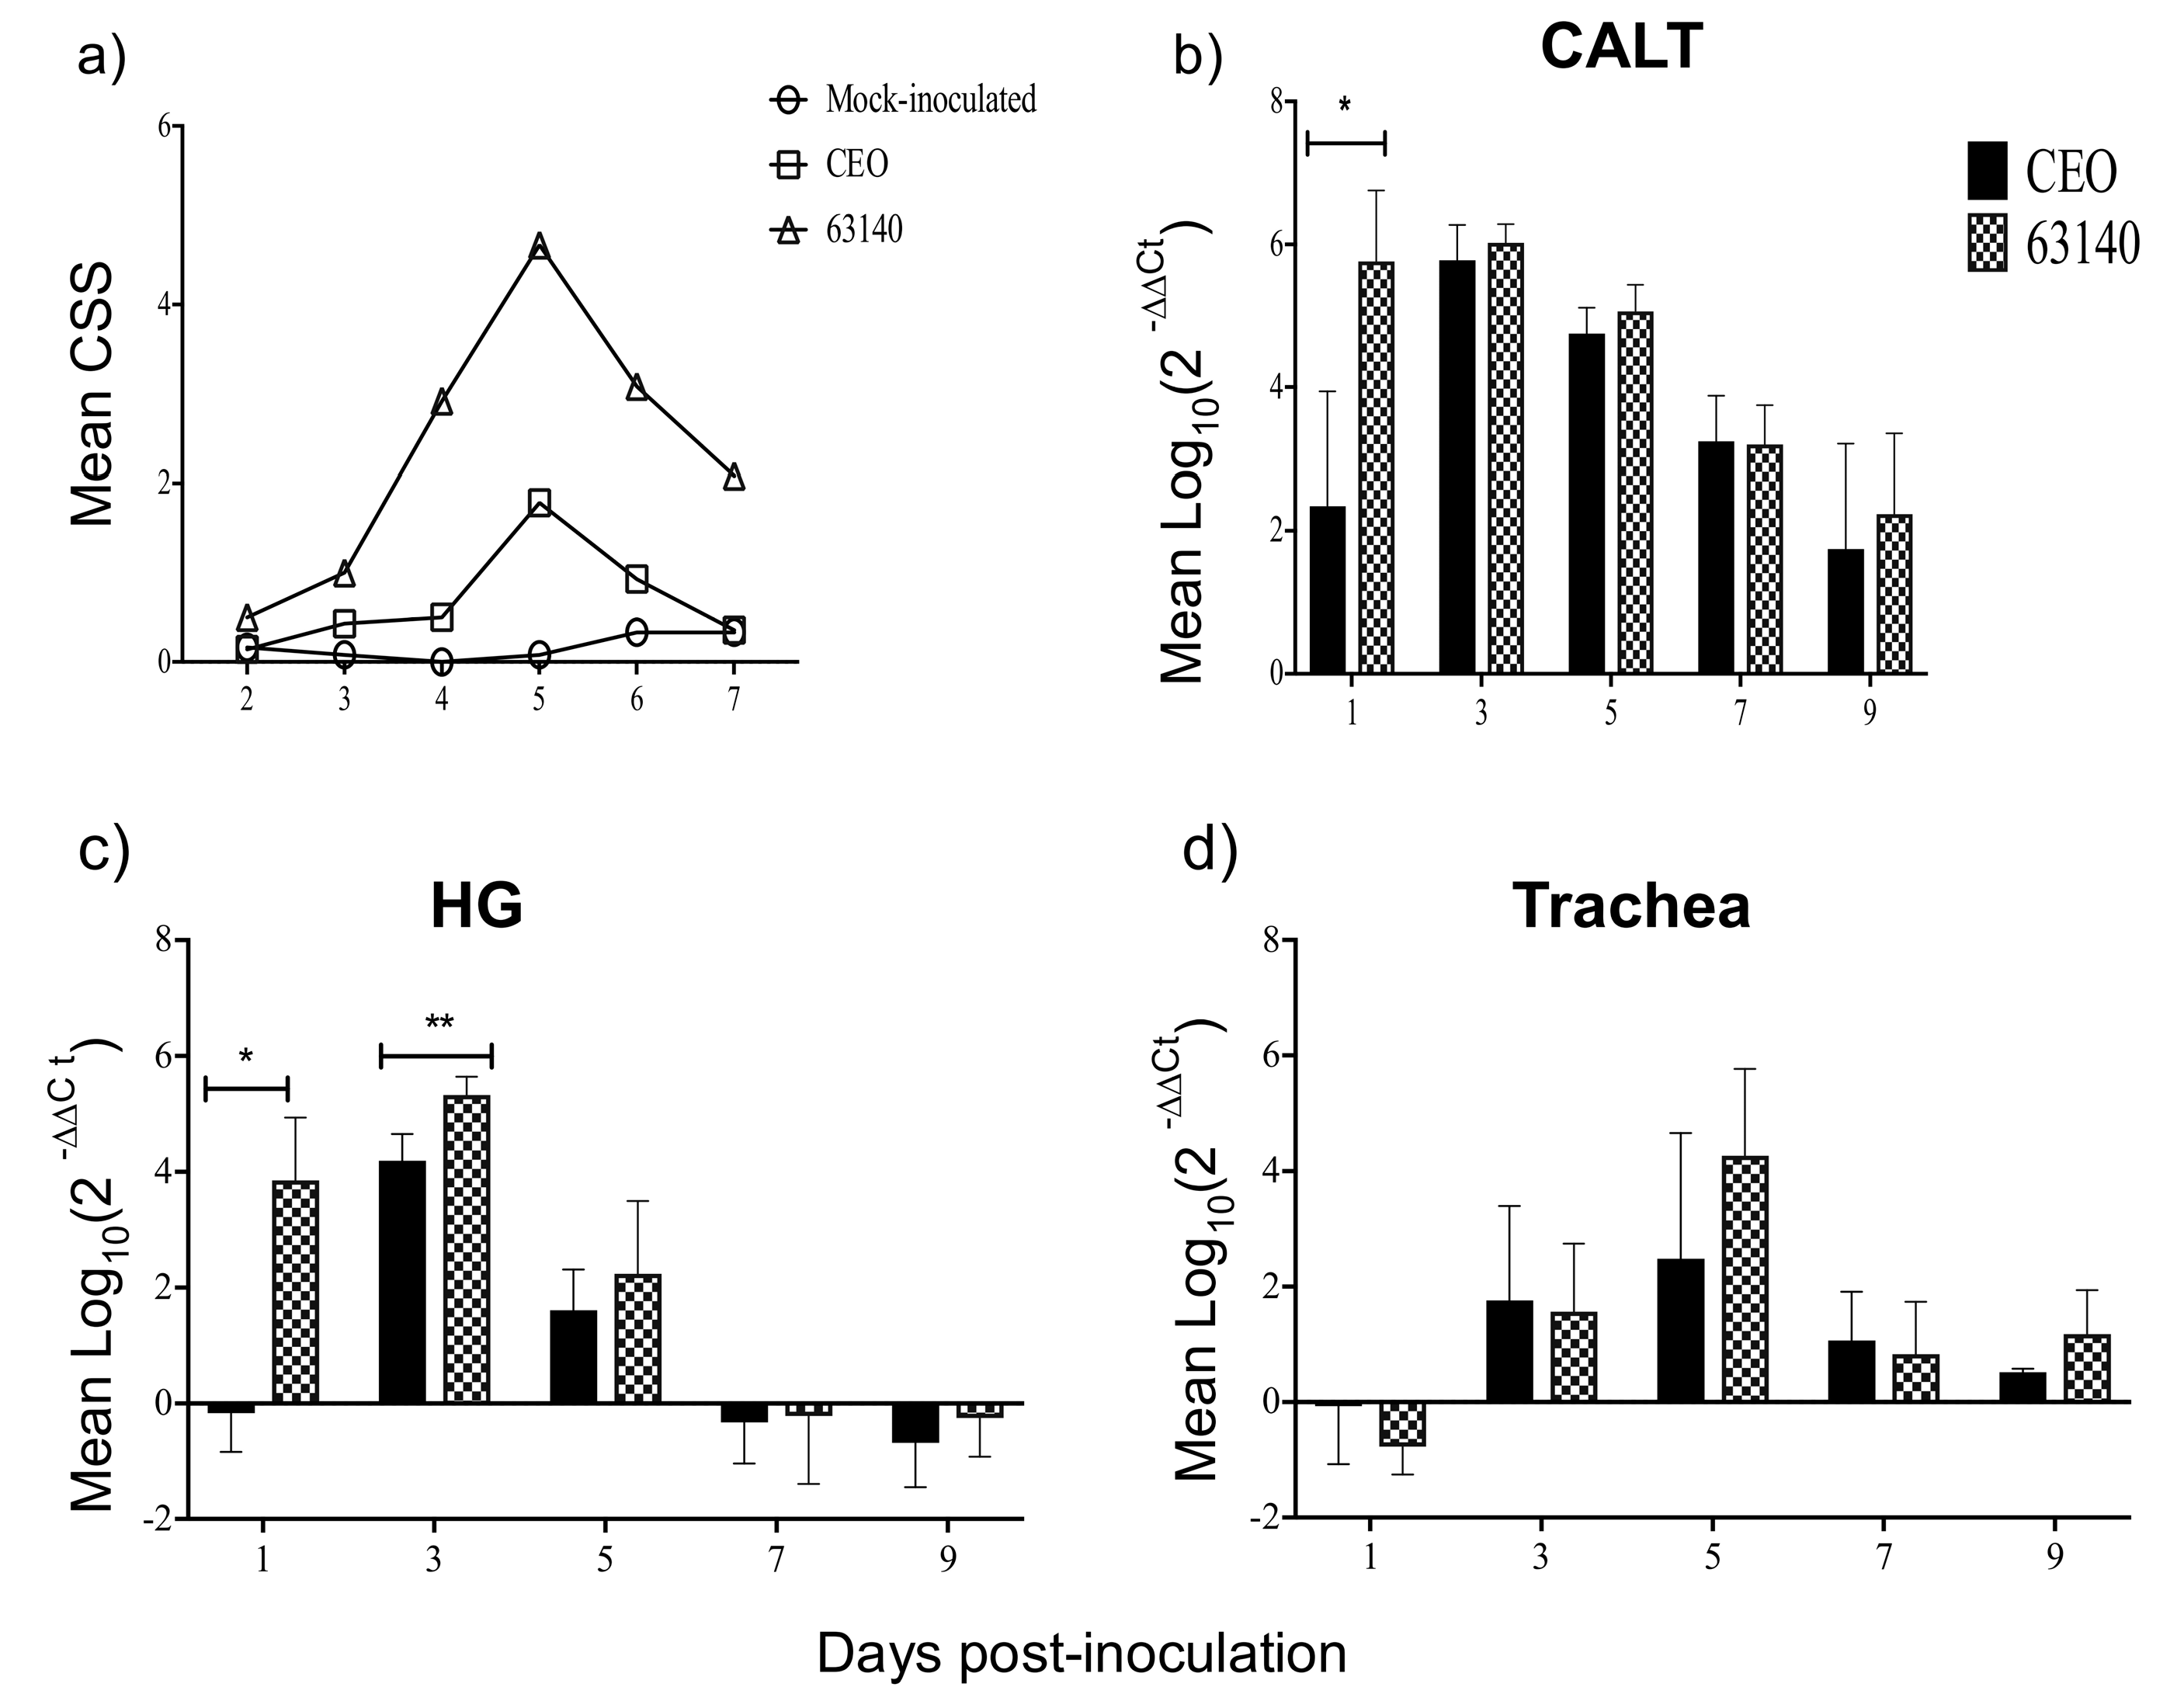
6]. Briefly, signs of dyspnea, conjunctivitis and lethargy were scored on a scale of 0 to 3—normal (0), mild (0.5 to 1), moderate (1.5 to 2), and severe (2.5 to 3)—for each of the 3 clinical categories (Total maximum score = 9). Each chicken received a total clinical sign score, which was the sum of individual clinical signs categories. A total mean clinical signs score was calculated per group at each time point post-infection.
2.4. Samples Collection
Chickens were euthanized by CO2 gas inhalation for one minute. The CALT tissues from both lower eyelids and HG from each eye were aseptically removed and immediately placed in 15 mL conical tubes containing 8 mL of ice-cold transport medium (calcium and magnesium-free PBS with 0.5% bovine serum albumin) (Thermo Fisher Scientific, Waltham, MA, USA). Samples were kept on ice until the tissues were processed for flow cytometry analysis. The upper trachea was collected and immediately placed in 1 mL of sterile phosphate-buffered saline solution (HyClone, Logan, UT, USA) with 2% antibiotic-antimycotic 100X (Gibco, Grand Island, NY, USA), and 2% fetal bovine serum (FBS, Atlanta®, Biological, Flowery Branch, GA, USA) and stored at −80 °C until processing for DNA extraction. Additional CALT and HG samples were collected and placed in Lysing matrix D tubes (MP Biomedical, Santa Ana, CA, USA) containing 1 mL of TRIzol® (Thermo Fisher, Waltham, MA, USA). These were incubated for 30 min on ice and homogenized using a FastPrep-24™5G (MP Biomedical, Santa Ana, CA, USA) and immediately stored at −80 °C until processing for RNA and DNA extraction.
2.5. Nucleic Acid Extractions and cDNA Synthesis
Extraction of RNA and DNA were performed from the CALT and HG TRIzol
® homogenates. Briefly, immediately after the homogenization of CALT and HG samples in 1 mL of TRIzol (Thermo Fisher, Waltham, MA, USA), 200 μL of chloroform was added and the samples were centrifuged at 4 °C for 15 min at 12,000×
g. Total RNA was further purified from the upper aqueous phase using the RNeasy kit (QIAGEN, Valencia, CA, USA) as previously described [
12]. To eliminate DNA contamination, the eluted RNA was treated with TURBO DNA-free™ (2 to 4 units/per reaction) (Ambion, Carlsbad, CA, USA) for 30 min at 37 °C. The DNase was inactivated with 5 μL of DNase inactivation buffer for 2 min at 23 °C. After DNA digestion, a total of 80 units of RNase inhibitor (RNase OUT™, Invitrogen, Carlsbad, CA, USA) was added per sample. To assess the purity and concentration of RNA per sample, optical density ratios (260/280 and 260/230) were obtained using the NanoDrop™ 2000c (Thermo Fisher Scientifics, Waltham, MA, USA). Previous to cDNA synthesis, a real time PCR reaction that amplifies the chicken β-actin gene was performed to ensure the absence of residual DNA in the eluted RNA using primers previously described [
12]. The β-actin gene amplification reaction was performed in a 20 μL volume—10 μL of SYBR
® Select Master Mix (2X) (Life Technologies, Carlsbad, CA, USA), 1 μL of 5 μM of each primer, 5 μL of template and 3 μL of nuclease free water. The cycling profile was 50 °C for 2 min; 95 °C for 2 min; 40 cycles of 95 °C for 15 s; and 60 °C for 1 min.
Complementary DNA (cDNA) synthesis was performed in 20-μL reactions including 250 to 500 nanograms of RNA, 200 units of reverse transcriptase (SuperScriptIII™ RT Invitrogen Life Technologies, Carlsbad, CA, USA) and 200 nM oligo (dT) 15 primers (Sigma-Aldrich, St. Louis, MO, USA). The reverse transcription was performed following the First-Strand Synthesis System protocol as recommended by manufacturer’s (Invitrogen Life Technologies, Carlsbad, CA, USA). The cDNA was stored at −20 °C until further real time PCR analysis.
Total DNA from CALT and HG was extracted from the organic phenol phase of the TRIzol
® homogenate following the manufacturer’s recommendations. Briefly, 300 μL of absolute ethanol was added to the phenol phase, followed by centrifugation at 2000×
g for 5 min at 4 °C. The pellet was washed twice with 1 M sodium citrate in 10% ethanol and once with 75% ethanol and centrifuged at 2000×
g for 5 min at 4 °C and re-suspended in 200 μL of 8 mM sodium hydroxide. DNA purification was performed using the MagaZorb
® DNA extraction mini-prep 96 well kit following the manufacturer´s recommendations (Promega, Madison, WI, USA) as previously described [
21]. Eluted DNA was stored at −80 °C until further real time PCR analysis.
2.6. Histopathological Examination of Conjunctiva Tissues
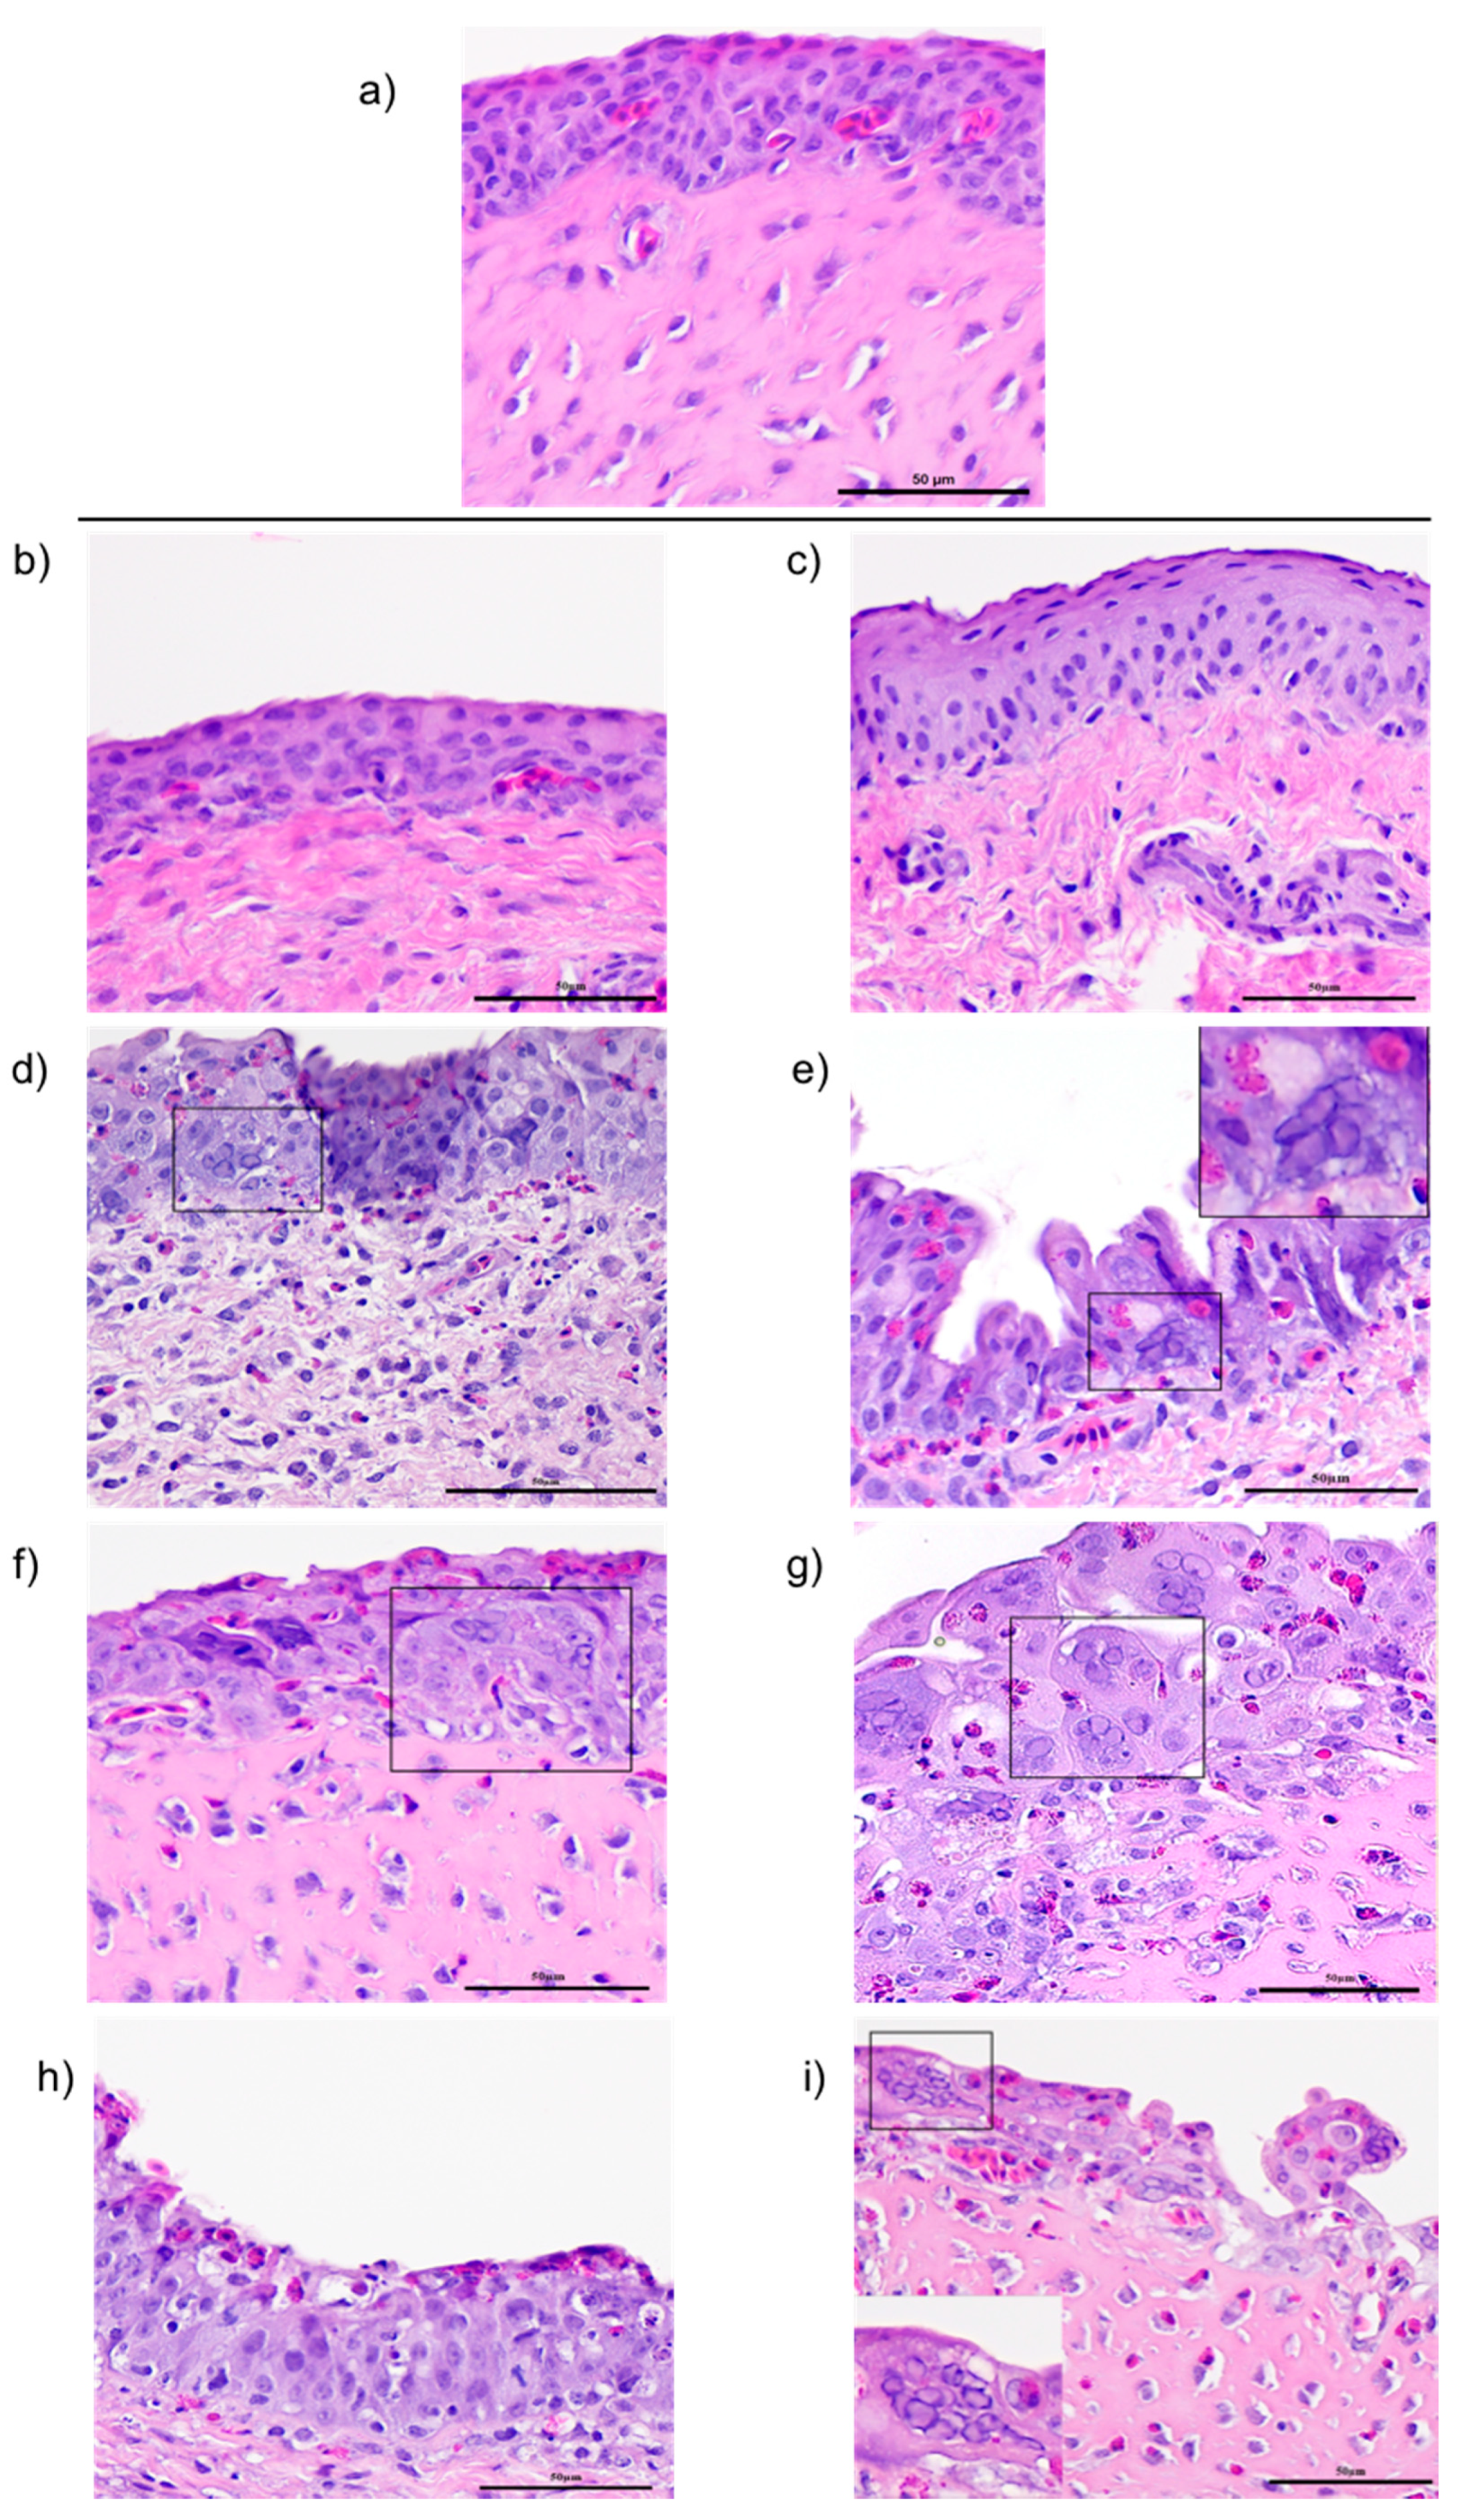
At 1, 3, 5, and 7 days post-ocular inoculation, conjunctiva tissues were collected and placed in 10% buffered natural formalin and fixed for 24 h at room temperature. Routine tissue processing, embedding and sectioning was performed. Four-micrometer sections stained with haematoxylin and eosin (H&E) were subjected to microscopic examination for the signs of ILTV lytic replication, indicated by the presence of syncytial cell formation and eosinophilic intranuclear inclusion bodies.
2.7. Single-Cell Suspension Preparation
Single-cell suspensions from CALT and HG tissues were obtained by mechanical disruption using a 60-µm wire screen mesh (Sigma-Aldrich, St. Luis, MO, USA). CALT cell suspensions were passed once through a 70-µm cell strainer (Thermo Fisher Scientific, Waltham, MA, USA), washed once with transport medium, and centrifuged at 250× g for 7 min at 4 °C. The HG cell suspension was passed once through a 70-µm and twice through a 40-µm cell strainer and washed twice as described above. CALT cells were re-suspended in 1 mL and HG in 2 mL of transport medium, cells were enumerated, and viability was determined using trypan blue exclusion on a Cellometer Mini (Nexcelcom Bioscience, Lawrence, MA, USA). CALT and HG cells suspensions were adjusted to 1 × 10⁶/100 µL and 4 × 10⁶/100 µL, respectively.
2.8. Antibody Dilutions and Staining Procedures
Lymphocyte populations from each tissue were evaluated using four monoclonal antibody staining combinations: (1) Allophycocyanin (APC) conjugated to mouse anti-chicken CD45, a pan leukocyte marker alone (Clone LT40, Southern Biotech, Birmingham, AL); (2) Phyocoerythrin (PE) conjugated to mouse anti-chicken CD4 (Clone CT-4) paired with fluorescein isothiocyanate (FITC)-conjugated to mouse anti-chicken CD8α (Clone CT8) and APC conjugated mouse anti-chicken CD45; (3) PE-conjugated mouse anti-chicken IgM (Clone M-1) paired with FITC-conjugated mouse anti-chicken IgA (Clone A-1, Southern Biotech, Birmingham, AL, USA) and APC conjugated mouse anti-chicken CD45; (4) PE-conjugated mouse anti-chicken MHCII (Clone 2G11) paired with FITC-conjugated mouse anti-chicken MHCI (Clone F21-2, Southern Biotech, Birmingham, AL, USA) and APC conjugated mouse anti-chicken CD45. Working dilutions of antibodies were performed in FACS buffer containing calcium and magnesium-free PBS, 0.5% bovine serum albumin, with 0.1% sodium azide. Antibody concentrations were optimized to the minimum saturating and cross-talk (between colors) concentrations in prior trials. The APC-CD45 was used at a final concentration of 0.05 μg per reaction, PE-CD4 at 0.25 μg, FITC-CD8 α at 0.5 μg, PE-IgM at 0.5 μg, FITC-IgA 1 μg, PE-MHCII 0.125 μg, and FITC-MHCI at 0.5 μg. CALT and HG cell suspensions were distributed in round-bottom 96-well plates, 100 μL per well and incubated with 100 μL of antibody combinations and incubated for 30 min at 4 °C in a rotator plate shaker. After incubation, plates were centrifuged at 4 °C for 7 min at 250× g, cell pellets were washed once with 200 μL of FACS buffer and centrifuged at 4 °C for 5 min at 250× g. Cells were then re-suspended in 100 μL of FACS buffer and 100 μL of Intracellular (IC) fixation buffer (Thermo Fisher Scientific, Waltham, MA, USA) and stored overnight at 4 °C. Prior to flow cytometry analysis fixed cell suspensions were diluted with 200 µL of calcium and magnesium-free PBS.
2.9. Flow Cytometry Analysis
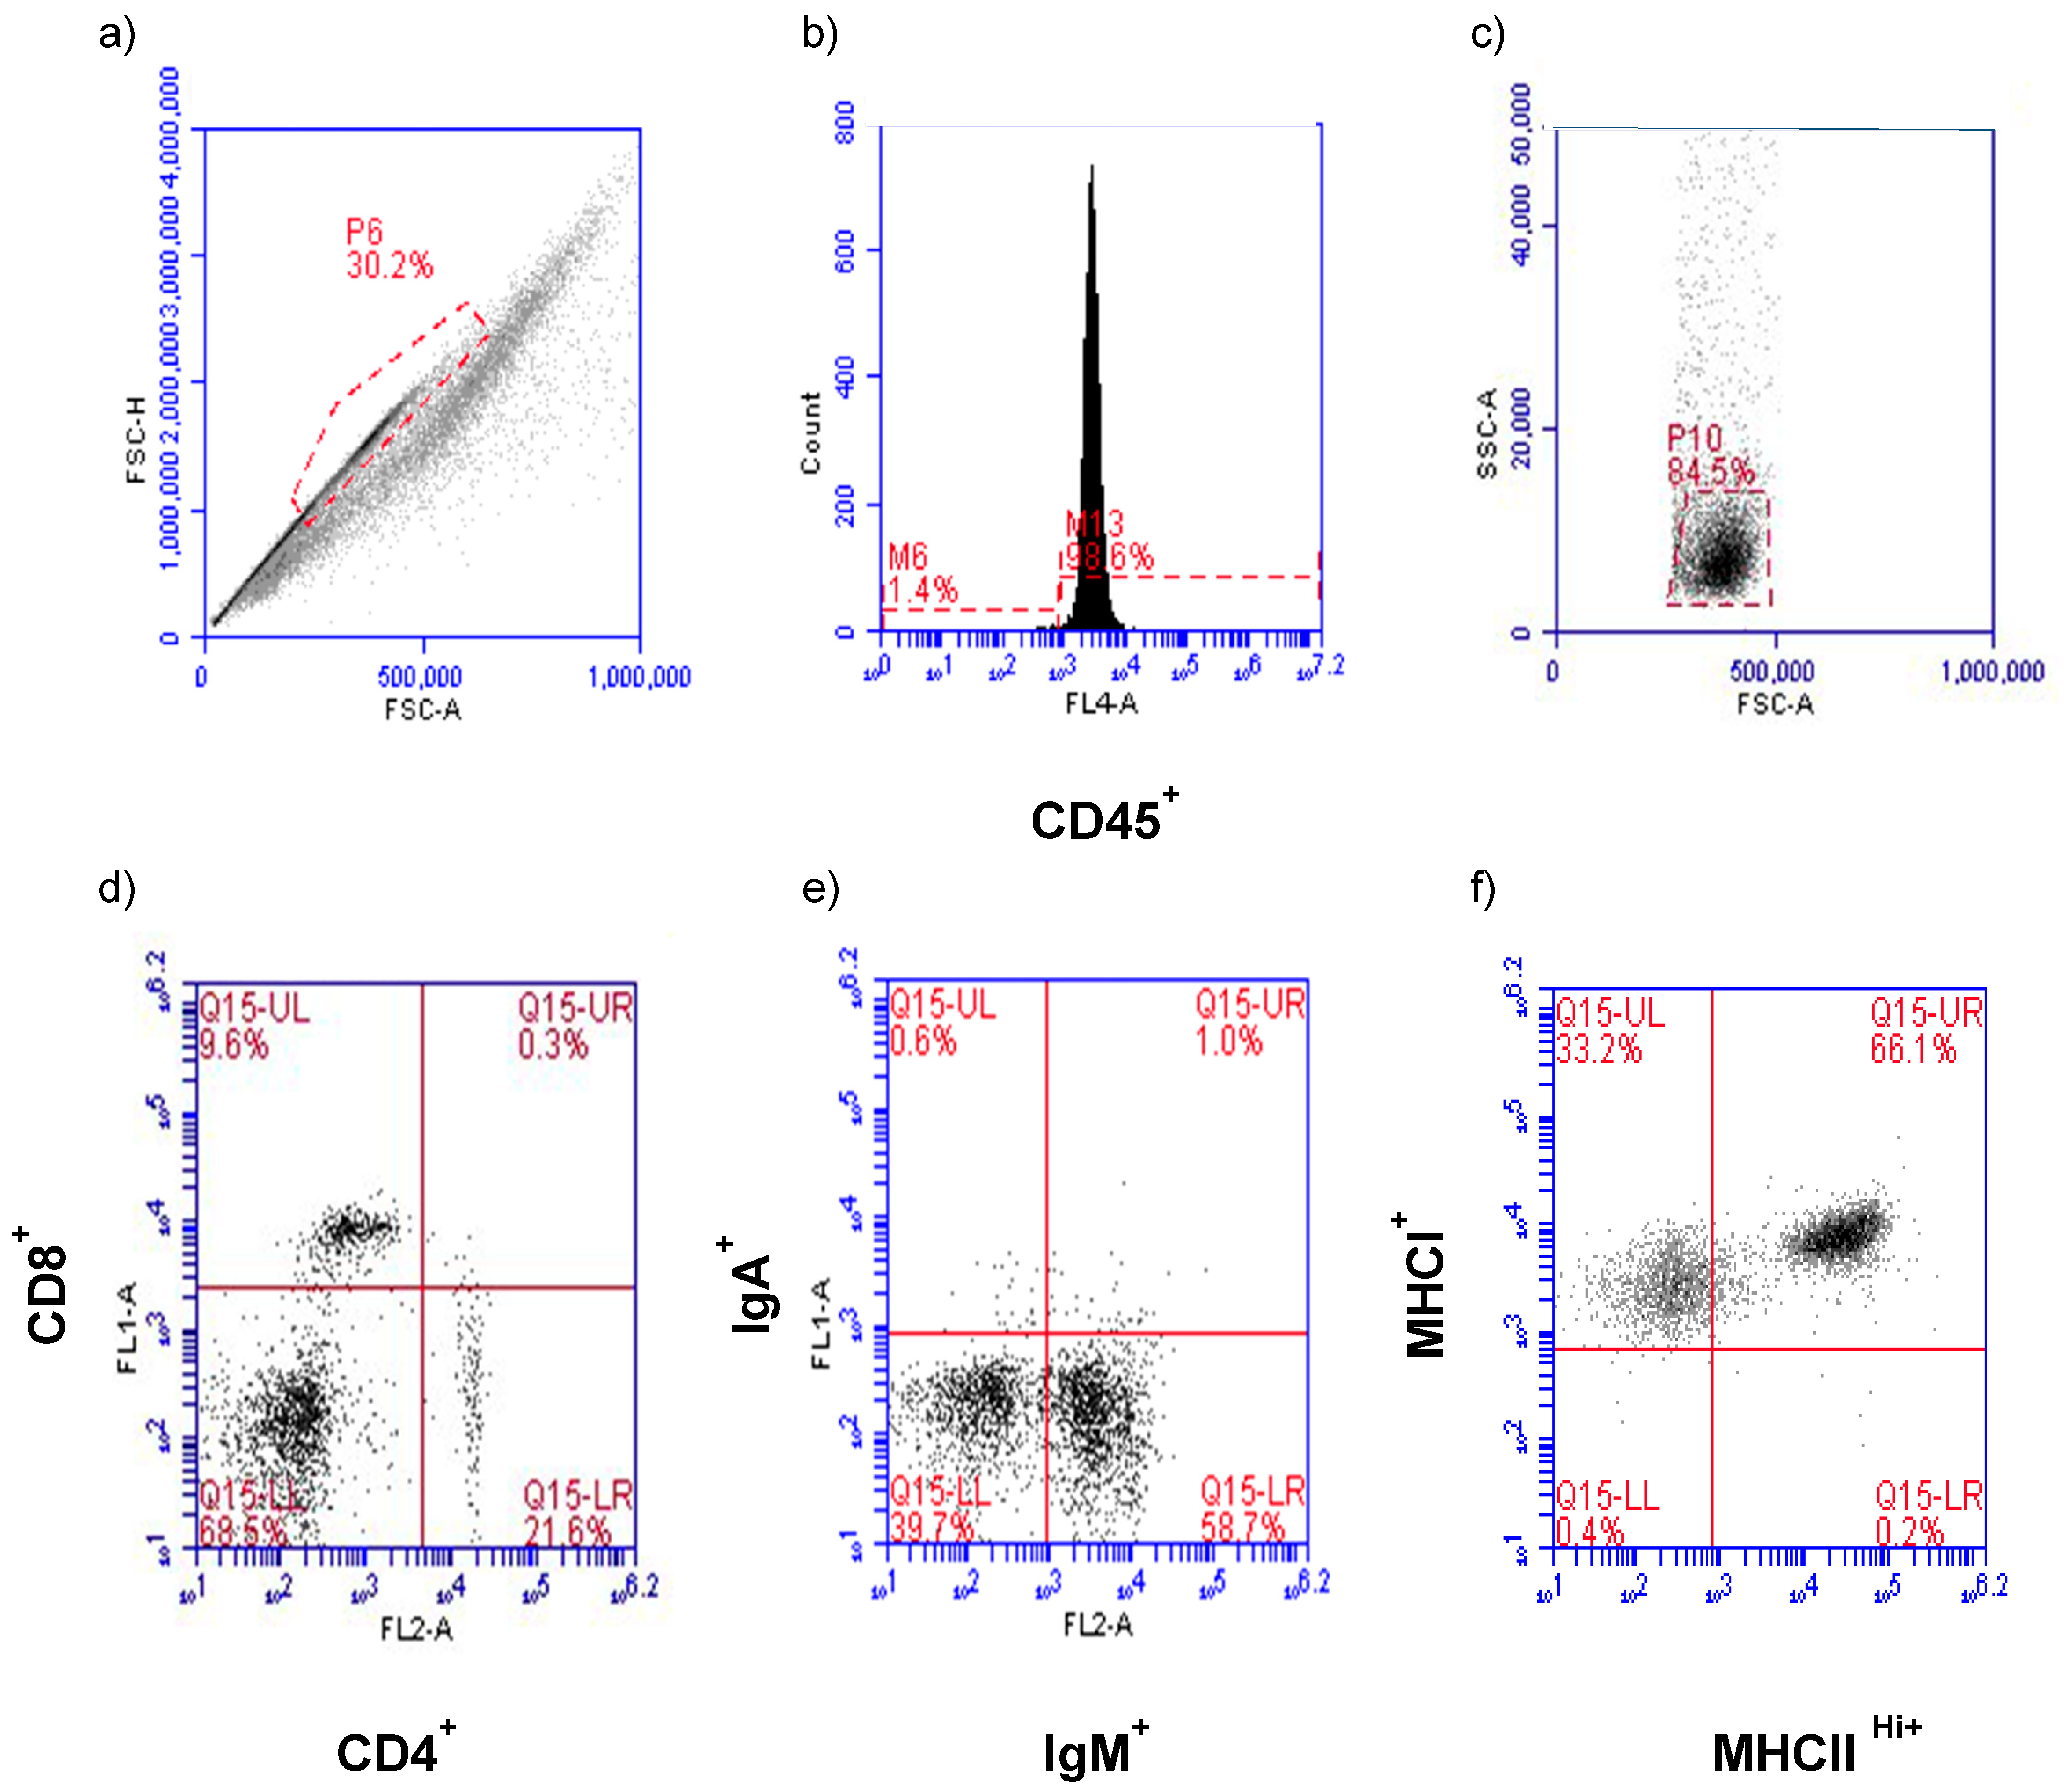
Flow cytometry analysis and data collection were performed on a BD Accuri C6 Flow Cytometer and software (ver 1.0.264.21) (San Jose, CA, USA). Gating for leukocyte populations in HG and CALT and the establishment of control windows for single staining and double staining were determined beforehand. Briefly, primary gating was based on size consistency and single cells using forward scatter height versus forward scatter area (FSC-H vs. FSC-A) (
Figure 1a). Cells were then subjected to CD45 assessment to establish the leukocyte population in this primary gate (
Figure 1b). Forward and right-angle scatter (FSC-A vs. SSC-A) relative to CD45
+ expression was used to identify the lymphocyte population and exclude macrophages from the analysis (
Figure 1c). The CD45
+ lymphocytes were then evaluated for CD4
+, CD8α
+ (
Figure 1d), IgM
+, IgA
+ (
Figure 1e), and MHC class I
+, MHC class II
Hi+ (
Figure 1f) antigen expression. Using the lymphocyte electronic gate, 4000 and 3000 events were collected per CALT and HG, respectively.
2.10. Quantification of Viral Genome Load
The detection of ILTV genomes in samples was determined by a duplex probe-based-Real-time PCR [
22]. The duplex assay amplifies the UL44 (gC) viral gene and a fragment of the chicken α2-collagen gene. The relative amount of viral DNA per samples was expressed as log
10 2
−ΔΔCt value.
2.11. Transcription of Host Cytokine Genes
To assess how the cell-mediated responses to ILTV in the CALT and HG was formed, transcription of the chicken
IL-12p40,
IFN-γ and
Granzyme A genes were quantified. Briefly, 5 µL of 1:10 dilutions of previously produced cDNA were assembled in 384-well plates (Roche Diagnostics, Indianapolis, IN, USA) in 20 μL reactions containing LightCycler 480 SYBR Green I Master mix (Roche Diagnostics GmbH) 0.25 µM of each gene-specific primer set, the chicken β-actin primer set. Real-time PCRs were performed in the LightCycler 480II instrument (Roche Diagnostics, Indianapolis, IN, USA). Primers, amplification reaction parameters and efficiencies for each reaction are shown in
Table 1. The
IL-12p40,
IFN-γ and
Granzyme A genes relative transcription changes were determined as compared to the mock-inoculated group of chickens, using the chicken β-actin transcript as an endogenous control, and presented as median fold change (log
10 2
−ΔΔCt) and 95% confidence interval [
12].
2.12. Statistical Analysis
The non-parametric Mann–Withney U test (p ≤ 0.05) was utilized to evaluate differences between CEO and 63140 genomes load in conjunctiva, Harderian gland and trachea at each time point post-inoculation (pi). The mean and median of each set of assessments did not show differences, thus the results are presented as mean with standard deviation (SD). The one-way analysis of variance Kruskal–Wallis test and the Dunn´s multiple comparison post-test (p ≤ 0.05) were utilized to individually compare CD4+, CD8α+, IgM+, IgA+ and MHCI+/MHCIIHi+ percentage changes elicited after 63140, CEO, and mock inoculation in the CALT and HG. The mean and median for the cell surface markers did not show differences, thus the results are presented as the mean with standard deviation (SD). The non-parametric Mann–Withney U test (p ≤ 0.05) was utilized to assess differences in median fold changes for IL-12p40, IFN-γ, and Granzyme A genes transcription elicited by ocular inoculation with CEO and 63140 ILTV strains. Median fold change and 95% confidence intervals at each time point post-inoculation (pi) are presented. Pearson correlation coefficient (r) were calculated to determine the strength of the association between: MHCI+/MHCIIHi+ and IgM+ cell percentages, IL-12p40 and IFN-γ genes transcription, and Granzyme A gene expression and the number of viral genomes. Statistical analysis of the data was conducted using the Prism 7 (GraphPad, Software Inc. San Diego, CA, USA).
4. Discussion and Conclusions
Although it is well documented that resistance against ILT is mediated primarily by cell-mediated immunity, little is known about the dynamics of immune cells in the mucosal tissues, or the factors that contribute to the development of host disease resistance. To begin to decipher the key immune components that function in mucosal tissues that contribute to disease resistance, we evaluated changes in (i) four subsets of lymphocyte populations (CD4, CD8 IgM+. And IgA+), (ii) transcriptional levels of interleukin (IL)-12p40, interferon gamma (IFN)-γ and Granzyme A genes in the eye-associated lymphoid tissue (CALT and HG) following ocular inoculation with the CEO vaccine or the virulent 63140 strain, and their correlation with viral genome load in the tissues.
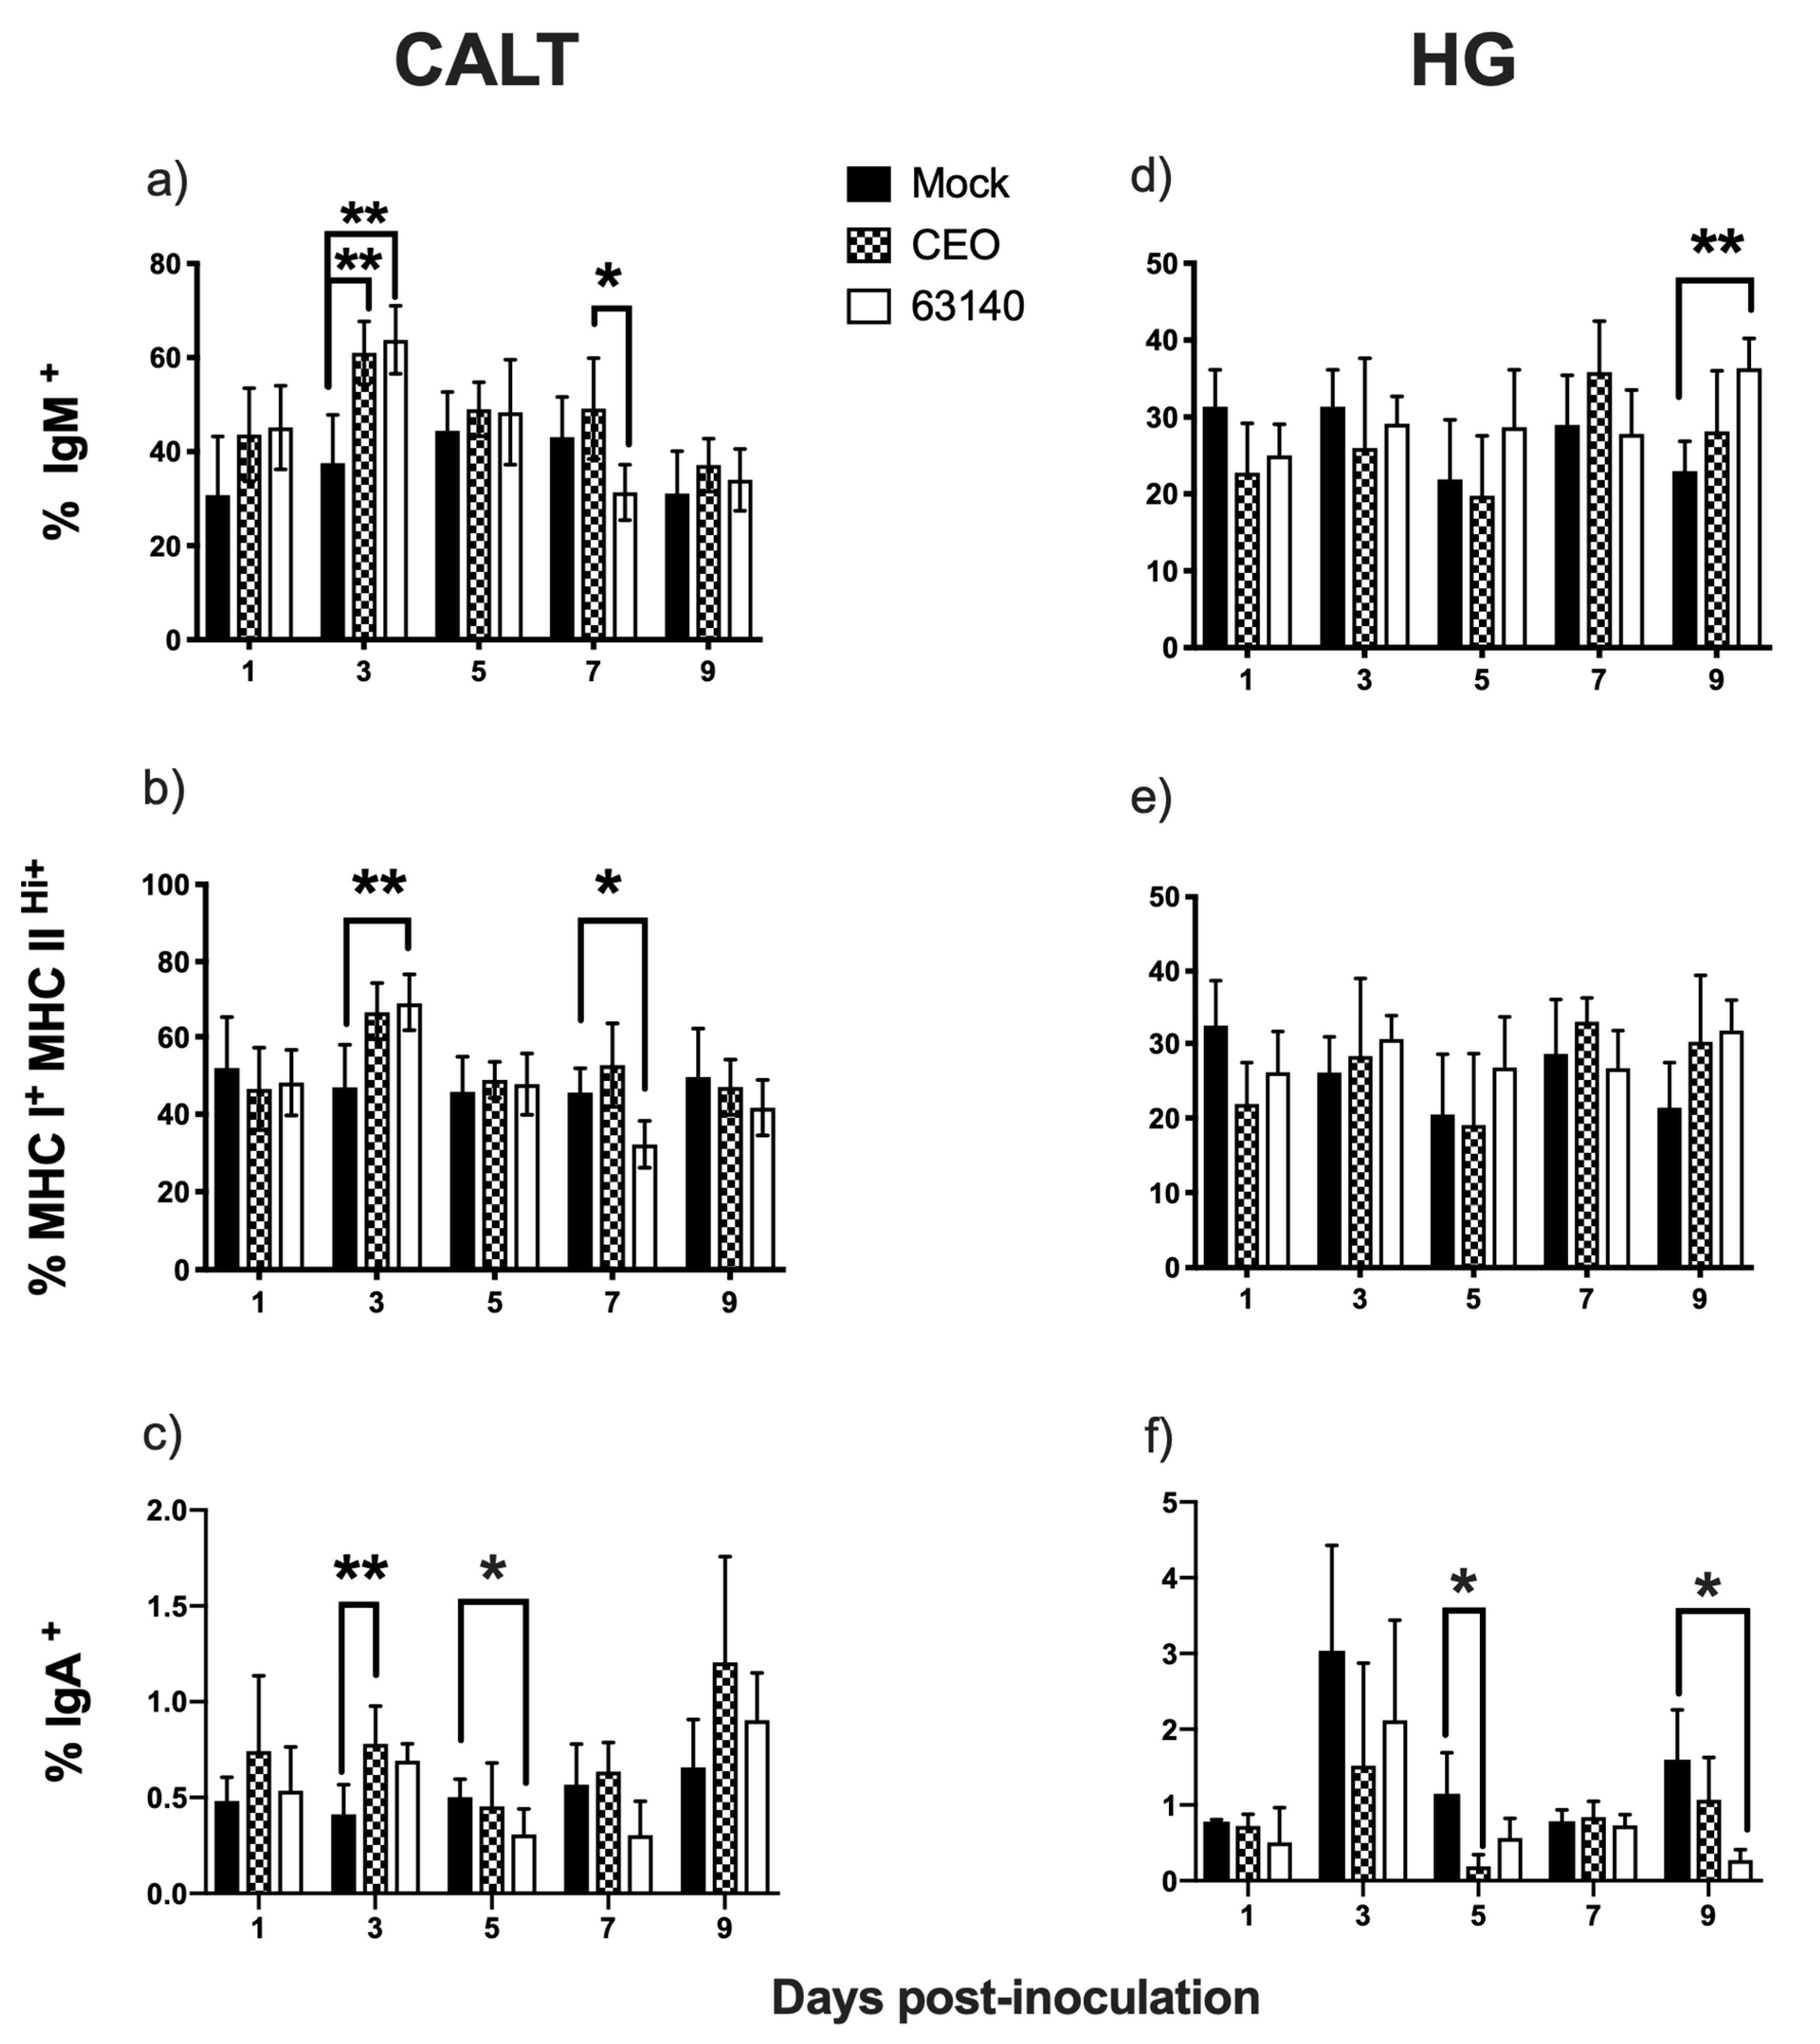
The strong correlation between IgM
+ B and MHCI
+/MHCII
Hi+ cells in the CALT for both the 63140- and CEO-inoculated chickens was indicative of an existing predominant subset of B cells expressing MHCI
+/MHCII
Hi+ in the tissues. It is possible that the increase in IgM
+ and MHCI
+/MHCII
Hi+ B cells at 3 dpi reflects enhanced MHC class II-restricted antigen presentation, while the decline in this population at 7 and 9 dpi may indicate that activated B cells were undergoing isotype switching to IgY [
26]. If this assumption is correct, the data would suggest that isotype switching occurred earlier for the 63140- (7 dpi) than for the CEO-inoculated birds (9 dpi). Even though IgY
+ cells were not measured in this study, early (3 dpi) and late (9 dpi) increases in IgA
+ B cells were detected. This suggests that an antibody response was mounted within the CALT of birds inoculated with CEO or 63140. Although the antigen specificity of the IgA
+ B cells was not determined, it should be noted that the increase in IgA
+ B cells occurred at the peak of (3 dpi) and following the decline (9 dpi) in virus replication in the conjunctiva epithelium. In earlier studies, it was determined that the peak of IgA
+-producing cells in the trachea occurred at day 7 pi. This was after ILTV replication was no longer detected [
27]. Also, it has been demonstrated that the immunomodulating effect of the viral chemokine binding protein, glycoprotein G, favors the recruitment of B cells over T cells to the trachea. This results in an enhanced humoral response, as indicated by an increase in circulating antibodies against ILTV [
28]. Consequently, this immune modulation intensifies the level of the cytopathological lesions in the trachea epithelium [
10]. The current study supports the premise that the immunomodulating effect exerted by the viral glycoprotein G favors ILTV persistence. Prolonged persistence of viral replication, and its associated damage to the conjunctiva epithelium that was observed following ocular exposure to virus. This was most clearly seen with the virulent strain, 63140. In the HG, the increase in the number of IgM
+ and MHCI
+/MHCII
Hi+ cells also supported the activation of B cells. However, a concurrent decline in viral genome load in the HG corresponded with the decline in the number of IgA
+ B cells in both groups of inoculated birds. This suggests that local IgA antibody response may not contribute significantly to the declined in virus replication. As the function of IgA is primarily to block the entry of the virus into cells at body surfaces, this was not completely unexpected. However, it has been reported that IgA
+ B cells produced in the HG migrate to other tissue sites to influence the humoral immune response on other mucosal tissues [
29].
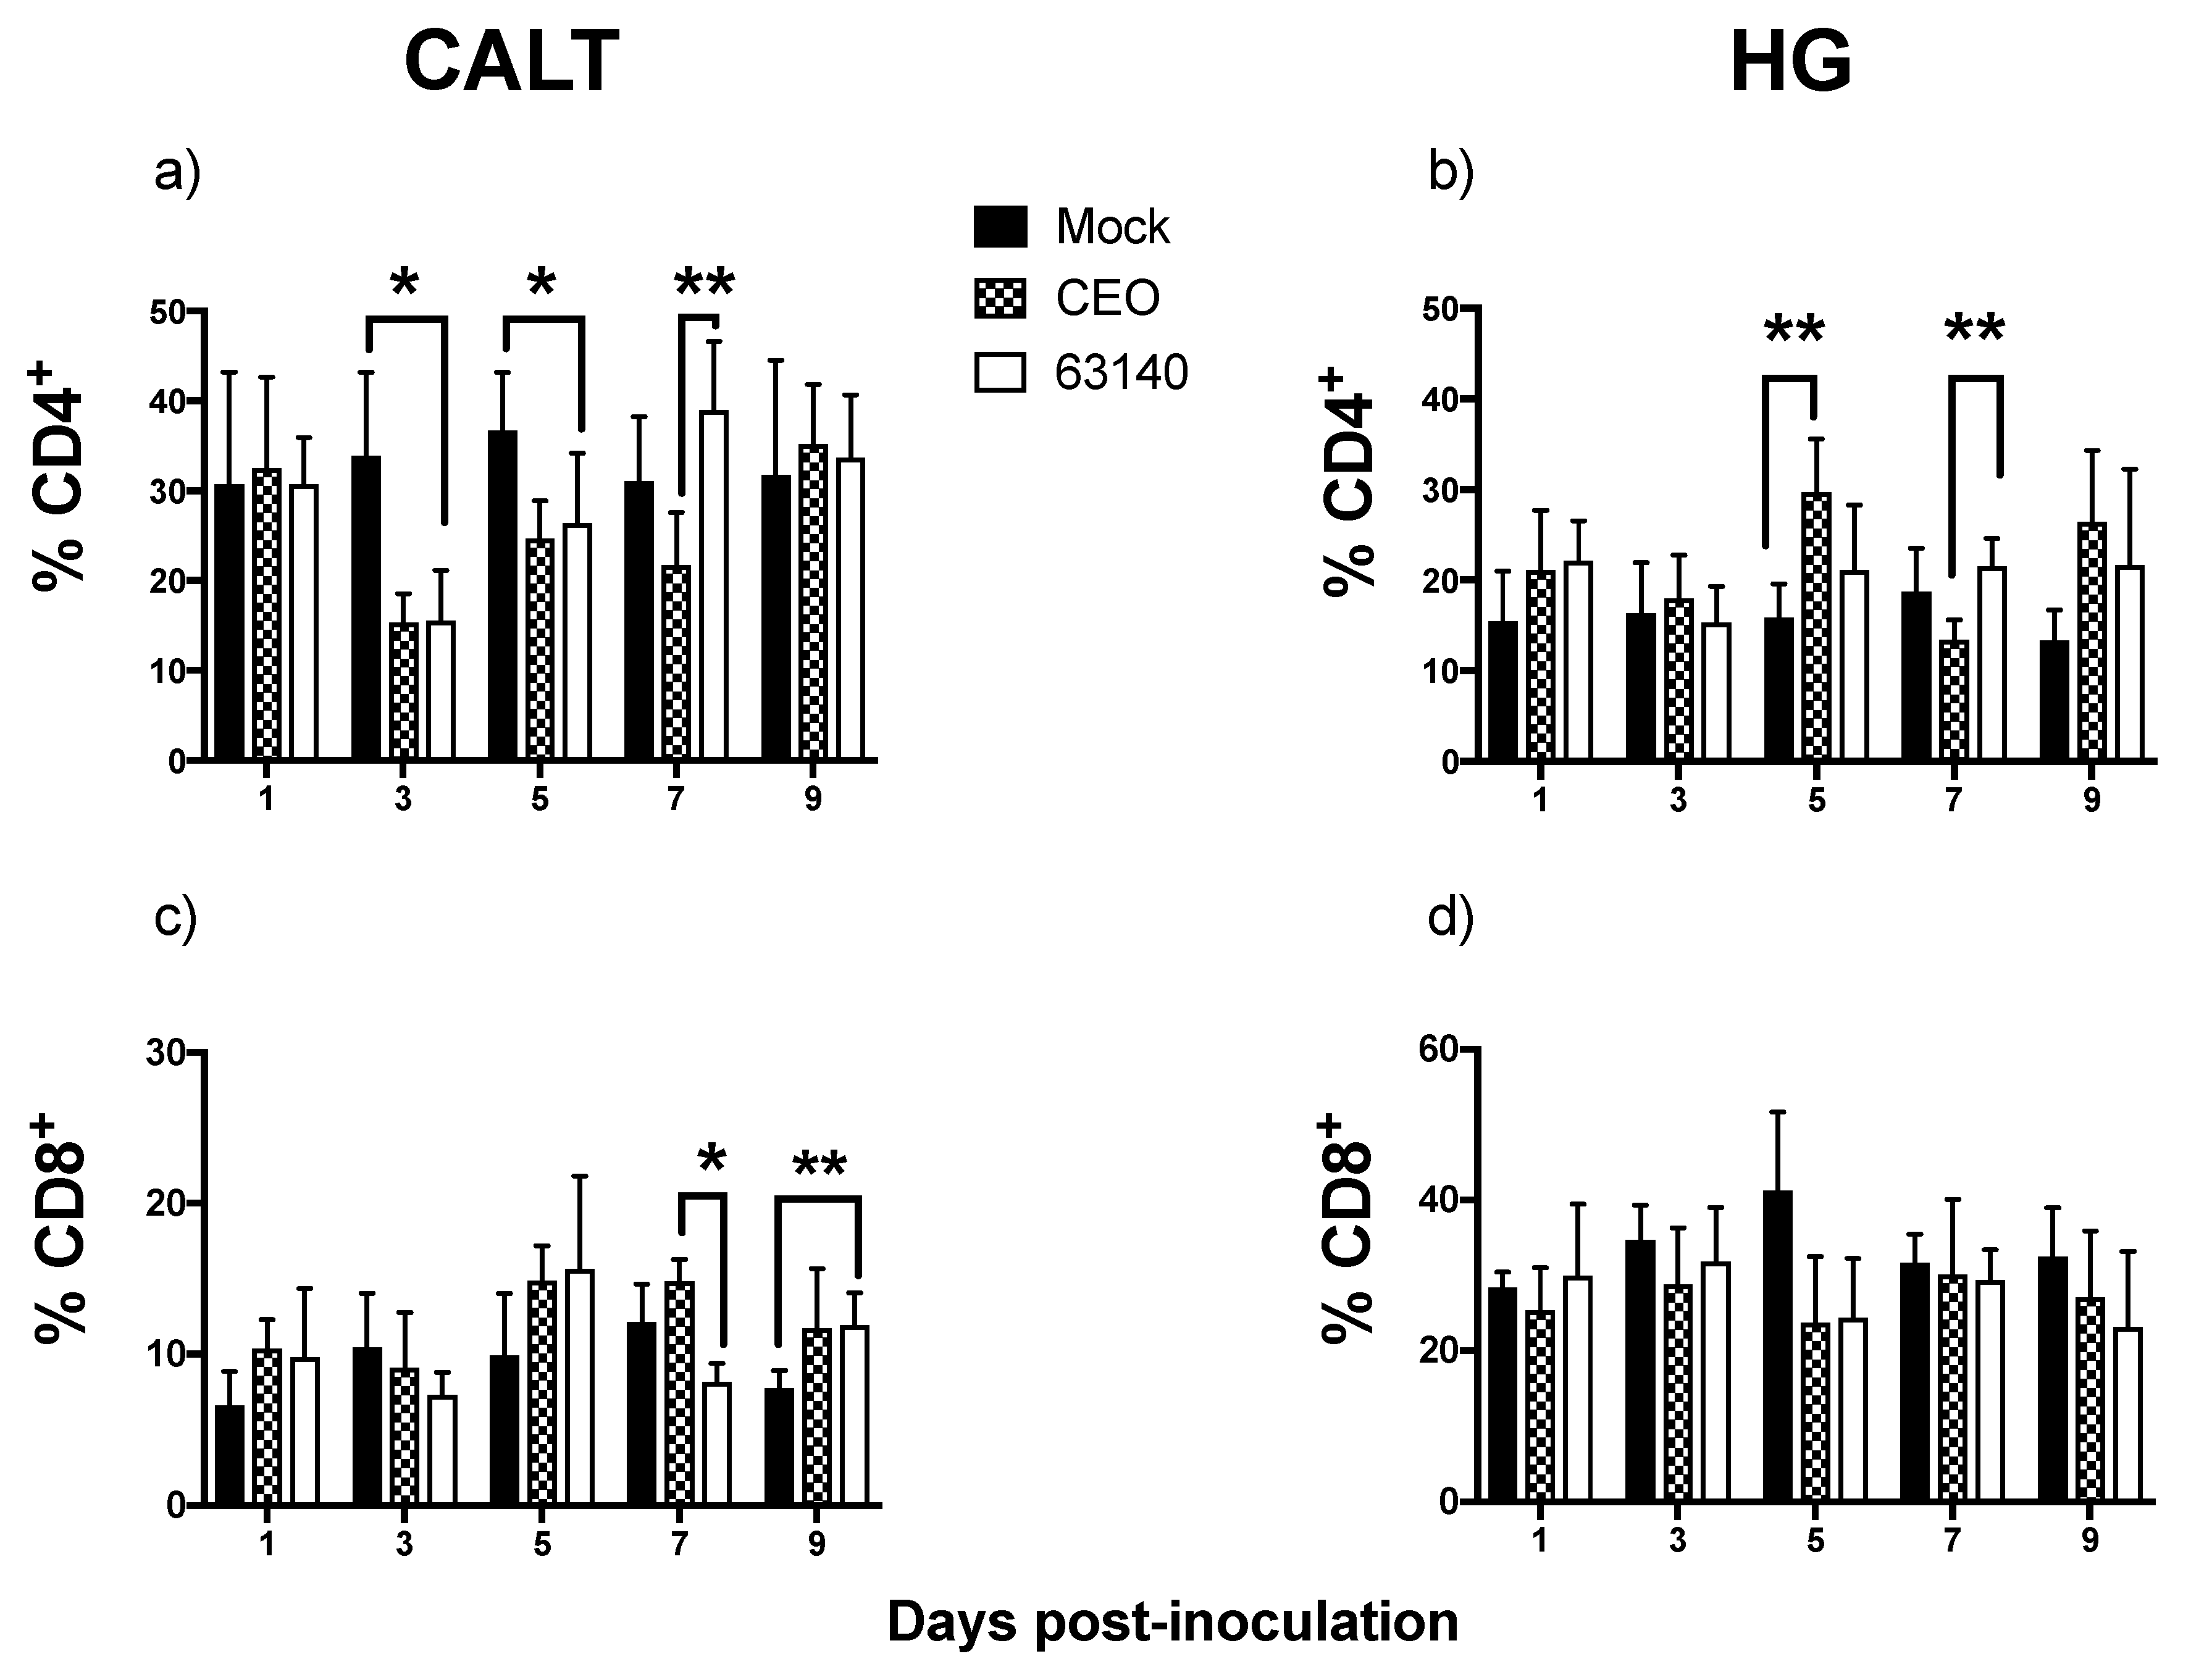
The CD4
+ T cells population in the CALT declined during the peak of virus replication. This decline was more severe for the 63140-inoculated birds than for the CEO-inoculated birds. In a previous study, after ocular inoculation with infectious bronchitis virus (IBV), a CD3
+/CD44
+ cells population, a phenotype characteristic of activated T cells in birds, declined in the CALT at 3 dpi, but reached its peak expansion by 11 dpi. The authors indicated that following IBV exposure effector T cells initially left the CALT, then during the immune expansion phase, the CD3
+/CD44
+ cells repopulated the CALT [
16]. The CD4
+ T cells population in the CALT of the 63140-inoculated birds expanded by day 7 pi. This coincided with the decline in viral genome load. However, viral lytic replication persisted in the conjunctiva epithelium during this time period. For the CEO-inoculated birds, the clearance of viral lytic replication from the conjunctiva epithelium occurred independent of a CD4
+ cells expansion in the CALT. Taken together, these results suggest that CD4
+ cells did not play a key role in the early clearance of the virus from the conjunctiva. In the HG, although no correlation between the number of CD4
+ cells and decrease in viral genome load was revealed, the peak expansion of CD4
+ cells (at 5 dpi) coincided with the decline in the genome viral load for each of the strains.
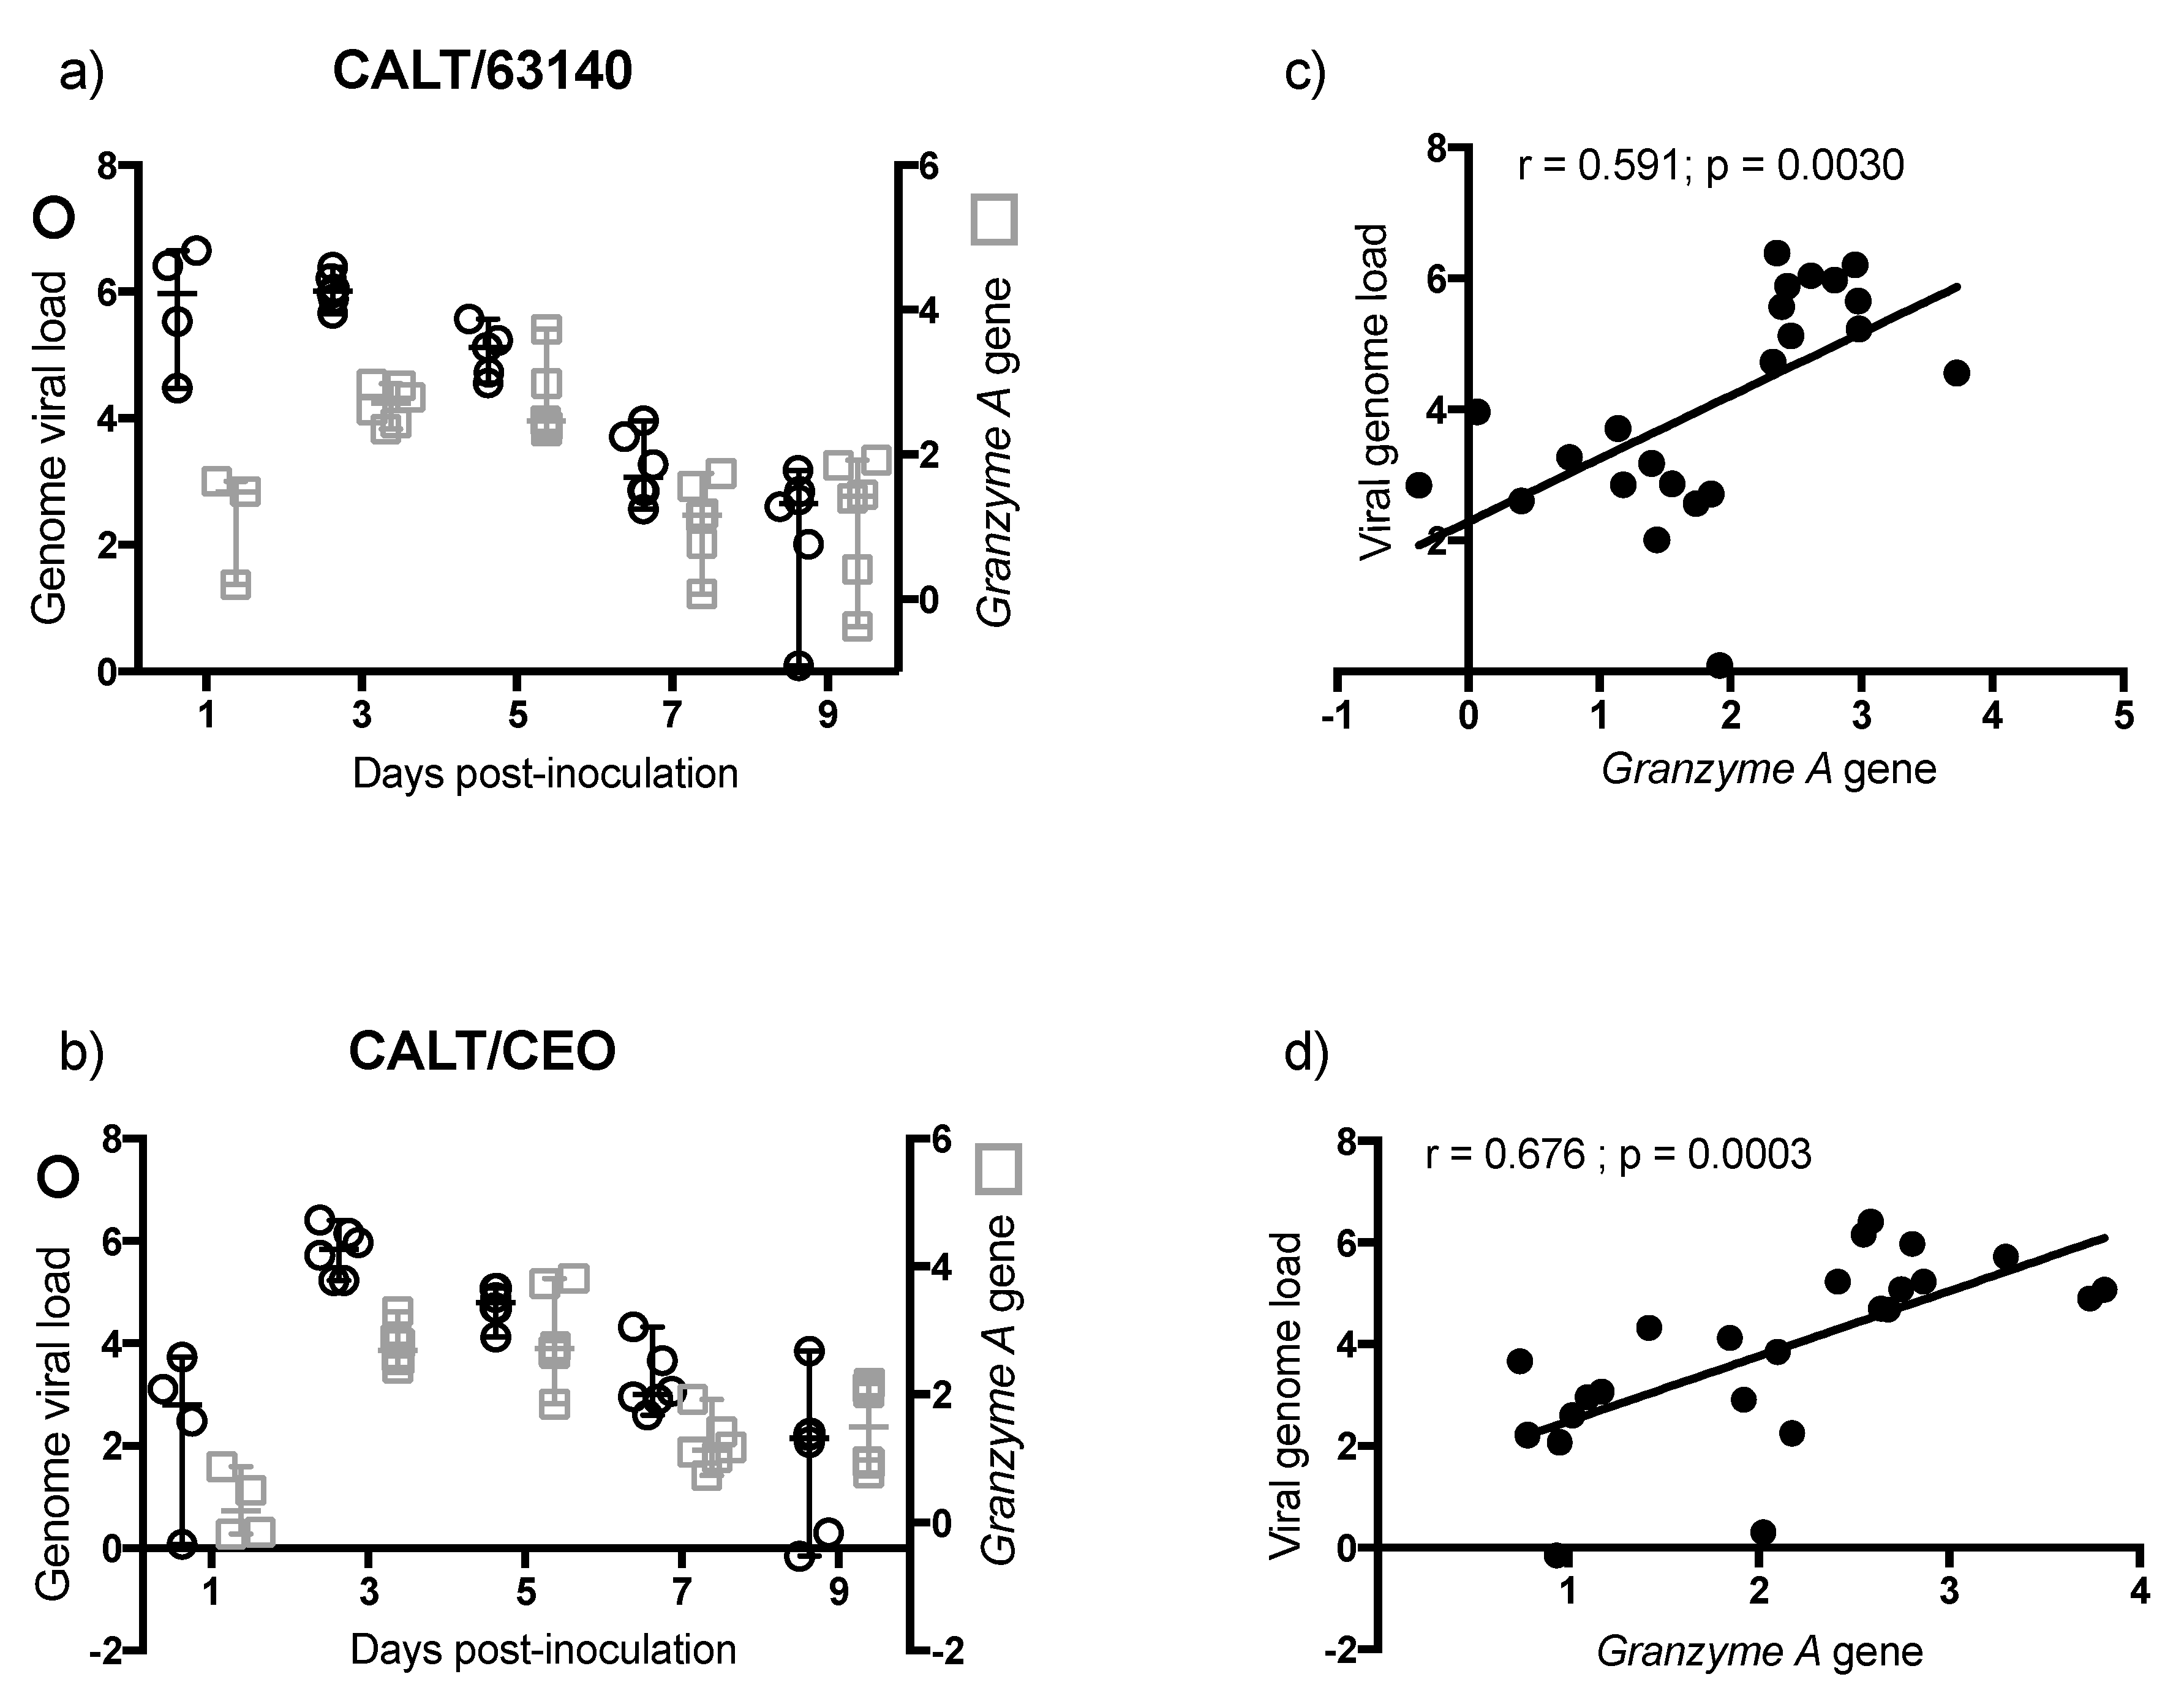
The transcription of the
Granzyme A gene peaked at 3 dpi. This was prior to the expansion of the CD8α
+ cells population. This was also during a significant contraction of CD4
+ cells. This suggests that CD8α
+ NK cells [
30] may be activated at 3 dpi in the CALT. At 5 dpi, the enhanced expression of
Granzyme A in the 63140 and CEO birds coincided with the onset of CD8α
+ cell expansion. The CD8α
+ cell population in the 63140 birds underwent a contraction at 7 dpi. This coincided with persisting lytic viral replication in the conjunctiva epithelium. In contrast, in the CEO birds, the CD8α
+ population underwent a sustained, but gradual, expansion from 5 to 9 dpi. This coincided with the decline in viral genome load of CEO, and the decline in lytic viral replication in the conjunctiva. Independent of the number of CD8α
+ cells in the tissue, changes of
Granzyme A gene expression in the CALT strongly correlated with the decline of CEO and 63140 genomes.
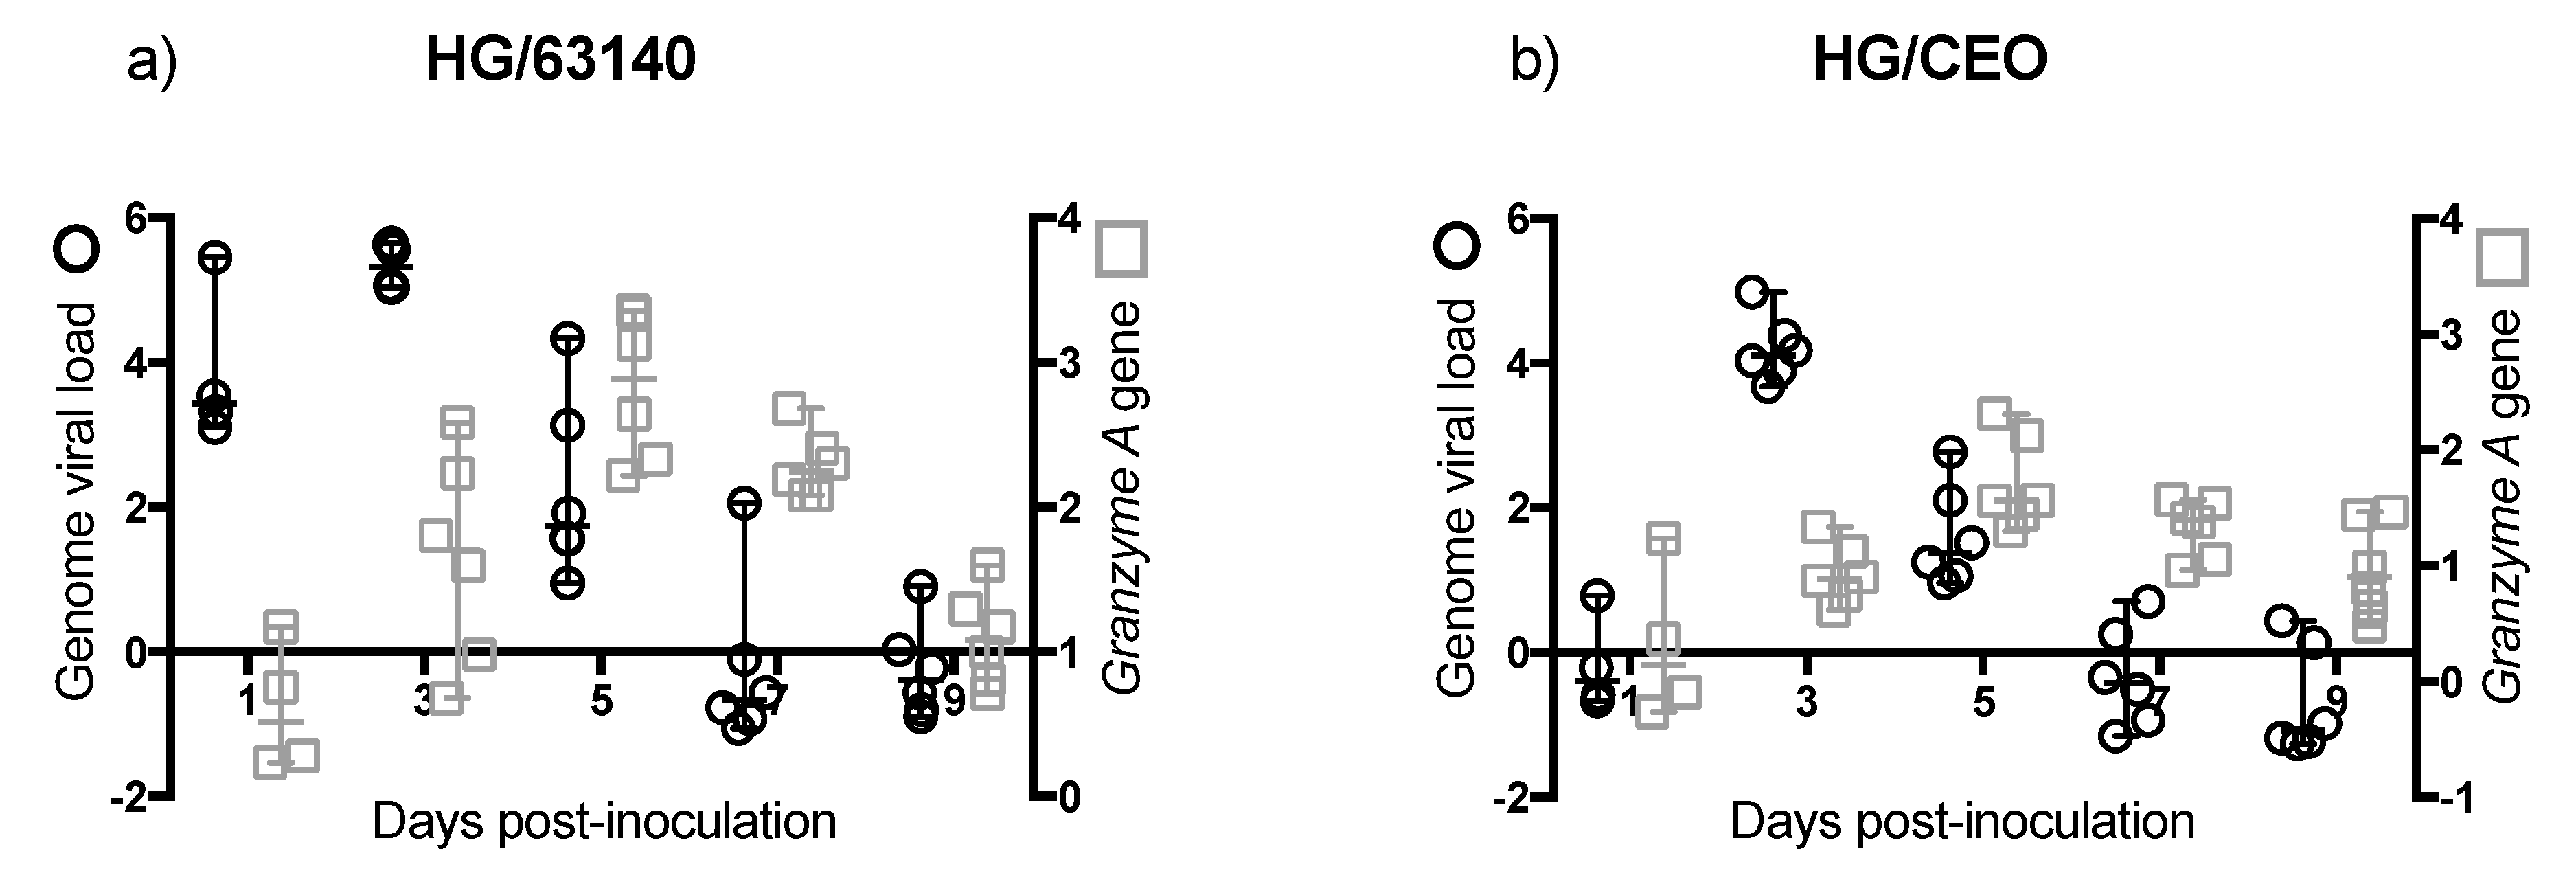
Although no major change in the number of CD8α
+ cells was detected in the HG, the enhanced expression of the
Granzyme A gene indicated that CD8α
+ cells were activated. However, in the HG, an increase in
Granzyme A gene expression did not correlate with the decrease in viral genome load. In contrast to the epithelium associated with the CALT, the epithelium associated with the HG does not support lytic ILTV replication. However, viral antigen is found in association with mononuclear cells in the gland [
17]. Whether the clearance of viral genomes in the HG at 7 dpi is the outcome of cytotoxic T cell activation, or to the migration of viral antigen positive mononuclear cells warrants further investigation.
An effective antigen-specific T cell response is contingent on a balanced and timely innate response.
IL-12 is a critical proinflammatory cytokine involved in the initiation and expansion of antigen-specific adaptive immune responses.
IL-12 acts in the pro-inflammatory cascade during inflammation. It is involved in the activation of both NK cells and cytotoxic T cells activity. IL-12 is a strong inducer of
IFN-γ production.
IFN-γ in turn enhances phagocytic activity of macrophages and monocytes and promotes the further release of
IL-12 and other proinflammatory cytokines. In mammals, bioactive
IL-12 is found in two splice forms, p40 and p35. The p40 form is primarily expressed by monocytes, macrophages and dendritic cells [
31]. It is not currently known if chicken antigen presenting cells (APCs) produce
IL-12p40. However, it has been confirmed that following stimulation with lipopolysaccharide (LPS), or unmethylated CpG DNA, chicken macrophages from peripheral blood, or bone marrow [
32], and chicken thrombocytes [
25] appear to express a functional analog of the
IL-12p40 gene.
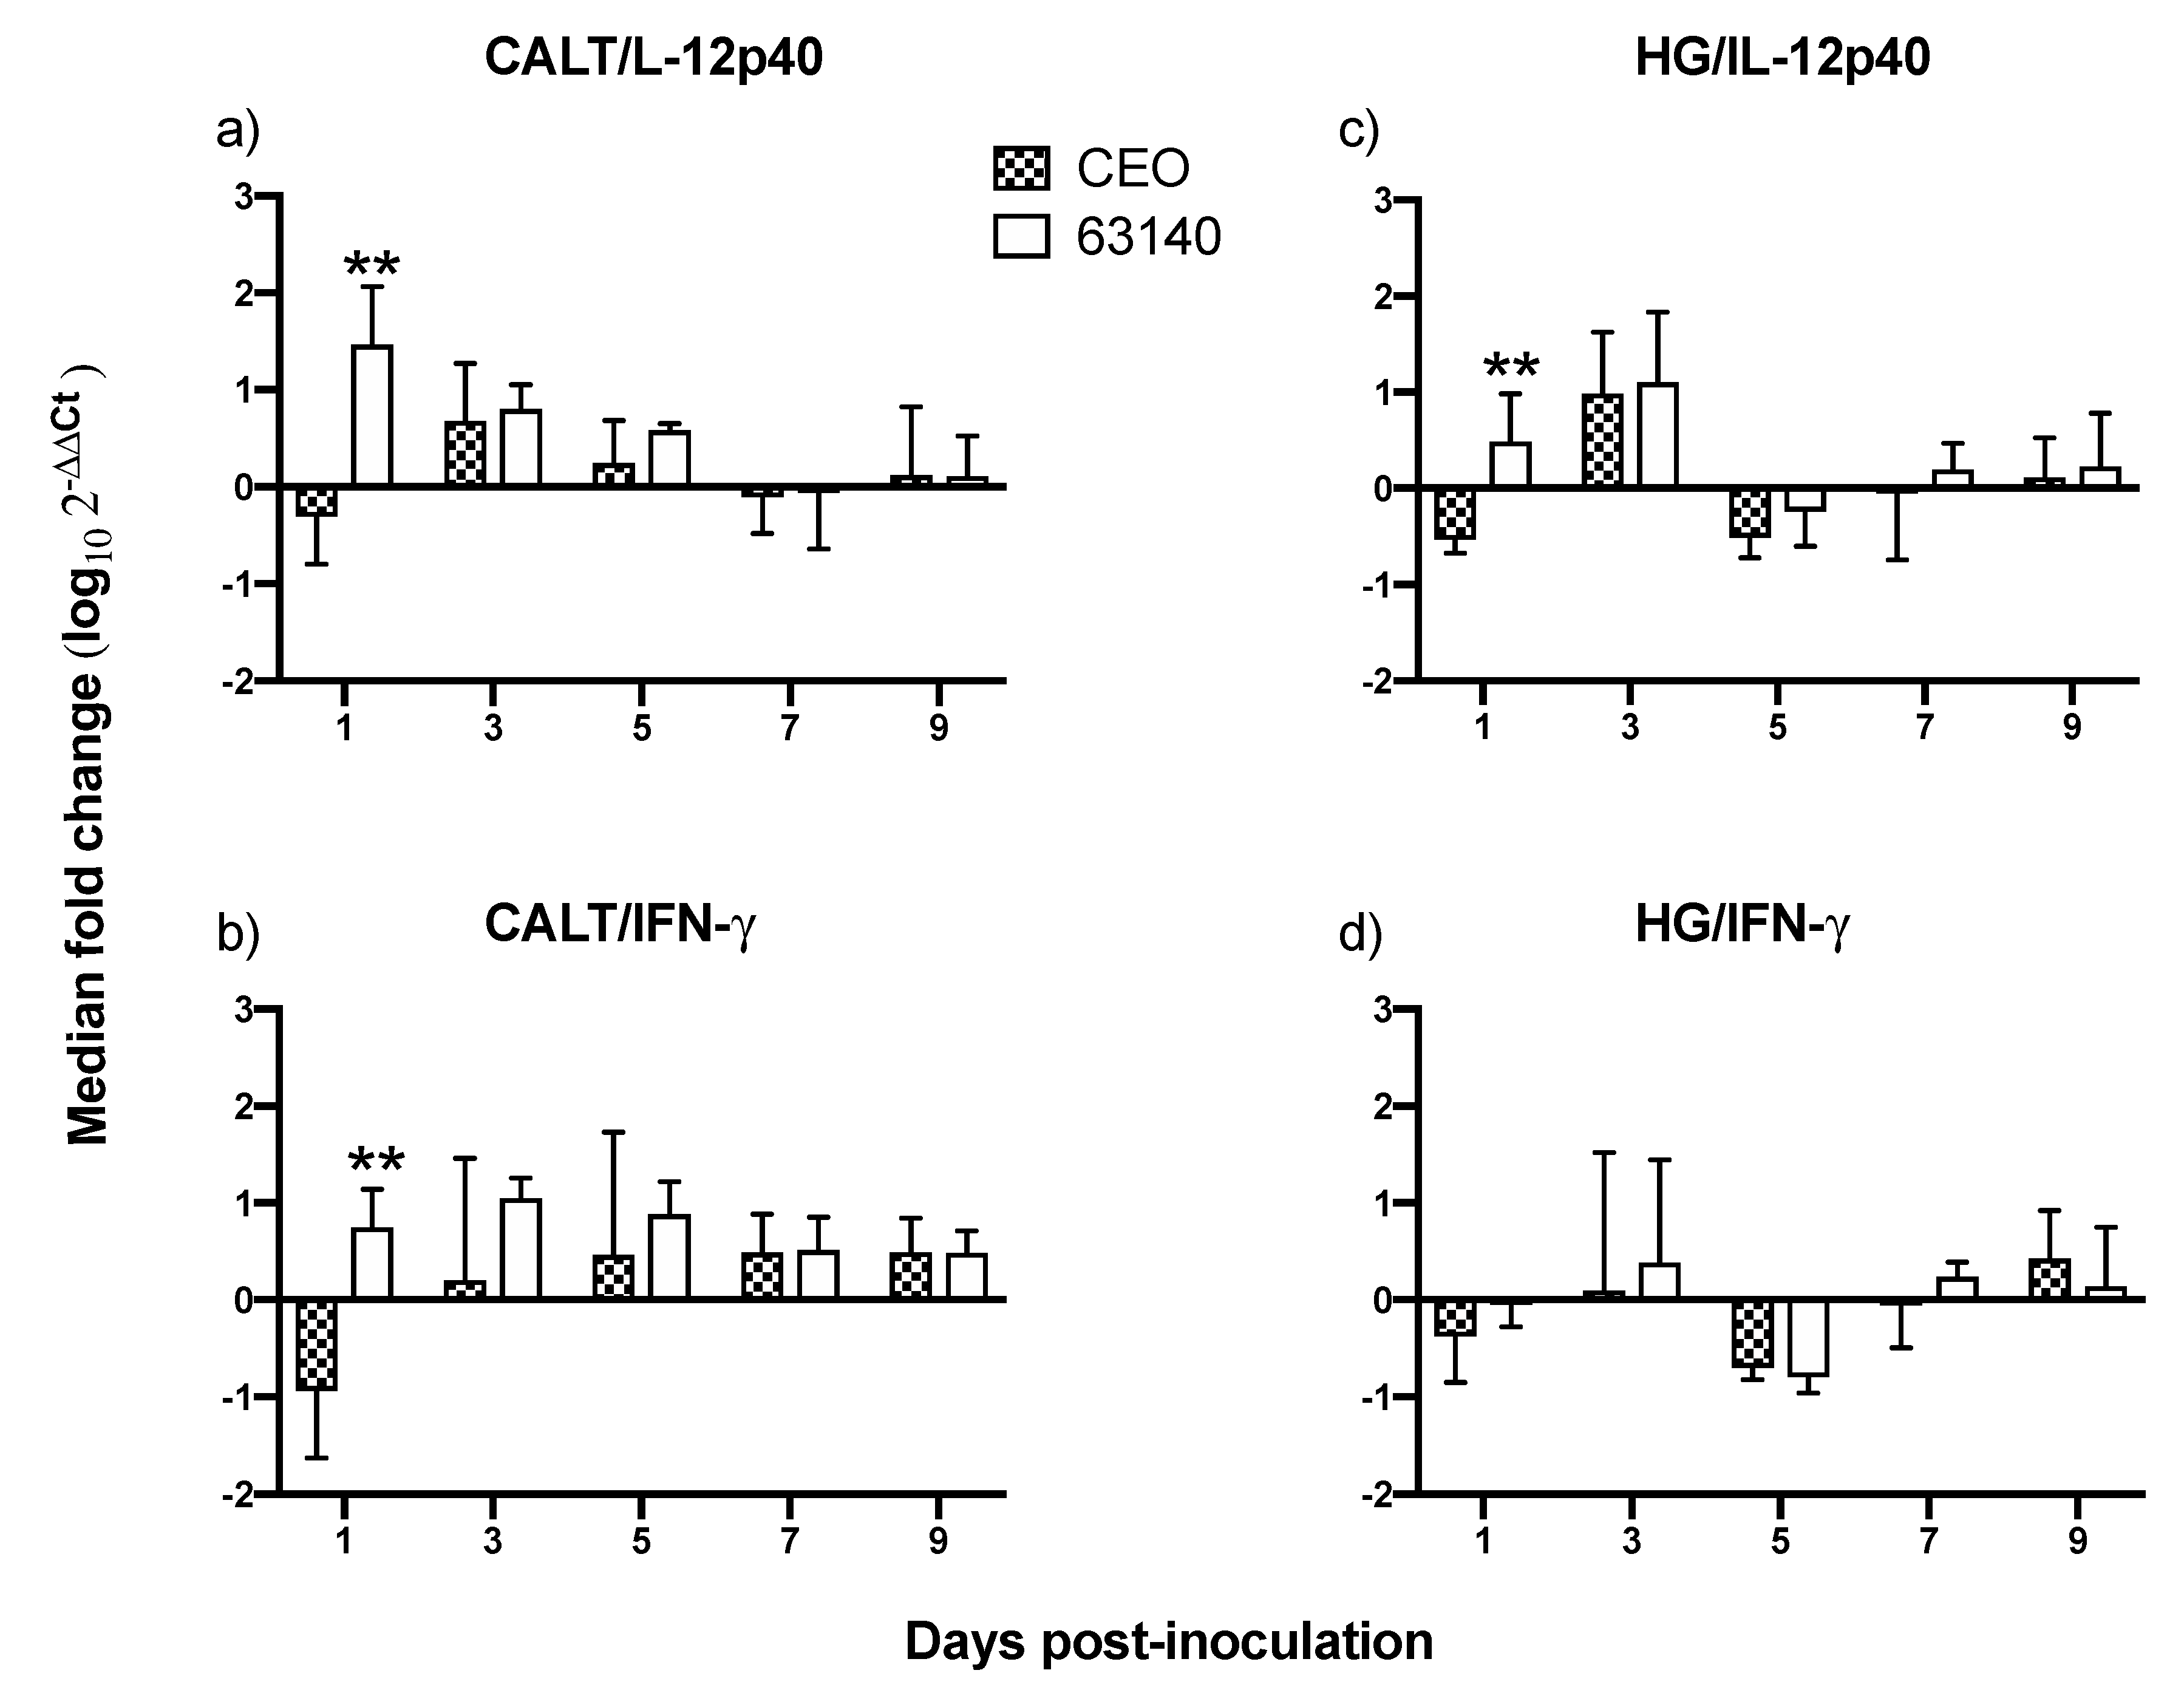
In this study, the increased expression of the IL-12p40 and IFN-γ genes at 1 dpi, and the increased expression of IFN-γ during the acute phase of the infection (3 to 5 dpi) in the CALT were not sufficient to neutralize the virus infection with the virulent 63140 strain. Whereas, in the CEO-inoculated chickens, the downregulation of IL-12p40 and IFN-γ genes at 1 dpi appeared to elicit a more dampened inflammatory response. This was associated with the accelerated clearance of the virus lytic replication. In the HG, only the moderate expression of IL-12p40 and IFN-γ at 1 and 3 dpi resulted in the expansions of both CD4+ and CD8α+ cell populations which appeared sufficient to limit viral replication in chickens inoculated with either virus.
As evidenced by the differential expression of
IL-12p40 and
IFN-γ genes observed at the initiation of viral infection, it appears that local innate immune activation plays a significant role in governing the speed and efficacy of the adaptive immune response to ITLV. It has been demonstrated that highly pathogenic avian influenza H5N1 viruses [
33] and velogenic Newcastle disease virus (NDV) [
34] compromise the activation of NK cells. In addition to NK cells, another population of CD8α
+ cells that are also capable of lysing virus infected cells independent of MHC restriction is a subpopulation of γδ T cells [
35]. An approach to phenotyping and mapping the functional activities of all relevant CD8
+ cells in CALT and HG will be required to identify the role that each group of CD8
+ cells play in controlling lytic viral replication.
Finally, regulation of macrophage activity by Th1 and Th2 cytokines appears to be an important component in the balance of the immune response induced during ILTV infection. This balance is necessary to avoid the damage associated with excessive inflammatory activation. The injection of
IFN-γ into mice prior to ocular inoculation with Herpesvirus simplex 1 (HSV-1) significantly increased virus replication in the eye, increased the number of latently infected trigeminal ganglia, and produced more severe lesions in the cornea [
36]. Under this model, it was determined that macrophage polarization, provoked by
IFN-γ, enhanced the production of inflammatory cytokines, and consequently exacerbated the disease. The macrophages in CALT and HG were not included in this analysis. Yet, the observed early increase in
IL-12p40 and
IFN-γ genes expression induced by the 63140 strain in the CALT was followed by an increase in inflammatory infiltrates in the conjunctiva. These observations warrant an investigation of whether the virulent strain 63140, but not the CEO vaccine strain, favors the pro-inflammatory polarization of macrophages in the associated ocular tissues.
Taken together, this study attempted to document the dynamics of lymphoid cell populations in the two major ocular mucosal lymphoid organized tissues of the chicken during infection with a strongly virulent ILTV strain (63140) and a relatively attenuated vaccine virus, the CEO commercial vaccine virus. The study demonstrated that after ocular inoculation the severity and duration of the lesions in the conjunctiva epithelium induced by the CEO vaccine strain were limited and resolved faster than those induced by the 63140 virulent strain. The CALT actively responded to both viral strains. Each strain induced the generation of IgA+ cells and an increase in the number of IgM+ and MHCI+/MHCIIHi+ cells. This suggested that the B cells activation in the tissues examined was part of the adaptive immune response to ILTV. However, the immunomodulating factor in ILTV appears to promote this B cell activation bias. An increase in the transcription of Granzyme A and its association with the decline in the number of viral genomes in the tissue appears to suggest that cytotoxic T cell and NK cell activation, rather than activated B cells, was primarily responsible for the clearance of the virus infection from the conjunctiva. Virus clearance from the HG appeared to be mediated by a broader set of immune responses. These include the generation of IgA+ cells, the expansion of CD4+ cells, and the production of Granzyme A by resident CD8α+ cells. Rapidly after infection (1 dpi), the 63140 strain stimulated an upregulation of the IL-12p40 and IFN-γ genes in the CALT, but the CEO vaccine strain downregulated the expression of both of these genes. Therefore, a surge in pro-inflammatory cytokine production, which sustains the antigen-specific cell-mediated response, did not accelerate the clearance of the virus from the conjunctiva. This outcome underscores the effect that interactions between innate cells and ILTV have on the robustness and speed of adaptive immune responses.
In conclusion, this work is the first to examine the changes in lymphoid cells within the eye-associated lymphoid tissue during the course of ILTV infections of different virulence. It supports the premise that ILTV-mediated immunomodulation promotes a B cell response over the more productive responses of T cells. Further, it provides evidence that expansions of CD8α+ cells, with the concomitant expression of the Granzyme A gene, are one key to halting ILTV cytolytic replication in the conjunctiva. Ultimately, this study revealed that the early upregulation of IL-12p40 and IFN-γ cytokine genes was incompatible with the decline in virus replication during acute infection, thus enhanced development of lesions in the conjunctiva epithelium.


