Abstract
Urban roadside environments are characterized by altered microclimate and soil conditions that impose recurrent drought stress on trees, affecting their physiological performance and adaptive capacity. Understanding species-specific physiological and structural responses to drought stress is crucial for selecting tree species that are suitable for urban environments. In the present study, we investigated the species-specific and temporal (monthly) patterns of the in situ leaf physiological status and structural traits of two riparian tree species, Quercus robur L. and Carpinus betulus L., cultivated as urban roadside trees in Novi Sad, Serbia, throughout the growing season (from June to September). This was achieved by assessing leaf gas exchange and rapid light curves of chlorophyll a fluorescence together with leaf structural traits. Under drought stress, Q. robur exhibited sustained photosynthetic activity and transpiration rates due to reduced stomatal sensitivity, indicative of a more anisohydric behavior with respect to its water relations strategy. In contrast, C. betulus exhibited tighter stomatal regulation and showed lower assimilation rates accompanied by reduced cooling capacity, indicating stricter, more conservative water-balance management indicative of isohydric species. Fluorescence indices revealed contrasting behavior: C. betulus showed enhanced NPQ values accompanied by a decline in photosynthetic efficiency, while Q. robur exhibited lower NPQ, suggesting better maintenance of photosynthetic performance and electron transport in PSII under the observed drought stress. These patterns were further supported by higher stomatal density combined with smaller stomatal size, indicating faster stomatal response rates in C. betulus compared to Q. robur. Overall, these results suggest that C. betulus is a more promising riparian tree species for urban landscapes, particularly under drought-prone conditions and predicted climate changes, in comparison to Q. robur.
1. Introduction
Urbanized landscapes represent human-altered, highly modified, and heterogeneous environments characterized by a wide spectrum of stress factors that act on and influence the health of urban vegetation [1,2]. Dominant stimuli in urban conditions may include unfavorable changes in soil properties and structure as well as altered environmental conditions [1,3]. Among these, water scarcity is recognized as a major stressor affecting tree physiological functioning, growth patterns, long-term survival, and the ecosystem services they provide to dwellers [4,5,6]. Urban trees are increasingly experiencing drought stress due to ongoing climate change, as indicated by rising temperatures, reduced precipitation, and more frequent and prolonged extreme events [7,8]. These climate-driven stressors, combined with pre-existing urban pressures, are exacerbating the already harsh challenges that urban trees encounter and are expected to continue to intensify in the future. For example, due to weak precipitation events that failed to provide adequate soil water storage in urban settings in Central Europe, a previous study demonstrated that small-leaved linden (Tilia cordata Mill.) experienced water scarcity stress for more than 85% of the 2018 growing season [7]. The studied street trees survived under such persistent stress, showing signs of decline, with consequences for their long-term health, which may still be at risk under recurrent drought events.
Among versatile urban vegetation, roadside trees are acknowledged to be more affected by urban site characteristics and microclimate compared to trees cultivated in parks, which experience favorable growing conditions [9,10]. Specifically, trees along roadsides have been shown to experience multiple interacting environmental constraints, such as high traffic emissions that can affect tree physiology [11,12], greater exposure to impervious surfaces limiting root development and water availability [13,14], and elevated soil salinity levels due to deicing, which limits water uptake and can result in foliar injury [15,16]. These pressures co-occur and interact, further exacerbating the effects of drought stress that urban trees encounter [1].
Historically, urban tree selection has focused on aesthetic value and plant availability, with limited consideration for site-specific conditions. This approach has resulted in low tree species diversity in many urban areas, with the most popular species often chosen, thereby compromising the resilience of urban trees to environmental stresses [17,18,19]. Given the high costs associated with planting and maintaining urban trees, choosing species based on their ecological performance, i.e., drought tolerance and recovery capacity, can significantly reduce maintenance costs for municipal greenspace management [8,20].
Despite this, knowledge of species-specific responses to drought and post-drought recovery in urban environments remains insufficient, underscoring a significant research need. Understanding both resilience during drought stress and recovery afterward is essential for sustainable urban forestry management under climate change [21]. By analyzing and comparing species-specific behavior patterns during drought and post-drought periods, urban planners and ecologists can support the selection and promotion of tree species that exhibit enhanced physiological performance under stress and also demonstrate efficient recovery when water availability improves, making them particularly suitable to meet the current and future challenges of urban greening [22,23].
To provide valuable insights regarding how urban trees adapt to unique environmental conditions, leaf functional traits can be assessed and evaluated [24,25,26]. Previous studies have shown that species exhibit different behavioral patterns in response to drought stress, resulting from differences in physiological and leaf structural traits [27]. Namely, species differing in leaf functional traits, such as leaf mass per area [27,28] and stomatal behavior [29,30], have been shown to possess contrasting drought tolerance mechanisms and water use efficiency, which may contribute to differential responses to water scarcity, distinguishing isohydric and anisohydric species [31,32,33]. Under such circumstances, tree species characterized by low water use (isohydric species) should be considered, as they exhibit enhanced adaptability to these site conditions, are presumed to possess improved water retention, and are, therefore, more effective at withstanding prolonged periods of water scarcity [34,35].
However, our knowledge regarding the interacting physiological and ecological processes that govern photosynthesis and long-term tree condition and growth in urban areas is still insufficient [36]. In particular, there is a lack of integrative studies linking leaf structural traits—both physiological (leaf gas exchange indices, chlorophyll a fluorescence) and leaf structural traits—to local environmental conditions, such as soil moisture and microclimate. Therefore, to address this gap in our understanding, the present study aims to examine how urban trees respond to local environmental conditions by assessing these traits in relation to climatic data and soil moisture content at the studied site. Specifically, we focused on comparing Quercus robur and Carpinus betulus, two riparian tree species widely distributed across Europe, characterized by distinct ecological strategies: Q. robur is light-demanding [37], whereas C. betulus is shade-tolerant [38], and they are, therefore, suitable taxa for investigating physiological responses associated with contrasting light demand and tolerance. Q. robur represents one of the most commonly cultivated urban tree species in Novi Sad [39] and ranks among the economically and ecologically most important species of European forests [40]. In addition to Q. robur and Fagus sylvatica L., C. betulus is considered one of the most important components of European temperate deciduous forests [41] and is used as an ornamental plant with strong adaptability [42]. In terms of habitat preference, Q. robur is typically located in temperate deciduous forests, i.e., riparian and floodplain habitats characterized by fertile and moist soil conditions [43], whereas C. betulus, on the other hand, is more commonly widespread in mesic, well-drained forest sites [44].
By comparing the leaf functional traits of Q. robur and C. betulus under drought stress in the urban environment of Novi Sad, we hypothesized the following:
- Drought stress is expected to adversely affect leaf functional traits, reflected in the downregulation of leaf gas exchange, alterations in chlorophyll a fluorescence and changes in leaf structural traits.
- The intensification of drought stress in urban areas is expected to cause non-stomatal limitations to photosynthesis and damage the photosynthetic apparatus, as indicated by chlorophyll a fluorescence indices.
- Species implement different strategies to adapt to drought-induced stress through species-specific physiological indices and leaf structural traits. A resource-conservative species (i.e., C. betulus) is expected to be less affected under water-limited urban conditions than a resource-intensive species (i.e., Q. robur).
This study aims to understand how physiological and morpho-anatomical functional traits vary between two distinct adaptive strategies, providing insights to support the selection of suitable tree species for site-specific conditions under ongoing climate change pressures.
2. Materials and Methods
2.1. Study Area and Plant Materials
This study was conducted at the Boulevard of Europe (Figure 1) in Novi Sad (45.2671° N, 19.8335° E; 80 m a.s.l.), the second largest city in Serbia, with a population of 260,000 and an area of 83.01 km2. The boulevard extends approximately 7.1 km in an east–west orientation and was constructed in 2010. It contains three traffic lanes, a central median, green spaces in between, a bicycle path, and a pedestrian path with a total width of approximately 60 m. The green areas were complemented with two rows of alley trees planted at 10 × 10 m spacing. Six-year-old trees of C. betulus were planted in the first row adjacent to the road, while Q. robur individuals were in the second row. For each species, ten individuals were chosen with comparable morphometrical characteristics and a fully covered canopy (Table S1). The criterion for individual selection followed a visual assessment of overall tree vitality, considering only specimens without signs of pests, disease, or recent pruning [45]. The studied trees were over 6 m tall, with well-developed lignified tissues, which may contribute to their observed resistance to water scarcity.
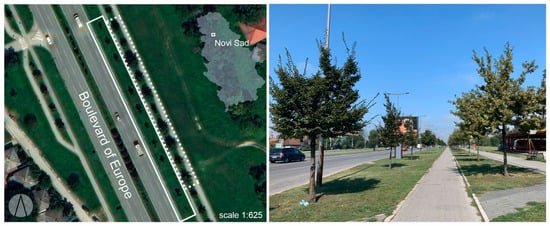
Figure 1.
Map showing the study site and the trees selected. The continuous white line represents the studied Q. robur individuals (n = 10), while the dotted white line shows the studied C. betulus individuals (n = 10) at the Boulevard of Europe, Novi Sad (Serbia).
2.2. Micrometeorological and Soil Data
Mean daily air temperature (°C) and total daily precipitation (mm) data were obtained from the nearby climatic station in Rimski Šančevi (45°20′ N, 19°51′ E; altitude 84 m a.s.l.) for the growing season of 2019 (from 1 May to 1 October). In addition, vapor pressure deficit (VPD) was computed from daily air temperature (T, °C) and daily relative humidity (RH, %) data as the difference between the saturation water vapor pressure (es (T)) and the actual water vapor pressure (ea), expressed in kPa, calculated following Xu et al. [46], as
VPD = es(T) − ea = es(T) × (1 − RH/100)
The saturation vapor pressure (es(T)) was calculated using Tetens’ empirical equation, with air temperature () in degrees Celsius, as follows:
es(T) = 0.611 × exp (17.27 × T/T + 237.15)
Actual vapor pressure (ea, kPa) was calculated from the relative humidity (RH, %) as
ea = RH/100 × es(T)
Soil moisture content (%) was monitored on-site concurrently with physiological characterization throughout the growing season of 2019 (June–September), using an HH2 Moisture Meter (Delta T Devices, Cambridge, United Kingdom) equipped with a ThetaProbe sensor. Measurements were made at a depth of 6.0 cm within the root zone of each sampled tree. For each individual tree (n = 10 per species), recordings were taken evenly, approximately at 120° intervals. The probe was inserted vertically into undisturbed soil to reduce variation arising from potential soil heterogeneity. The three readings recorded per tree were then averaged to provide a single representative value per individual. Species-level soil moisture values were afterward derived as the mean of the ten individual tree measurements, thereby reducing variability associated with small-scale soil heterogeneity.
Physiological measurements were conducted monthly on approximately the same date to ensure uniformity across months from June to September, as follows: 22 June, 20 July, 21 August, and 20 September. Meteorological conditions corresponding to each measurement period were characterized using mean air temperature, the sum of precipitation, and VPD.
The first measurement period represented the physiological optimum, characterized by a fully developed canopy cover, a mean monthly air temperature of 23.2 °C, total precipitation of 10.0 mm for the preceding week (Figure S1), and a VPD of 0.94 kPa (Figure S2). The second measurement period was considered a dry period compared to the initial measurement, with a mean monthly air temperature of 23.3 °C, absence of precipitation for about a week, and a VPD of 1.17 kPa. The measurement date in August represented the most drought-prone, defined by an elevated mean monthly air temperature of 24.4 °C, low water availability due to the absence of rainfall for a week, and a VPD of 1.75 kPa. Finally, the measurements taken in September might refer to a recovery period, with a mean monthly temperature of 18.17 °C, total precipitation of 3.9 mm for the preceding week, and a VPD of 0.53 kPa.
Soil water content varied significantly between months in both tree species, following a V-shaped pattern. A pronounced decrease was observed from June to August, with a sudden recovery in September (Figure 2). Regarding differences between species, a more pronounced reduction was measured in C. betulus, with a higher restoration of values in September, compared to Q. robur.
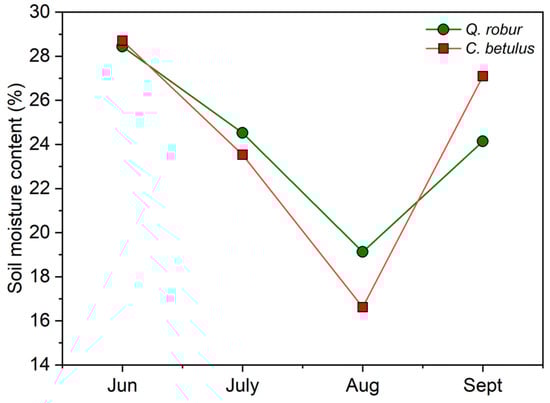
Figure 2.
Soil moisture content for the examined urban roadside tree species (Q. robur, C. betulus) monitored during the growing season of 2019 (June–September).
2.3. Chlorophyll a Fluorescence Indices
Chlorophyll a fluorescence indices were monitored in situ using the PAM-2500® portable chlorophyll fluorometer (Walz GmbH, Effeltrich, Germany). Data were recorded monthly (from June to September) on sunny, windless days between 09:00 and 11:00 h (Central European Time) to maintain consistent light conditions throughout the measurements [47].
Measurements were performed on fully expanded, visually healthy, sun-exposed leaves located in the outer upper canopy of the selected trees (n = 10 per species). Leaves were selected from comparable canopy positions and orientations to ensure consistent light exposure and physiological status [48]. Measurements were performed sequentially on the individuals of both species to minimize the potential effects of midday photoinhibition and provide an adequate comparison of data between the two species.
Before the measurements, leaves were initially dark-conditioned using the light exclusion clips of the PAM-2500® for approximately 15 min to ensure complete oxidation of PSII reaction centers. Following the dark adaptation, leaves were subjected to nine gradually increasing irradiances of 20 s duration, ranging from 0 to 2443 μmol e m−2 s−1 (0, 144, 274, 477, 788, 1163, 1389, 2018, 2443 μmol e m−2 s−1, respectively) [49]. At each irradiance level, steady-state fluorescence (F), minimum fluorescence in the light-adapted state (Fo′), and maximum fluorescence in the light-adapted state (Fm′) were recorded [45].
Prior to signal acquisition, the auto-zero function was used to minimize the signal from persisting ambient light [50]. Fluorescence signals were recorded and processed using PamWin-3 software (version 3.12g, Heinz Walz GmbH, Effeltrich, Germany) and were further applied for the construction of rapid light curves.
Primary fluorescence indices were used to calculate the following fluorescence ratios: effective photochemical quantum yield of PSII (Y(II), relative units), quantum yield of light-induced non-photochemical fluorescence quenching (Y(NPQ), relative units), quantum yield of non-regulated heat dissipation and fluorescence emission (Y(NO), relative units), coefficient of photochemical quenching (qP, relative units), coefficient of photochemical quenching assuming interconnected PSII antennae (qL, relative units), coefficient of non-photochemical quenching (qN, relative units), Stern–Volmer type non-photochemical fluorescence quenching (NPQ, relative units), and relative electron transport rate (ETR, μmol m−2 s−1), as described by Baker [51].
2.4. Leaf Gas Exchange Measurements
Leaf gas exchange, including net photosynthesis (A, μmol m−2s−1), transpiration rate (E, mmol m−2s−1), stomatal conductance (gs, mmol m−2 s−1), intercellular CO2 concentration (Ci, μmol mol−1) and leaf temperature (Tleaf, °C), was assessed on-site with the CIRAS3® portable photosynthesis system (PP Systems, Amesbury, MA, USA). Measurements were conducted on the same leaves used for the chlorophyll a fluorescence assessment, with identical sampling order and replication (n = 10 per species per sampling date), to ensure comparable environmental conditions. Recordings were made under PAR of 1000 μmol m−2s−1, while humidity, temperature, and CO2 concentration varied according to the ambient conditions of the study site [52,53]. Derived foliar gas exchange indices were calculated as follows: water use efficiency (WUE, μmol mmol−1) as A/E [54], intrinsic water use efficiency (WUEi, μmol mol−1) as A/gs [55], CO2 use efficiency (CUE) as A/Ci [56], and light use efficiency (LUE) as A/PAR [57].
2.5. Leaf Structural Traits
Simultaneously with the evaluation of leaf physiological status in situ in September, the same leaves were used for the characterization of leaf structural traits. These traits were assessed following the “leaf epidermal impression” method described by Pathoumthong et al. [58], which involved applying a thin coat of clear nail polish evenly to the abaxial surface of each leaf between 09:00 and 11:00 h (Central European Time), covering approximately 30 mm in length and 9 mm in width. All imprints were taken from the middle part of the leaf to minimize possible variation between the leaf base and tip [59]. After application, the nail polish was left to dry at room temperature for approximately 5 min. Once dry, a piece of clear adhesive tape was applied to the nail polish and placed on a microscope slide. The stomatal traits of the leaves were visualized using a scanning electron microscope, Olympus BX 53F (Tokyo, Japan), to assess stomatal density per mm2 (SD), stomatal guard cell length (LA, μm2), and width (WB, μm2). Stomatal dimensions (LA and WB) were quantified by measuring five stomata per five randomly chosen visual areas. SD was manually counted using the freeware software tpsDIG2 (Version 2.0, New York, NY, USA).
After field measurements, the analyzed leaves were transferred to the laboratory for the determination of leaf area (LA) using a leaf area meter (ADC Bioscientific AM 300-002) and dry weight (DW) after oven-drying at 70 °C for 48 h in a Memmert oven (UNB 400, Germany). Leaf mass area (LMA, cm2 mg−1) was calculated as the ratio of LA to DW (cm2 mg−1).
2.6. Data Analysis
All obtained data were processed using the statistical program OriginPro 2024 (version 10.1, Northampton, MA, USA). To estimate the effects of species and measurement period on the studied physiological traits, a two-way analysis of variance (ANOVA) was performed. Significant differences were considered at p < 0.01. The model included species and measurement period as fixed factors, while individual trees were treated as a random factor, since the selection of trees within each species was randomized [60]. Significant differences between the means were evaluated using Tukey’s honestly significant difference (HSD) test with p ≤ 0.05. Before statistical analysis, all data were tested for normality using the Shapiro–Wilk test and for homogeneity of variances using the Bartlett test [61]. Furthermore, one-way ANOVA was used to estimate the effect of species (Q. robur, C. betulus) on leaf structural traits. Rapid light curves (RLCs) of chlorophyll a fluorescence were analyzed by fitting a nonlinear curve using the Nonlinear Curve Fit function. Both 95% confidence and prediction bands were generated to assess the reliability of the fitted curves.
3. Results
3.1. Dynamics of Chlorophyll a Fluorescence During and After Drought
The evaluated chlorophyll a fluorescence indices significantly differed between the measurement dates (June–September) throughout this study (Table 1). Additionally, most indices differed considerably between the studied urban roadside tree species (Y(II), Y(NPQ), qL, qN, NPQ, and ETR), except for Y(NO) and qP. On the other hand, the combined effect of (S × D) was less pronounced, exhibiting a significant effect only on Y(II), qL, and ETR.

Table 1.
Two-way analysis of variance showing the effect of species (S), date of measurement (D), and their interaction (S × D) on chlorophyll a fluorescence indices in Q. robur and C. betulus.
Assessing the RLC of the Y(II) revealed a decreasing trend with increasing photosynthetically active radiation (Figure 3a–d). Observed on the species level, Q. robur maintained a higher proportion of Y(II) across all assessed light intensities and throughout the monitored growing season of 2019 compared with C. betulus. In addition, species-specific differences were also observed in the seasonal response, with Q. robur showing a more pronounced decrease in Y(II) from June to August, followed by a recovery of values in September. On the other hand, C. betulus maintained constantly low values and showed a declining trend continuing into September.
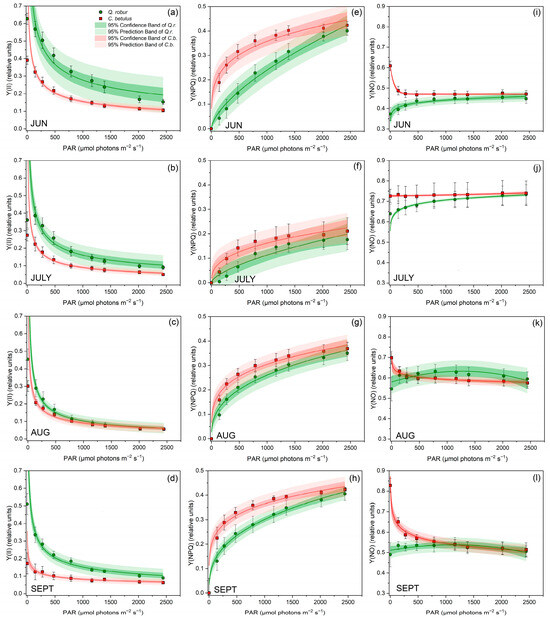
Figure 3.
RLCs for three complementary quantum yields describing the full partitioning of absorbed excitation energy in PSII in leaves of the two investigated urban roadside tree species (Q. robur and C. betulus) during the growing season of 2019 (June–September). (a–d) effective photochemical quantum yield of PSII (Y(II), relative units); (e–h) quantum yield of light-induced non-photochemical fluorescence quenching (Y(NPQ), relative units); (i–l) quantum yield of non-regulated heat dissipation and fluorescence emission (Y(NO), relative units). The data are presented as mean ± SE (n = 10).
Y(NPQ) values increased along the RLC with increasing light intensities (Figure 3e–h). Species-wise, C. betulus exhibited higher Y(NPQ) values in all assessed light intensities and throughout the monitored months compared with Q. robur. In terms of seasonal dynamics, a pronounced decrease was evident from June to July, followed by a partial recovery in August and September in both species.
Regarding Y(NO) values, a pronounced initial decrease was generally evident at low assessed PAR, followed by a prolonged saturation period at moderate to high PAR values (Figure 3i–l). At the species level, C. betulus generally showed slightly higher values of this index. Concerning seasonal variation, an overall increase in Y(NO) was evident from June to July, which then decreased afterwards.
Furthermore, RLCs showed a gradual decrease in qP and qL and an increase in qP along increasing actinic irradiance intensities (Figure 4). A similar trend and ranking of species were evidenced for qP and qL in both urban roadside trees during all measurement periods (Figure 4a–d and Figure 4e–h). Species-wise, C. betulus exhibited generally superior values to Q. robur for most of the monitored period. Seasonal patterns of RLCs of qP and qL showed a declining trend from June to August, followed by a recovery of values in September. Furthermore, qN was consistently higher in C. betulus throughout the whole growing season compared with Q. robur. The pattern of qP showed a decline from June to July and a gradual increase in the following months (Figure 4i–l).
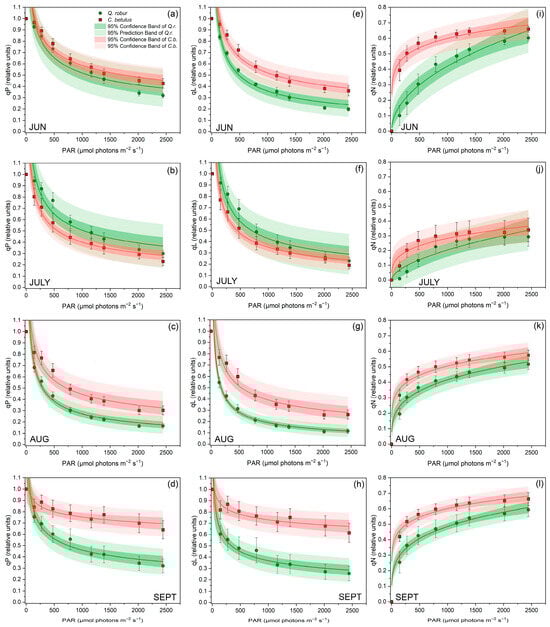
Figure 4.
RLCs for chlorophyll fluorescence quenching parameters in leaves of the two investigated urban roadside tree species (Q. robur and C. betulus) during the growing season of 2019 (June–September). (a–d) coefficient of photochemical quenching (qP, relative units); (e–h) coefficient of photochemical quenching assuming interconnected PSII antennae (qL, relative units); (i–l) coefficient of non-photochemical quenching (qN, relative units). The data are presented as mean ± SE (n = 10).
With the intensification of PAR, both NPQ and ETR gradually increased in both studied species throughout the whole monitoring period (Figure 5). On the species level, C. betulus was characterized by higher NPQ and lower ETR for the growing season of 2019. Observing the seasonal pattern, NPQ declined from June to July and gradually increased from July to September (Figure 5a–d). Furthermore, a decrease was observed in ETR under increasing drought stress until August, followed by a partial recovery in September (Figure 5e,f).
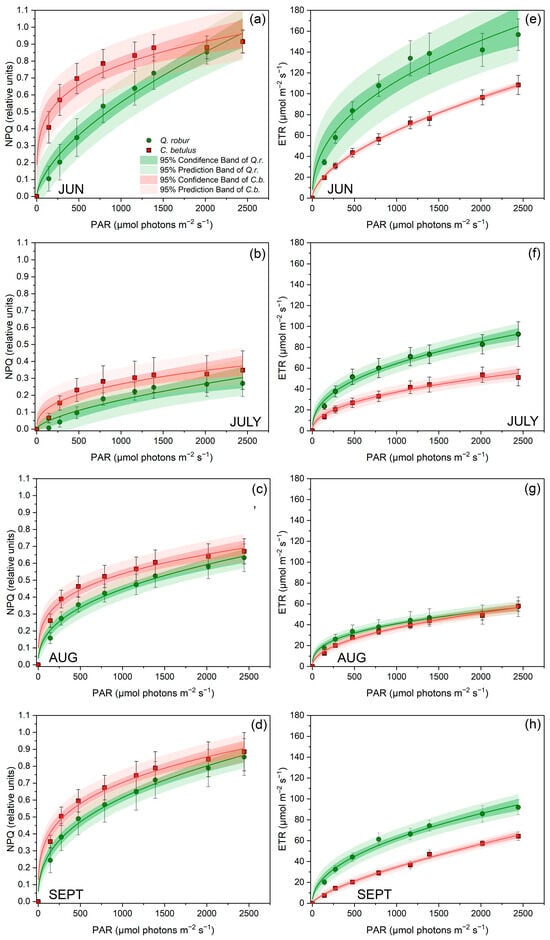
Figure 5.
RLCs for NPQ and ETR in leaves of the two investigated urban roadside tree species (Q. robur and C. betulus) during the growing season of 2019 (June–September). (a–d) Stern–Volmer-type non-photochemical fluorescence quenching (NPQ, relative units); (e–h) electron transfer rate (ETR, μmol m−2 s−1). The data are presented as mean ± SE (n = 10).
To quantify and compare the chlorophyll fluorescence indices, the values were obtained from the RLCs at medium light intensity (light intensity at PAR 788 μmol m−2 s−1). In terms of chlorophyll a fluorescence characterization, Y(II) was higher in Q. robur throughout all measurement periods compared to C. betulus (Figure 6a). In Q. robur, the dynamics of Y(II) followed a V-shaped pattern, with the greatest values in June, followed by a reduction from June to August and a partial recovery in September. In contrast, Y(II) in C. betulus decreased over the season. qP and qL followed a similar pattern in terms of ranking of species and measurement periods, decreasing from June to July on the onset of stress and then increasing in September until the initial values in June (in Q. robur) and even exceeding it (in C. betulus) (Figure 6b,c). ETR values had corresponding dynamics to the values of Y(II) (Figure 6d).
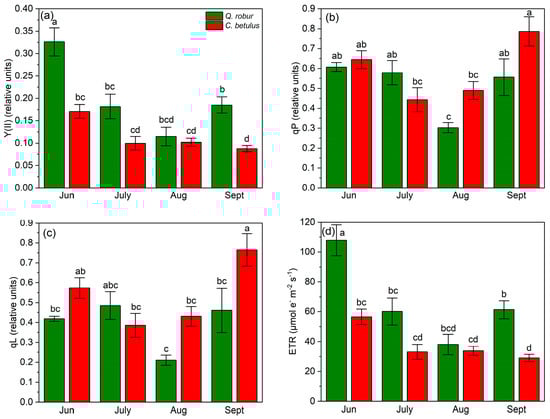
Figure 6.
Chlorophyll fluorescence photochemical indices in the two examined species (Q. robur, C. betulus) measured under 788 μmol m−2 s−1. (a) effective photochemical quantum yield of PSII (Y(II), relative units); (b) coefficient of photochemical quenching (qP, relative units); (c) coefficient of photochemical quenching assuming interconnected PSII antennae (qL, relative units); (d) electron transfer rate (ETR, μmol m−2 s−1). The data are presented as mean ± SE (n = 10). Different letters indicate significant variations (p ≤ 0.05) between values according to Tukey’s HSD test.
In terms of Y(NPQ), a decrease–increase dynamic of indices was observed, with a reduction in values from June to July, followed by an increase from July to September. On the species level, Q. robur exhibited higher values of this index during the monitored growing season of 2019 compared with C. betulus (Figure 7a). Y(NO) followed an inverted V-shaped pattern, with low initial values in June, a peak in July, and a decrease from July to September in both species (Figure 7b). At the species level, Y(NO) values were generally higher in C. betulus, in contrast to Q. robur. In contrast to Y(NO), qN exhibited a V-shaped pattern in both species, with initial high values in June, a plateau in July, and a recovery in September. Species-wise, C. betulus consistently exhibited higher qN values compared to Q. robur (Figure 7c). Regarding NPQ, similar patterns were observed across species and measurement periods, in accordance with Y(NPQ) and qN (Figure 7d).
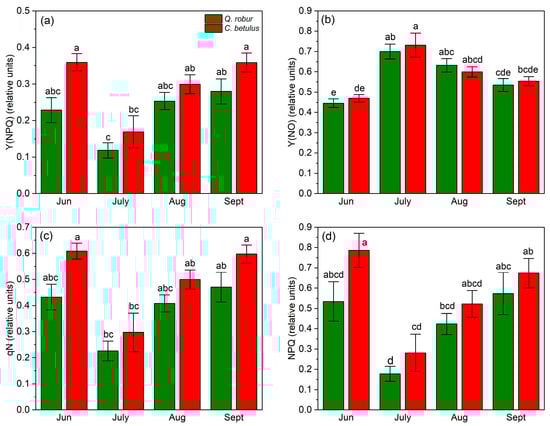
Figure 7.
Chlorophyll fluorescence non-photochemical indices in the two examined species (Q. robur, C. betulus) measured under 788 μmol m−2 s−1. (a) quantum yield of light-induced non-photochemical fluorescence quenching (Y(NPQ), relative units); (b) quantum yield of non-regulated heat dissipation and fluorescence emission (Y(NO), relative units); (c) coefficient of non-photochemical quenching (qN, relative units); (d) Stern–Volmer-type non-photochemical fluorescence quenching (NPQ, relative units). The data are presented as mean ± SE (n = 10). Different letters indicate significant variations (p ≤ 0.05) between values according to Tukey’s HSD test.
3.2. Dynamics of Foliar Gas Exchange Indices During and After Drought
The results of a two-way ANOVA (Table 2) revealed that most leaf gas exchange indices (A, E, gs, Ci, WUE, WUEi, CUE, LUE) varied significantly between measurement dates (June–September) and across the two studied tree species, except for WUE and Tleaf, which did not differ between the species. In contrast, the combined effect of species and date (S × D) was only for A, WUE, CUE, and LUE.
Table 2.
Two-way analyses of variance showing the effects of species (S), date of measurement (D), and their interaction (S × D) on foliar gas exchange indices in Q. robur and C. betulus.
Observing the dynamics in A, Q. robur was able to maintain higher rates throughout all measurement periods (June–September) (Figure 8a) compared to C. betulus. Q. robur showed stable values of A from June to July, a decline in August, and a recovery to the initial values in September. In C. betulus, the values of A reached a plateau in July and then gradually increased in August and September. In addition, E rates were also higher in Q. robur, in comparison with C. betulus, during the growing season of 2019 (Figure 8b). In Q. robur, E followed a V-shaped trend, having the highest value in June, strongly diminishing in July, and gradually recovering in August and September. C. betulus followed a comparable trend to Q. robur in terms of E, but its recovery values remained below the initial values in June. Concerning gs, Q. robur exhibited stable and high rates throughout the whole study, in contrast to C. betulus, which remained consistently lower (Figure 8c). For Ci, both observed species exhibited the lowest initial values in June, followed by an increase in July, peak values in August, and a decline in September (Figure 8d). Tleaf remained relatively stable throughout the monitored period, with significantly higher values recorded in August, showing a very similar seasonal pattern in both species (Figure 8e).
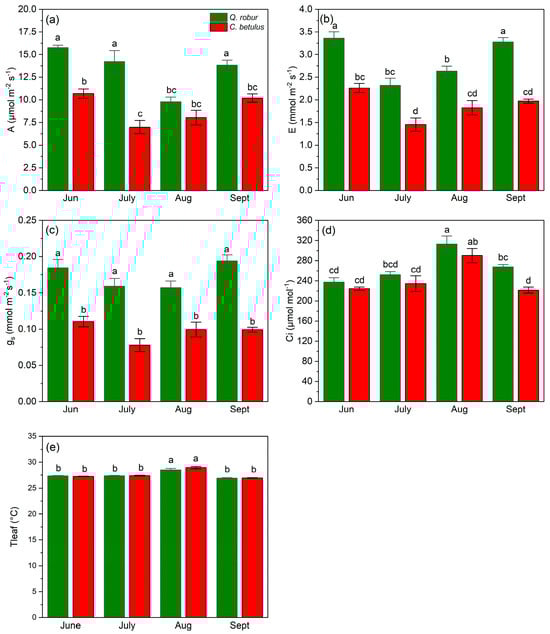
Figure 8.
Leaf gas exchange indices and leaf temperature in the two examined taxa (Q. robur, C. betulus). (a) net photosynthesis (A, μmol m−2 s−1); (b) transpiration (E, mmol m−2 s−1); (c) stomatal conductance (gs, mmol m−2 s−1); (d) intercellular CO2 concentration (Ci, μmol mol−1); (e) leaf temperature (Tleaf, °C). The data are presented as mean ± SE (n = 10). Different letters indicate significant variations (p ≤ 0.05) between values according to Tukey’s HSD test.
Both species exhibited a fluctuating pattern in WUE, with high values in June, a decline that reached a plateau in August, followed by a recovery in September (Figure 9a). Species-wise, C. betulus had higher values of WUE as opposed to Q. robur during all measurements, except in July. In the case of WUEi, the species exhibited a V-shaped pattern, with C. betulus having constantly higher values compared to Q. robur (Figure 9b). In addition, differences were observed in the restoration values, with C. betulus achieving a full recovery of WUEi, whereas Q. robur was unable to obtain the initial values. Both CUE and LUE exhibited a comparable pattern to A, having a similar species order throughout the growing season of 2019 (Figure 9c,d).
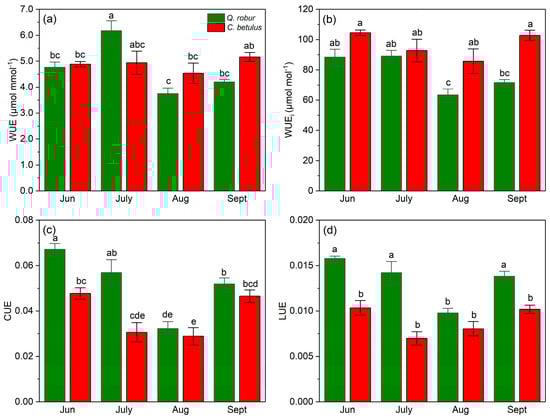
Figure 9.
Resource use efficiency indices in the two examined taxa (Q. robur, C. betulus). (a) water-use efficiency (WUE, μmol mmol−1); (b) intrinsic water-use efficiency (WUEi, μmol mol−1); (c) CO2 use efficiency (CUE, mol m−2 s−1); (d) light-use efficiency (LUE, μmol CO2 mol−1 photons). The data are presented as mean ± SE (n = 10). Different letters indicate significant variations (p ≤ 0.05) between values according to Tukey’s HSD test.
3.3. Leaf Structural Indices After Drought
All studied leaf structural traits (SD, LA, WB, LMA) were found to differ significantly between the two observed species (Q. robur, C. betulus), with SD showing the greatest impact (F = 71.857, p < 0.001), followed by LMA (F = 9.953, p < 0.01), WB (F = 6.297, p < 0.05), and LA (F = 5.067, p < 0.05), which exhibited the smallest effect (Table 3).
Table 3.
One-way analysis of variance showing the effect of species (S) on the studied leaf structural traits.
Regarding stomatal indices, we observed interspecific differences between the studied tree species, with C. betulus having notably higher values of SD (Figure 10a) along with lower values of stomatal size, i.e., LA and WB (Figure 10b,c), compared to Q. robur. In the case of LMA, C. betulus was found to have significantly higher values (Figure 10d) compared to Q. robur.
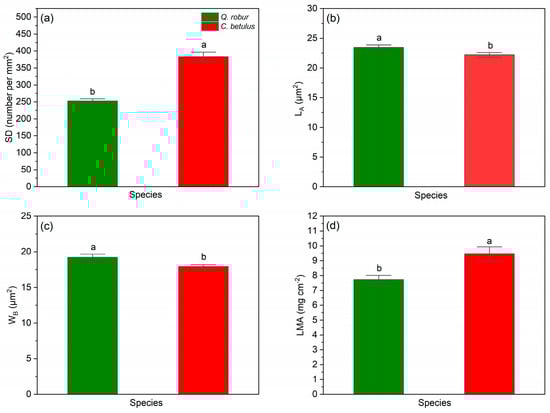
Figure 10.
Leaf structural indices in the two examined taxa (Q. robur, C. betulus). (a) stomatal density per mm2 (SD, number per mm−2); (b) stomatal guard cell length (LA, μm2); (c) stomatal guard cell width (WB, μm2); (d) leaf mass per area (LMA, mg cm−2). The data are presented as mean ± SE (n = 10). Different letters indicate significant variations (p ≤ 0.05) between values according to Tukey’s HSD test.
4. Discussion
4.1. Response of Chlorophyll a Fluorescence Indices During Drought Stress and Subsequent Recovery
Under exposure to water scarcity and high-intensity irradiance, commonly encountered in urban environments [1,62], plants tend to absorb excessive energy beyond their capacity for effective utilization in photochemistry [63,64]. Under such suboptimal conditions, the excess energy can trigger an upregulation in the production of reactive oxygen species (ROS), potentially impairing PSII reaction centers and leading to photoinhibition [65,66]. To protect their photosynthetic apparatus, plants deploy a variety of photoprotective mechanisms, including ROS scavenging, non-photochemical quenching (NPQ), and the repair of D1 proteins [67,68,69]. Among these, NPQ is the fastest, most reversible, and most efficient response of the photosynthetic membrane to excess light. By dissipating excess energy, NPQ prevents the formation of ROS, such as singlet oxygen (1O2) and superoxide (H2O2), in PSII. However, it is also acknowledged to negatively affect Y(II) and ETR [70,71].
At the beginning of the experiment, both species exhibited high values of NPQ and Y(NPQ). This finding suggests that the plants were effectively dissipating excess light energy to protect their photosynthetic machinery via regulated non-photochemical processes. Similar patterns under mild drought stress have been previously reported [72,73,74]. However, as drought intensified from June to July, NPQ and Y(NPQ) decreased, suggesting reduced capacity for regulated energy dissipation and increased risk of photodamage [75,76,77,78,79]. This decline may result from limitations in the transthylakoid proton gradient, impaired NADPH/ATP balance, or partial photodamage that reduces thermal energy dissipation [75,80,81,82]. Simultaneously, under water scarcity, a shift in energy portioning was observed, reflected in upregulation of Y(NO) and a downward tendency in Y(NPQ) and Y(II). This pattern indicates impaired photochemical efficiency and insufficient energy dissipation, elevating excitation pressure on PSII and the risk of ROS formation, as reported in previous studies under severe drought stress [83,84,85,86,87,88,89]. In addition, the reduction in Y(II) and ETR closely followed the pattern of soil moisture content, highlighting the strong dependence of PSII functionality on water availability. These findings are in line with previous studies evidencing that, by modulating stomatal conductance, carbon fixation, and thylakoid proton dynamics, water availability strongly influences the partitioning of absorbed light energy by altering the distribution among photochemistry (Y(II)), regulated energy dissipation (Y(NPQ)), and non-regulated energy loss (Y(NO)) [87,88,89]. In terms of chlorophyll fluorescence quenching indices, qP and qL decreased from June to August. These findings suggest a reduction in the openness of PSII reaction centers, reducing light energy utilization and indicating a decline in potential photochemical efficiency under water scarcity conditions [90,91,92]. In line with previous studies, these results evidence that drought stress impairs both photochemical and non-photochemical quenching, highlighting the sensitivity of PSII to water unavailability [93,94,95].
Following the drought stress, both species increased Y(NPQ), Y(II), ETR, qP, qN, and qL and decreased Y(NO). Y(NPQ), Y(NO), qP, qN and qL returned close to pre-stress levels by September, while Y(II) and ETR recovered more slowly, especially in C. betulus (showing a further declining trend). These findings might indicate the persistence of post-stress effects, evidencing a lower post-stress recovery capacity of the photosynthetic apparatus in C. betulus compared to Q. robur [96,97,98,99].
At the species level, fluorescence indices revealed distinctive behavioral patterns in response to drought. In more detail, C. betulus exhibited higher NPQ values accompanied by lower Y(II), whereas Q. robur exhibited the opposite pattern, with low NPQ and high Y(II). This pattern reflects a trade-off between photoprotection and productivity. C. betulus exhibited greater energy dissipation to prevent photodamage compared to Q. robur. On the other hand, Q. robur exhibited better maintenance of A than C. betulus under drought stress. The higher Y(II) observed in Q. robur throughout the monitored period may result from its anisohydric behavior, with less tight stomatal control, allowing higher A [31,32,100], as well as from leaf structural traits, as thinner leaves with less dense mesophyll support higher CO2 availability and light use efficiency [101,102]. On the other hand, the enhanced NPQ, as observed in C. betulus, is in line with the conservative strategy, enhancing protective mechanisms by allocating energy toward stress tolerance and supporting survival over growth.
Overall, our results indicate that Q. robur is highly susceptible to drought in an urban environment, while C. betulus demonstrated notable drought tolerance and resilience. In line with our findings, Q. robur was identified as vulnerable to drought stress in an urban area due to reduced efficiency in safely dissipating light energy and leaf structural traits [103]. In contrast, C. betulus was highlighted as a drought-resistant species, relying on the stress-tolerant strategy, characterized by slower growth, and was proposed for planting at the edges of habitat corridors [103].
4.2. Response of Leaf Gas Exchange Indices During Drought Stress and Subsequent Recovery
In the present study, C. betulus exhibited increased stomatal sensitivity to urban environmental conditions, as reflected in consistently lower gs values during the monitored period compared to Q. robur. This could be attributed to the effect of the native habitat characteristics of the studied species [104,105,106], as C. betulus originates from a relatively drier environment [40] than Q. robur, which is associated with mesic to wet regions [39]. This finding supports evidence for a genetically inherited species-specific drought-survival strategy, in line with previous studies, suggesting that species inhabiting arid environments have greater resistance to embolism and potential to persist in changing urban settings [18,35,107,108]. This resilience likely results from the selection pressure encountered in their native habitat, which has resulted in the development of diverse plant strategies and traits that enhance survival under challenging urban conditions [109,110].
Two contrasting drought-induced stomatal regulatory strategies were observed in the studied species: C. betulus prioritized water conservation over carbon assimilation, whereas Q. robur was characterized by a strategy that prioritizes enhanced carbon gain benefits. The first strategy is more conservative and favorable in drought-prone environments, while the second one is susceptible to increasing risk for water stress, dehydration, and even mortality [111,112], which are predicted to exacerbate in urban areas under the forthcoming climate change scenarios. Considering that, by 2050, up to 40% of urban tree species could be at risk [8], future landscaping undertakings should consider species-specific water-use strategies [113]. In light of this, Stojnić et al. 2016 [114] showed that an irrigation system can enhance growth and fitness and might contribute to multiple ecosystem services [115]. Regarding A, Q. robur was able to maintain higher rates compared to C. betulus, likely due to its tall stature, large crown, and light-demanding ecology [37,116]. Monthly patterns in A and gs of Q. robur closely followed soil moisture content throughout the monitored period, reflecting that water limitation was essential for understanding gas exchange dynamics. Evidenced by a higher decrease in A than in gs and supported by an increase in Ci, biochemical demand for CO2 affected the dynamic photosynthetic performance in both studied species under drought stress. Previous studies have indicated that, under water scarcity of mild-to-moderate intensity, the reduction in A presumably results from limited CO2 diffusion, including changes in both stomatal and mesophyll resistance [117,118,119,120,121,122]. In line with our findings, with the intensification of drought, the downward tendency in A generally shifts from being primarily limited by internal CO2 diffusion to predominantly biochemical limitation, involving the decrease in Rubisco activity, CO2 availability in the chloroplast, and PSII photochemistry efficiency [123].
Furthermore, the studied species showed an asynchronous response to drought stress, indicating substantial interspecific variation in the timing of this response [124]. C. betulus exhibited a downregulation of A from June to July, whereas Q. robur showed a delayed reduction from July to August. In addition, the decline in A differed in magnitude between the two studied species. Q. robur maintained prolonged A and E, while C. betulus exhibited lower A, accompanied by a reduced cooling ability. This likely resulted from the poor stomatal adjustment capacity of Q. robur even under the pronounced soil water deficit in August, showing a more anisohydric behavior in terms of water-relations strategy [125,126,127]. In contrast, C. betulus exhibited tight stomatal regulation due to the higher sensitivity of its guard cells to a critical leaf water potential threshold [31,128], evidencing conservative water-balance management typical of isohydric species.
An enhanced sensitivity in WUEi of Q. robur versus C. betulus was observed throughout this study, also influenced by species-specific stomatal behavior and drought-response strategy [129,130]. As Q. robur showed weaker stomatal control under drought stress, this led to a stronger decline in A relative to gₛ, evident in a greater decline in WUEi [131]. In contrast, the tighter stomatal regulation in C. betulus ensured that reductions in A were synchronized with decreases in gₛ, thereby maintaining more stable WUEi values. Under water scarcity, this behavior reflects an adaptive advantage, particularly relevant in the context of current climate pressures [132]. Our finding indicates that WUEi is more sensitive to environmental changes in isohydric than in anisohydric species and increases significantly during prolonged periods of water stress [133,134].
CUE reduction was evident from the onset of drought to the peak of summer in both species, with Q. robur having higher values than C. betulus. These findings suggest an increasing biochemical constraint on A as water scarcity progressed [69,121]. At the species level, it suggests a greater capacity to sustain internal CO2 utilization, potentially reflecting higher carboxylation efficiency and continuous electron transport in Q. robur [135,136] compared to C. betulus.
Similarly, Q. robur exhibited higher LUE compared to C. betulus throughout the studied period. Higher LUE in Q. robur may be attributed to its ability to maintain higher A under water-limited conditions, resulting from weaker stomatal responses and delayed biochemical downregulation, thereby enhancing the utilization of absorbed light energy for carbon fixation [137,138]. These findings align with previous observations for light-demanding species to perform better in high-light environments [139,140], whereas shade-tolerant species prioritize structural traits, enabling more efficient light capture even under drought conditions [141]. Specifically, a similar pattern has been observed in shade-intolerant Quercus species, such as Q. mongolica, which show an enhanced capacity to absorb and efficiently utilize light [142] compared with Acer mono Maxim., a shade-tolerant species.
After drought stress, Q. robur was more effective in recovering A, E, gs, WUE, and LUE to pre-stress levels than C. betulus. This could be associated with the ecophysiology of this species, which prioritizes post-drought recovery over conservative drought resistance, as evident for C. betulus. Previous studies underline this finding regarding the high recovery potential through physiological adjustment after drought, including Q. suber and Q. ilex [143] and Q. pubescens [144].
From a practical point of view, the conservative water-use strategy of C. betulus makes it more suitable for planting in highly exposed urban environments, including streets with limited soil volume, high surface sealing, and restricted irrigation. On the other hand, although Q. robur provides greater cooling potential and carbon sequestration due to its higher A and larger crown, its successful establishment in urban areas may depend on adequate soil moisture availability and additional irrigation, particularly during prolonged drought periods.
4.3. Response of Leaf Structural Traits to Drought Stress
In our study, Q. robur exhibited higher gas exchange rates and lower LMA values, while C. betulus showed lower A coupled with higher LMA. These results indicate that Q. robur reflects a resource-acquisitive strategy characterized by rapid returns on leaf construction costs, whereas C. betulus exhibits a more conservative leaf economic strategy associated with slower returns on investment [145,146]. Consistent with our findings, several studies reported that urban trees deploy a variety of foliar strategies along the leaf economic spectrum in response to environmental constraints, intending to optimize nutrient and water usage and growth rate under varying urban conditions [25,147]. Specifically, conservative strategies are favored under resource-limited urbanized landscapes [148,149], while rapid-return strategies are advantageous for urban green spaces with optimal water supply [148,150].
The results of the present study evidenced lower LMA values in Q. robur compared to C. betulus. This finding reflects that the thinner leaves in Q. robur compared to C. betulus enhance rapid light absorption and fast growth under high-light conditions [146,150,151]. In alignment with our results, a study evaluating urban tree performance across seven cities worldwide reported that, among the most frequently encountered urban tree species, Q. robur was one of the most sensitive to drought, showing the strongest negative growth responses [34]. In addition, previous studies indicated that shade-intolerant species are commonly characterized by thinner leaves. This leaf morphology enhances assimilation efficiency by increasing the absorptive surface per unit of tissue biomass, overall supporting higher photosynthetic performance [28,152]. However, as a disadvantage, under light regimes frequently encountered in urban settlements, leaves with these traits are presumed to be more susceptible to photodamage or overheating. This occurs as thinner leaves with reduced mesophyll density provide less photoprotective structural protection against excess radiation and could potentially lead to higher rates of photoinhibition [153].
LMA was higher in the species from a drier environment, i.e., C. betulus, compared with the species from a wetter site, i.e., Q. robur. These results align with previous studies reporting increased leaf thickness and tissue density in species from arid habitats, which enhance drought resistance and tolerance to high irradiance [28,154,155,156]. In particular, in a comparative study of Quercus castaneifolia and Carpinus betulus, higher SLA (inverse to LMA) was observed in C. betulus compared with Q. castaneifolia (a close relative of Q. robur), indicating species-specific differences in leaf structural traits linked to their differing ecological strategies [157].
C. betulus had higher SD coupled with lower stomata size (i.e., LA and WB), whereas Q. robur exhibited the opposite pattern for these traits. These differences suggest that C. betulus is more rapidly able to respond to environmental stimuli, which can enhance WUE by maintaining A while limiting water loss through E [158], compared to Q. robur. In line with our findings, trees experiencing drought stress were confirmed to adjust to such conditions through leaf structural alterations, including changes in LA, WB and SD [159,160]. These changes involved developmental and signaling pathways where high VPD and low soil water content triggered stomatal closure and prolonged stress altered leaf morphology during leaf [161,162]. A substantial number of studies have confirmed that species considered better adapted to low water availability exhibit traits such as high LMA and SD and low values of LA and WB [163,164,165].
Overall, based on leaf structural traits, the combination of high LMA and denser, smaller stomata suggests that C. betulus is better adapted to drier urban environments, whereas low LMA and lower SD of Q. robur make it more suitable for urban sites with higher soil moisture. These traits highlight the importance of species-specific strategies when planning urban tree plantings under heterogeneous water availability.
5. Conclusions
The comparison of Q. robur and C. betulus revealed distinct physiological responses in terms of photosynthetic leaf gas exchanges, chlorophyll a fluorescence, and leaf structural adaptations to drought stress conditions prevailing at the urban site in Novi Sad. Specifically, in terms of physiological adaptation, C. betulus exhibited effective stomatal responsiveness, enhanced water conservation capacity, and a greater allocation of energy to photoprotective mechanisms, characteristic of an isohydric water-use strategy. Conversely, in Q. robur, weaker stomatal control resulted in higher assimilation, improved energy absorption and electron transport efficiency on the one hand, and greater water loss and reduced photochemical protection on the other, which is typical of anisohydric species. In addition, concerning structural traits, C. betulus showed greater physiological resilience than Q. robur, reflecting characteristics that confer greater drought resistance, including smaller and densely arranged stomata and enhanced LMA.
Based upon these findings, C. betulus was highlighted as a more drought-tolerant species and a suitable candidate for low-water landscapes in comparison with Q. robur, which was ranked as a drought-susceptible species. These findings underscore the importance of aligning species selection according to their native habitat; taxa originating from dry sites should be prioritized for streets. This study was conducted across two tree species and a single growing season. For more relevant information, additional tree species, including native and non-native ones, should be incorporated and analyzed during consecutive growing seasons. In addition, future research should consider incorporating additional traits that might serve as early warning indicators of drought stress in trees.
Supplementary Materials
The following supporting information can be downloaded at: https://www.mdpi.com/article/10.3390/f17030339/s1, Figure S1: Mean air temperature (°C) and total precipitation (mm) recorded during the growing season of 2019 (from 1 May to 1 October) at the studied site. The dashed line indicates the dates of measurements; Figure S2: VPD (kPa) during the growing season of 2019 (from 1 May to 1 October) at the studied site. The dashed line indicates the dates of measurements; Table S1: Mean morphometrical characteristics and characteristics of drought tolerance of the two studied riparian tree species (Q. robur, C. betulus).
Author Contributions
S.S. and E.V. conceived the ideas and designed the experiment. E.V. performed the measurement of chlorophyll a fluorescence. L.K. performed the measurement of leaf gas exchange. V.K. performed the measurement of soil moisture content. E.V., L.K., M.I., V.V. and V.K. collected the samples of leaves for leaf structural traits analyses. S.S. and E.V. conducted the statistical analysis. E.V. and C.C. wrote the first version of the manuscript, while all of the authors contributed critically to the drafts and gave the final approval for publication. All authors have read and agreed to the published version of the manuscript.
Funding
This study was supported by the project: “Climate-SMART Forestry—a Near Real-Time Monitoring of Tree Vitality for Higher Decision Security in Managing and Protecting Riparian Forests (SmartTogether)” (Reg. No. 17278) funded by the Science Fund of the Republic of Serbia within DIASPORA 2023 programme.
Data Availability Statement
The data presented in this study are available from the corresponding author upon request.
Conflicts of Interest
The authors declare no conflicts of interest.
References
- Czaja, M.; Kołton, A.; Muras, P. The complex issue of urban trees—Stress factor accumulation and ecological service possibilities. Forests 2020, 11, 932. [Google Scholar] [CrossRef]
- Kostić, S.; Orlović, S.; Zorić, M.; Pekeč, S.; Rašeta, M.; Kovačević, B.; Kebert, M. Polychlorinated biphenyls (PCBs) accumulation in street urban soil in Novi Sad (Serbia). Topola 2025, 216, 17–25. [Google Scholar] [CrossRef]
- Edmondson, J.L.; Davies, Z.G.; McCormack, S.A.; Gaston, K.J.; Leake, J.R. Are soils in urban ecosystems compacted? A citywide analysis. Biol. Lett. 2011, 7, 771–774. [Google Scholar] [CrossRef]
- Moser, A.; Rötzer, T.; Pauleit, S.; Pretzsch, H. The urban environment can modify drought stress of small-leaved lime (Tilia cordata Mill.) and black locust (Robinia pseudoacacia L.). Forests 2016, 7, 71. [Google Scholar] [CrossRef]
- Dale, A.G.; Frank, S.D. Water availability determines tree growth and physiological response to biotic and abiotic stress in a temperate North American urban forest. Forests 2022, 13, 1012. [Google Scholar] [CrossRef]
- Atar, E.; Yücesan, Z.; Atar, F.; Üçler, A.Ö. Effect of Drought Stress on Physiological and Biochemical Traits of Quercus petraea subsp. iberica Seedlings and Analysis of the Relationship with Morphological Traits. Austrian J. For. Sci. 2024, 141, 81. [Google Scholar]
- Kluge, B.; Kirmaier, M. Urban trees left high and dry–Modelling urban trees water supply and evapotranspiration under drought. Environ. Res. Commun. 2024, 6, 115029. [Google Scholar]
- Esperon-Rodriguez, M.; Tjoelker, M.G.; Lenoir, J.; Baumgartner, J.B.; Beaumont, L.J.; Nipperess, D.A.; Power, S.A.; Richard, B.; Rymer, P.D.; Gallagher, R.V. Climate change increases global risk to urban forests. Nat. Clim. Change 2022, 12, 950–955. [Google Scholar] [CrossRef]
- Arsenov, D.; Borišev, M.; Nikolić, N.; Horak, R.; Pajević, S. Physiological and Biochemical Indicators of Urban Environmental Stress in Tilia, Celtis, and Platanus: A Functional Trait-Based Approach. Plants 2025, 14, 3451. [Google Scholar] [CrossRef]
- Višacki, V.; Turšijan, L.; Pavlović, L.; Stojnić, S.; Stojanović, D.B.; Kesić, L.; Orlović, S. Multispektralni UAV snimci za detekciju kvantitativnih parametara gradskih drvoreda. Topola 2025, 215, 17–29. [Google Scholar]
- Belford, E.J. Response of roadside tree leaves in a tropical city to automobile pollution. Not. Sci. Biol. 2020, 12, 752–768. [Google Scholar] [CrossRef]
- Singh, H.; Yadav, M.; Kumar, N.; Kumar, A.; Kumar, M. Assessing adaptation and mitigation potential of roadside trees under the influence of vehicular emissions: A case study of Grevillea robusta and Mangifera indica planted in an urban city of India. PLoS ONE 2020, 15, e0227380. [Google Scholar]
- Sand, E.; Kowarik, I. Effects of ground surface permeability on the growth of urban linden trees. Urban Ecosyst. 2018, 21, 691–696. [Google Scholar] [CrossRef]
- Konarska, J.; Tarvainen, L.; Bäcklin, O.; Räntfors, M.; Uddling, J. Surface paving more important than species in determining the physiology, growth and cooling effects of urban trees. Landsc. Urban Plan. 2023, 240, 104872. [Google Scholar] [CrossRef]
- Czerniawska-Kusza, I.; Kusza, G.; Dużyński, M. Effect of deicing salts on urban soils and health status of roadside trees in the Opole region. Environ. Toxicol. 2004, 19, 296–301. [Google Scholar] [CrossRef]
- Zhang, Y.; Li, F.Y.; Sun, T.T.; Wang, J.L. Effect of deicing salts on urban soils and the health of roadside pines (Pinus tabulaeformis) in Northeast China. Appl. Mech. Mater. 2012, 178, 353–356. [Google Scholar] [CrossRef]
- Raupp, M.J.; Cumming, A.B.; Raupp, E.C. Street tree diversity in eastern North America and its potential for tree loss to exotic borers. Arboric. Urban For. 2006, 32, 297–304. [Google Scholar] [CrossRef]
- Sjöman, H.; Östberg, J.; Bühler, O. Diversity and distribution of the urban tree population in ten major Nordic cities. Urban For. Urban Green. 2012, 11, 31–39. [Google Scholar] [CrossRef]
- Kendal, D.; Williams, K.J.; Williams, N.S. Plant traits link people’s plant preferences to the composition of their gardens. Landsc. Urban Plan. 2012, 105, 34–42. [Google Scholar]
- Brandt, L.A.; Johnson, G.R.; North, E.A.; Faje, J.; Rutledge, A. Vulnerability of street trees in upper Midwest cities to climate change. Front. Ecol. Evol. 2021, 9, 721831. [Google Scholar] [CrossRef]
- Pretzsch, H.; Biber, P.; Uhl, E.; Dahlhausen, J.; Schütze, G.; Perkins, D.; Lefer, B. Climate change accelerates growth of urban trees in metropolises worldwide. Sci. Rep. 2017, 7, 15403. [Google Scholar] [CrossRef]
- Wang, Y.; Xing, C.; Gu, Y.; Zhou, Y.; Song, J.; Zhou, Z.; Song, J.; Gao, J. Responses and Post-Recovery of Physiological Traits after Drought–Heatwave Combined Event in 12 Urban Woody Species. Forests 2023, 14, 1429. [Google Scholar] [CrossRef]
- Aranda, I.; Martin-Benito, D.; Sánchez-Gómez, D.; de Simón, B.F.; Gea-Izquierdo, G. Different drought-tolerance strategies of tree species to cope with increased water stress under climate change in a mixed forest. Physiol. Plant 2024, 176, e14562. [Google Scholar] [CrossRef]
- Ibsen, P.C.; Santiago, L.S.; Shiflett, S.A.; Chandler, M.; Jenerette, G.D. Irrigated urban trees exhibit greater functional trait plasticity compared to natural stands. Biol. Lett. 2023, 19, 20220448. [Google Scholar] [CrossRef]
- Cho, A.; Dziedzic, N.; Davis, A.; Hanson, C.; Lee, J.; Nunez-Mir, G.C.; Gonzalez-Meler, M.A. Leaf functional traits highlight phenotypic variation of two tree species in the urban environment. Front. Plant Sci. 2024, 15, 1450723. [Google Scholar] [CrossRef]
- Simovic, M.; Mueller, K.E.; McMahon, S.M.; Medeiros, J.S. Functional traits and size interact to influence growth and carbon sequestration among trees in urban greenspaces. Funct. Ecol. 2024, 38, 967–983. [Google Scholar] [CrossRef]
- Huang, S.; Knight, C.A.; Hoover, B.K.; Ritter, M. Leaf functional traits as predictors of drought tolerance in urban trees. Urban For. Urban Green. 2020, 48, 126577. [Google Scholar] [CrossRef]
- De La Riva, E.G.; Olmo, M.; Poorter, H.; Ubera, J.L.; Villar, R. Leaf mass per area (LMA) and its relationship with leaf structure and anatomy in 34 Mediterranean woody species along a water availability gradient. PLoS ONE 2016, 11, e0148788. [Google Scholar] [CrossRef]
- Haghpanah, M.; Hashemipetroudi, S.; Arzani, A.; Araniti, F. Drought tolerance in plants: Physiological and molecular responses. Plants 2024, 13, 2962. [Google Scholar] [CrossRef]
- Wang, J.; Renninger, H.J. Using leaf and stomatal traits to predict biomass production and water use efficiency in Populus. Plant J. 2025, 124, e70553. [Google Scholar] [CrossRef]
- Sade, N.; Gebremedhin, A.; Moshelion, M. Risk-taking plants: Anisohydric behavior as a stress-resistance trait. Plant Signal. Behav. 2012, 7, 767–770. [Google Scholar] [CrossRef]
- Attia, Z.; Domec, J.C.; Oren, R.; Way, D.A.; Moshelion, M. Growth and physiological responses of isohydric and anisohydric poplars to drought. J. Exp. Bot. 2015, 66, 4373–4381. [Google Scholar] [CrossRef]
- Luo, D.D.; Wang, C.K.; Jin, Y. Plant water-regulation strategies: Isohydric versus anisohydric behavior. Chin. J. Plant Ecol. 2017, 41, 1020–1032. [Google Scholar]
- Dervishi, V.; Poschenrieder, W.; Rötzer, T.; Moser-Reischl, A.; Pretzsch, H. Effects of climate and drought on stem diameter growth of urban tree species. Forests 2022, 13, 641. [Google Scholar] [CrossRef]
- Molina-Pardo, J.L.; Gimenez-Luque, E.; Gisbert-Gallego, J.; Guirado, E. Resistance of urban trees to drought shaped by family and site in a semi-arid city. Urban For. Urban Green. 2025, 114, 129167. [Google Scholar] [CrossRef]
- Martínez-Villa, J.A.; Paquette, A.; Feeley, K.J.; Morales-Morales, P.A.; Messier, C.; Durán, S.M. Changes in morphological and physiological traits of urban trees in response to elevated temperatures within an Urban Heat Island. Tree Physiol. 2024, 44, tpae145. [Google Scholar] [CrossRef]
- Masternak, K.; Łukasik, M.; Czyżowski, P.; Gmitrowicz-Iwan, J.; Kowalczyk, K. Influence of Location Type on the Regeneration and Growth of Pedunculate Oak (Quercus robur L.) in Central Europe: Implications for Sustainable Forest Land Use. Sustainability 2025, 17, 8011. [Google Scholar] [CrossRef]
- Szwagrzyk, J.; Szewczyk, J.; Maciejewski, Z. Shade-tolerant tree species from temperate forests differ in their competitive abilities: A case study from Roztocze, south-eastern Poland. For. Ecol. Manag. 2012, 282, 28–35. [Google Scholar]
- Greksa, A.; Ljevnaić-Mašić, B.; Grabić, J.; Benka, P.; Radonić, V.; Blagojević, B.; Sekulić, M. Potential of urban trees for mitigating heavy metal pollution in the city of Novi Sad, Serbia. Environ. Monit. Assess. 2019, 191, 636. [Google Scholar] [CrossRef]
- Čehulić, I.; Sever, K.; Katičić Bogdan, I.; Jazbec, A.; Škvorc, Ž.; Bogdan, S. Drought impact on leaf phenology and spring frost susceptibility in a Quercus robur L. provenance trial. Forests 2019, 10, 50. [Google Scholar] [CrossRef]
- Sokołowski, K.; Czerepko, J.; Gawryś, R. The effects of Carpinus betulus expansion on soil properties under changing climatic conditions. Sci. Rep. 2024, 14, 24662. [Google Scholar] [CrossRef]
- Zhou, Q.; Zhao, F.; Zhang, H.; Zhu, Z. Responses of the growth, photosynthetic characteristics, endogenous hormones and antioxidant activity of Carpinus betulus L. seedlings to different light intensities. Front. Plant Sci. 2022, 13, 1055984. [Google Scholar] [CrossRef]
- Eaton, E.G.S.D.J.; Caudullo, G.; Oliveira, S.; De Rigo, D. Quercus robur and Quercus petraea in Europe: Distribution, habitat, usage and threats. Eur. Atlas For. Tree Species 2016, 14, 160–163. [Google Scholar]
- Sikkema, R.; Caudullo, G.; De Rigo, D. Carpinus betulus in Europe: Distribution, habitat, usage and threats. Eur. Atlas For. Tree Species 2016, 2016, 73–75. [Google Scholar]
- Dobbertin, M. Tree growth as indicator of tree vitality and of tree reaction to environmental stress: A review. Eur. J. For. Res. 2005, 124, 319–333. [Google Scholar] [CrossRef]
- Xu, J.; Yao, M.; Chen, Y.; Jiang, L.; Xing, B.; Clarke, H. The range of projected change in vapour pressure deficit through 2100: A seasonal and regional analysis of the CMIP6 ensemble. Climate 2025, 13, 143. [Google Scholar] [CrossRef]
- Maxwell, K.; Johnson, G.N. Chlorophyll fluorescence—A practical guide. J. Exp. Bot. 2000, 51, 659–668. [Google Scholar] [CrossRef]
- Sepúlveda, P.; Johnstone, M.D. A novel way of assessing plant vitality in urban trees. Forests 2018, 10, 2. [Google Scholar] [CrossRef]
- Vastag, E.; Orlović, S.; Konôpková, A.; Kurjak, D.; Cocozza, C.; Pšidová, E.; Stojnić, S. Magnolia grandiflora L. shows better responses to drought than Magnolia× soulangeana in urban environment. i-Forest 2020, 13, 575–583. [Google Scholar] [CrossRef]
- Madrid, E.N.; Armitage, A.R.; Quigg, A. The response of photosystem II to soil salinity and nutrients in wetland plant species of the northwestern Gulf of Mexico. J. Coast. Res. 2012, 28, 1197–1207. [Google Scholar] [CrossRef]
- Baker, N.R. Chlorophyll fluorescence: A probe of photosynthesis in vivo. Annu. Rev. Plant Biol. 2008, 59, 89–113. [Google Scholar] [CrossRef]
- Kesić, L.; Čater, M.; Orlović, S.; Matović, B.; Stojanović, M.; Bojović, M. Proximity to riverbed influences physiological response of adult pedunculate oak trees. Topola 2023, 211, 21–28. [Google Scholar] [CrossRef]
- Kesić, L.; Kovačević, B.; Milović, M.; Poljaković-Pajnik, L.; Pekeč, S.; Višacki, V.; Orlović, S. Physiological responses of poplar and willow clones grown in pot trials on soil from landfills. Topola 2024, 82, 55–63. [Google Scholar] [CrossRef]
- Farquhar, G.D.; Sharkey, T.D. Stomatal conductance and photosynthesis. Annu. Rev. Plant Physiol. 1982, 33, 317–345. [Google Scholar] [CrossRef]
- Flexas, J.; Niinemets, Ü.; Gallé, A.; Barbour, M.M.; Centritto, M.; Diaz-Espejo, A.; Douthe, C.; Galmés, J.; Ribas-Cabo, M.; Rodriguez, P.L.; et al. Diffusional conductances to CO2 as a target for increasing photosynthesis and photosynthetic water-use efficiency. Photosynth. Res. 2013, 117, 45–59. [Google Scholar] [CrossRef] [PubMed]
- He, W.M.; Ma, F.Y. Effects of water gradient on fluorescence characteristics and gas exchange in Sabina vulgaris seedlings. Chin. J. Plant Ecol. 2000, 24, 630. [Google Scholar]
- Yan, H.L.; Zhang, X.M.; Xu, H.; Liu, Y. Photosynthetic characteristics responses of three plants to drought stress in Tarim Desert Highway shelterbelt. Acta Ecol. Sin. 2010, 30, 2519–2528. [Google Scholar]
- Pathoumthong, P.; Zhang, Z.; Roy, S.J.; El Habti, A. Rapid non-destructive method to phenotype stomatal traits. Plant Methods 2023, 19, 36. [Google Scholar] [CrossRef]
- Bresson, C.C.; Vitasse, Y.; Kremer, A.; Delzon, S. To what extent is altitudinal variation of functional traits driven by genetic adaptation in European oak and beech? Tree Physiol. 2011, 31, 1164–1174. [Google Scholar] [CrossRef]
- Batos, B.; Vilotić, D.; Orlović, S.; Miljković, D. Inter and intra-population variation of leaf stomatal traits of Quercus robur L. in northern Serbia. Arch. Biol. Sci. 2010, 62, 1125–1136. [Google Scholar] [CrossRef]
- Rose, L.; Leuschner, C.; Köckemann, B.; Buschmann, H. Are marginal beech (Fagus sylvatica L.) provenances a source for drought tolerant ecotypes? Eur. J. For. Res. 2009, 128, 335–343. [Google Scholar] [CrossRef]
- Stratópoulos, L.M.F.; Zhang, C.; Duthweiler, S.; Häberle, K.H.; Rötzer, T.; Xu, C.; Pauleit, S. Tree species from two contrasting habitats for use in harsh urban environments respond differently to extreme drought. Int. J. Biometeorol. 2019, 63, 197–208. [Google Scholar] [CrossRef]
- Griffiths, H.; Parry, M.A.J. Plant responses to water stress. Ann. Bot. 2002, 89, 801–802. [Google Scholar] [CrossRef] [PubMed]
- Krzyżak, J.; Rusinowski, S.; Sitko, K.; Szada-Borzyszkowska, A.; Borgulat, J.; Stec, R.; Hanslin, H.M.; Pogrzeba, M. The effect of combined drought and temperature stress on the physiological status of calcareous grassland species as potential candidates for urban green infrastructure. Plants 2023, 12, 2003. [Google Scholar] [CrossRef]
- Kromdijk, J.; Głowacka, K.; Leonelli, L.; Gabilly, S.T.; Iwai, M.; Niyogi, K.K.; Long, S.P. Improving photosynthesis and crop productivity by accelerating recovery from photoprotection. Science 2016, 354, 857–861. [Google Scholar] [CrossRef]
- Ruban, A.V. Nonphotochemical chlorophyll fluorescence quenching: Mechanism and effectiveness in protecting plants from photodamage. Plant Physiol. 2016, 170, 1903–1916. [Google Scholar] [CrossRef]
- Bassi, R.; Dall’Osto, L. Dissipation of light energy absorbed in excess: The molecular mechanisms. Annu. Rev. Plant Biol. 2021, 72, 47–76. [Google Scholar] [CrossRef]
- Sharma, N.; Nagar, S.; Thakur, M.; Suriyakumar, P.; Kataria, S.; Shanker, A.K.; Landi, M.; Anand, A. Photosystems under high light stress: Throwing light on mechanism and adaptation. Photosynthetica 2023, 61, 250. [Google Scholar] [CrossRef]
- Khan, I.; Sohail; Zaman, S.; Li, G.; Fu, M. Adaptive responses of plants to light stress: Mechanisms of photoprotection and acclimation. A review. Front. Plant Sci. 2025, 16, 1550125. [Google Scholar] [CrossRef] [PubMed]
- Eppel, A.; Shaked, R.; Eshel, G.; Barak, S.; Rachmilevitch, S. Low induction of non-photochemical quenching and high photochemical efficiency in the annual desert plant Anastatica hierochuntica. Physiol. Plant 2014, 151, 544–558. [Google Scholar] [CrossRef] [PubMed]
- Giovagnetti, V.; Ruban, A.V. Discerning the effects of photoinhibition and photoprotection on the rate of oxygen evolution in Arabidopsis leaves. J. Photochem. Photobiol. B Biol. 2015, 152, 272–278. [Google Scholar] [CrossRef]
- Malnoë, A.; Schultink, A.; Shahrasbi, S.; Rumeau, D.; Havaux, M.; Niyogi, K.K. The plastid lipocalin LCNP is required for sustained photoprotective energy dissipation in Arabidopsis. Plant Cell 2018, 30, 196–208. [Google Scholar] [CrossRef]
- Flexas, J.; Carriquí, M. Photosynthesis and photosynthetic efficiencies along the terrestrial plant’s phylogeny: Lessons for improving crop photosynthesis. Plant J. 2020, 101, 964–978. [Google Scholar] [CrossRef] [PubMed]
- Bano, H.; Athar, H.U.R.; Zafar, Z.U.; Ogbaga, C.C.; Ashraf, M. Peroxidase activity and operation of photo-protective component of NPQ play key roles in drought tolerance of mung bean [Vigna radiata (L.) Wilcziek]. Physiol. Plant 2021, 172, 603–614. [Google Scholar] [CrossRef] [PubMed]
- Wang, Z.; Li, G.; Sun, H.; Ma, L.; Guo, Y.; Zhao, Z.; Gao, H.; Mei, L. Effects of drought stress on photosynthesis and photosynthetic electron transport chain in young apple tree leaves. Biol. Open 2018, 7, bio035279. [Google Scholar] [CrossRef]
- Bashir, N.; Athar, H.U.R.; Kalaji, H.M.; Wróbel, J.; Mahmood, S.; Zafar, Z.U.; Ashraf, M. Is photoprotection of PSII one of the key mechanisms for drought tolerance in maize? Int. J. Mol. Sci. 2021, 22, 13490. [Google Scholar] [CrossRef]
- Wei, K.; Liu, G.; Wei, B.; Zhang, Q.; Wu, S.; Li, Z. Effects of Drought Stress on the Physiological Characteristics of Flue-Cured Tobacco during the Vigorous Growing Period. Phyton 2025, 94, 1287–1298. [Google Scholar] [CrossRef]
- Passioura, J. The drought environment: Physical, biological and agricultural perspectives. J. Exp. Bot. 2007, 58, 113–117. [Google Scholar] [CrossRef]
- Chaloub, R.M.; da Costa, R.M.V.; Silva, J.; Nassar, C.A.; Reinert, F.; Széchy, M.T.M. Response of a Benthic Sargassum Population to Increased Temperatures: Decline in Non-Photochemical Quenching of Chlorophyll a Fluorescence (NPQ) Precedes That of Maximum Quantum Yield of PSII. Plants 2025, 14, 759. [Google Scholar] [CrossRef]
- Zhang, R.; Cruz, J.A.; Kramer, D.M.; Magallanes-Lundback, M.E.; Dellapenna, D.; Sharkey, T.D. Moderate heat stress reduces the pH component of the transthylakoid proton motive force in light-adapted, intact tobacco leaves. Plant Cell Environ. 2009, 32, 1538–1547. [Google Scholar] [CrossRef]
- Kramer, D.M.; Evans, J.R. The importance of energy balance in improving photosynthetic productivity. Plant Physiol. 2011, 155, 70–78. [Google Scholar] [CrossRef] [PubMed]
- Geange, S.R.; Arnold, P.A.; Catling, A.A.; Coast, O.; Cook, A.M.; Gowland, K.M.; Leight, A.; Notarnicola, R.F.; Posch, B.C.; Vemm, S.E.; et al. The thermal tolerance of photosynthetic tissues: A global systematic review and agenda for future research. New Phytol. 2021, 229, 2497–2513. [Google Scholar] [CrossRef]
- Yamakawa, H.; Itoh, S. Dissipation of excess excitation energy by drought-induced nonphotochemical quenching in two species of drought-tolerant moss: Desiccation-induced acceleration of photosystem II fluorescence decay. Biochemistry 2013, 52, 4451–4459. [Google Scholar] [CrossRef] [PubMed]
- Turc, B.; Sahay, S.; Haupt, J.; de Oliveira Santos, T.; Bai, G.; Glowacka, K. Non-photochemical quenching upregulation improves water use efficiency and reduces whole plant level water consumption under drought. J. Exp. Bot. 2024, 75, 3959–3972. [Google Scholar]
- Huo, H.; Jaffar, M.T.; Zhang, J.; Shang, J. Calligonum caput-medusae seedlings adapt to drought stress through changing chlorophyll fluorescence parameters. Front. Plant Sci. 2025, 16, 1640412. [Google Scholar] [CrossRef]
- Samson, G.; Bonin, L.; Maire, V. Dynamics of regulated YNPQ and non-regulated YNO energy dissipation in sunflower leaves exposed to sinusoidal lights. Photosynth. Res. 2019, 141, 315–330. [Google Scholar] [CrossRef]
- Asargew, M.F.; Masutomi, Y.; Kobayashi, K.; Aono, M. Water stress changes the relationship between photosynthesis and stomatal conductance. Sci. Total Environ. 2024, 907, 167886. [Google Scholar] [CrossRef]
- Ashraf, M.H.P.J.C.; Harris, P.J. Photosynthesis under stressful environments: An overview. Photosynthetica 2013, 51, 163–190. [Google Scholar] [CrossRef]
- Shtai, W.; Asensio, D.; Kadison, A.E.; Schwarz, M.; Raifer, B.; Andreotti, C.; Hammerle, A.; Zanotelli, D.; Haas, F.; Niedrist, G.; et al. Soil water availability modulates the response of grapevine leaf gas exchange and PSII traits to a simulated heat wave. Plant Soil 2024, 501, 537–554. [Google Scholar] [CrossRef]
- Shin, Y.K.; Bhandari, S.R.; Jo, J.S.; Song, J.W.; Lee, J.G. Effect of drought stress on chlorophyll fluorescence parameters, phytochemical contents, and antioxidant activities in lettuce seedlings. Horticulturae 2021, 7, 238. [Google Scholar] [CrossRef]
- Yin, X.; Wang, H.; Wang, C.; Wang, S.; Ren, X.; Zong, Z. Effect of Watering Gradient on Chlorophyll Fluorescence Parameters of Prunus domestica Trees. Agronomy 2024, 14, 2373. [Google Scholar] [CrossRef]
- Zhang, J.; Li, M.H.; Penuelas, J.; Sardans, J.; Du, L.; Yuan, Z.; Luo, Y.; Shen, Y.; Tian, R.; Li, N.; et al. Leaf area modulates the chlorophyll fluorescence of Leymus chinensis in response to different drought scenarios. Environ. Exp. Bot. 2025, 237, 106175. [Google Scholar] [CrossRef]
- Helm, L.T.; Shi, H.; Lerdau, M.T.; Yang, X. Solar-induced chlorophyll fluorescence and short-term photosynthetic response to drought. Ecol. Appl. 2020, 30, e02101. [Google Scholar] [CrossRef]
- Zait, Y.; Shemer, O.E.; Cochavi, A. Dynamic responses of chlorophyll fluorescence parameters to drought across diverse plant families. Physiol. Plant 2024, 176, e14527. [Google Scholar] [CrossRef]
- Zhu, H.; Hu, W.; Li, Y.; Zou, J.; He, J.; Wang, Y.; Meng, Y.; Chen, B.; Zhao, W.; Wang, S.; et al. Drought decreases cotton fiber strength by altering sucrose flow route. J. Exp. Bot. 2024, 75, 3579–3595. [Google Scholar] [CrossRef]
- Demmig-Adams, B.; Adams, W.W., III. Photoprotection in an ecological context: The remarkable complexity of thermal energy dissipation. New Phytol. 2006, 172, 11–21. [Google Scholar] [CrossRef]
- Nosalewicz, A.; Okoń, K.; Skorupka, M. Non-photochemical quenching under drought and fluctuating light. Int. J. Mol. Sci. 2022, 3, 5182. [Google Scholar] [CrossRef]
- Broddrick, J.T.; Ware, M.A.; Jallet, D.; Palsson, B.O.; Peers, G. Integration of physiologically relevant photosynthetic energy flows into whole genome models of light-driven metabolism. Plant J. 2022, 112, 603–621. [Google Scholar]
- Sekulska-Nalewajko, J.; Kornaś, A.; Gocławski, J.; Miszalski, Z.; Kuźniak, E. Spatial referencing of chlorophyll fluorescence images for quantitative assessment of infection propagation in leaves demonstrated on the ice plant: Botrytis cinerea pathosystem. Plant Methods 2019, 15, 18. [Google Scholar] [CrossRef] [PubMed]
- Meinzer, F.C.; Smith, D.D.; Woodruff, D.R.; Marias, D.E.; McCulloh, K.A.; Howard, A.R.; Magedman, A.L. Stomatal kinetics and photosynthetic gas exchange along a continuum of isohydric to anisohydric regulation of plant water status. Plant Cell Environ. 2017, 40, 1618–1628. [Google Scholar] [CrossRef] [PubMed]
- Terashima, I.; Hanba, Y.T.; Tholen, D.; Niinemets, Ü. Leaf functional anatomy in relation to photosynthesis. Plant Physiol. 2011, 155, 108–116. [Google Scholar] [CrossRef]
- Xiao, Y.; Tholen, D.; Zhu, X.G. The influence of leaf anatomy on the internal light environment and photosynthetic electron transport rate: Exploration with a new leaf ray tracing model. J. Exp. Bot. 2016, 67, 6021–6035. [Google Scholar] [CrossRef] [PubMed]
- Urban, J.; Matoušková, M.; Robb, W.; Jelínek, B.; Úradníček, L. Effect of drought on photosynthesis of trees and shrubs in habitat corridors. Forests 2023, 14, 1521. [Google Scholar] [CrossRef]
- McDowell, N.; Pockman, W.T.; Allen, C.D.; Breshears, D.D.; Cobb, N.; Kolb, T.; Plaut, J.; Sperry, J.; West, A.; Williams, D.G.; et al. Mechanisms of plant survival and mortality during drought: Why do some plants survive while others succumb to drought? New Phytol. 2008, 178, 719–739. [Google Scholar] [CrossRef]
- Sjöman, H.; Hirons, A.D.; Bassuk, N.L. Urban forest resilience through tree selection—Variation in drought tolerance in Acer. Urban For. Urban Green. 2015, 14, 858–865. [Google Scholar] [CrossRef]
- Stratópoulos, L.M.F.; Duthweiler, S.; Häberle, K.H.; Pauleit, S. Effect of native habitat on the cooling ability of six nursery-grown tree species and cultivars for future roadside plantings. Urban For. Urban Green. 2018, 30, 37–45. [Google Scholar] [CrossRef]
- Sjöman, H.; Nielsen, A.B. Selecting trees for urban paved sites in Scandinavia–A review of information on stress tolerance and its relation to the requirements of tree planners. Urban For. Urban Green. 2010, 9, 281–293. [Google Scholar] [CrossRef]
- Kibria, M.G.; Tjoelker, M.G.; Marchin, R.M.; Arndt, S.K.; Rymer, P.D. Can species climate niche predict canopy growth, functional traits and phenotypic plasticity in urban trees? Urban For. Urban Green. 2024, 98, 128417. [Google Scholar] [CrossRef]
- Jones, T.A.; Monaco, T.A. A role for assisted evolution in designing native plant materials for domesticated landscapes. Front. Ecol. Environ. 2009, 7, 541–547. [Google Scholar] [CrossRef]
- Johnson, M.T.; Munshi-South, J. Evolution of life in urban environments. Science 2017, 358, eaam8327. [Google Scholar] [CrossRef]
- Urli, M.; Lamy, J.B.; Sin, F.; Burlett, R.; Delzon, S.; Porté, A.J. The high vulnerability of Quercus robur to drought at its southern margin paves the way for Quercus ilex. Plant Ecol. 2015, 216, 177–187. [Google Scholar] [CrossRef]
- Oliveira, R.S.; Eller, C.B.; Barros, F.D.V.; Hirota, M.; Brum, M.; Bittencourt, P. Linking plant hydraulics and the fast–slow continuum to understand resilience to drought in tropical ecosystems. New Phytol. 2021, 230, 904–923. [Google Scholar] [CrossRef]
- Priya, U.K.; Senthil, R. Framework for enhancing urban living through sustainable plant selection in residential green spaces. Urban Sci. 2024, 8, 235. [Google Scholar] [CrossRef]
- Stojnić, S.; Pekeč, S.; Kebert, M.; Pilipović, A.; Stojanović, D.; Stojanović, M.; Orlović, S. Drought effects on physiology and biochemistry of pedunculate oak (Quercus robur L.) and hornbeam (Carpinus betulus L.) saplings grown in urban area of Novi Sad, Serbia. SEEFOR 2016, 7, 57–63. [Google Scholar] [CrossRef]
- Zorić, M.; Karaklić, V.; Ilić, M.; Novčić, Z.; Vasić, S.; Kalozi, O.; Kesić, L. Biogenic volatile organic compounds as mediators of forest ecosystem services for human health. Topola 2025, 216, 27–40. [Google Scholar] [CrossRef]
- Marinova, A.; Anev, S. Gas-exchange responses to light variation of tree species in urban landscaping. Ideas 2023, 29, 287–299. [Google Scholar]
- Lawlor, D.W.; Cornic, G. Photosynthetic carbon assimilation and associated metabolism in relation to water deficits in higher plants. Plant Cell Environ. 2002, 25, 275–294. [Google Scholar] [CrossRef] [PubMed]
- Cano, F.J.; Sánchez-Gómez, D.; Rodríguez-Calcerrada, J.; Warren, C.R.; Gil, L.; Aranda, I. Effects of drought on mesophyll conductance and photosynthetic limitations at different tree canopy layers. Plant Cell Environ. 2013, 36, 1961–1980. [Google Scholar] [CrossRef]
- Sagardoy, R.; Vázquez, S.; Florez-Sarasa, I.D.; Albacete, A.; Ribas-Carbó, M.; Flexas, J.; Morales, F. Stomatal and mesophyll conductances to CO2 are the main limitations to photosynthesis in sugar beet (Beta vulgaris) plants grown with excess zinc. New Phytol. 2010, 187, 145–158. [Google Scholar] [CrossRef]
- Salmon, Y.; Lintunen, A.; Dayet, A.; Chan, T.; Dewar, R.; Vesala, T.; Hölttä, T. Leaf carbon and water status control stomatal and nonstomatal limitations of photosynthesis in trees. New Phytol. 2020, 226, 690–703. [Google Scholar] [CrossRef]
- Cornic, G.; Fresneau, C. Photosynthetic carbon reduction and carbon oxidation cycles are the main electron sinks for photosystem II activity during a mild drought. Ann. Bot. 2002, 89, 887–894. [Google Scholar] [CrossRef]
- Zeng, Z.L.; Wang, X.Q.; Zhang, S.B.; Huang, W. Mesophyll conductance limits photosynthesis in fluctuating light under combined drought and heat stresses. Plant Physiol. 2024, 194, 1498–1511. [Google Scholar] [CrossRef]
- Qiao, M.; Hong, C.; Jiao, Y.; Hou, S.; Gao, H. Impacts of drought on photosynthesis in major food crops and the related mechanisms of plant responses to drought. Plants 2024, 13, 1808. [Google Scholar] [CrossRef]
- Zapater, M.; Bréda, N.; Bonal, D.; Pardonnet, S.; Granier, A. Differential response to soil drought among co-occurring broad-leaved tree species growing in a 15-to 25-year-old mixed stand. Ann. For. Sci. 2013, 70, 31–39. [Google Scholar] [CrossRef]
- Thomas, F.M.; Gausling, T. Morphological and physiological responses of oak seedlings (Quercus petraea and Q. robur) to moderate drought. Ann. For. Sci. 2000, 57, 325–333. [Google Scholar] [CrossRef]
- Roussel, M.; Dreyer, E.; Montpied, P.; Le-Provost, G.; Guehl, J.M.; Brendel, O. The diversity of 13C isotope discrimination in a Quercus robur full-sib family is associated with differences in intrinsic water use efficiency, transpiration efficiency, and stomatal conductance. J. Exp. Bot. 2009, 60, 2419–2431. [Google Scholar] [CrossRef] [PubMed]
- Kannenberg, S.A.; Novick, K.A.; Phillips, R.P. Anisohydric behavior linked to persistent hydraulic damage and delayed drought recovery across seven North American tree species. New Phytol. 2009, 222, 1862–1872. [Google Scholar] [CrossRef]
- Klein, T. The variability of stomatal sensitivity to leaf water potential across tree species indicates a continuum between isohydric and anisohydric behaviours. Funct. Ecol. 2014, 28, 1313–1320. [Google Scholar] [CrossRef]
- Nerva, L.; Chitarra, W.; Fila, G.; Lovat, L.; Gaiotti, F. Variability in stomatal adaptation to drought among grapevine cultivars: Genotype-dependent responses. Agriculture 2023, 13, 2186. [Google Scholar] [CrossRef]
- Nosenko, T.; Schroeder, H.; Zimmer, I.; Buegger, F.; Orgel, F.; Burau, I.; Schnitzler, J.P. Patterns of Adaptation to Drought in Quercus robur Populations in Central European Temperate Forests. Glob. Change Biol. 2025, 31, e70168. [Google Scholar] [CrossRef]
- Lavergne, A.; Sandoval, D.; Hare, V.J.; Graven, H.; Prentice, I.C. Impacts of soil water stress on the acclimated stomatal limitation of photosynthesis: Insights from stable carbon isotope data. Glob. Change Biol. 2020, 26, 7158–7172. [Google Scholar] [CrossRef]
- Zhang, J.; Chen, X.; Song, Y.; Gong, Z. Integrative regulatory mechanisms of stomatal movements under changing climate. J. Integr. Plant Biol. 2024, 66, 368–393. [Google Scholar] [CrossRef]
- Yi, K.; Maxwell, J.T.; Wenzel, M.K.; Roman, D.T.; Sauer, P.E.; Phillips, R.P.; Novick, K.A. Linking variation in intrinsic water-use efficiency to isohydricity: A comparison at multiple spatiotemporal scales. New Phytol. 2019, 221, 195–208. [Google Scholar] [CrossRef] [PubMed]
- Yang, S.; Zhang, H.; Jin, Y.; Turner, N.C.; Pang, J.; Chen, Y.; He, J. Coordination of abscisic acid and hydraulic signals in stomatal closure and yield of soybean genotypes with varying isohydry under different water conditions. Agric. Water Manag. 2025, 313, 109495. [Google Scholar] [CrossRef]
- Lawlor, D.W.; Tezara, W. Causes of decreased photosynthetic rate and metabolic capacity in water-deficient leaf cells: A critical evaluation of mechanisms and integration of processes. Ann. Bot. 2009, 103, 561–579. [Google Scholar] [CrossRef]
- Zhu, R.; Hu, T.; Wan, D.; Xie, Y.; Zeng, X.; Zhou, S.; Liang, D. Revealing the drought-induced variations in rice water use strategy through a hydraulic-based stomatal optimization model. Environ. Exp. Bot. 2025, 241, 106297. [Google Scholar] [CrossRef]
- Zhou, L.; Wang, S.; Chi, Y.; Li, Q.; Huang, K.; Yu, Q. Responses of photosynthetic parameters to drought in subtropical forest ecosystem of China. Sci. Rep. 2015, 5, 18254. [Google Scholar] [CrossRef]
- Baroni, D.F.; de Souza, G.A.; Bernado, W.D.P.; Santos, A.R.; Barcellos, L.C.D.S.; Barcelos, L.F.; Campostrini, E. Stomatal and non-stomatal leaf responses during two sequential water stress cycles in young Coffea canephora plants. Stresses 2024, 4, 575–597. [Google Scholar] [CrossRef]
- Lusk, C.H.; Kelly, J.W.; Gleason, S.M. Light requirements of Australian tropical vs. cool-temperate rainforest tree species show different relationships with seedling growth and functional traits. Ann. Bot. 2013, 111, 479–488. [Google Scholar] [CrossRef]
- Shuang, S.P.; Zhang, J.Y.; Cun, Z.; Wu, H.M.; Hong, J.; Chen, J.W. A comparison of photoprotective mechanism in different light-demanding plants under dynamic light conditions. Front. Plant Sci. 2022, 13, 819843. [Google Scholar] [CrossRef]
- Valladares, F.; Niinemets, Ü. Shade tolerance, a key plant feature of complex nature and consequences. Annu. Rev. Ecol. Evol. Syst. 2008, 39, 237–257. [Google Scholar] [CrossRef]
- Kim, S.H.; Saung, J.H.; Kim, Y.K.; Kim, P.G. Photosynthetic responses of four oak species to changes in light environment. Korean J. Agric. For. Meteorol. 2008, 10, 141–148. [Google Scholar] [CrossRef][Green Version]
- Vaz, M.; Pereira, J.S.; Gazarini, L.C.; David, T.S.; David, J.S.; Rodrigues, A.; Chaves, M.M. Drought-induced photosynthetic inhibition and autumn recovery in two Mediterranean oak species (Quercus ilex and Quercus suber). Tree Physiol. 2010, 30, 946–956. [Google Scholar] [CrossRef]
- Gallé, A.; Haldimann, P.; Feller, U. Photosynthetic performance and water relations in young pubescent oak (Quercus pubescens) trees during drought stress and recovery. New Phytol. 2007, 174, 799–810. [Google Scholar] [CrossRef]
- Shipley, B.; Lechowicz, M.J.; Wright, I.; Reich, P.B. Fundamental trade-offs generating the worldwide leaf economics spectrum. Ecology 2006, 87, 535–541. [Google Scholar] [CrossRef]
- Lichstein, J.W.; Peterson, B.T.; Langebrake, J.; McKinley, S.A. Leaf economics of early-and late-successional plants. Am. Nat. 2021, 198, 347–359. [Google Scholar] [CrossRef]
- Donovan, L.A.; Maherali, H.; Caruso, C.M.; Huber, H.; de Kroon, H. The evolution of the worldwide leaf economics spectrum. Trends Ecol. Evol. 2011, 26, 88–95. [Google Scholar] [CrossRef]
- Reich, P.B. The world-wide ‘fast–slow’plant economics spectrum: A traits manifesto. J. Ecol. 2014, 102, 275–301. [Google Scholar] [CrossRef]
- Li, R.; Cheng, X.; Dai, P.; Zhang, M.; Li, M.; Chen, J.; Wang, Y. Plant Architectural Structure and Leaf Trait Responses to Environmental Change: A Meta-Analysis. Plants 2025, 14, 1717. [Google Scholar] [CrossRef] [PubMed]
- Poorter, H.; Niinemets, Ü.; Poorter, L.; Wright, I.J.; Villar, R. Causes and consequences of variation in leaf mass per area (LMA): A meta-analysis. New Phytol. 2009, 182, 565–588. [Google Scholar] [CrossRef] [PubMed]
- Lusk, C.H.; Warton, D.I. Global meta-analysis shows that relationships of leaf mass per area with species shade tolerance depend on leaf habit and ontogeny. New Phytol. 2007, 176, 764–774. [Google Scholar] [CrossRef]
- Dwyer, J.M.; Hobbs, R.J.; Mayfield, M.M. Specific leaf area responses to environmental gradients through space and time. Ecology 2014, 95, 399–410. [Google Scholar] [CrossRef]
- Sun, D.; Lei, Z.; Carriquí, M.; Zhang, Y.; Liu, T.; Wang, S.; Song, K.; Zhu, L.; Zhang, W.; Zhang, Y. Reductions in mesophyll conductance under drought stress are influenced by increases in cell wall chelator-soluble pectin content and denser microfibril alignment in cotton. J. Exp. Bot. 2025, 76, 1116–1130. [Google Scholar] [CrossRef]
- Niinemets, Ü. Global-scale climatic controls of leaf dry mass per area, density, and thickness in trees and shrubs. Ecology 2001, 82, 453–469. [Google Scholar] [CrossRef]
- Villar, R.; Merino, J. Comparison of leaf construction costs in woody species with differing leaf life-spans in contrasting ecosystems. New Phytol. 2001, 151, 213–226. [Google Scholar] [CrossRef] [PubMed]
- Yang, Y.; Kang, L.; Zhao, J.; Qi, N.; Li, R.; Wen, Z.; Zheng, H. Quantifying leaf trait covariations and their relationships with plant adaptation strategies along an aridity gradient. Biology 2021, 10, 1066. [Google Scholar] [CrossRef] [PubMed]
- Eslamdoust, J.; Mohsen Hosseini, S.; Kardel, F. Responses in leaf water status of Quercus castaneifolia CA Mey and Carpinus betulus L. exposed to cement dust pollution in Northern Iran. J. For. Sci. 2023, 69, 325–333. [Google Scholar] [CrossRef]
- Pan, S.; Wang, X.; Yan, Z.; Wu, J.; Guo, L.; Peng, Z.; Liu, L. Leaf stomatal configuration and photosynthetic traits jointly affect leaf water use efficiency in forests along climate gradients. New Phytol. 2024, 244, 1250–1262. [Google Scholar] [CrossRef]
- Shekanino, A.; Agustin, A.; Aladefa, A.; Amezquita, J.; Gonzalez, D.; Heldenbrand, E.; Carmona-Galindo, V.D. Differential Stomatal Responses to Surface Permeability by Sympatric Urban Tree Species Advance Novel Mitigation Strategy for Urban Heat Islands. Sustainability 2023, 15, 11942. [Google Scholar] [CrossRef]
- Bertolino, L.T.; Caine, R.S.; Gray, J.E. Impact of stomatal density and morphology on water-use efficiency in a changing world. Front. Plant Sci. 2019, 10, 225. [Google Scholar] [CrossRef]
- Rezaei Nejad, A.; van Meeteren, U. Dynamics of adaptation of stomatal behaviour to moderate or high relative air humidity in Tradescantia virginiana. J. Exp. Bot. 2008, 59, 289–301. [Google Scholar] [CrossRef] [PubMed]
- Xu, Z.; Tian, Y.; Liu, Z.; Xia, X. Comprehensive effects of atmosphere and soil drying on stomatal behavior of different plant types. Water 2023, 15, 1675. [Google Scholar] [CrossRef]
- Ennajeh, M.; Vadel, A.M.; Cochard, H.; Khemira, H. Comparative impacts of water stress on the leaf anatomy of a drought-resistant and a drought-sensitive olive cultivar. J. Hortic. Sci. Biotechnol. 2010, 85, 289–294. [Google Scholar] [CrossRef]
- Laajimi, N.O.; Boussadia, O.; Skhiri, F.H.; Teixeira da Silva, J.A.; Rezgui, S.; Hellali, R. Anatomical adaptations in vegetative structures of apricot tree (Prunus armeniaca L.) cv.‘Amor El Euch’grown under water stress. Fruit Veg. Cereal Sci. Biotech. 2011, 5, 46–51. [Google Scholar]
- Caine, R.S.; Harrison, E.L.; Sloan, J.M.; Flis, P.M.; Fischer, S.; Phuoc, N.T.; Croft, H.L. The influences of stomatal size and density on rice drought, salinity and VPD resilience. bioRxiv 2002, arXiv:13.491841. [Google Scholar]


Disclaimer/Publisher’s Note: The statements, opinions and data contained in all publications are solely those of the individual author(s) and contributor(s) and not of MDPI and/or the editor(s). MDPI and/or the editor(s) disclaim responsibility for any injury to people or property resulting from any ideas, methods, instructions or products referred to in the content. |
© 2026 by the authors. Licensee MDPI, Basel, Switzerland. This article is an open access article distributed under the terms and conditions of the Creative Commons Attribution (CC BY) license.