Abstract
Under the imperative of carbon emission mitigation, digital trade, emerging as a fusion of digital technologies and international commerce, has become a pivotal conduit for advancing sustainable development. This study constructs an innovative and comprehensive evaluation system for digital trade and utilizes the super-efficiency Slacks-Based Measure Global Malmquist–Luenberger (SBM-GML) model to quantify green total factor productivity (GTFP). It then empirically investigates the impact of digital trade on GTFP in China and its underlying transmission mechanisms. Empirical findings reveal a pronounced spatial gradient in digital trade, characterized by a “strong eastward, advancing westward” trend, while GTFP growth is predominantly driven by technological progress yet marred by regional disparities. Moreover, digital trade is demonstrated to substantially enhance GTFP, with this finding remaining robust in the face of endogeneity tests. Mechanism analyses further confirm that digital trade promotes GTFP through technological innovation incentives, green upgrading of industrial structure, and scale effects. Geographically, the positive impact is particularly evident in central and western regions, suggesting an emerging trade potential in these areas. Temporally, the influence shifted from insignificant before 2016 to strongly positive thereafter, underscoring a “digital carbon reduction multiplier effect” amplified by technological maturity. These findings provide important policy implications for leveraging digital trade to advance sustainable economic transformation.
1. Introduction
The global economic and trade landscape is undergoing profound transformation, increasingly intersecting with accelerating climate governance initiatives. Against a backdrop of persistent geopolitical tensions, economies are advancing multilateral carbon regulatory frameworks, exemplified by the EU’s operational Carbon Border Adjustment Mechanism (CBAM) and the US’s Clean Competition Act, which has completed legislative deliberation. These developments signal a clear trend toward climate-motivated trade barriers. As the world’s largest manufacturing nation and a committed participant in global carbon neutrality efforts, China faces growing carbon constraints on its export-oriented growth model. In this critical phase of global industrial decarbonization, the country’s economic paradigm is shifting from scale expansion to quality enhancement. Central to this transition is green total factor productivity (GTFP), which integrates energy-related and environmental impacts into conventional growth accounting, providing a comprehensive measure of sustainable economic performance [1]. In this study, GTFP is understood as a core synthetic indicator that gauges an economy’s efficiency in achieving growth under resource and environmental constraints. The “green” dimension embodies a dual operational focus. On the input side, it explicitly treats energy and natural resources as critical factors of production, thereby internalizing the cost of resource scarcity. On the output side, it innovatively expands the accounting framework by incorporating pollutant emissions as non-desirable outputs alongside desirable economic outputs like GDP [2]. This approach, often modeled through directional distance functions, means that improving GTFP requires increasing desirable outputs while simultaneously reducing undesirable ones, capturing the essential trade-off between economic growth and environmental preservation. Consequently, GTFP moves beyond traditional TFP by internalizing environmental costs, offering a more holistic gauge of sustainable development. Its importance is underscored by its inclusion as a binding indicator in China’s 2023 Green and Low-Carbon Transition Industry Guidance Catalogue. In this context, identifying viable pathways to enhance GTFP has become an urgent research and policy priority [3]. Accordingly, this paper defines GTFP as the rate of change in comprehensive efficiency, reflecting a region’s ability to increase its real GDP while reducing emissions of CO2 and other major industrial pollutants, given fixed inputs of capital, labor, and energy.
In this evolving landscape, the rise of digital trade presents a strategic opportunity for China to address green trade barriers and boost GTFP. To ensure the comprehensiveness and precision of this research, this paper adopts a broad conceptual definition of digital trade [4]. Ma and Shen (2023) defines digital trade as commercial activities that utilize digital technologies to facilitate transactions of goods (tangible goods, digital content, and data) and services [4]. Accordingly, in this study, digital trade encompasses not only services delivered purely in digital form, such as software and cloud services, but also the trade of physical goods that is deeply permeated and transformed by digital technologies. Its essence lies in the application of digital technologies throughout the entire trade chain, including information search, demand–supply matching, contract negotiation, online payment, digital supply chain management, and logistics tracking. This integration significantly reduces transaction costs and enhances the efficiency of resource allocation. Typical digital trade activities include the following: transactions of physical goods conducted via cross-border B2B or B2C e-commerce platforms; digitally delivered services, such as cloud computing, digital content, and online professional services; and the cross-border flow and transaction of data as a new factor of production. This broad definition helps to more fully capture the comprehensive impact of digital technologies on the economic system, both by enabling traditional trade and fostering new forms of business.
The beneficial effect of digital trade on GTFP stems from three core mechanisms. First, in the realm of technical monitoring, IoT and big data analytics enable real-time tracking of energy use and emissions across supply chains, establishing a data foundation for optimizing production processes and enabling precise emission reductions, which is highlighted in studies on digital trade’s transformative potential [2]. Second, in institutional alignment, digital trade frameworks facilitate the integration of environmental standards into international agreements, creating systemic incentives for global supply chains to adopt greener technologies, as discussed in analyses of digital trade rules and their broader impacts [3]. Finally, in operational efficiency, digital marketplaces and cross-border online transactions significantly reduce the environmental cost per transaction by streamlining logistics and minimizing intermediate links, thereby lowering the carbon intensity of trade activities [5,6]. Recognizing this potential, China’s Central Committee for Comprehensively Deepening Reform elevated the digital–green synergy to a national strategic priority in its 2023 Guidance on Promoting the Innovative Development of Digital Trade. Nevertheless, digital trade may impede GTFP growth due to surging energy consumption from data infrastructure, higher emissions during early technology adoption phases, and the carbon footprint associated with producing and disposing of digital hardware, particularly in regions reliant on coal-based power [5]. Against the pressing backdrop of international carbon tariffs, elucidating the influence of digital trade on GTFP is not only academically meaningful but also essential for China to secure a pivotal role in reshaping worldwide green trade governance.
In recent years, the profound merging of digital technologies and the real economy has sustainably catalyzed new trade formats and operational models. Supported by policies such as the “14th Five-Year Plan for Digital Economy Development” and the “Guiding Opinions on Innovative Development of Digital Trade”, China’s institutional environment for digital trade has been progressively optimized. The efficiency of data factor flows has steadily improved, strengthening the endogenous drivers of digital trade development and positioning it as a new growth engine and a catalyst for high-quality trade. As per the latest governmental release, China’s digital trade sector exhibits strong growth momentum and a steadily expanding scale. A detailed breakdown of the data is provided in Figure 1. In 2024, the import and export value of digitally deliverable services reached USD 406.72 billion, comprising exports of USD 232.71 billion (up 6.3%) and imports of USD 174.0 billion (up 4.3%), resulting in a trade surplus of USD 58.71 billion. Over a longer timeframe, China’s digitally deliverable service exports grew from USD 79.00 billion in 2014 to USD 220.57 billion in 2024, nearly tripling over the decade [6]. The country has maintained a digital trade surplus for six consecutive years since 2019, with the surplus in 2024 expanding more than tenfold compared to 2019. In parallel, China is actively promoting the deep integration of digital technology with low-carbon transformation. Guided by the “Dual Carbon” goals and supported by the greening of digital infrastructure, China continues to enhance resource utilization efficiency and environmental performance, providing robust policy support and institutional guarantees for GTFP growth. The synergistic advancement of digital trade and GTFP is increasingly forming a new international competitive advantage for China, driven by the dual forces of digitalization and green transformation.
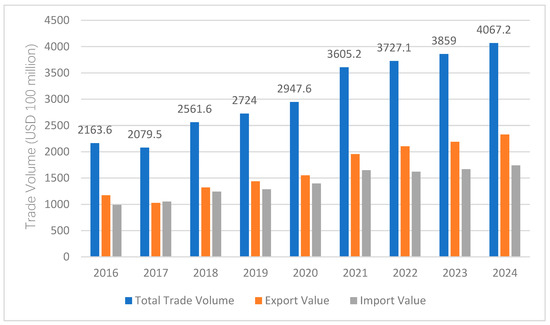
Figure 1.
The scale of China’s digitally deliverable services trade (2016–2024). Data source: Figure is drawn by the authors. Data is from the Ministry of Commerce of the People’s Republic of China.
This study offers several key innovations in understanding how digital trade contributes to green development. First, it identifies and validates a distinct transmission pathway through which digital trade enhances GTFP, namely by driving greening of industrial structure. This process is characterized by a substantive increase in the share of low-carbon industries and the widespread clean retrofitting of high-energy-consuming sectors, offering a more nuanced theoretical foundation for synergizing environmental and economic objectives than the conventional one-dimensional focus on industrial upgrading. Second, the research formulates a comprehensive quantitative assessment system for digital trade, integrating five dimensions such as digital infrastructure, transaction scale, openness, logistics capacity, and quantified digital trade barriers. This multidimensional approach fills an important gap in regionally assessing both the institutional environment and actual performance of digital trade. Finally, to strengthen causal inference, this study employs a robust empirical strategy incorporating a dual instrumental variable set-up, including the total provincial courier business volume, which is introduced as an exogenous variable based on the digital trade–logistics scale correlation theory, and the lagged term of digital trade to capture its dynamic effects. This empirical strategy aligns more closely with the evolutionary characteristics of digital trade compared to traditional instrumental variable selections, thereby enhancing the reliability of findings regarding digital trade’s role in fostering green industrial transformation.
The remainder of this paper is organized as follows: Section 2 reviews the relevant literature. Section 3 presents the theoretical analysis and research hypotheses. Section 4 provides the materials and methods. Section 5 shows the empirical results and analysis. Section 6 concludes the study and discusses policy implications.
2. Literature Review
2.1. Relevant Literature on Digital Trade
Regarding conceptual definitions, scholars distinguish between “narrow” and “broad” scopes. The narrow definition of digital trade, as initially articulated in early scholarly and policy discourses, predominantly constrains its scope to services and products delivered through digital means [1]. Conversely, the broad definition, subsequently embraced by the USITC (2014), extends to encompass digitally ordered goods and services, as well as goods manufactured utilizing digital technologies [2,3]. This expansive conceptualization, which posits digital trade as a platform-enabled ecosystem facilitating the digitization of information, product, and physical goods exchanges [4,5], is adopted in the present study.
Regarding measurement methodologies, researchers have developed comprehensive indicator systems to operationalize digital trade development. These systems typically integrate multiple dimensions, including digital infrastructure, trade scale, and developmental potential. Methodological approaches such as the entropy weight method are frequently employed to evaluate development levels across provinces or specific regions [7,8].
Regarding empirical research, current studies on digital trade primarily focus on several key areas. First, its role in industrial upgrading and global value chain (GVC) restructuring is extensively examined. Cross-country analyses covering 12 developing countries over 2001–2020 indicate its positive impact on manufacturing upgrading in developing countries [9] and the rationalization of industrial structures [10]. Second, the environmental effects of digital trade constitute a rapidly growing research stream. Studies explore its influence on carbon emissions reduction [11,12] and corporate ESG performance [13,14,15]. Wan and Lan (2024) investigate the facilitating role of digital trade in the upgrading of China’s manufacturing industry from the perspective of structural rationalization, demonstrating that digital trade not only enhances the technological sophistication of the manufacturing sector but also improves the operational efficiency of the industrial system [13]. Chen and Xie (2025), drawing upon data from Chinese listed companies spanning the period 2013–2022, document a significant positive effect of digital trade on corporate environmental, social, and governance (ESG) performance, with such effect being more pronounced in high-technology industries and regions characterized by superior institutional environments [14]. Li et al. (2025) substantiate that digital trade fosters a virtuous interaction among technological innovation, market expansion, and governance optimization, thereby contributing to the unleashing of its potential for sustainable development [15]. Third, research delves into the implications of digital trade rules and barriers, analyzing the effects of specific rule frameworks [16] and data protection regulations like the GDPR [17] on trade patterns and market dynamics.
2.2. Relevant Literature on Green Total Factor Productivity
Research on GTFP has evolved in two main areas: measurement methodologies and the identification of influencing factors. Methodologically, research on GTFP has progressed from traditional Data Envelopment Analysis (DEA) and Malmquist productivity indices to models explicitly incorporating undesirable outputs. Early cross-country studies typically applied Malmquist indices without fully accounting for pollution [18]. More recent research employs the Slacks-Based Measure Global Malmquist–Luenberger (SBM-GML) framework, which integrates energy inputs and carbon or pollutant emissions, thereby aligning productivity measurement with environmental constraints [19,20,21,22,23,24].
Regarding influencing factors, scholarly attention has expanded beyond technological innovation and environmental regulation to increasingly examine the contribution of the digital economy. Recent studies demonstrate that digital trade and the broader digital economy can enhance GTFP through various channels, including promoting technological innovation, optimizing resource allocation, and fostering industrial structure advancement. Wen et al. (2025) exploit China’s National Big Data Comprehensive Pilot Zones as a quasi-natural experiment, using provincial panel data covering 2007–2022 [18]. The findings indicate that digital transformation significantly improves GTFP through technological innovation and industrial upgrading [18]. Similarly, Qian et al. (2024) prove that digital economy development promotes GTFP via innovation-driven mechanisms and improved resource allocation efficiency [19]. Furthermore, Liu et al. (2025) reveal significant positive spillover effects of digital economy development on GTFP across neighboring cities, suggesting that digital infrastructure and information flows reduce regional fragmentation and enhance coordinated green growth [20]. The evidence extends beyond macro-level analyses. Sector-specific studies corroborate the positive impact. Research in agriculture demonstrates how digital technologies (e.g., precision farming, IoT sensors) can enhance resource efficiency and reduce pollution, thereby improving agricultural GTFP [21]. Similarly, in fisheries, digitalization aids in sustainable stock management and supply chain traceability, contributing to greener productivity in coastal regions [22]. Furthermore, scholars are beginning to explore synergistic effects, such as the coupling between the digital economy and green finance, arguing that their integration can create a powerful combined driver for GTFP growth by directing capital more efficiently towards green innovation projects [23]. He et al. (2025) further analyze the coupling coordination among the digital economy, green finance, and total factor carbon productivity from 2006 to 2021 and find increasing coordination over time but substantial regional disparities [24].
2.3. Research Contributions
Based on the review of the existing literature, this study focuses on the impact mechanisms and pathways through which digital trade influences GTFP. First, in terms of research perspective, this study shifts the focus from the broad concept of the “digital economy” to the specific and measurable international economic activity of “digital trade.” While prior research often examines the impact of digital infrastructure or ICT capital on GTFP, it fails to disentangle the distinct “trade” attributes related to cross-border transactions, technology spillovers, and deep integration into global value chains. The comprehensive digital trade index constructed in this study systematically quantifies this specific economic activity at the provincial level for the first time, providing a more precise variable for empirically testing its environmental effects independent of general digitization.
Second, regarding theoretical mechanisms, this study empirically compares the relative strength of three core transmission channels—technological innovation, scale effect, and industrial structure upgrading. While prior research has examined these pathways in isolation or conceptually, few have systematically benchmarked their hierarchy of importance. This paper provides nuanced evidence that the technological innovation effect is the most fundamental pathway, a primacy explained by digital trade’s role in accelerating green knowledge diffusion and R&D collaboration. This finding not only identifies the hierarchy of mechanisms but also explains why innovation is paramount, whereas scale and structural effects often manifest as secondary, enabling outcomes.
Third, regarding empirical evidence, this study reveals notable spatial heterogeneity in the green effects of digital trade. The positive impact on GTFP is statistically significant in central and western regions, which challenges the assumption that the benefits of digitalization are uniformly distributed and automatically scale with regional advancement. Instead, it suggests that digital trade may act as a channel for green technology diffusion and catch-up growth in less digitally endowed regions, while in highly digitized eastern provinces, its marginal green gains may have plateaued or been offset by other structural factors. This finding enriches the discussion on the conditional and contextual nature of digital trade’s environmental outcomes, emphasizing that its role in green development is not intrinsic but mediated by regional absorptive capacity and developmental preconditions.
3. Theoretical Analysis and Research Hypotheses
The Environmental Kuznets Curve hypothesizes the long-term potential for decoupling economic growth from environmental degradation, and digital trade acts as a key accelerator and optimizer of this transition. It is not merely a technological or commercial phenomenon but a systemic force that reshapes knowledge flows, resource allocation, and market signals, thereby driving the economic system toward the green productivity frontier through multiple, interconnected dimensions.
First, digital trade functions as a vital channel for international technology diffusion. The core logic of this mechanism is that digital trade significantly promotes green-oriented technological innovation by optimizing the innovation ecosystem, thereby driving GTFP growth through green technological progress and green technological efficiency. Specifically, digital trade stimulates innovation primarily via four pathways. First, it facilitates the global spillover and rapid iteration of both explicit and tacit knowledge, enabling enterprises to access cutting-edge knowledge efficiently and at low cost, thereby accelerating learning and re-innovation. Second, it supports the establishment of global R&D networks and leverages digital tools to reduce innovation costs and risks, promoting collaborative breakthroughs in complex green technologies. Third, by expanding global markets and amplifying potential returns, it directly incentivizes enterprises to commit to long-term investments in green R&D. Fourth, it helps enterprises promptly perceive differences in international environmental regulations, thereby directing R&D resources toward areas such as clean technologies. The innovations subsequently enhance GTFP through a dual pathway. On one hand, they manifest as fundamental green technological advancements, such as energy efficiency and clean energy, which shift the production frontier toward greener directions. On the other hand, through the application of digital technologies such as the Industrial Internet and big data, they optimize production management and monitoring, improving the practical utilization efficiency of existing green technologies and reducing resource misallocation. Consequently, the following hypothesis is proposed:
H1.
The development of digital trade can enhance GTFP by promoting technological innovation.
Second, digital trade exerts a profound influence on the trajectory of industrial structural change. The core of this mechanism lies in the fact that digital trade systematically guides the economic structure toward a greener, low-carbon, and high-value-added direction by reshaping industrial division of labor and optimizing factor allocation. First, at the level of industrial division of labor, digital trade drives the green upgrading of industrial structure within global value chains. By leveraging big data to accurately connect international green consumer markets with environmental standards, it directs domestic industries to shift from exporting energy-intensive raw materials and low-end manufactured goods to exporting high-tech, low-carbon green final products and services. Simultaneously, digital trade itself fosters emerging green digital industries such as carbon management and smart environmental protection, thereby optimizing the industrial structure through new growth avenues. Second, at the level of factor allocation, digital trade establishes a virtuous cycle mechanism for the green upgrading of industrial structure. Digital platforms aggregate and match global information on green technologies, capital, and projects, significantly alleviating market information asymmetry. This guides production factors to spontaneously flow toward green and efficient sectors while curbing the expansion of high-pollution, low-efficiency capacities. More importantly, by strengthening the transmission of international green regulations and supporting new models such as shared manufacturing and the circular economy, digital trade profoundly transforms the logic of resource allocation from both regulatory and organizational perspectives, enabling a deeper and more efficient sustainability transition. Based on this, we propose the following research hypothesis:
H2.
Digital trade enhances GTFP by driving the green upgrading of industrial structure.
Finally, the scale effects generated by digital trade exert a dual and complex influence on GTFP, with the net outcome shaped by the interplay between promoting and restraining mechanisms. On one hand, scale effects can promote GTFP growth. The expansion of economic activity through digital trade may increase investment in green infrastructure and clean technology. As the adoption scale of green technologies expands, their average costs decline, accelerating diffusion. Digital trade also fosters specialized environmental service markets, which can lower the marginal cost of green transformation for firms through shared digital platforms, thereby enhancing overall green efficiency. On the other hand, scale effects may also inhibit GTFP growth. By reducing production and energy costs, digital trade could incentivize increased output of carbon-intensive products, leading to a rebound effect that offsets gains from technological progress. When economies of scale reinforce the cost competitiveness of high-carbon industries, corporate motivation for a green transition may weaken, potentially locking the economy into a carbon-intensive development path. Moreover, rapid expansion in digital sectors may attract excessive capital, crowding out resources needed for green innovation. If scale expansion outpaces the economy’s capacity to absorb green technologies, GTFP improvement may be constrained. Thus, the overall impact of digital trade’s scale dimension on GTFP is not predetermined but depends on the relative strength and interaction of these opposing forces within specific institutional and market contexts. In summary, this study proposes the following core hypotheses:
H3a.
Digital trade enhances GTFP by generating positive scale efficiency.
H3b.
Digital trade inhibits GTFP by inducing high-carbon expansion or resource misallocation.
4. Materials and Methods
4.1. Evaluation Method of Digital Trade
Based on the research findings of Feng and Duan (2022), Cang (2025), Zhang and Zhang (2024), Ma and Shuang (2023), and Li et al. (2024) [25,26,27,28,29], this paper selects evaluation indicators for digital trade. The system includes 5 primary indicators and 19 secondary indicators across digital trade infrastructure, scale, potential, logistics environment, and trade barriers, as shown in Table 1.

Table 1.
Evaluation system of digital trade development index.
The selection rationale for these indicators is as follows. The digital trade foundation indicators, including the number of domain names and websites, mobile phone subscriptions, internet penetration rate, and the length of long-distance optical cables, are chosen to measure the scale, coverage, and completeness of the underlying infrastructure—prerequisites for digitizing trade activities. To capture the scale and economic contribution of digital trade, reflecting industrial integration and market vitality, indicators such as per capita telecom business volume, the export share of ICT and digitally deliverable services, online retail sales, and e-commerce activity are employed. Future growth potential is assessed through the value added of the tertiary sector and trade openness, gauging the broader economic environment and international competitiveness. Recognizing that the logistics environment critically affects the efficiency and cost of cross-border circulation, the number of logistics employees, express delivery volume, and road freight vehicles are included to measure industry scale and infrastructure. Finally, to identify institutional and technical obstacles, the Digital Trade Restrictiveness Index is incorporated to reflect market access difficulty, drawing on the measurement method proposed by Yu et al. (2022) [30]. The Digital Services Trade Restrictiveness Index is a composite metric tool designed to quantify the degree of policy restrictions in the digital trade domain across countries. It aims to analyze policy barriers in this field through quantification, revealing the extent to which the policy environment affects the cross-border flow of digital services [31]. It is constructed by assessing regulatory measures across key domains such as data governance, market access, and intellectual property protection, translating them into a standardized, continuous score. The index ranges from 0 to 1, where 0 denotes a completely open policy environment for digital services and 1 signifies a fully restrictive or closed regime. Thus, a higher index value directly indicates a greater level of regulatory restriction, hindering the cross-border flow of digital services. This unitless measure facilitates comparative analysis of policy openness specifically in the services segment of digital trade over time and across regions.
This study draws upon a comprehensive array of domestic and international data sources. These encompass international databases such as the World Bank’s WDI and the OECD-STAN, official Chinese yearbooks including the China Commerce Yearbook, and sub-national data from provincial statistical yearbooks and customs authorities.
When dealing with the problem of determining weights for multiple indicators, the entropy weight method systematically minimizes the idiosyncrasies of human judgment, thereby enhancing the reliability and impartiality of the evaluation. This study employs this method to assign corresponding weights to each detailed indicator for measuring the development level of digital trade.
- (1)
- Data standardization:
The application of the entropy weight method first requires data standardization to eliminate the influence of differing measurement units and scales across indicators, ensuring their comparability. Following established practice, positive indicators, where a larger original value denotes a better outcome, are normalized using Formula (1). Conversely, negative indicators, where a smaller original value is preferable, are transformed using Formula (2) to ensure a higher normalized value consistently reflects a more favorable condition. In the specific context of this study, among all selected indicators, only x19 is identified as a negative indicator and is therefore processed using Formula (2), while all other indicators are classified as positive and are thus standardized using Formula (1). Here, denotes the province, denotes the indicator, and denotes the year. If the calculated value in the above formula equals zero, it is replaced by 0.00001. represents the observed value of the indicator for province in year .
- (2)
- Calculation of the proportion of each indicator:
- (3)
- Calculation of the entropy value of each indicator:
- (4)
- Calculation of the coefficient of variation:
- (5)
- Determination of the weight for each indicator:
- (6)
- Calculation of the comprehensive score:
Finally, the composite index of the digital trade development level is obtained by multiplying the standardized value of each indicator by its corresponding weight and then summing up the weighted results of all indicators. This index is a dimensionless relative value, where a higher value indicates a superior level of digital trade development for the respective province during the sample observation period.
4.2. Measurement Method of Green Total Factor Productivity
To capture dynamic changes in productivity while considering environmental constraints, this study employs the GML index introduced by Oh (2010) [32]. The GML index consists of efficiency change (GEC) and technological change (GTC).
In terms of indicator selection, we adopt an “input–desirable output–undesirable output” analytical framework. Following the approach of Hao et al. (2023) [33], labor, capital stock, and energy consumption are selected as input factors, regional Gross Domestic Product (GDP) is the desirable output, and emissions of industrial wastewater, sulfur dioxide, and solid waste are incorporated as undesirable outputs. The specific indicators and their units are presented in Table 2. Data are sourced from provincial statistical yearbooks.
Table 2.
Evaluation indicator system for green total factor productivity.
Regarding the methodology, we utilize DEA to construct the production frontier and calculate the efficiency and productivity indices. DEA is a non-parametric frontier analysis method suitable for evaluating efficiency with multiple inputs and outputs, as it does not require a pre-specified production function form, thereby avoiding the risk of model mis-specification. Slack variables are a core concept in DEA models. Their purpose is to measure the specific sources and magnitude of inefficiency present in the production process of a decision-making unit. The measurement process in this study involves three key steps:
- (1)
- Calculate the Slack-Based Measure (SBM) objective function:
Traditional DEA models like Charnes–Cooper–Rhodes (CCR) and Banker–Charnes–Cooper (BCC) fail to adequately capture the role of slack variables in efficiency assessment. To overcome this limitation, this study employs the non-radial SBM model advanced by Tone (2001) [31]:
This formula presents a Data Envelopment Analysis model for evaluating the comprehensive efficiency of decision-making units. The core efficiency score is determined by a ratio of two components: the numerator captures the waste of input resources, calculated as one minus the average proportion of input redundancy; the denominator captures the shortfalls in outputs, calculated as one plus the average proportion of output deviations, which incorporates both the shortfalls in desirable outputs and the excesses in undesirable outputs. All efficiency estimates fall within the [0, 1] range and directly reflect the level of performance, where 1 represents the optimum. In the model, denotes the amount of the -th input for the -th decision-making unit, represents the amount of the -th desirable output, and indicates the amount of the -th undesirable output. The slack variable measures the excess of the -th input compared to the minimum required by the production frontier, with a larger value indicating greater input waste. Correspondingly, captures the shortfall in the -th desirable output relative to the maximum achievable level, where a larger value signals more untapped potential and the need for efficiency improvements. Meanwhile, quantifies the excess of the -th undesirable output beyond the minimal attainable level, with a higher value reflecting more severe environmental pollution. Finally, is the number of input indicators, is the number of desirable output indicators, and is the number of undesirable output indicators. indicates that the model imposes variable returns to scale. The resulting SBM efficiency score is a unitless value between 0 and 1, where 1 indicates that the province is on the production frontier, i.e., fully efficient.
- (2)
- Calculate the distance functions:
To construct a comparable intertemporal productivity index, we need to measure the distance of each province in each period relative to a common benchmark—the global production possibility set. This is achieved by solving the directional distance function shown in Equation (10). In simpler terms, this function measures the gap between a province’s actual production point and the “global best practice” frontier formed by the optimal observations from all periods. A smaller gap (a value closer to 0) indicates that the province’s production technology is closer to the global optimum.
- (3)
- Calculate the Global Malmquist–Luenberger (GML) index:
The GML index measures the overall change in GTFP. A value greater than 1 indicates GTFP growth, a value equal to 1 indicates no change, and a value less than 1 indicates decline. Its value is typically positive.
GEC (efficiency change) captures the “catching-up effect” in relative technical efficiency, i.e., movement towards the production frontier. GEC > 1 indicates efficiency improvement, while GEC < 1 indicates efficiency deterioration.
GTC (technological change) captures the “innovation effect” from the outward shift in the production frontier itself. GTC > 1 indicates the occurrence of green technological progress, whereas GTC < 1 indicates technological regress.
4.3. Construction of the Empirical Model
4.3.1. Benchmark Model Setting
This paper employs a two-way fixed-effects model to assess how digital trade development influences GTFP. The specific econometric model is specified as follows:
Here, i and t refer to province and year. Accordingly, corresponds to the GTFP of province during year , while indicates the development level of province during year . The model incorporates an array of control variables, , to account for other potential influencing factors. Province fixed effects () absorb all time-invariant regional heterogeneity, while year fixed effects () account for common temporal shocks. The remaining unobserved factors are captured by the idiosyncratic error term .
Following the baseline estimation, a comprehensive set of empirical strategies are implemented to scrutinize the findings. These include robustness checks using alternative variable measurements and model specifications, heterogeneity analyses to explore differential effects across regions, and mechanism tests to identify the potential channels through which digital trade affects GTFP. The methodologies for these subsequent analyses will be detailed in their respective sections.
4.3.2. Variable Selection
(1) Dependent variable. For 30 Chinese provinces during the 2011–2023 period, GTFP is calculated via the SBM-GML model using provincial panel data. GTFP serves as a comprehensive indicator that reflects the synergy between economy and the ecological system, as it incorporates both desirable outputs, such as regional GDP, and undesirable outputs, including industrial pollution emissions. This measurement approach has been widely adopted in studies on green development and ecological efficiency [33]. In line with common practice, the GTFP for the base year (2011) is set to 1, and the values for subsequent years are calculated by cumulatively multiplying the annual GML indices, ensuring comparability across the panel.
(2) Core independent variable. Digital trade refers to a modern trade form powered by digital technologies and platform ecosystems, enabling cross-border flows and value creation in goods, services, and data. This paper constructs the digital trade development level (Dtrade) as a comprehensive index derived from nineteen secondary indicators across five dimensions: digital infrastructure, trade scale, growth potential, logistics environment, and institutional barriers. The entropy weight method is employed to integrate these indicators into a composite score, a widely adopted technique praised for its objectivity in evaluating complex socioeconomic systems. This multidimensional approach offers a holistic and comparable metric, crucial for systematically assessing how digital trade reshapes economic structures, stimulates innovation, and improves resource allocation, thus providing a robust empirical foundation for understanding its contribution to high-quality and sustainable economic growth.
(3) Mechanism variables. To empirically test the hypothesized transmission channels, several mechanism variables are introduced. Technological progress is proxied by innovation input (ini), quantified as the log value of R&D investment in above-scale industrial enterprises, and innovation output (ino), measured as the number of authorized green patents. Industrial structure greening is captured by energy intensity (ei), calculated as energy consumed per GDP unit, and carbon intensity (ci), measured by CO2 emissions per unit of GDP. Finally, economic development level (eco) is represented by the log value of per capita GDP to assess scale effects.
(4) Control variables. To mitigate potential estimation bias and bolster the model’s robustness, this study selects the following control variables, drawing on the research of [34,35,36,37]: urbanization rate (Urb), environmental regulation (Env), foreign direct investment (FDI), human capital level (Hum), and degree of fiscal intervention (Gover). Urbanization rate (Urb) is measured as the proportion of permanent urban residents to the total population and is used in logarithmic form. Environmental regulation (Env) is represented by expenditure on industrial pollution control relative to the output of the secondary sector. Foreign direct investment (FDI) is calculated as the ratio of actually utilized foreign direct investment to regional GDP. Human capital level (Hum) is measured by calculating student enrollment in regular tertiary institutions divided by the year-end resident population and is incorporated in logarithmic form. Fiscal intervention (Gover) is represented by the share of general-public budget expenditure in GDP.
5. Results and Discussion
5.1. Calculation Results of Digital Trade
The data on regional digital trade development levels (2011–2023) are provided in Table 3 and Appendix A. The average level for each province, as presented in Table 3, is calculated as the arithmetic mean of its annual digital trade composite index scores over the entire sample period from 2011 to 2023. This composite index is precisely constructed in Section 4. Specifically, the annual score for a province in a given year is derived by first normalizing each secondary indicator value, then multiplying it by its corresponding weight determined via the entropy weight method, and finally summing these weighted values across all indicators. To capture the long-term trend, the compound annual growth rate (CAGR, in %) is also reported, which is calculated by comparing the province’s final digital trade index value in 2023 with its initial value in 2011, deriving the average annual geometric growth rate over the 12-year period, and expressing it as a percentage. A higher CAGR indicates a faster pace of digital trade development during that period. The national average annual growth rate of 7.06% is derived by first calculating the compound annual growth rate (CAGR) for each of the 31 individual provinces over the period 2011–2023, and then computing the simple arithmetic mean of these 31 provincial CAGR figures.
Table 3.
Development level of digital trade in all regions of China.
The data in Table 3 show that the evolution of China’s digital trade from 2011 to 2023 was marked by sustained expansion, advancing at an average pace of 7.06% per year. However, the phenomenon of unbalanced and uncoordinated development among regions remains pronounced. In terms of the annual growth rate, the top three annual growth rates of digital trade are observed in Guizhou (10.16%), Qinghai (7.89%), and Shaanxi (7.89%); areas with the lowest growth rates are Heilongjiang (3.33%), Liaoning (3.45%), and Hainan (4.45%).
As shown in Appendix A, the regional digital trade development levels in 2023 reveal significant disparities. The top three levels of digital trade development in 2023 are observed in Guangdong (0.655), Beijing (0.523), and Zhejiang (0.432); the three areas with the lowest levels are Ningxia (0.062), Qinghai (0.066), and Gansu (0.082). A pronounced regional disparity is evident, with eastern coastal provinces leading significantly in digital trade development, a pattern attributable to their superior digital foundations, industrial structure, and policy support. These regions benefit from robust economic foundations, advanced technological capabilities, and greater openness, forming highly developed digital trade clusters. In contrast, the development levels of most central, western, and northeastern provinces lag behind the national average.
With the advancement of national strategies such as “Western Development” and “East Data West Computing”, the growth momentum of digital trade across the country’s central and western regions has surpassed that of the more developed eastern regions. For instance, Guizhou and Shaanxi have leveraged policy advantages to accelerate digital infrastructure construction and attract data-centric industries, resulting in rapid growth rates. In contrast, the growth in several eastern and northeastern provinces has moderated as their economies transition into a stage of high-quality, innovation-driven development, shifting focus from rapid expansion to structural optimization and technological upgrading.
5.2. Calculation Results of Green Total Factor Productivity
The results of calculating the green total factor productivity in 2011–2023 are shown in Table 4 and Figure 2. Based on Table 4 and Figure 2, it is clear that China’s provincial GTFP grew by approximately 9% from 2011 to 2023. This upward trajectory was strongly influenced by national policy cycles: growth was initially volatile during the 12th Five-Year Plan period, stabilized under the 13th Five-Year Plan’s structural reforms, and accelerated significantly following the 2020 “Dual Carbon” targets. This growth was overwhelmingly driven by technological progress (GTC), which increased by about 23%, while technical efficiency (GEC) declined by approximately 11%. This growing divergence highlights that while environmental regulations successfully stimulated green innovation, corresponding improvements in operational efficiency and resource allocation lagged behind, creating a significant bottleneck for sustainable productivity growth.
Table 4.
Provincial average GTFP and its decomposition.
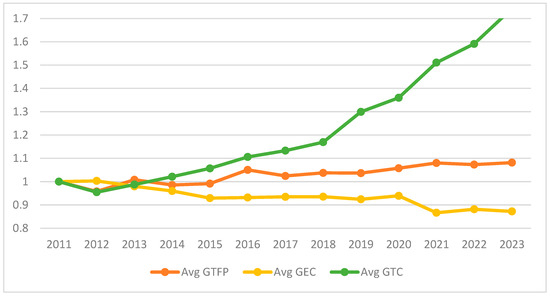
Figure 2.
National GTFP and its decomposition.
Based on the classification method following Shen et al. (2021) [38], 30 provinces in China are categorized into eastern, central, and western regions for analyzing the GTFP and its decomposition from 2011 to 2023. Figure 3, Figure 4 and Figure 5 show that the eastern region leads in GTFP growth (1.049), followed by the central (1.025) and western (1.013) regions. This hierarchy primarily stems from technological progress (GTC), where the eastern region demonstrates a substantial advantage (1.449) over the central (1.158) and western (1.051) regions. The eastern provinces generally exhibit higher GTC values, particularly in technologically advanced regions like Jiangsu and Guangdong. Conversely, technical efficiency change (GEC) shows an inverse trend, with the western region recording the highest efficiency (0.971), followed by the central (0.947) and eastern (0.892) regions. This pattern indicates that the eastern region’s growth is predominantly driven by technological innovation yet hampered by declining efficiency, potentially due to rapid technological adoption outpacing managerial and operational adaptations. The western region, while maintaining relatively better efficiency, suffers from slower technological advancement, reflecting a reliance on policy support rather than endogenous innovation. The central region strikes a middle ground, benefiting from industrial transfer and moderate technological progress. Future policies should therefore emphasize balanced strategies that not only foster green technology innovation but also address efficiency bottlenecks through improved resource allocation and institutional reforms.
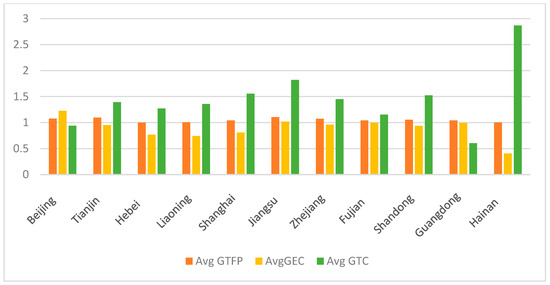
Figure 3.
GTFP and its decomposition index in the eastern region.
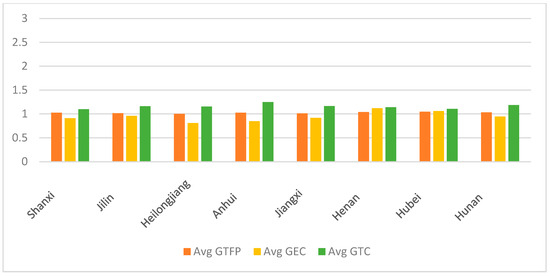
Figure 4.
GTFP and its decomposition index in the central region.
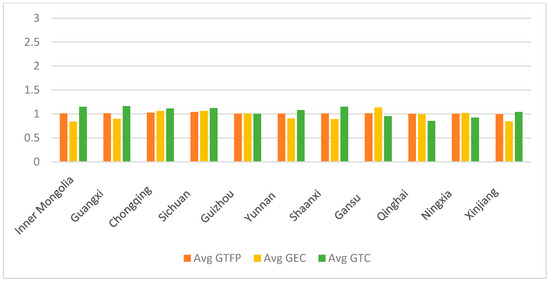
Figure 5.
GTFP and its decomposition index in the western region.
5.3. Basic Regression Results
This study first adopts a two-way fixed effects model to conduct a baseline regression analyzing the impact of digital trade on GTFP. As shown in Table 5, the coefficient for digital trade (Dtrade) ranges between 3.186 and 3.790 and remains statistically significant at the 1% level throughout, demonstrating that the advancement of digital trade significantly promotes regional GTFP.
Table 5.
Basic regression results.
As control variables are gradually introduced, the model’s goodness-of-fit improves progressively, and the core variable’s coefficient remains stable, further validating the robustness of the conclusion. Column (6) implies that a single-unit enhancement in digital trade predicts an average gain of 3.2 units in GTFP.
Regarding the control variables, Env exerts a considerable positive effect on digital trade; FDI and Hum show significant negative impacts. The coefficients for Urb and Gover are not statistically significant, suggesting a balanced net effect on GTFP.
5.4. Robustness Test
To address potential endogeneity, this study employs a 2SLS estimation using the lagged dependent variable as an instrumental variable. The instrumental variable regression results in Table 6 demonstrate the expected significant correlations between digital trade (Dtrade) and the selected instruments. Both the total express delivery volume (iv1, coefficient = 0.1574, p < 0.01) and one-period lagged digital trade (Dtrade_lag, coefficient = 0.7274, p < 0.01) show strong predictive power for current digital trade levels. Diagnostic tests confirm instrument validity, with the CD Wald F statistic (505.1) and KP Wald F statistic (360) substantially exceeding their respective critical values, while the LM statistic (76.49, p < 0.01) rejects the null hypothesis of weak identification. Furthermore, the Hansen J statistic (1.588, p = 0.208) supports instrument exogeneity. The 2SLS estimates reveal that after controlling for endogeneity, digital trade maintains a statistically significant positive effect on GTFP (coefficient = 4.2726, p < 0.01), confirming the robustness of this relationship.
Table 6.
2SLS regression.
To further verify the robustness of the benchmark regression, this study conducts additional tests by adopting alternative variable measurements. First, the globally measured GTFP under variable returns to scale is replaced by a non-globally measured GTFP, with the SBM GML index substituted by the SBM ML index. This modification relaxes the strong assumption of a single global technological frontier and examines the sensitivity of the results to this key modeling premise. As shown in column (1) of Table 7, digital trade continues to exhibit a significantly positive coefficient of 6.427 at the 1% level. The larger coefficient compared to the benchmark estimate of 3.186 suggests that digital trade may more effectively overcome inter-regional institutional barriers and exert stronger dual effects, namely technological catch-up and technological creation, within regional frontiers under the local GTFP framework.
Table 7.
Robustness tests.
Second, robustness is further assessed by refining the definition of the core explanatory variable. An augmented digital trade index is constructed by incorporating innovation-related dimensions, including technical service personnel, patent applications, and research and development expenditure, to better capture the role of innovation in digital trade. Additionally, e-commerce sales are used as an alternative proxy for digital trade, reflecting its core transactional dimension. Columns (2) and (3) of Table 7 present the results. The coefficient of the augmented digital trade index is 4.564, significant at the 1% level, confirming that innovation serves as a potent channel through which digital trade boosts green total factor productivity. When e-commerce sales are used, the coefficient remains positive and significant, though smaller in magnitude at 2.154, consistent with its narrower scope.
Finally, to mitigate concerns over potential subjectivity in manual weight assignment, we reconstructed the digital trade index using principal component analysis (PCA), a data-driven weighting method. The sample proved suitable for PCA (KMO = 0.856; Bartlett’s test, p < 0.001). We retained four principal components with eigenvalues exceeding one, which together account for 75.65% of the total variance; detailed results are provided in Table 8 and Table 9. The resulting PCA-based index derives its weights entirely from the covariance structure of the underlying indicators, offering a methodological contrast to the entropy weight approach. The regression results using this index, presented in column (4) of Table 7, yield a coefficient of 4.327 for digital trade, significant at the 1% level. This robust coefficient, slightly larger than the baseline estimate, likely arises because the PCA method filters out idiosyncratic noise from the original indicators and assigns weights based on their synergistic co-movements, potentially yielding a purer measure with a higher signal-to-noise ratio for the underlying digital trade effect. This finding not only reinforces the validity of our core conclusion but also suggests that the true impact of digital trade on green productivity might be even stronger than previously estimated. In all cases, the direction, significance, and economic implications align with the baseline findings, corroborating the robustness of the main conclusions.
Table 8.
KMO and Bartlett’s test results.
Table 9.
Principal component analysis—total variance explained.
5.5. Heterogeneity Analysis
This study further examines how the influence of digital trade varies spatially and temporally. The development landscape reveals a clear economic gradient between China’s eastern region and other regions. To examine potential regional disparities in digital trade’s impact on GTFP, we conduct a heterogeneity analysis following the regional classification by Shen et al. (2021) [38], dividing the sample into eastern provinces and the central–western region. The results are presented in columns (1) and (2) of Table 10. The analysis indicates significant regional divergence. In the eastern region, the digital trade coefficient is statistically insignificant (2.467), whereas in the central–western region, it is a significant and positive estimate of 3.988. This discrepancy may be attributed to two primary mechanisms.
Table 10.
Heterogeneous effects across different regions.
The observed regional heterogeneity stems from two inter-related mechanisms: differential marginal returns and varying degrees of structural alignment. First, the divergence arises from fundamental differences in regional development stages, which shape the marginal returns on digital trade integration [39]. As an early beneficiary of reform, the eastern region has undergone extensive digitalization and industrial upgrading, transitioning toward a technology- and service-intensive economic model [40,41]. Consequently, further expansion of traditional digital trade activities, such as e-commerce transaction volume, yields diminishing incremental gains in green productivity. The green transformation challenge in the east has shifted from basic digital adoption to the deep, systemic integration of advanced digital technologies like AI and IoT into complex production systems. This process is more capital- and innovation-intensive and is less directly correlated with trade volume metrics. In contrast, central and western regions are at an earlier stage of digital–industrial convergence [42]. Large-scale digital infrastructure investment and the introduction of digital trade platforms generate a strong “leapfrogging” or “catch-up” effect. These regions can directly absorb mature digital solutions and green practices into their developing industrial bases, bypassing older, more polluting technological stages. Thus, the same level of digital trade development produces a higher marginal impact on GTFP in these areas. Second, the heterogeneity reflects varying degrees of alignment between the capabilities enabled by digital trade and each region’s comparative advantages. Digital trade lowers transaction costs and connects local producers to broader markets. In central and western regions, where comparative advantages often lie in agriculture, resource processing, and specialized manufacturing, digital trade directly unlocks these latent potentials. It facilitates the branding and efficient distribution of agricultural products and enables specialized manufacturers to integrate into niche global value chains. This direct market linkage accelerates green upgrading by rewarding quality and sustainability standards. Conversely, the eastern region’s development model has pivoted toward high-end innovation, finance, and global headquarters functions. While digital trade remains essential, its primary role has evolved from providing market access for traditional goods to facilitating cross-border data flows, intellectual property trade, and high-value-added service delivery [43]. The green productivity gains from these advanced activities are more diffuse and longer-term. In summary, the stronger effect in central and western regions is not paradoxical but a logical outcome of their current development stage—characterized by higher marginal returns and better structural alignment. The statistical insignificance in the east suggests its transition to a more complex phase, where digital trade’s green contribution is mediated less by simple scale expansion and more by deeper technological innovation and systemic restructuring [44].
The “13th Five-Year Plan” launched in 2016, alongside the comprehensive implementation of the “Internet+” strategy, marked a significant advancement in China’s digital infrastructure. Using 2016 as a threshold, we divide the study period (2011–2023) into two phases for temporal heterogeneity analysis, with the results presented in columns (3) and (4) of Table 10. The analysis reveals distinct phase characteristics. The coefficient for digital trade was negative and statistically insignificant for the 2011–2015 period, but turned significantly positive for 2016–2023. In the earlier phase, digital trade was in a technology introduction stage, potentially reliant on energy-intensive infrastructure and squeezing out green innovation investment, thus temporarily suppressing GTFP [45,46,47]. Conversely, in the latter period, the expanding scale and deeper integration of digital trade with traditional industries fostered new business models. Furthermore, the establishment of regulatory frameworks such as negative lists and carbon footprint tracking enabled digital trade to exert a “digital carbon reduction multiplier effect” through disintermediation, reduced inventory waste, and green technology spillovers.
5.6. Mechanism Analysis
While the baseline regression establishes a significant relationship linking digital trade to GTFP, it is essential to investigate the specific transmission channels through which this effect materializes. The selection of mechanisms in this study is theoretically grounded in the inherent attributes of digital trade and its potential impacts on sustainable development. This analysis focuses on three plausible pathways: the technological innovation effect, acknowledging digital trade’s role in facilitating global knowledge spillovers and driving research and development activities; the green upgrading of industrial structure effect, as digital platforms can reshape global value chains and direct resources toward less carbon-intensive sectors; and the scale effect, considering the network externalities and agglomeration economies inherent to digital activities. To empirically test these pathways, we implement a mechanism test methodology, utilizing proxy variables for each channel and incorporating interaction terms to evaluate their mediating roles. Therefore, technological innovation is validated as a transmission channel, and research hypothesis H1 is supported.
Technological innovation effect. To examine the technological innovation channel, we employ innovation input (ini) and innovation output (ino) as proxy variables. The first two columns of Table 11 indicate that digital trade notably increases both innovation input (coefficient = 0.227, p < 0.01) and innovation output (coefficient = 0.834, p < 0.01). To directly test the moderating role of technological innovation, interaction terms between digital trade and the innovation proxies are introduced. The results in Columns (3) and (4) show positive and significant coefficients: 1.828 (p < 0.05) for Dtrade×ini and 4.853 (p < 0.10) for Dtrade × ino. This confirms that digital trade’s effect on GTFP is enhanced in contexts with higher innovation levels, validating technological innovation as a significant transmission channel [48].
Table 11.
Mechanism test: technological innovation effect.
Green upgrading of industrial structure effect. For the greening of industrial structure channel, energy intensity per unit of GDP (ei) and carbon emission intensity per unit of GDP (ci) serve as proxies. The first two columns of Table 12 demonstrate that digital trade significantly reduces both energy intensity (coefficient = −1.941, p < 0.01) and carbon emission intensity (coefficient = −1.017, p < 0.05). The interaction analysis in columns (3) and (4) reveals positive and significant coefficients of 0.736 (p < 0.05) for Dtrade × ei and 0.555 (p < 0.01) for Dtrade × ci. Given that ei and ci are inverse proxies for greening, these results indicate that the influence of an additional unit of digital trade on GTFP strengthens when energy or carbon intensity is lower, confirming the greening of industrial structure as a crucial mechanism [49,50,51]. Therefore, the green upgrading of industrial structure is validated as a transmission channel, and research hypothesis H2 is supported.
Table 12.
Mechanism test: industrial structure greening.
Scale effect. The scale effect is examined using the level of economic development (eco) as the proxy variable. Column (1) of Table 13 shows that digital trade significantly promotes economic development (coefficient = 0.909, p < 0.05). When testing the channel through interaction terms, column (2) shows a significantly positive coefficient of 2.158 (p < 0.01) for Dtrade × eco. This indicates that a one-unit increase in economic development level amplifies their marginal effect by 2.158 units, demonstrating that scale effects serve as an important transmission channel where network externalities and agglomeration economies strengthen digital trade’s positive impact. Therefore, the empirical results support that digital trade enhances GTFP through a positive scale effect, meaning that hypothesis H3a is validated.
Table 13.
Mechanism test: scale effect.
In summary, the mechanism tests confirm three distinct transmission channels. While the innovation output channel shows the largest coefficient magnitude (4.853), suggesting a potent multiplier effect between digital technology and green patents in highly innovative regions, its lower statistical significance indicates that this effect may be context-specific. In contrast, the scale effect demonstrates greater robustness with its highly significant coefficient (2.158), serving as a more universal core mechanism. The green upgrading of industrial structure effect, though statistically confirmed, exhibits a relatively smaller short-term impact, likely constrained by industrial rigidities [52,53,54]. Collectively, these findings reveal that digital trade enhances GTFP through simultaneous innovation stimulation, production pattern transformation, and economic scale amplification, with scale effects providing the most consistent foundation for green productivity gains. This hierarchy of mechanisms indicates that the green dividends of digital trade are fundamentally innovation-driven rather than purely scale-dependent [55]. In this sense, digital trade facilitates a transition from factor-driven growth to innovation-led sustainability by lowering the barriers to information exchange and optimizing resource allocation.
6. Conclusions and Policy Implications
6.1. Conclusions
This study systematically investigates the impact of digital trade on China’s GTFP from 2011 to 2023, providing robust empirical evidence on its role in promoting sustainable development and generating important implications for policy-making aimed at fostering green and high-quality economic growth in the digital era. The principal conclusions are as follows. First, digital trade in China exhibits robust growth but maintains a distinct east–central–west gradient, with eastern areas leading in absolute terms. Second, national green total factor productivity growth is driven primarily by technological progress rather than technical efficiency. Third, digital trade exerts a robust positive effect on provincial GTFP and serves as a structural force reshaping the production frontier and the allocation of green factors. Fourth, the promoting effect of digital trade displays significant spatiotemporal heterogeneity. Temporally, the effect turned significantly positive only after 2016, following an initial technology introduction phase. Spatially, the effect shows higher marginal benefits in central and western regions, offering a strategic pathway to bypass traditional carbon-intensive development trajectories for less-developed regions. Finally, the contribution of digital trade to GTFP operates primarily through technological innovation, followed by scale expansion and industrial green upgrading, indicating that digital trade facilitates a transition from factor-driven growth toward innovation-led and sustainability-oriented development. Taken together, these findings imply that digital trade should be understood as a long-term structural catalyst for green transformation rather than a short-term policy instrument.
6.2. Research Limitations and Future Prospects
Despite the rigorous approach adopted in this study, several limitations remain, which also point to directions for future research. First, this study primarily focuses on the direct relationship and mechanisms between digital trade and green productivity. Although key channels such as technological innovation have been verified, digital trade as an ecosystem may influence green transformation through broader, more indirect pathways (such as reshaping global value chain divisions, influencing consumer environmental preferences, or driving smart urban governance). These wider linkage mechanisms warrant further exploration in subsequent studies. Second, the micro-level simulation and assessment of the effects of specific digital trade policies, for example, data localization requirements or digital tariffs, represent a valuable frontier for future inquiry. Finally, the development of digital trade in China is deeply influenced by its unique industrial policies, market scale, and institutional environment, which may add a context-specific nature to the results. Future research could conduct cross-country comparative analyses to explore whether systematic differences exist in the green productivity effects of digital trade across nations with varying institutional backgrounds, development levels, and digital governance models, thereby refining more generalizable theoretical mechanisms.
6.3. Policy Implications
First, it is necessary to deepen the continued evolution of the digital economy and forge new competitive edges in digital trade. (1) Promote industrial transformation and upgrading. We recommend formulating phased roadmaps for integrating digital trade with green initiatives in key sectors, setting clear digitalization targets and energy consumption reduction indicators to ensure alignment with national strategies such as “Manufacturing Power” and “Dual Carbon.” Moreover, there is a need to establish collaborative demonstration systems for smart manufacturing and green production, and significantly increase the weight of energy-saving and emissions reduction criteria in lighthouse factory assessments [40]. Policies should support leading enterprises in adopting IoT and blockchain technologies to build zero-carbon supply chain, and develop digital trade eco-parks in pilot free trade zones and cross-border e-commerce comprehensive pilot areas that integrate green buildings and smart energy management. (2) Strengthen institutional safeguards. We recommend building a multi-level standard system covering technology, products, and management, with priority given to foundational methodologies such as carbon footprint accounting. It is necessary to introduce innovative green financial instruments and increase the share of government funding allocated to digital–green integration projects while supporting businesses in developing carbon finance products [41]. There is a need to establish a multidimensional policy evaluation mechanism that uses big data platforms to dynamically monitor economic, social, and environmental indicators in real time. (3) Enhance alignment with international trade rules. We recommend setting up cross-departmental task forces to track international digital trade rulemaking and proactively propose Chinese initiatives on digital–green trade in multilateral platforms. We need to accelerate the development of an internationally aligned certification system, promote mutual recognition of green standards, and build a national one-stop certification platform [56,57]. Pilot policies should aim to facilitate cross-border data flows and adopt international green standards in regions such as the Hainan and Shanghai Free Trade Ports, with the goal of establishing digital-enabled new energy facilities and international technology trading centers. Finally, there is a need to improve market-based allocation mechanisms for data factors, set up dedicated green data trading zones to foster professional services, and promote the application of big data in environmental monitoring and carbon accounting.
Second, we must bridge the regional digital divide and build a gradient-based collaborative development system. (1) It is necessary to establish a tiered regional coordination mechanism underpinned by differentiated policy supports. This involves creating a three-tiered structure of core leading zones, key development zones, and ecological conservation zones, with national-level institutions authorized to define dynamic zoning criteria. Within this framework, the eastern core zones will prioritize green technology R&D and alignment with international rules, piloting cross-border data flow mechanisms and establishing special zones for digital trade green innovation [58]. Central key development zones should accelerate the green–digital overhaul of conventional industrial sectors, supported by technological transformation subsidies and preferential green energy allocations for regional data centers. Western ecological zones will focus on realizing the value of ecological products, enhancing synergies between initiatives like the “East Data, West Computing” project and direct green electricity supply, and linking ecological compensation transfers to tangible outcomes in digital trade [39]. (2) To enhance cross-regional collaboration and resource mobility, a national platform for trading green digital factors should be constructed. This platform should integrate a technology patent library, talent mobility mechanisms, and carbon emission data sharing. The model of “Regional Collaborative Innovation Parks”, co-developed by advanced and less-developed regions, should be promoted, supported by special funds to facilitate the cross-regional flow of production factors. Furthermore, regional ecological compensation mechanisms should be upgraded to incorporate emission reduction achievements and technology exports into their accounting, complementing traditional fiscal transfers with diversified approaches such as technology transfer and project investment [59]. Additionally, low-cost digital–green transformation solutions should be systematically disseminated through national sharing platforms to ensure widespread adoption.
Third, there is a need to strengthen synergistic innovation between digital trade and green technologies. To fully leverage the mediating role of technological innovation in strengthening GTFP, a trinity support system integrating technology R&D, talent cultivation, and industrial application should be established to advance the green development of digital trade. (1) Advance core technology R&D through a dedicated fund for digital–green common technologies, prioritizing breakthroughs in AI-driven energy optimization and cross-border data rights confirmation [60]. National innovation centers should address critical areas such as low-carbon data centers using challenge-based mechanisms (“revealing the list and appointing the commander”), with outcomes accelerated through patent sharing pools accessible to central and western regions. (2) Enhance talent cultivation by implementing a digital–green skills integration plan, including micro-degree programs in cross-border carbon management at applied universities. Collaboration with major cross-border e-commerce platforms will develop practice-oriented courses, while a green technology diffusion fund will provide subsidies for technology adoption by small and medium-sized enterprises [42]. (3) Promote industrial application by encouraging well-funded cross-border e-commerce platforms to embed intelligent carbon management tools for automated compliance reporting. Fast-track IP review channels should be established to facilitate technology commercialization, with professional service organizations supporting businesses through technology assessment and transaction negotiation services.
Fourth, we should aim to accelerate the green transition of industrial structure and build an upgraded digital trade value chain system. (1) Introduce a Digital Trade Green Transformation Index for key sectors and implement a “Green Code” tiered management system for traditional export industries such as home appliances and textiles. Companies with high-grade Green Codes will enjoy benefits such as higher export tax rebates and subsidies for overseas warehouse leasing. It would be beneficial to pilot a Carbon Tariff Reserve system across key coastal centers anchored by Shanghai and Guangdong, guiding companies to set aside prepaid carbon tariff funds specifically for digital low-carbon upgrades [43]. (2) Encourage cross-border green consumption by issuing digital vouchers to overseas consumers who purchase products from high-Green-Code manufacturers via e-commerce platforms, with funds drawn from the Carbon Tariff Reserve account. We recommend launching a pilot certification system for green cross-border live streaming, offering platform traffic support to streams that demonstrate low-carbon operations, thereby fostering market leaders in green consumption. (3) Upgrade the physical infrastructure supporting the green development of digital trade. It is necessary to promote the installation of integrated photovoltaic and energy storage systems in overseas warehouses to achieve 24/7 green power supply. Zero-carbon-certified cross-border e-commerce industrial parks should be developed. Pilot programs for the cross-border trade of remanufactured goods within bonded maintenance centers should be explored as they can significantly reduce the carbon footprint over a product’s lifecycle [44]. In this way, a complete value cycle will be formed through these infrastructure upgrades and model innovations, encompassing green transformation in production, low-carbon operation in logistics, and market returns from consumption, thereby strengthening China’s competitive position in the global green value chain through digital trade.
Author Contributions
X.W.: conceptualization, investigation, writing—original draft; Q.Y.: data curation, formal analysis, methodology; Z.Z.: formal analysis, investigation, writing—review and editing. All authors have read and agreed to the published version of the manuscript.
Funding
This research is supported by the Shandong Provincial Natural Science Foundation (No. ZR2025QC745) and the National Social Science Fund of China (No. 24CJL038).
Data Availability Statement
The datasets used in this study are available from the corresponding author upon reasonable request.
Conflicts of Interest
The authors declare no conflicts of interest.
Appendix A
Table A1.
Measurement results of digital trade development level across Chinese provinces.
Table A1.
Measurement results of digital trade development level across Chinese provinces.
| Province | 2011 | 2012 | 2013 | 2014 | 2015 | 2016 | 2017 | 2018 | 2019 | 2020 | 2021 | 2022 | 2023 |
|---|---|---|---|---|---|---|---|---|---|---|---|---|---|
| Beijing | 0.225 | 0.240 | 0.259 | 0.305 | 0.378 | 0.366 | 0.422 | 0.448 | 0.491 | 0.520 | 0.488 | 0.535 | 0.523 |
| Tianjin | 0.102 | 0.104 | 0.103 | 0.113 | 0.110 | 0.112 | 0.114 | 0.137 | 0.161 | 0.179 | 0.131 | 0.148 | 0.158 |
| Hebei | 0.121 | 0.135 | 0.153 | 0.170 | 0.161 | 0.184 | 0.187 | 0.222 | 0.238 | 0.253 | 0.220 | 0.225 | 0.240 |
| Shanxi | 0.073 | 0.089 | 0.094 | 0.099 | 0.093 | 0.102 | 0.104 | 0.142 | 0.165 | 0.174 | 0.131 | 0.138 | 0.153 |
| Inner Mongolia | 0.052 | 0.059 | 0.061 | 0.068 | 0.063 | 0.069 | 0.076 | 0.096 | 0.121 | 0.134 | 0.086 | 0.085 | 0.101 |
| Liaoning | 0.126 | 0.135 | 0.150 | 0.159 | 0.171 | 0.149 | 0.153 | 0.171 | 0.196 | 0.202 | 0.158 | 0.179 | 0.189 |
| Jilin | 0.073 | 0.082 | 0.084 | 0.084 | 0.085 | 0.088 | 0.090 | 0.114 | 0.129 | 0.143 | 0.093 | 0.110 | 0.125 |
| Heilongjiang | 0.115 | 0.108 | 0.140 | 0.124 | 0.129 | 0.115 | 0.130 | 0.153 | 0.164 | 0.165 | 0.129 | 0.156 | 0.169 |
| Shanghai | 0.183 | 0.190 | 0.193 | 0.242 | 0.269 | 0.273 | 0.293 | 0.302 | 0.345 | 0.373 | 0.352 | 0.342 | 0.349 |
| Jiangsu | 0.190 | 0.203 | 0.217 | 0.227 | 0.254 | 0.264 | 0.283 | 0.331 | 0.389 | 0.393 | 0.350 | 0.385 | 0.388 |
| Zhejiang | 0.190 | 0.210 | 0.219 | 0.235 | 0.277 | 0.307 | 0.346 | 0.369 | 0.414 | 0.467 | 0.426 | 0.431 | 0.432 |
| Anhui | 0.086 | 0.089 | 0.098 | 0.112 | 0.129 | 0.124 | 0.147 | 0.176 | 0.194 | 0.223 | 0.192 | 0.198 | 0.212 |
| Fujian | 0.132 | 0.153 | 0.143 | 0.156 | 0.182 | 0.209 | 0.264 | 0.278 | 0.307 | 0.284 | 0.261 | 0.265 | 0.251 |
| Jiangxi | 0.071 | 0.082 | 0.087 | 0.087 | 0.109 | 0.100 | 0.117 | 0.144 | 0.160 | 0.175 | 0.145 | 0.146 | 0.155 |
| Shandong | 0.162 | 0.176 | 0.234 | 0.216 | 0.209 | 0.216 | 0.250 | 0.275 | 0.279 | 0.318 | 0.308 | 0.321 | 0.343 |
| Henan | 0.104 | 0.123 | 0.128 | 0.158 | 0.170 | 0.166 | 0.175 | 0.210 | 0.251 | 0.252 | 0.223 | 0.232 | 0.251 |
| Hubei | 0.108 | 0.115 | 0.130 | 0.153 | 0.161 | 0.172 | 0.170 | 0.196 | 0.209 | 0.236 | 0.184 | 0.202 | 0.217 |
| Hunan | 0.104 | 0.117 | 0.124 | 0.126 | 0.135 | 0.145 | 0.150 | 0.175 | 0.219 | 0.228 | 0.194 | 0.187 | 0.200 |
| Guangdong | 0.252 | 0.293 | 0.332 | 0.349 | 0.380 | 0.415 | 0.451 | 0.504 | 0.571 | 0.616 | 0.621 | 0.654 | 0.655 |
| Guangxi | 0.095 | 0.109 | 0.116 | 0.133 | 0.134 | 0.135 | 0.150 | 0.154 | 0.186 | 0.217 | 0.169 | 0.169 | 0.184 |
| Hainan | 0.086 | 0.081 | 0.106 | 0.109 | 0.113 | 0.111 | 0.115 | 0.141 | 0.156 | 0.191 | 0.118 | 0.128 | 0.144 |
| Chongqing | 0.085 | 0.101 | 0.109 | 0.118 | 0.130 | 0.148 | 0.138 | 0.160 | 0.191 | 0.228 | 0.174 | 0.196 | 0.199 |
| Sichuan | 0.099 | 0.110 | 0.126 | 0.134 | 0.151 | 0.167 | 0.174 | 0.210 | 0.239 | 0.257 | 0.209 | 0.223 | 0.228 |
| Guizhou | 0.034 | 0.040 | 0.045 | 0.053 | 0.057 | 0.059 | 0.065 | 0.093 | 0.134 | 0.147 | 0.092 | 0.093 | 0.108 |
| Yunnan | 0.052 | 0.057 | 0.070 | 0.079 | 0.079 | 0.075 | 0.091 | 0.113 | 0.146 | 0.160 | 0.097 | 0.091 | 0.104 |
| Shaanxi | 0.048 | 0.058 | 0.064 | 0.077 | 0.076 | 0.079 | 0.099 | 0.114 | 0.143 | 0.151 | 0.112 | 0.103 | 0.116 |
| Gansu | 0.040 | 0.039 | 0.050 | 0.051 | 0.054 | 0.053 | 0.058 | 0.090 | 0.111 | 0.122 | 0.066 | 0.069 | 0.082 |
| Qinghai | 0.027 | 0.030 | 0.036 | 0.043 | 0.042 | 0.046 | 0.045 | 0.081 | 0.105 | 0.129 | 0.055 | 0.053 | 0.066 |
| Ningxia | 0.028 | 0.033 | 0.035 | 0.039 | 0.041 | 0.045 | 0.046 | 0.078 | 0.103 | 0.115 | 0.052 | 0.049 | 0.062 |
| Xinjiang | 0.058 | 0.054 | 0.068 | 0.064 | 0.063 | 0.064 | 0.064 | 0.073 | 0.105 | 0.138 | 0.076 | 0.078 | 0.097 |
References
- USITC. Digital Trade in the U.S. and Global Economies, Part 1; Publication 4415; United States International Trade Commission: Washington, DC, USA, 2013. [Google Scholar]
- USITC. Digital Trade in the U.S. and Global Economies, Part 2; United States International Trade Commission: Washington, DC, USA, 2014. [Google Scholar]
- González, J.L.; Ferencz, J. Digital Trade and Market Openness; OECD Trade Policy Papers, No. 217; OECD Publishing: Paris, France, 2018. [Google Scholar]
- Ma, S.; Shen, Y. Digital Trade and the Restructuring of Global Economic and Trade Rules. Int. Econ. Rev. 2023, 4, 118–138. [Google Scholar]
- Yang, M.; Liu, Y.; Wang, J.; Tang, X. How Does Digital Trade Development Affect Carbon Emissions? Evidence from China. Econ. Anal. Policy 2025, 85, 1475–1491. [Google Scholar] [CrossRef]
- Ministry of Commerce of the People’s Republic of China. China Digital Trade Development Report 2025; Ministry of Commerce of the People’s Republic of China: Beijing, China, 2025. [Google Scholar]
- Soto, G.H.; Zambrano-Monserrate, M.A.; Usman, O. Tariffs and the Transition: A Study on the Effects of Global Trade on Energy Mix Diversification. Energy Policy 2026, 210, 115003. [Google Scholar] [CrossRef]
- Ma, S.; Fang, C.; Liang, Y. Digital Trade and Its Era Value and Research Prospects. Int. Trade Issues 2018, 10, 16–30. [Google Scholar]
- Li, Y.; Wang, Z. Digital Trade Facilitation and GVC Restructuring: Implications for Manufacturing Upgrading in Developing Countries. Financ. Res. Lett. 2025, 86, 108413. [Google Scholar] [CrossRef]
- Wen, X. Research on the Measurement of the Development Level of China’s Provincial Digital Economy and Its Temporal and Spatial Differentiation Based on the AHP-Entropy Weight Method. SHS Web Conf. 2025, 215, 01008. [Google Scholar] [CrossRef]
- Ali, M.I.; Rahaman, M.A.; Ali, M.J.; Rahman, M.F. The Growth–Environment Nexus amid Geopolitical Risks: Cointegration and Machine Learning Algorithm Approaches. Discov. Sustain. 2025, 6, 78. [Google Scholar] [CrossRef]
- Soto, G.H.; Martinez-Cobas, X. Does Outward Foreign Direct Investment and the Green Transition Affect Renewable Energy Penetration among European Union Countries? Renew. Energy 2025, 241, 122306. [Google Scholar]
- Wan, T.; Lan, Q. Does Digital Trade Promote China’s Manufacturing Industry Upgrading? Based on Structure Rationalization Perspective. Econ. Change Restruct. 2024, 57, 218. [Google Scholar]
- Chen, K.; Xie, J. Digital Trade and Corporate ESG Performance—Evidence from China. Int. Rev. Econ. Finance 2025, 103, 104417. [Google Scholar] [CrossRef]
- Li, P.; Li, X.; Wu, Q. Digitalization Drives Sustainability: How Digital Trade Enhances Corporate ESG Performance through Innovation, Internationalization and Transparency. Int. Rev. Econ. Finance 2025, 101, 104248. [Google Scholar] [CrossRef]
- Ma, H.; Kang, C. The Impact of US-style Digital Trade Rules on Digital Services Trade between China and CPTPP Member Countries. Technol. Soc. 2025, 83, 103040. [Google Scholar] [CrossRef]
- Li, Z.; Lee, G.; Raghu, T.S.; Shi, Z. Impact of the General Data Protection Regulation on the Global Mobile App Market: Digital Trade Implications of Data Protection and Privacy Regulations. Inf. Syst. Res. 2025, 36, 669–689. [Google Scholar] [CrossRef]
- Wen, J.; Hai, H.; Zhang, Y.; Chen, Z.; Li, L. Does Digital Transformation Impact Green Total Factor Productivity? Evidence from National Big Data Comprehensive Pilot Zones in China. Econ. Anal. Policy 2025, 86, 2207–2221. [Google Scholar] [CrossRef]
- Qian, J.; Zhou, Y.; Hao, Q. The Effect and Mechanism of Digital Economy on Green Total Factor Productivity—Empirical Evidence from China. J. Environ. Manage. 2024, 372, 123237. [Google Scholar] [CrossRef]
- Liu, H.; Yuan, P.; Dong, X. How Does the Digital Economy Affect Green Total Factor Productivity? -Based on the Urban Cluster Perspective. Econ. Change Restruct. 2025, 58, 79. [Google Scholar] [CrossRef]
- Li, X. Study on the Impact of the Digital Economy on Green Total Factor Productivity in Agriculture. J. Econ. Manag. Sci. 2025, 8, 54. [Google Scholar] [CrossRef]
- Li, L.; Jiang, S.; Lin, Y. The Impact of the Digital Economy on Sustainable Fisheries: Insights from Green Total Factor Productivity in China’s Coastal Regions. Sustainability 2025, 17, 2673. [Google Scholar] [CrossRef]
- Liu, X. Analysis of the Impact of Digital Financial Development on Green Total Factor Productivity and Its Spatial Spillover Effects. J. Appl. Econ. Policy Stud. 2025, 18, 104–122. [Google Scholar] [CrossRef]
- He, Z.; Liu, X.; Deng, Z. Spatial-temporal Differences and Influencing Factors Analysis of Coupling Coordination Development among Digital Economy, Green Finance, and Total Factor Carbon Productivity. Sustain. Futures 2025, 7, 101371. [Google Scholar] [CrossRef]
- Feng, Z.X.; Duan, D.Y. Evaluation of Digital Trade Development Index and Analysis of Influencing Factors: Based on Panel Data from 49 Countries. J. Beijing Univ. Technol. (Soc. Sci. Ed.) 2022, 22, 100–117. [Google Scholar]
- Cang, Y.M. The Coupling and Synergistic Relationship and Dynamic Evolution between Provincial Digital Trade and Business Environment. J. Commer. Econ. 2025, 9, 129–132. [Google Scholar]
- Zhang, Z.R.; Zhang, J.H. Research on the Coupling and Synergistic Development of Regional Technological Innovation and Digital Trade. J. Zhejiang Sci-Tech Univ. (Soc. Sci. Ed.) 2024, 52, 263–272. [Google Scholar]
- Ma, Y.P.; Shuang, H.J. Research on the Spatio-temporal Evolution Characteristics of the Coupling Coordination Degree between Digital Trade and Green Logistics. J. Commer. Econ. 2023, 12, 67–71. [Google Scholar]
- Li, R.S.; Duan, L.J.; Zhu, Y.Z. Construction and Measurement of the Digital Trade Indicator System in Zhejiang Province. China J. Commer. 2024, 2, 5–11. [Google Scholar]
- Yu, S.H.; Du, Z.Z.; Zhao, Y.Y. Research on the Impact of International Digital Service Trade Restrictive Measures on the Digital Transformation of Manufacturing: An Analysis Based on the OECD Digital Service Trade Restrictiveness Index. Price Theory Pract. 2022, 8, 164–168. [Google Scholar]
- Tone, K. A Slacks-based Measure of Efficiency in Data Envelopment Analysis. Eur. J. Oper. Res. 2001, 130, 498–509. [Google Scholar] [CrossRef]
- Oh, D. A Global Malmquist-Luenberger Productivity Index. J. Prod. Anal. 2010, 34, 183–197. [Google Scholar] [CrossRef]
- Hao, A.; Tan, J.; Ren, Z. Research on the Impact of Economic Agglomeration on Green Total Factor Productivity Based on the Perspective of Spatial Spillover. China Econ. Stud. 2023, 5, 181–196. [Google Scholar]
- Gao, D.; Tan, L.; Chen, Y. Unlocking Carbon Reduction Potential of Digital Trade: Evidence from China’s Comprehensive Cross-border E-Commerce Pilot Zones. SAGE Open 2025, 15, 21582440251319966. [Google Scholar] [CrossRef]
- Wang, C.; Meng, F.; Liu, T. The Impact of Digital Trade Development on China’s Export of Technology-intensive Products: Evidence from Importing Countries. PLoS ONE 2025, 20, e0321285. [Google Scholar] [CrossRef] [PubMed]
- Dai, S.; Tang, D.; Li, Y.; Lu, H. Digital Trade, Trade Openness, FDI, and Green Total Factor Productivity. Int. Rev. Financ. Anal. 2025, 97, 103777. [Google Scholar] [CrossRef]
- Zhu, H.; Bao, W.; Qin, M. Impact Analysis of Digital Trade on Carbon Emissions from the Perspectives of Supply and Demand. Sci. Rep. 2024, 14, 14540. [Google Scholar] [CrossRef]
- Shen, X.B.; Chen, Y.; Lin, B.Q. The Impact of Technological Progress and Industrial Structure Distortion on China’s Energy Intensity. Econ. Res. J. 2021, 56, 157–173. [Google Scholar]
- Wang, X.; Safi, A.; Wang, S.; Zhang, Y. How Does Carbon Market React to Economic Policy Uncertainty and Oil Price Shocks? New Evidence from a Time-varying Perspective. Int. Rev. Econ. Financ. 2026, 105, 104841. [Google Scholar] [CrossRef]
- Wang, X.Q.; Wang, K.; Xu, B.; Jin, W. Digitalisation and Technological Innovation: Panaceas for Sustainability? Int. J. Prod. Res. 2025, 63, 6071–6088. [Google Scholar] [CrossRef]
- Liang, C.Y.; Chen, Z.Y. The Impact of Digital Economy on Total Factor Productivity of China’s Service Industry. J. Financ. Res. 2021, 5, 90–101. [Google Scholar]
- Wang, X.; Wang, J.; Wang, K.; Umar, M. How Does Carbon Trading Market Promote Green Technology Innovation? Econ. Innov. New Technol. 2025, 2025, 1–20. [Google Scholar] [CrossRef]
- Wang, J.L.; Li, Y.; Wang, W.L.; Wu, H. How Does Digital Transformation Drive Green Total Factor Productivity? Evidence from Chinese Listed Enterprises. J. Clean. Prod. 2023, 406, 136954. [Google Scholar] [CrossRef]
- Agan Celik, B. Advancing the Sustainable Development Goals Through the Green Openness Index: Evidence From Environmental and Macroeconomic Dynamics in China. Sustain. Dev. 2026. [Google Scholar] [CrossRef]
- Wang, Y.; Cui, S. Deepening Digital Intellectual Property Rules and Digital International Patenting. Econ. Lett. 2025, 251, 112312. [Google Scholar] [CrossRef]
- Xu, L.; Tanamee, D.; Romprasert, S. Does Digital Village Construction Promote Agricultural Green Total Factor Productivity? An Empirical Study Based on China’s Provincial Panel Data. Economies 2025, 13, 85. [Google Scholar] [CrossRef]
- Liang, M.; Chen, H. Digital Economy Development, Regional Openness, and High-Quality Foreign Trade. Finance Res. Lett. 2025, 81, 107469. [Google Scholar] [CrossRef]
- Wang, X.; Wang, K.H.; Safi, A.; Umar, M. How Is Artificial Intelligence Technology Transforming Energy Security? New Evidence from Global Supply Chains. Oecon. Copern. 2025, 16, 15–38. [Google Scholar] [CrossRef]
- Xu, T.; Xuan, S.; Xuan, X. Green Finance as a Catalyst for Energy Transition: Green Total Factor Productivity and Digital Economy. Int. Rev. Financ. Anal. 2025, 107, 104647. [Google Scholar] [CrossRef]
- Ou, X.; Zhao, W.; Zheng, Z.; Mohiuddin, M. Towards Green Trade: Digital Economy and Export Quality of Green Products. Res. Int. Bus. Financ. 2025, 75, 102777. [Google Scholar] [CrossRef]
- Wang, X.Q.; Qin, C.; Liu, Y.; Tanasescu, C.; Bao, J. Emerging Enablers of Green Low-carbon Development: Do Digital Economy and Open Innovation Matter? Energy Econ. 2023, 127, 107065. [Google Scholar] [CrossRef]
- Gu, J.F.; Zhang, K.; Li, K.C. Exploring the Mechanism of the Impact of Green Finance and Digital Economy on China’s Green Total Factor Productivity. Int. J. Environ. Res. Public Health 2022, 19, 16303. [Google Scholar] [CrossRef]
- Tang, M.; Jiang, L.; Mao, Y.; Cao, L. Does the Depth of Digital Trade Rules Promote Bilateral Value Chain Cooperation? Int. Rev. Financ. Anal. 2025, 99, 103952. [Google Scholar] [CrossRef]
- Wang, X.; Jin, W.; Xu, B.; Wang, K. Volatility in Carbon Futures Amid Uncertainties: Considering Geopolitical and Economic Policy Factors. J. Futures Mark. 2025, 45, 308–325. [Google Scholar] [CrossRef]
- Charnes, A.; Cooper, W.W.; Rhodes, E. Measuring the Efficiency of Decision Making Units. Eur. J. Oper. Res. 1978, 2, 429–444. [Google Scholar] [CrossRef]
- Wen, J.; Mahmood, H.; Khalid, S.; Zakaria, M. Nexus between Digital Economy and Environmental Sustainability in BRICS: Does Green Innovation Matter? Bus. Strat. Environ. 2025, 34, 5386–5400. [Google Scholar] [CrossRef]
- Shah, M.A.H.; Ximei, W. Innovating for Sustainability: Exploring the Synergy between International Digital Trade, Appeal Mechanisms, Renewable Energy, and Economic Growth on Ecological Footprint in BRICST Economies. Environ. Dev. Sustain. 2024, 1–20. [Google Scholar] [CrossRef]
- Yeerken, A.; Deng, F. Digital Service Trade and Labor Income Share—Empirical Research on 48 Countries. Sustainability 2023, 15, 5468. [Google Scholar] [CrossRef]
- Gao, S.; Li, Z. Trade Policy Uncertainty, Financing Constraints, and Firm Innovation: Evidence from China. J. Knowl. Econ. 2025, 16, 8929–8960. [Google Scholar] [CrossRef]
- Afolabi, J.A.; Fatai, B.O. Unlocking Trade Locks in Landlocked Developing Countries (LLDCs) in Africa: The Role of Digital Infrastructure. Telecommun. Policy 2026, 50, 103101. [Google Scholar] [CrossRef]


Disclaimer/Publisher’s Note: The statements, opinions and data contained in all publications are solely those of the individual author(s) and contributor(s) and not of MDPI and/or the editor(s). MDPI and/or the editor(s) disclaim responsibility for any injury to people or property resulting from any ideas, methods, instructions or products referred to in the content. |
© 2026 by the authors. Licensee MDPI, Basel, Switzerland. This article is an open access article distributed under the terms and conditions of the Creative Commons Attribution (CC BY) license.