Abstract
This study explores how green finance development (GF) promotes forest ecological–economic efficiency (FEEE), and identifies its underlying mechanisms and key determinants. Using panel data for 11 prefecture-level cities in Zhejiang Province from 2011 to 2022, the core area of China’s Green Finance Reform and Innovation Pilot Zone, this study employ mediation, moderation, and panel threshold models to empirically examine the impact and transmission pathways of GF. The results indicate that GF significantly enhances FEEE, mainly through technological progress, industrial structure upgrading (ISU), and industrial structure ecologization (ISE). Environmental regulation (ER) exerts a dominant negative effect on efficiency improvement, while a substitution effect exists between GF and ER. The heterogeneity analysis shows that direct GF plays a more pronounced role in improving efficiency compared with indirect GF. The threshold analysis further reveals that the impact of GF on FEEE is non-linear. Specifically, the marginal effect of GF on FEEE diminishes beyond a certain threshold, while its positive effect strengthens once the levels of ISE and ISU surpass their respective thresholds. These findings contribute to the theoretical understanding and policy design of GF in fostering ecological civilization.
1. Introduction
Achieving harmony between economic growth and ecological sustainability has become a defining challenge of the twenty-first century. Globally, the depletion of natural assets and the degradation of ecosystem services have intensified the tension between development and environmental capacity [1,2]. In response, green development has emerged as a transformative paradigm that seeks to balance ecological protection with economic prosperity, echoing the principles of the Paris Agreement and the United Nations Sustainable Development Goals [3,4]. Many countries have explored mechanisms such as Payments for Ecosystem Services (PES), natural capital accounting, and market-based conservation instruments to promote the sustainable use of ecosystem services and enhance their ecological and economic performance. In recent years, increasing policy attention worldwide has focused on the role of financial instruments in supporting development pathways that generate positive outcomes for ecosystems and natural capital [5]. In China, green development has been elevated to a national strategy aimed at integrating ecological civilization construction, technological innovation, and industrial upgrading to promote high-quality and sustainable growth [6,7].
In this context, GF can be understood as a set of market-based financial instruments and institutional arrangements that steer capital toward activities with clear environmental benefits and support the coordinated achievement of ecological protection and economic development objectives. It facilitates the internalization of environmental externalities, mitigates financing constraints in ecological industries, and improves the allocation efficiency of capital across green sectors [8,9]. When financial incentives are designed to support environmental goals, GF can stimulate green innovation, guide industrial restructuring, and facilitate the enhancement of ecological–economic efficiency [10,11,12]. The forestry sector occupies a particularly important position in this process. Forest ecosystems provide a range of ecosystem services, including carbon sequestration, biodiversity conservation, and recreational services, which underpin both ecological sustainability and forestry-related economic activities [13,14]. Forest ecosystem services are often considered “quasi-public goods” due to their non-rivalrous and non-excludable nature, meaning they are often under-supplied by market forces. This characteristic increases the role of green finance in facilitating the efficient use of these services and in incentivizing private sector involvement in sustainable forest management [15]. Improving FEEE, defined as the efficiency with which forestry systems optimize their ecological and economic outputs within the bounds of ecological constraints, is therefore aligned with global efforts to promote sustainable forest management and green development [16]. However, due to the quasi-public good characteristics of forest ecosystem services, challenges such as long investment cycles, unclear property rights, and limited financing remain common across regions, particularly in areas with limited access to GF [17,18].
GF serves as both a catalyst and an enabling mechanism for overcoming these barriers. GF instruments guide capital toward low-carbon and resource-efficient projects, encouraging technological innovation and the ecological transformation of industries [16,19]. Empirical evidence from multiple countries demonstrates that green financial development can increase productivity, reduce emissions, and support sustainable industrial upgrading [20,21,22]. From a theoretical standpoint, the nexus between GF and FEEE can be interpreted through endogenous growth theory and the Porter hypothesis, both of which posit that appropriate financial and regulatory incentives can foster innovation and efficiency rather than constrain growth [23,24]. By alleviating capital constraints and encouraging green innovation, GF enhances firms’ absorptive capacity and facilitates resource reallocation toward cleaner industries [25]. These mechanisms are particularly salient in the forestry sector, where externalities and financing limitations hinder the FEEE [26].
Zhejiang Province provides a representative context for examining this relationship, having pioneered financial-ecological integration through institutional innovation, a broad range of financial instruments, and mature ecological industries. With its high forest coverage and relatively advanced forestry development, Zhejiang has pioneered financial–ecological integration through institutional innovation and a broad range of green financial instruments. This makes it an ideal setting for investigating how GF development is associated with improvements in FEEE. However, although the economic and environmental consequences of GF have been widely discussed, evidence on its role in improving FEEE remains limited, particularly in the context of complex transmission mechanisms and conditional effects [27].
Accordingly, this study empirically evaluates how GF affects FEEE in Zhejiang Province. By integrating mediation, moderation, and threshold models, the study aims to uncover the transmission mechanisms and conditional effects underlying this relationship. Specifically, it investigates whether technological empowerment and industrial structure optimization mediate the influence of GF on FEEE, and whether ER plays a moderating role. This study adds to the existing literature in three respects: (1) it provides new empirical evidence from a leading pilot zone for green finance reform in China; (2) it clarifies the channels through which GF is related to improvements in ecological–economic efficiency in forestry systems; and (3) it offers policy implications for improving the synergy between financial innovation, environmental governance, and sustainable forestry development.
2. Theoretical Framework and Research Hypotheses
2.1. Relationship Between GF and FEEE
As a rapidly evolving branch of sustainable finance and an important tool for modern environmental governance, GF embodies the integration of economic efficiency and ecological sustainability, aligning with the principles of ecological modernization theory, and provides an institutional basis for improving FEEE [28,29]. GF promotes the sustainable use of ecological resources while fostering both environmental performance and industrial competitiveness [25]. It functions as a pivotal tool for reconciling economic growth and ecological protection. In this framework, GF is characterized by several major functions, which provide the foundation for understanding its contribution to FEEE: (1) Optimization of resource allocation. According to resource allocation theory [30,31], efficient capital distribution is fundamental to productivity improvement. GF can channel financial resources toward ecological industries, mitigating capital market failures in environmental investment [32,33]. Policy-based green credit and bond mechanisms provide funding for forest protection, restoration, and sustainable management, effectively correcting resource misallocation and enhancing ecological and economic efficiency [34]. (2) Promotion of technological progress. From the perspective of endogenous growth theory [35], GF encourages enterprises to increase investment in green technologies by introducing environmentally oriented credit constraints. Consistent with the Porter Hypothesis, appropriately designed ER can induce innovation and enhance both productivity and environmental outcome [23]. Furthermore, by internalizing environmental externalities, GF mechanisms address market failures and create a “reverse pressure” effect that incentivizes polluting firms to adopt cleaner technologies [7]. (3) Industrial structure optimization. By steering capital toward low-carbon, efficient, and eco-friendly sectors, GF fosters structural upgrading within the forestry industry. Instruments, including green bonds and green funds, promote the reallocation of production factors toward high-value-added green segments, thereby reducing the environmental burden of traditional industries [36]. This process contributes to an improved balance between ecological protection and industrial efficiency. (4) Enhancement of price discovery. With the inclusion of forest carbon sinks, eco-tourism, and other ecological products into market systems, GF facilitates the formation of standardized trading assets. Financial instruments such as carbon credits and ecological futures help reveal market prices, improve the liquidity of ecological assets, and support mechanisms for improving ecological–economic efficiency through more efficient resource allocation [37]. (5) Operational and organizational efficiency enhancement. Through a broad range of green financial instruments, such as green credit, insurance, certification, and policy-backed loans, GF enhances the comprehensive FEEE across production, processing, and marketing stages by easing financing constraints and improving resource allocation efficiency [38]. Supported by digital platforms and information technology, these mechanisms help alleviate information asymmetry, improve transparency, and strengthen market credibility, thereby facilitating more efficient organizational and operational practices within forest-based industries. (6) Environmental protection incentive mechanism. GF incorporates environmental performance into credit assessment and investment decision systems, thereby embedding environmental incentives and compliance requirements into firms’ financing conditions. Financial institutions restrict lending to high-pollution, high-energy-consumption activities while favoring projects that meet environmental standards and green financing criteria [38]. By embedding environmental requirements into financing conditions, this incentive–constraint mechanism encourages firms to improve environmental management practices, comply with regulatory standards, and adopt cleaner production processes, thereby contributing to improvements in operational efficiency and sustainability within forest-based industries.
Furthermore, the relationship between GF and FEEE is unlikely to be strictly linear. As financial development deepens, the marginal contribution of GF on FEEE may diminish, suggesting the possibility of threshold or nonlinear effects [39,40]. To visualize the proposed relationships, this study outlines the conceptual framework in Figure 1.
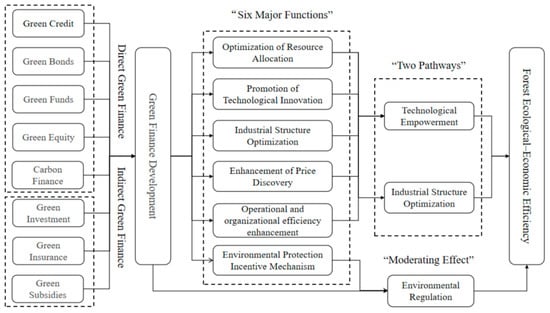
Figure 1.
Theoretical framework of the impact of GF on FEEE.
Drawing on the preceding theoretical discussion, this study formulates the following hypotheses:
H1.
The GF can significantly enhance FEEE.
H2.
The effect of GF on FEEE exhibits a nonlinear pattern, with the effect either diminishing or strengthening at different levels of GF and other relevant factors.
2.2. The Role of Technological Empowerment in Enhancing FEEE Through GF
According to the new economic growth theory [35,41], improving overall industrial efficiency fundamentally depends on technological progress and enhanced technical efficiency. As technology advances, the GF can support innovation and technology adoption, enabling the positive effects of technological progress to offset the negative effects of declining technical efficiency. ER policies compel enterprises to enhance innovation and adopt green technologies, thereby improving FEEE.
GF promotes the application of advanced technologies such as remote sensing monitoring, the Internet of Things, and big data analytics in the forestry sector, enhancing forest resource management efficiency and ecological monitoring capabilities, and expanding the supply base of high-quality ecological products [42]. Technological progress and substitution break the equilibrium of traditional forestry economies and, through resource allocation optimization, cost reduction, innovation-driven development, and supply–demand matching, systematically enhance the operational efficiency and production capacity of forest-based industries [25].
Technological empowerment also facilitates market expansion and production scale growth for forestry enterprises, leveraging the scale effects of the digital economy to drive industrial development [43]. Moreover, technological advancement accelerates the efficient flow of production factors across forestry sectors, promoting new products, new business models, and industrial upgrading. Through technology diffusion and application, GF not only enhances operational and production efficiency in the forest ecological industry but also contributes to environmental protection, playing a crucial role in modern forestry management. Based on this, the following hypothesis is proposed:
H3.
The GF can enhance FEEE through technological empowerment.
2.3. The Role of Industrial Structure Optimization in Enhancing FEEE Through GF
Industrial structure serves as a bridge for resource allocation and plays an irreplaceable role in both environmental protection and economic growth. According to the Petty–Clark theorem, the reallocation of production factors toward sectors with higher productivity and more efficient resource use can generate a “structural dividend” that enhances overall economic efficiency [44,45]. Within the framework of green development, GF functions as a strategic instrument that directs capital flows toward low-carbon and resource-efficient sectors, supporting the ecological transformation of industries [9,10]. Consequently, optimizing industrial structure through green financial mechanisms can significantly enhance FEEE by strengthening the alignment between financial capital and ecological productivity [6]. (1) Capital reallocation. GF redirects capital flows from high-pollution, resource-intensive industries toward cleaner and more efficient sectors, thereby increasing the financing costs of polluting enterprises and incentivizing industrial upgrading and ecological transformation [40]. By integrating environmental performance into credit risk assessments, financial institutions can guide market resources toward sustainable industries, promoting structural transformation and reducing ecological externalities [32]. (2) Industrial integration. To gain competitive advantages and meet green development standards, enterprises increasingly reallocate resources toward environmentally friendly industries, creating regional clustering effects that enhance technological spillovers and industrial synergy [23]. Such green industrial agglomeration facilitates the integration and upgrading of related sectors, forming eco-industrial networks that improve both productivity and ecological efficiency [40]. (3) Economic leverage. GF exerts a “structural leverage” effect through differential credit policies. By restricting loans to high-energy-consuming or high-emission firms, reducing their credit ratings, and recalling noncompliant loans, GF accelerates industrial restructuring and green mergers, driving systemic transformation toward cleaner production and higher value-added sectors [7]. This reallocation mechanism transforms traditional industries while enabling the growth of green sectors, reinforcing a balanced relationship between environmental goals and economic performance [46]. (4) Industrial structure ecologicalization. GF promotes industrial structure ecologicalization, the embedding of ecological principles into production and consumption systems, thereby improving both the capital allocation efficiency and the ecological benefits of financial investment [25]. A higher degree of industrial structure ecologicalization reduces environmental pressure and strengthens the beneficial spillovers from GF, and strengthens the linkage between financial support and ecological value creation [9]. This virtuous interaction between finance, industry, and ecology constitutes an essential mechanism through which GF enhances FEEE. The hypothesis is stated as follows:
H4.
The development of GF can enhance FEEE through industrial structure optimization.
2.4. The Role of ER in Enhancing FEEE Through GF
ER consists of laws, policies, and standards formulated by governments to protect the environment, control pollution, safeguard public health, and promote sustainable development [47]. Its impact on FEEE operates in either direction, yielding positive or negative outcomes [48]. On the positive side, the “compensation effect” and “competition effect” are the two main channels through which regulation can enhance efficiency. The Porter Hypothesis suggests that well-designed ER can stimulate enterprises to step up in green technologies and cleaner production, thereby offsetting compliance costs and improving competitiveness [23,49]. In the forestry sector, moderate regulation encourages firms to innovate in resource utilization, waste reduction, and eco-friendly production, improving both environmental performance and industrial efficiency. By promoting technological upgrading and fostering a green competitive environment, ER can thus act as a catalyst for improving FEEE.
However, excessive or poorly designed regulation may lead to a “crowding-out effect”. As compliance costs increase, firms are forced to divert resources from R&D and productivity-enhancing investments to meet environmental requirements, resulting in resource misallocation and efficiency loss [50]. Overly stringent regulation can also raise production costs, weaken competitiveness, and discourage foreign investment [51]. Furthermore, when the cost of green innovation exceeds the penalty for pollution, firms may rationally opt to incur pollution charges instead of investing in green technologies, which weakens the overall regulatory effect. The hypothesis is stated as follows:
H5a.
ER has a non-linear effect on FEEE, and the direction of its impact depends on whether its positive or negative effects dominate.
Within GF-related settings, ER serves as a key external institutional factor, exerting both “substitution” and “complementary” moderating effects [25]. The substitution effect occurs when excessively strict regulations prompt firms to engage in rent-seeking or avoidance behaviors to circumvent compliance costs [52], thereby weakening the effectiveness of green financial allocation. Conversely, overly lax regulation may reduce policy continuity and enforcement, diminishing firms’ incentives to pursue green transformation and decreasing demand for green credit.
The complementary effect arises when ER provides a solid legal and policy foundation for the operation of GF. Well-calibrated regulation can guide financial institutions to integrate environmental risk considerations into credit assessments and investment decisions, fostering synergy between financial markets and environmental governance [53]. In such cases, GF and ER jointly promote industrial upgrading and ecological efficiency, forming a virtuous cycle of financial and ecological sustainability.
H5b.
ER moderates the impact of GF on FEEE, and this moderating effect may manifest as either a “substitution effect” or a “complementary effect”.
3. Research Design
3.1. Model Construction
3.1.1. Baseline Regression Model
This study establishes a baseline regression model to examine the impact of GF on FEEE [6,25]. The model is specified as follows:
where denotes the forest ecological–economic efficiency in city during year ; represents the level of green finance development; is a vector of control variables; is the constant term; and are the coefficients of GF and control variables, respectively; and capture the city and year fixed effects; and denotes the random disturbance term.
3.1.2. Panel Threshold Regression Model
To further examine whether the impact of GF on FEEE exhibits nonlinear characteristics [39], this study employs a panel threshold regression model, which is specified as follows:
where denotes the threshold variable, and is an indicator function that equals 1 if the condition in parentheses is satisfied, and 0 otherwise. The current model describes a single-threshold case; however, if the empirical results indicate the presence of multiple significant threshold values, the model can be extended to a multiple-threshold framework [34]. is the constant term, and represent the coefficients of GF under different threshold regimes, and captures the effects of control variables. The remaining symbols are consistent with those in Equation (1).
3.1.3. Mediation and Moderation Effect Models
To investigate the channels through which GF affects FEEE, this study incorporates both mediation and moderation effect models. Following established empirical approaches [12,54], the mediating mechanisms are first identified by regressing the potential mediating variables on GF, as specified below:
where represents the mediating variables; is the constant term; and denote the coefficients of GF and control variables, respectively; and the remaining variables are consistent with those defined in Equation (1). Furthermore, to examine whether the effect of GF on FEEE varies with the intensity of ER, a moderation effect model is constructed as follows:
where denotes the moderating variable, capturing the strength of ER. The coefficient of the interaction term () indicates whether ER amplifies (“complementary effect”) or weakens (“substitution effect”) the influence of GF on efficiency improvement. is the constant term; , and represent the coefficients for GF, ER, and control variables, respectively; and other parameters are consistent with those in Equation (1).
3.2. Variable Selection
3.2.1. Dependent Variable
Forest ecological–economic efficiency (FEEE). Following Wang et al. (2023) [38], this study measures FEEE using an input–output efficiency evaluation framework. However, compared with previous studies on FEEE in Zhejiang Province, this study introduces an important methodological refinement. Specifically, while previous studies typically included both material product values and ecological service values in the input indicators, material product values are excluded from the total forest ecological product input in order to avoid potential double counting, since material products are already reflected in the value added of the primary forestry sector. Therefore, the input indicators focus exclusively on regulating ecosystem service values and cultural service values. The physical quantities of ecosystem services are first estimated using the InVEST model (v3.10.2, Integrated Valuation of Ecosystem Services and Tradeoffs), with specific modules applied to estimate different ecological services. For example, water conservation, carbon sequestration, and soil conservation values are derived using the corresponding InVEST modules [13,14]. Their monetary values are calculated based on the Technical Specification for the Accounting of Gross Ecosystem Product (GEP) for Terrestrial Ecosystems [3]. All price-related indicators are converted to constant 2015 prices using the Consumer Price Index (CPI) deflator to ensure intertemporal comparability. The input–output indicator system used to measure FEEE is summarized in Table 1.

Table 1.
Input–output indicator system of FEEE.
To ensure methodological transparency and reproducibility, this study employs the Super-efficiency Slacks-Based Measure combined with the Malmquist Productivity Index (Super-SBM–Malmquist) model to estimate FEEE [16,17]. The model captures both static efficiency and dynamic productivity changes over time. The empirical estimation is implemented using MaxDEA Ultra software (v8.0). Based on this approach, FEEE is calculated for 11 prefecture-level cities in Zhejiang Province from 2011 to 2022. It should be noted that the FEEE metric in this study primarily captures the positive contributions of forest ecosystem services and does not directly account for potential negative externalities, such as production relocation to other regions, forest degradation elsewhere, and associated social and economic costs (i.e., leakage effects). These negative externalities are difficult to quantify with available data and were therefore not included in the empirical analysis [19]. Nevertheless, within the context of Zhejiang Province, the Super-SBM–Malmquist approach provides a relatively robust and reproducible measure of FEEE. Furthermore, the generalizability of the results to other regions or international contexts may be limited, given differences in policy frameworks, forest management practices, and ecological–economic conditions. These limitations and potential implications are further discussed in Section 5.5, highlighting the need for caution when extrapolating findings beyond the studied context.
3.2.2. Core Explanatory Variable
Green finance development (GF). To enhance the sectoral relevance of the GF indicator system, this study constructs a sector-specific conversion framework that adjusts different types of green financial instruments according to their effective forestry-related shares [16,25]. The conversion ratios for green credit, green bonds, and green insurance are determined based on national forestry finance data, international green investment practices, and existing empirical studies. These ratios are then subjected to rigorous validation using a sensitivity analysis approach to assess the robustness of the results and reduce any arbitrariness. Specifically, the conversion ratio for green credit is set at approximately 1%, based on forestry-related green credit estimates in the literature and official forestry finance statistics. The conversion ratio for green bonds and green funds is set at 3%, reflecting the international practice that 1%–5% of green investment portfolios are allocated to forestry-related projects, as observed in institutions such as the European Investment Bank (EIB) and the World Bank. This range is consistent with established norms in green finance, where forestry-related investments typically account for a modest share of overall green investment portfolios. The median value of 3% is adopted to balance the global range, reflecting the relative scale of forestry in green finance while taking into account its unique environmental benefits and financial challenges. For green insurance, forestry-related risks (such as forest fires, pests, and diseases) typically represent 1%–3% of the total green insurance capital. This study adopts a 2% conversion ratio, which reflects the typical share of forestry-related risks in green insurance portfolios, based on industry standards and available data. The specific calculation methods for each indicator are presented in Table 2.
Table 2.
Indicator system for the level of GF.
3.2.3. Mechanism Variables
Technology empowerment (Tec): It is measured using the degree of technological progress, which reflects the production efficiency of local firms and facilitates a rational reallocation of resources between polluting and environmentally friendly firms. Following existing studies [55], technological progress is proxied by the ratio of the number of authorized patent applications to GDP.
Industrial structure optimization (ISO). It is captured from three dimensions: industrial structure sophistication (ISS), industrial structure ecologization (ISE), and industrial structure upgrading (ISU). ISS represents the movement of an economy from low-end to high-end activities, typically reflected in the shift from primary–secondary industries toward tertiary-industry dominance [56]. The calculation is shown in Equation (5):
where denotes the degree of industrial structure sophistication, is the added value of industry and is the total industrial output. A higher value indicates a higher level of industrial sophistication.
Industrial structure ecologization (ISE). Following prior research [57], ISE is measured by constructing an environmental efficiency indicator reflecting pollutant emissions per unit of GDP. The calculation is shown in Equation (6):
where represents the average pollutant emissions intensity per unit of GDP, used to comprehensively assess environmental efficiency (The pollutant emissions in this study are measured using industrial particulate matter emissions, industrial sulfur dioxide emissions, and industrial nitrogen oxide emissions, all expressed in units of 10,000 tons); represents emissions of pollutant type per unit of GDP; and is the number of pollutant categories included. A higher value indicates higher pollutant emissions per unit of output, whereas a lower PI corresponds to better performance and thus a higher ISE.
Industrial structure upgrading (ISU). ISU contributes to the transition of traditional industries toward low-carbon and GF, enhances resource allocation efficiency, and ultimately improves FEEE [58]. ISU is measured by the combined share of secondary and tertiary industry value added in regional GDP.
Environmental regulation (ER). Following related studies [59], the intensity of ER is measured using textual data from local government work reports. Specifically, ER is proxied by the frequency of environmentally related keywords as a share of the total number of words in the report [59]. This indicator serves as a proxy for the level of attention and policy commitment that local governments allocate to environmental governance and regulatory enforcement. While it does not directly capture enforcement mechanisms such as inspections, penalties, or compliance standards, it provides an indirect measure of the extent to which environmental issues are prioritized in governmental agendas. Despite its limitations, this proxy remains a valid and useful tool for assessing the policy focus on ER in the absence of more detailed enforcement data.
3.2.4. Control Variables
(1) Economic development level (Lnpgdp). It is measured using regional GDP per capita, expressed in logarithmic form. Economic development generally affects both the financial capacity for environmental investment and the technological base for industrial upgrading [60,61]. (2) Degree of openness (Open). Foreign direct investment (FDI) exerts both pollution-related and technology spillover effects on host regions. It is measured by the ratio of actual utilized FDI to regional GDP, with FDI converted into RMB using the annual average USD-RMB exchange rate [51]. (3) Urbanization level (Urban). Urbanization generates structural changes in population distribution, economic activities, and social development, which may significantly influence FEEE [62]. Urbanization is captured by the proportion of the urban population in the total permanent resident population at year-end. (4) Development of the tertiary industry (Third). An increase in the share of the tertiary sector is one of the channels through which GF enhances FEEE [63]. This variable is measured by the share of tertiary industry value added in GDP. (5) Government intervention (Gov). Fiscal expenditures on public infrastructure improve regional transportation and communication conditions and, through subsidies, support the relocation and upgrading of polluting enterprises. Such interventions may contribute to improving FEEE [64]. It is measured by the ratio of local government expenditure to GDP. (6) Ecological environmental quality (Ecol). A sound ecological environment is a fundamental prerequisite for the development of forest ecological industries. Ecological environmental quality is represented by a comprehensive ecological quality index. The raw raster data are obtained from the National Earth System Science Data Center, and municipal-level panel data are generated through zonal statistical processing [3,7].
3.3. Data Sources
The data for this study are drawn primarily from the Zhejiang Statistical Yearbook (2011–2023), the statistical yearbooks of 11 prefecture-level cities in Zhejiang Province, and the Forestry Statistical Yearbook of the Zhejiang Provincial Forestry Administration. The remote-sensing and ecological function datasets used for measuring FEEE are sourced as follows: Water conservation data are obtained from the National Meteorological Science Data Center. Carbon sequestration and oxygen release data are from the Resource and Environmental Science Data Center of the Chinese Academy of Sciences. Soil retention data are derived from Wuhan University’s annual 30 m resolution land-use dataset. Climate regulation data are sourced from the National Meteorological Data Center. Descriptive statistics of all variables are presented in Table 3.
Table 3.
Descriptive statistics of variables.
4. Empirical Results
4.1. Baseline Regression Results
Table 4 reports the baseline regression results for the effect of GF on FEEE. Column (1) presents the baseline estimates without control variables, while Column (2) incorporates economic development, industrial structure, urbanization, fiscal expenditure, and other relevant controls. The estimated coefficients of GF remain significantly positive in both specifications, indicating that GF effectively enhances FEEE. After introducing the control variables, the absolute magnitude of the coefficient decreases slightly but remains significantly positive at the 5% level. Meanwhile, the R2 value increases appreciably, suggesting that the inclusion of control variables strengthens the model’s explanatory power and robustness. To further assess the reliability of the multivariate regression results, a multicollinearity diagnostic is conducted using the variance inflation factor (VIF). The results show that the mean VIF value is 2.44, which is well below the conventional threshold of 10 and the more conservative threshold of 5. This indicates that multicollinearity is not a serious concern in this study and that the estimated coefficients are reliable.
Table 4.
Baseline regression results.
In Column (2), the estimated coefficient of GF is 1.5443. Holding other conditions constant, a 1% increase in GF is associated with a 1.5443% improvement in FEEE. This evidence indicates that GF not only alleviates financing constraints and directs green capital to efficient segments of the forestry industry chain, but also optimizes resource allocation, stimulates technological innovation, and expands green market demand, thereby improving ecological–economic performance and FEEE, reflecting the principles of resource allocation theory and endogenous growth theory. Moreover, this aligns with the externality-internalization mechanism in environmental economics, which posits that policy measures like GF help internalize environmental externalities by incentivizing firms to adopt more sustainable practices.
A growing body of empirical evidence supports the positive role of GF in improving ecological industry efficiency. For example, the establishment of GF reform and innovation pilot zones significantly enhances firms’ investment efficiency and improves capital allocation structures [25,65]. Green credit policies also mitigate financing constraints and incentivize green technological innovation, thereby promoting resource-use efficiency [17]. Furthermore, GF fosters the optimization of capital structures in ecological industries and accelerates the development of green industrial value chains [11,66]. Accordingly, hypothesis H1 is empirically supported.
4.2. Mechanism Correlation Evidence
To deepen the understanding of how GF affects FEEE, this study explores the potential mechanisms through which GF influences FEEE. Specifically, we analyze the role of technological empowerment, industrial structure optimization, and ER as mechanisms linking GF to FEEE. The results are summarized in Table 5, where Columns (1)–(4) present the mediating roles of technological empowerment and industrial structure optimization, and Column (5) reports the moderating role of ER.
Table 5.
Regression results of the underlying mechanisms.
Column (1) in Table 5 shows that the coefficient of GF on technological progress is 2.1181, statistically significant at the 1% level. This indicates that GF promotes technological progress, which subsequently enhances FEEE. This is consistent with endogenous growth theory, which suggests that technological innovation is a key driver of long-term economic and environmental performance. A possible explanation is that technological progress optimizes resource allocation and production processes through more efficient resource management, improved production technologies, and reductions in waste emissions. These improvements enhance ecological product production efficiency and value realization. Accordingly, Hypothesis H3 is supported.
Columns (2)–(4) show heterogeneous correlation effects of GF across different dimensions of industrial structure optimization. The coefficient of GF on ISS is 0.2147, which is not statistically significant. In contrast, the coefficients for ISU (2.8555) and ISE (3.2627) are both statistically significant at the 1% level. This suggests that GF is more strongly correlated with improvements in FEEE through ISU and ISE, rather than ISS. A plausible explanation is that ISS focuses on shifting towards more technology and capital-intensive sectors, which may not be aligned with the ecological characteristics and resource endowments specific to the forest ecological industry. In contrast, ISU and ISE focus on ecological compatibility, sustainable development, and low-carbon transitions, aligning with resource allocation theory and environmental policy mechanisms. GF channels capital towards environmentally friendly and high-efficiency sectors by offering financial incentives such as green credit and green bonds, encouraging firms to adopt cleaner production methods, increase technological content, and reduce environmental impact. Furthermore, ISE helps reduce pollution emissions and improve ecological productivity by enhancing environmental efficiency, which resonates with the externality-internalization mechanism in environmental economics, where policy interventions help internalize environmental costs. These findings provide empirical support for Hypothesis H4.
Column (5) in Table 5 reveals that the coefficient of ER on FEEE is −1.4404 and significant at the 5% level. This indicates that ER has a significant negative effect on efficiency improvement. One explanation is that many enterprises still operate under low-cost strategies; for example, enterprises may reduce production costs by relying on production processes that are cheaper but have greater environmental impacts, or by using outdated technologies with lower efficiency and higher resource consumption. Thus, stringent ERs fail to stimulate green technological innovation and instead increase compliance costs, constraining production efficiency. Additionally, ER may suffer from insufficient enforcement or a lack of targeted, differentiated policy design, thereby reducing its overall effectiveness. These findings support Hypothesis H5a.
Furthermore, the estimated interaction coefficient between GF and ER is −0.4810, statistically significant at the 1% level. This suggests that the positive correlation between GF and FEEE is moderated by ER, with stricter regulation potentially reducing the effectiveness of GF in enhancing FEEE. This demonstrates a “substitution effect” between GF and ER. A possible explanation is that effective GF requires a complementary, well-designed ER. When ER is overly stringent or poorly implemented, it may dampen the effectiveness of green financial instruments by increasing enterprise compliance costs, reducing financing needs, and limiting green investment opportunities. This may hinder industrial restructuring, restrict capital flows, and ultimately reduce efficiency enhancement. Therefore, the evidence indicates that ER partially substitutes for green finance in improving efficiency, which supports Hypothesis H5b.
4.3. Robustness and Endogeneity Tests
4.3.1. Robustness Tests
To verify the reliability of the baseline estimates, four robustness checks are conducted. First, an alternative measurement of the core explanatory variable. The principal component analysis (PCA) method is adopted to reconstruct the GF index as an alternative to the entropy-weighted index used in the baseline regression. In this specification, financial development is proxied by the ratio of outstanding loans of financial institutions to GDP. The results for this alternative measurement are presented in Column (1) of Table 6. Second, additional control variables are introduced. This aims to capture potential omitted factors that may simultaneously affect GF and FEEE. Given the crucial role of infrastructure in shaping ecological product value realization, infrastructure development is added as an extended control variable, measured by the ratio of road mileage to land area. The results shown in Column (2) of Table 6. Finally, the estimation method is changed. A generalized method of moments (GMM) estimator is employed to address potential endogeneity concerns. AR (1) and AR (2) tests on the differenced residuals are conducted: AR (1) is significant (4.6443, p < 0.05) while AR (2) is not (z = −0.3812, p > 0.05), indicating the absence of second-order autocorrelation and supporting the validity of the instruments. The Sargan test of overidentifying restrictions is not significant (p = 1.000), confirming that the instruments are valid. These results are presented in Column (3) of Table 6.
Table 6.
Robustness and endogeneity regression results.
As reported in Table 6, the regression coefficients remain stable in sign, magnitude, and significance across all robustness checks, confirming that the main conclusions are not sensitive to alternative model specifications or variable definitions and thus exhibit strong robustness and explanatory validity.
4.3.2. Endogeneity Tests
To address potential endogeneity concerns, such as omitted variables and reverse causality, this study adopts a natural experiment design based on the Difference-in-Differences (DID) approach. Specifically, the study exploits the introduction of green finance policy reforms in Quzhou and Huzhou in 2017 as pilot regions, leveraging temporal and spatial variation to isolate the causal effect of GF on FEEE. This quasi-experimental design helps mitigate concerns about reverse causality and unobserved heterogeneity across regions, providing a more reliable causal inference. This quasi-experimental design enables a comparison between the treatment regions (Quzhou and Huzhou) and non-treatment regions, helping to control for unobserved heterogeneity and reverse causality, thereby providing a more reliable causal inference.
The results from the DID estimation are presented in Column (4) of Table 6. These results show a significant positive impact of green finance policy reforms on FEEE in the pilot regions, providing evidence that GF contributes to improving FEEE. By using the DID approach, the study is able to control for both observed and unobserved heterogeneity, effectively addressing endogeneity concerns. Moreover, the DID estimates align with the results from other robustness checks, further strengthening the credibility of the causal relationship between GF and FEEE.
4.3.3. Sensitivity Analysis
To test the robustness of the findings, a series of sensitivity analyses was conducted with respect to both the time period and the conversion ratios used to adjust GF indicators for forestry relevance [67]. First, a time period sensitivity analysis examined how the impact of GF on FEEE changed before and after the introduction of green finance policies in Zhejiang Province. Specifically, the pre-reform period (2011–2016) was compared with the post-reform period (2017–2022), when green finance policies were actively implemented. Second, the sensitivity of the results to different conversion ratios for green bonds and green funds was tested. The conversion ratio was initially set at 3% (the median value), and alternative ratios of 1% and 5% were examined to assess the impact of different ratios on the results. The results of the sensitivity analysis are shown in Table 7.
Table 7.
Sensitivity analysis results.
For time periods: The positive impact of GF on FEEE is statistically significant in both the pre-reform and post-reform periods, suggesting that green finance policies continue to enhance FEEE even after their introduction. For conversion ratios: The impact of GF on FEEE remains consistent when using both the 1% and 5% conversion ratios. This demonstrates that the results are not significantly sensitive to the choice of conversion ratio, enhancing the robustness of our findings.
Overall, these sensitivity tests confirm the reliability of our conclusions, showing that the impact of GF on FEEE is stable across different time periods and conversion ratio settings.
4.4. Financial Structure Heterogeneity
Given that different green financial instruments exhibit heterogeneous effects on the improvement of FEEE, the role of financial structure cannot be overlooked. Based on the definition of GF provided above, this study divides GF development into two dimensions, direct GF and indirect GF, to further examine how structural heterogeneity in GF affects FEEE. Both dimensions are constructed as composite indices using the entropy method. The direct GF dimension primarily includes financial support provided to green industries, projects, and environmental protection measures through direct financial instruments or market-based activities, such as green credit, green bonds, green funds, green equity, and carbon finance. The core feature of these dimensions is that capital flows directly and transparently to green economic activities, thereby promoting green industrial development and environmental improvement. For example, green credit and green investment directly provide financing to green enterprises and projects; green bonds channel funds to projects related to energy conservation, emission reduction, and clean energy; and green funds and green equity directly guide market-based capital flows toward environmentally friendly sectors.
In contrast, the indirect GF dimension contributes to green development through policy support, risk management, and market regulation. It includes dimensions such as green investment, green insurance, and green support. Although such financial activities do not directly finance green projects, they promote green development by supporting the green transformation of traditional industries or by providing long-term financial support. For instance, green insurance facilitates green economic development by offering risk management for environmental projects and enterprises, while green support—through fiscal expenditures and policy incentives—indirectly guides the economic system toward a greener development path.
The regression results are reported in Table 8. Column (1) shows that the coefficient for direct GF is 0.3368 and statistically significant at the 1% level, indicating that a one-unit increase in direct GF increases FEEE by 0.3368 units. Column (2) shows that the coefficient for indirect GF is 0.1483 and statistically significant at the 10% level, indicating that a one-unit increase in indirect GF increases FEEE by 0.1483 units. These results suggest that both direct and indirect GF significantly enhance FEEE, but the effect of direct GF is more pronounced. A possible explanation is that direct GF is characterized by greater precision in capital allocation and greater efficiency in market-based resource distribution. Through instruments such as green credit and green bonds, direct GF can rapidly and accurately support core projects in the forest ecological industry, significantly improving resource utilization efficiency and project implementation progress, thereby fostering faster gains in industrial performance. In contrast, indirect GF, such as green insurance and fiscal support, mainly promotes industrial development through long-term policy guidance and risk management, and its effects typically require longer periods to materialize. Moreover, direct GF relies on market mechanisms, ensuring greater flexibility in capital allocation and quicker responsiveness to the needs of ecological industries, whereas indirect GF depends more heavily on government intervention, which may involve administrative delays and procedural constraints. Therefore, direct GF tends to generate more immediate improvements in FEEE, while the effects of indirect GF are more closely associated with long-term institutional optimization and sustained ecological protection.
Table 8.
Results of regression analysis on financial structure heterogeneity.
4.5. Panel Threshold Effects
Based on the preceding analysis, GF exerts a significantly positive effect on FEEE. However, this impact may display non-linear characteristics depending on the levels of GF, ISE, and industrial structure optimization. To further test these potential non-linearities, this study employs a panel threshold regression model. First, the existence of threshold effects is examined using the Bootstrap method, with 500 repeated resamples to estimate the threshold values and their significance for each potential threshold variable. The results are presented in Table 9. The estimated single threshold for GF is significant at the 1% level, with a threshold value of 0.4256. For the level of ISE, both single and double thresholds pass significance tests at the 5% level, with corresponding threshold values of 1.6780 and 1.8459. Similarly, the single and double thresholds for ISU are significant at the 10% level, with threshold values of 0.9438 and 0.9471, respectively. These results indicate that the presence of non-linear effects is statistically supported.
Table 9.
Threshold effect test results.
This study further constructs a panel threshold regression model, in which the level of GF is specified as a single threshold variable, and the levels of ISE and ISU are specified as double threshold variables. This allows an empirical examination of the nonlinear relationship between GF and FEEE. The threshold regression results are reported in Table 10.
Table 10.
Regression results of the threshold effect model.
The Wald F statistics of Columns (1)–(3) are all significant, indicating the presence of structural heterogeneity in the effect of GF on FEEE. Specifically, Column (1) uses the level of GF as the threshold variable. When GF is at or below the threshold value of Th1 ≤ 0.4256, its promoting effect on FEEE reaches 1.8741. When GF exceeds the threshold (Th1 > 0.4256), the effect decreases to 1.6770. These results suggest that although the positive effect of GF remains significant beyond the threshold, its marginal contribution becomes weaker.
Column (2) incorporates the level of ISE as the threshold variable. When the level of ISE meets the conditions Th2 ≤ 1.6780 and 1.6780 < Th2 ≤ 1.8459, the effects of GF on FEEE are 0.0491 and 0.5403, respectively, but neither is statistically significant. However, when the level of ISE exceeds the second threshold (Th2 > 1.8459), the effect rises to 0.9874 and becomes significant at the 10% level. This indicates that the impact of GF depends on the degree of ISE, and only when the ISE level surpasses the required threshold can GF effectively enhance FEEE.
Column (3) uses the level of ISU as the threshold variable. When the level of ISU satisfies Th3 ≤ 0.9438, GF improves FEEE by 1.6387, which is significant at the 5% level. When the level of ISU falls within the range 0.9438 < Th3 ≤ 0.9471, the effect increases to 1.7683. Once the level of ISU exceeds the second threshold (Th3 > 0.9471), the spillover effect further rises to 1.8104 and becomes significant at the 1% level. These results show that the impact of GF depends on the degree ofISU, and the positive effect gradually strengthens as the upgrading level improves. Taken together, the empirical findings provide strong support for Hypothesis H2.
5. Discussion
5.1. Summary of Key Findings
This study provides robust empirical evidence that GF significantly enhances FEEE in Zhejiang Province, one of China’s pioneering regions for GF reform. This finding is broadly consistent with prior research emphasizing that green financial policies can improve ecological efficiency, support environmental governance, and promote the sustainable transformation of ecological industries [11,16,56]. The results extend existing evidence by showing that the mechanisms through which GF affects ecological outcomes in general ecosystems are also applicable and highly relevant to the forestry sector, which is characterized by high ecological value, long production cycles, and strong public-good attributes [3,6].
5.2. Mechanisms: How GF Enhances FEEE
- (1)
- Financial resource allocation and capital attraction. The positive effect of GF on FEEE is largely attributable to its ability to correct capital market distortions and direct financial flows toward ecological industries. Prior studies emphasize that green credit, green bonds, and preferential credit policies reduce financing constraints for ecological restoration and eco-industries [22,68]. By incorporating environmental criteria into investment decisions, GF increases the cost of capital for high-emission sectors and channels credit toward sustainable forestry, eco-tourism, and biodiversity conservation. This reallocation effect aligns with findings that green financial instruments enhance total factor productivity and stimulate ecological investment in pilot areas [58,69]. In the context of Zhejiang, where ecological industries are prominent, capital inflow amplified resource utilization efficiency and accelerated ecological product development.
- (2)
- Technological empowerment and green innovation. Technological progress is a critical path through which GF enhances FEEE. Existing literature indicates that GF supports technological innovation by providing targeted incentives for green R&D, digital technologies, and ecological monitoring [34,70]. Studies also show that financial support increases firms’ willingness to adopt energy-efficient and pollution-reducing technologies [43]. The current findings corroborate this mechanism: GF in Zhejiang strengthened digital forestry applications, including remote sensing, ecological asset accounting, and smart monitoring systems, thereby improving ecological product quantification and marketization. This mechanism is consistent with evidence that technological innovation mediates the relationship between financial development and ecological efficiency in GF pilot zones [36].
- (3)
- ISE and ISU. The results show that GF affects FEEE mainly through ISU and ISE rather than simple capital deepening. Prior research emphasizes that the shift toward green industries and ecologicalization of production structures enhances ecological efficiency and reduces environmental pressure [16,19]. GF encourages firms to transform production models, phase out high-emission activities, and invest in eco-friendly sectors, fostering industrial agglomeration and value-chain upgrading. In regions with strong ecological resource endowments, such as Zhejiang, this restructuring increases the economic–ecological synergy of forest-based industries. This supports the argument that industrial structure optimization is a key determinant of eco-product value realization [40,71].
- (4)
- Marketization and ecological asset capitalization. Finally, GF promotes FEEE by strengthening the marketization of ecological products. Literature indicates that mechanisms such as carbon trading, ecological compensation, and ecological asset evaluation help reveal the market value of ecosystem services [27,68]. Financial instruments improve ecological asset liquidity and enable ecosystems, particularly forests, to be transformed into tradable economic assets. In Zhejiang, the expansion of green bonds and ecological finance platforms facilitated ecosystem product pricing, improved transparency, and accelerated the capitalization of forest ecological assets. This aligns with the broader finding that GF stimulates ecological product markets by enhancing price discovery and reducing transaction risk [37].
5.3. Comparison with Existing Literature
These findings are broadly consistent with national-level and regional studies summarized in the literature. Similarly to prior research demonstrating that GF promotes ecological efficiency, industrial upgrading, and innovation in pilot zones [14,58], this study confirms that green financial development enhances ecological product value realization. Compared with studies focusing on urban eco-efficiency and industrial pollution reduction [19,69], this study instead examines the forestry sector, where ecological public-good attributes and longer investment cycles make financial resource allocation more critical. Additionally, the identification of threshold effects contributes to emerging evidence that GF effectiveness is dependent on local industrial structures and technological foundations [62,68]. This study thus provides sector-specific insights that complement existing research on GEP, natural capital, and ecological asset monetization.
5.4. Theoretical and Policy Implications
- (1)
- Theoretical implications. The results enrich the theoretical understanding of FEEE by integrating GF into the e framework of ecological–economic coupling. The findings support theories of ecological modernization theory, which emphasizes the role of financial mechanisms in bridging the gap between economic growth and ecological sustainability. This study contributes to extending the GF literature by demonstrating that green financial development not only mitigates environmental pollution and supports green innovation but also enhances FEEE—a crucial yet underexplored dimension. The study also highlights the potential of GF to drive improvements in both ecological performance and economic outcomes in forestry, thereby advancing the theory of green finance’s role in promoting sustainable development.
- (2)
- Policy implications. For policymakers, the findings underscore the importance of:
- Strengthening green financial markets to increase direct green credit and bond issuance for forest-based ecological projects.
- Improving ecological asset accounting systems to facilitate ecological product pricing and enhance market liquidity.
- Promoting ISE, ensuring that GF can effectively match viable ecological projects.
- Enhancing technological empowerment, especially digital forestry and ecological monitoring technologies.
- Coordinating ER and GF, preventing excessive regulatory burden that might crowd out green investment.
5.5. Limitations and Future Research
This study focuses on Zhejiang Province, a highly developed green finance pilot region, which may limit the generalizability of the findings to less-developed regions or international contexts due to differences in ecological, economic, and policy environments. While the findings are significant within the context of Zhejiang, the broader applicability of these results remains uncertain, particularly in areas with different levels of green finance development, ecological conditions, and regulatory frameworks. This limitation should be taken into account when interpreting the results and applying them to other regions. Future research could benefit from expanding the geographical scope to include other provinces or countries with varying levels of green finance development and ecological challenges.
Additionally, this study primarily captures the positive contributions of GF to FEEE, but does not explicitly account for potential negative externalities, such as forest degradation, production relocation, and associated socio-economic costs (i.e., leakage effects), which are difficult to quantify with available data. The omission of these factors may lead to an incomplete assessment of the true impact of GF on FEEE. These negative externalities could attenuate the benefits observed in the study, and their inclusion in future research would provide a more comprehensive evaluation of GF’s effects on FEEE. Future work could focus on developing methodologies to quantify and integrate these negative externalities, as well as cross-regional leakage effects, into the assessment of ecological and economic outcomes.
Another limitation is the use of environmental regulation (ER) as a proxy, based on the frequency of environmentally related keywords in local government reports. While this proxy reflects the policy commitment and attention given to environmental governance, it does not fully capture the intensity of enforcement mechanisms, such as inspections, penalties, or compliance standards. The lack of precision in measuring enforcement strength could limit the robustness of the relationship between ER and GF in this study. Future research could address this limitation by incorporating more specific enforcement data, such as penalties or compliance rates, which would allow for a more accurate assessment of the impact of environmental regulation on GF outcomes.
These limitations highlight key areas for future research. Expanding the study to include regions with varying ecological and economic conditions, incorporating more comprehensive enforcement data, and considering negative externalities would help deepen our understanding of how GF interacts with environmental policies and ecological systems. Additionally, exploring the role of carbon markets, ecological compensation mechanisms, and ecosystem service pricing tools as channels for GF could provide more in-depth insights into the potential of GF to drive ecological sustainability.
6. Conclusions
Based on panel data for 11 prefecture-level cities in Zhejiang Province from 2011 to 2022, this study employs mediation models, moderation models, and panel threshold models to empirically examine the effects and mechanisms through which GF enhances FEEE in China’s Green Finance Reform and Innovation Pilot Zone. Heterogeneity analysis is conducted from the perspective of financial structure, and the nonlinear characteristics of the impact are further explored through panel threshold regression. The main conclusions are as follows:
- (1)
- Baseline regression results show that GF significantly enhances FEEE, and this conclusion remains robust after a series of robustness checks and endogeneity tests.
- (2)
- Mechanism correlation evidence reveals that GF promotes technological progress, ISU, and ISE, thereby improving FEEE. The impact of ER intensity is dominated by a negative effect, and the interaction between ER and GF demonstrates a “substitution effect”.
- (3)
- Heterogeneity analysis indicates that direct GF plays a more significant role than indirect GF in enhancing FEEE.
- (4)
- Threshold effect analysis shows that the influence of GF exhibits evident nonlinear characteristics under different threshold levels. After crossing the threshold of GF, its marginal positive effect declines. Only when the level of ISE exceeds the corresponding threshold can the positive role of GF be effectively activated. ISU, after surpassing two threshold values, significantly amplifies the positive impact of GF.
Author Contributions
Conceptualization, Y.L., C.X. and F.K.; methodology, Y.L. and C.X.; validation, F.K.; formal analysis, Y.L.; investigation, Y.L.; resources, Y.L.; data curation, Y.L.; writing—original draft preparation, Y.L.; writing—review and editing, Y.L., C.X. and F.K.; visualization, Y.L.; software, Y.L.; supervision, C.X. and F.K.; project administration, Y.L.; funding acquisition, F.K. All authors have read and agreed to the published version of the manuscript.
Funding
This research received the National Natural Science Foundation of China, grant numbers 42371294, 42301328, and 42071283, and Zhejiang University Student Science and Technology Innovation Activity Plan (New Seedling Talent Plan Subsidy Project, 2024R412C061).
Data Availability Statement
The data presented in this study are available upon request from the corresponding author.
Conflicts of Interest
The authors declare no conflicts of interest.
References
- Díaz, S.; Pascual, U.; Stenseke, M.; Martín-López, B.; Watson, R.T.; Molnár, Z.; Hill, R.; Chan, K.M.A.; Baste, I.A.; Brauman, K.A.; et al. Assessing Nature’s Contributions to People. Science 2018, 359, 270–272. [Google Scholar] [CrossRef]
- Polasky, S.; Kling, C.L.; Levin, S.A.; Carpenter, S.R.; Daily, G.C.; Ehrlich, P.R.; Heal, G.M.; Lubchenco, J. Role of Economics in Analyzing the Environment and Sustainable Development. Proc. Natl. Acad. Sci. USA 2019, 116, 5233–5238. [Google Scholar] [CrossRef]
- Costanza, R.; d’Arge, R.; de Groot, R.; Farber, S.; Grasso, M.; Hannon, B.; Limburg, K.; Naeem, S.; O’Neill, R.V.; Paruelo, J.; et al. The Value of the World’s Ecosystem Services and Natural Capital. Ecol. Econ. 1998, 25, 3–15. [Google Scholar] [CrossRef]
- King, S.; Agra, R.; Zolyomi, A.; Keith, H.; Nicholson, E.; De Lamo, X.; Portela, R.; Obst, C.; Alam, M.; Honzák, M.; et al. Using the System of Environmental-Economic Accounting Ecosystem Accounting for Policy: A Case Study on Forest Ecosystems. Environ. Sci. Policy 2024, 152, 103653. [Google Scholar] [CrossRef]
- Garvey, J.; Grigoriadis, V.; Flannery, D.; Knapp, E.; Gold, E.; Hutchinson, G.; Frewer, L.J.; Brereton, P.; Byrne, K.A. Designing financial instruments for land-based ecological restoration: A review and future research agenda. Clean. Prod. Lett. 2025, 8, 100089. [Google Scholar] [CrossRef]
- Ouyang, H.; Guan, C.; Yu, B. Green Finance, Natural Resources, and Economic Growth: Theory Analysis and Empirical Research. Resour. Policy 2023, 83, 103604. [Google Scholar] [CrossRef]
- Xie, R.; Yuan, Y.; Huang, J. Different Types of Environmental Regulations and Heterogeneous Influence on “Green” Productivity: Evidence from China. Ecol. Econ. 2017, 132, 104–112. [Google Scholar] [CrossRef]
- Salazar, J. Environmental Finance: Linking Two World. In Proceedings of the Workshop on Finance Innovations for Biodiversity, Bratislava, Slovakia, 1–3 May 1998. [Google Scholar]
- Yin, X.; Xu, Z. An Empirical Analysis of the Coupling and Coordinative Development of China’s Green Finance and Economic Growth. Resour. Policy 2022, 75, 102476. [Google Scholar] [CrossRef]
- Muganyi, T.; Yan, L.; Sun, H. Green Finance, Fintech and Environmental Protection: Evidence from China. Environ. Sci. Ecotechnol. 2021, 7, 100107. [Google Scholar] [CrossRef] [PubMed]
- Zhang, S.; Wu, Z.; Wang, Y.; Hao, Y. Fostering Green Development with Green Finance: An Empirical Study on the Environmental Effect of Green Credit Policy in China. J. Environ. Manag. 2021, 296, 113159. [Google Scholar] [CrossRef]
- Xu, Y.; Li, S.; Zhou, X.; Shahzad, U.; Zhao, X. How Environmental Regulations Affect the Development of Green Finance: Recent Evidence from Polluting Firms in China. Renew. Energy 2022, 189, 917–926. [Google Scholar] [CrossRef]
- Ouyang, Z.; Zheng, H.; Xiao, Y.; Polasky, S.; Liu, J.; Xu, W.; Wang, Q.; Zhang, L.; Xiao, Y.; Rao, E.; et al. Improvements in Ecosystem Services from Investments in Natural Capital. Science 2016, 352, 1455–1459. [Google Scholar] [CrossRef] [PubMed]
- Li, J.; Huang, L.; Cao, W. An Influencing Mechanism for Ecological Asset Gains and Losses and Its Optimization and Promotion Pathways in China. J. Geogr. Sci. 2022, 32, 1867–1885. [Google Scholar] [CrossRef]
- Masiero, M.; Pettenella, D.; Boscolo, M.; Barua, S.K.; Animon, I.; Matta, J.R. Valuing Forest Ecosystem Services: A Training Manual for Planners and Project Developers; Forestry Working Paper No. 11; Food and Agriculture Organization of the United Nations (FAO): Rome, Italy, 2019; 216p, Available online: http://www.fao.org/3/ca2886en/CA2886EN.pdf (accessed on 1 January 2026).
- Huang, Y.; Chen, C.; Lei, L.; Zhang, Y. Impacts of Green Finance on Green Innovation: A Spatial and Nonlinear Perspective. J. Clean. Prod. 2022, 365, 132548. [Google Scholar] [CrossRef]
- Chen, K.; Bian, R. Green Financing and Renewable Resources for China’s Sustainable Growth: Assessing Macroeconomic Industry Impact. Resour. Policy 2023, 85, 103927. [Google Scholar] [CrossRef]
- Kemkes, R.J.; Farley, J.; Koliba, C.J. Determining When Payments Are an Effective Policy Approach to Ecosystem Service Provision. Ecol. Econ. 2010, 69, 2069–2074. [Google Scholar] [CrossRef]
- Xu, P.; Ye, P.; Jahanger, A.; Huang, S.; Zhao, F. Can Green Credit Policy Reduce Corporate Carbon Emission Intensity: Evidence from China’s Listed Firms. Corp. Soc. Responsib. Environ. Manag. 2023, 30, 2623–2638. [Google Scholar] [CrossRef]
- Lu, Y.; Gao, Y.; Zhang, Y.; Wang, J. Can the Green Finance Policy Force the Green Transformation of High-Polluting Enterprises? A Quasi-Natural Experiment Based on “Green Credit Guidelines”. Energy Econ. 2022, 114, 106265. [Google Scholar] [CrossRef]
- Lei, X.; Yu, J. Striving for Sustainable Development: Green Financial Policy, Institutional Investors, and Corporate ESG Performance. Corp. Soc. Responsib. Environ. Manag. 2024, 31, 1177–1202. [Google Scholar] [CrossRef]
- Zhang, D.; Mohsin, M.; Taghizadeh-Hesary, F. Does Green Finance Counteract the Climate Change Mitigation: Asymmetric Effect of Renewable Energy Investment and R&D. Energy Econ. 2022, 113, 106183. [Google Scholar] [CrossRef]
- Porter, M.E.; van der Linde, C. Toward a New Conception of the Environment-Competitiveness Relationship. J. Econ. Perspect. 1995, 9, 97–118. [Google Scholar] [CrossRef]
- Daly, H.E. Allocation, Distribution, and Scale: Towards an Economics That Is Efficient, Just, and Sustainable. Ecol. Econ. 1992, 6, 185–193. [Google Scholar] [CrossRef]
- Song, M.; Du, J. Mechanisms for Realizing the Ecological Products Value: Green Finance Intervention and Support. Int. J. Prod. Econ. 2024, 271, 109210. [Google Scholar] [CrossRef]
- Wunder, S. Revisiting the Concept of Payments for Environmental Services. Ecol. Econ. 2015, 117, 234–243. [Google Scholar] [CrossRef]
- Zhang, Y.; Ma, Z.; Sun, M.; Song, J.; Yang, Y.; Li, Q.; Jing, Y. Quantitatively Evaluating the Ecological Product Value of Nine Provinces in the Yellow River Basin from the Perspective of the Dual-Carbon Strategy. Land 2023, 12, 516. [Google Scholar] [CrossRef]
- Mol, A.P.J.; Spaargaren, G. Ecological Modernisation Theory in Debate: A Review. Environ. Politics 2000, 9, 17–49. [Google Scholar] [CrossRef]
- Geng, Y.; Sarkis, J.; Ulgiati, S.; Zhang, P. Measuring China’s Circular Economy. Science 2013, 339, 1526–1527. [Google Scholar] [CrossRef]
- Tobin, J. A General Equilibrium Approach to Monetary Theory. J. Money Credit Bank. 1969, 1, 15–29. [Google Scholar] [CrossRef]
- Stiglitz, J.E.; Weiss, A. Credit Rationing in Markets with Imperfect Information. Am. Econ. Rev. 1981, 71, 393–410. [Google Scholar]
- Banga, J. The Green Bond Market: A Potential Source of Climate Finance for Developing Countries. J. Sustain. Financ. Invest. 2019, 9, 17–32. [Google Scholar] [CrossRef]
- Wang, H.; Liu, F. Digital Finance and Enterprise Innovation Efficiency: Evidence from China. Financ. Res. Lett. 2024, 59, 104709. [Google Scholar] [CrossRef]
- Kong, G.; Wang, S.; Wang, Y. Fostering Firm Productivity through Green Finance: Evidence from a Quasi-Natural Experiment in China. Econ. Model. 2022, 115, 105979. [Google Scholar] [CrossRef]
- Romer, P.M. Endogenous Technological Change. J. Political Econ. 1990, 98, S71–S102. [Google Scholar] [CrossRef]
- Zhou, G.; Zhu, J.; Luo, S. The Impact of Fintech Innovation on Green Growth in China: Mediating Effect of Green Finance. Ecol. Econ. 2022, 193, 107308. [Google Scholar] [CrossRef]
- Peng, J.; Xie, R.; Ma, C.; Fu, Y. Market-Based Environmental Regulation and Total Factor Productivity: Evidence from Chinese Enterprises. Econ. Model. 2021, 95, 394–407. [Google Scholar] [CrossRef]
- Wang, N.; Xu, C.; Kong, F. Value Realization and Optimization Path of Forest Ecological Products—Case Study from Zhejiang Province, China. Int. J. Environ. Res. Public Health 2022, 19, 7538. [Google Scholar] [CrossRef]
- Hansen, B.E. Threshold Effects in Non-Dynamic Panels: Estimation, Testing, and Inference. J. Econom. 1999, 93, 345–368. [Google Scholar] [CrossRef]
- Wang, R.; Zhao, X.; Zhang, L. Research on the Impact of Green Finance and Abundance of Natural Resources on China’s Regional Eco-Efficiency. Resour. Policy 2022, 76, 102579. [Google Scholar] [CrossRef]
- Aghion, P.; Howitt, P. A Model of Growth Through Creative Destruction. Econometrica 1992, 60, 323–351. [Google Scholar] [CrossRef]
- Xiao, J.; Xiong, K. A Review of Agroforestry Ecosystem Services and Its Enlightenment on the Ecosystem Improvement of Rocky Desertification Control. Sci. Total Environ. 2022, 852, 158538. [Google Scholar] [CrossRef]
- Feng, S.; Chong, Y.; Yu, H.; Ye, X.; Li, G. Digital Financial Development and Ecological Footprint: Evidence from Green-Biased Technology Innovation and Environmental Inclusion. J. Clean. Prod. 2022, 380, 135069. [Google Scholar] [CrossRef]
- Clark, C. The Conditions of Economic Progress; Macmillan and Co., Ltd.: London, UK, 1940. [Google Scholar]
- Kuznets, S. International Differences in Capital Formation and Financing. In Capital Formation and Economic Growth; Princeton University Press: Princeton, NJ, USA, 1955; pp. 19–111. [Google Scholar]
- Li, W.; Hu, M. An Overview of the Environmental Finance Policies in China: Retrofitting an Integrated Mechanism for Environmental Management. Front. Environ. Sci. Eng. 2014, 8, 316–328. [Google Scholar] [CrossRef]
- Baumol, W.J.; Oates, W.E. The Theory of Environmental Policy, 2nd ed.; Cambridge University Press: Cambridge, UK, 1988. [Google Scholar]
- Cole, M.A.; Elliott, R.J.R. Determining the Trade–Environment Composition Effect: The Role of Capital, Labor and Environmental Regulations. J. Environ. Econ. Manag. 2003, 46, 363–383. [Google Scholar] [CrossRef]
- Ambec, S.; Barla, P. Can Environmental Regulations Be Good for Business? An Assessment of the Porter Hypothesis. Energy Stud. Rev. 2006, 14, 42–62. [Google Scholar] [CrossRef]
- Gray, W.B.; Shadbegian, R.J. Plant Vintage, Technology, and Environmental Regulation. J. Environ. Econ. Manag. 2003, 46, 384–402. [Google Scholar] [CrossRef]
- Dean, J.M.; Lovely, M.E.; Wang, H. Are Foreign Investors Attracted to Weak Environmental Regulations? Evaluating the Evidence from China. J. Dev. Econ. 2009, 90, 1–13. [Google Scholar] [CrossRef]
- Stigler, G.J. The Theory of Economic Regulation. Bell J. Econ. Manag. Sci. 1971, 2, 3–21. [Google Scholar] [CrossRef]
- Wang, D.; Yong, C.; Wang, D.H.; Tian, G.L. Synergistic Effects and Mechanisms of Green Financial Reform, Environmental Regulation Intensity, and Regional Green Innovation Levels. Int. Rev. Econ. Financ. 2025, 102, 104185. [Google Scholar] [CrossRef]
- Baron, R.M.; Kenny, D.A. The Moderator-Mediator Variable Distinction in Social Psychological Research: Conceptual, Strategic, and Statistical Considerations. J. Pers. Soc. Psychol. 1986, 51, 1173–1182. [Google Scholar] [CrossRef]
- Ge, L.; Zhao, H.; Yang, J.; Yu, J.; He, T. Green Finance, Technological Progress, and Ecological Performance—Evidence from 30 Provinces in China. Environ. Sci. Pollut. Res. 2022, 29, 66295–66314. [Google Scholar] [CrossRef]
- Wu, L.; Sun, L.; Qi, P.; Ren, X.; Sun, X. Energy Endowment, Industrial Structure Upgrading, and CO2 Emissions in China: Revisiting Resource Curse in the Context of Carbon Emissions. Resour. Policy 2021, 74, 102329. [Google Scholar] [CrossRef]
- Ang, B.W. Decomposition Analysis for Policymaking in Energy: Which Is the Preferred Method? Energy Policy 2004, 32, 1131–1139. [Google Scholar] [CrossRef]
- Wang, F.; Wu, M.; Du, X. Does Industrial Upgrading Improve Eco-Efficiency? Evidence from China’s Industrial Sector. Energy Econ. 2023, 124, 106774. [Google Scholar] [CrossRef]
- Chen, Z.; Kahn, M.E.; Liu, Y.; Wang, Z. The Consequences of Spatially Differentiated Water Pollution Regulation in China. J. Environ. Econ. Manag. 2018, 88, 468–485. [Google Scholar] [CrossRef]
- Grossman, G.M.; Krueger, A.B. Economic Growth and the Environment. Q. J. Econ. 1995, 110, 353–377. [Google Scholar] [CrossRef]
- Stern, D.I. The Rise and Fall of the Environmental Kuznets Curve. World Dev. 2004, 32, 1419–1439. [Google Scholar] [CrossRef]
- Zhang, S.; Xiong, K.; Min, X.; Zhang, S. Demographic Shrinkage Promotes Ecosystem Services Supply Capacity in the Karst Desertification Control. Sci. Total Environ. 2024, 917, 170427. [Google Scholar] [CrossRef] [PubMed]
- Du, K.; Cheng, Y.; Yao, X. Environmental Regulation, Green Technology Innovation, and Industrial Structure Upgrading: The Road to the Green Transformation of Chinese Cities. Energy Econ. 2021, 98, 105247. [Google Scholar] [CrossRef]
- Song, M.; Du, J.; Tan, K.H. Impact of Fiscal Decentralization on Green Total Factor Productivity. Int. J. Prod. Econ. 2018, 205, 359–367. [Google Scholar] [CrossRef]
- Yan, C.; Mao, Z.; Ho, K.-C. Effect of Green Financial Reform and Innovation Pilot Zones on Corporate Investment Efficiency. Energy Econ. 2022, 113, 106185. [Google Scholar] [CrossRef]
- Al Mamun, M.; Boubaker, S.; Nguyen, D.K. Green Finance and Decarbonization: Evidence from around the World. Financ. Res. Lett. 2022, 46, 102807. [Google Scholar] [CrossRef]
- Mattila, T.; Koskela, S.; Seppälä, J.; Mäenpää, I. Sensitivity analysis of environmentally extended input–output models as a tool for building scenarios of sustainable development. Ecol. Econ. 2013, 86, 148–155. [Google Scholar] [CrossRef]
- Liu, R.; Wang, D.; Zhang, L.; Zhang, L. Can Green Financial Development Promote Regional Ecological Efficiency? A Case Study of China. Nat. Hazards 2019, 95, 325–341. [Google Scholar] [CrossRef]
- Hu, G.; Wang, X.; Wang, Y. Can the Green Credit Policy Stimulate Green Innovation in Heavily Polluting Enterprises? Evidence from a Quasi-Natural Experiment in China. Energy Econ. 2021, 98, 105134. [Google Scholar] [CrossRef]
- Sun, Y.; Bao, Q.; Taghizadeh-Hesary, F. Green Finance, Renewable Energy Development, and Climate Change: Evidence from Regions of China. Humanit. Soc. Sci. Commun. 2023, 10, 107. [Google Scholar] [CrossRef]
- Guo, R.; Yuan, Y. Different Types of Environmental Regulations and Heterogeneous Influence on Energy Efficiency in the Industrial Sector: Evidence from Chinese Provincial Data. Energy Policy 2020, 145, 111747. [Google Scholar] [CrossRef]

Disclaimer/Publisher’s Note: The statements, opinions and data contained in all publications are solely those of the individual author(s) and contributor(s) and not of MDPI and/or the editor(s). MDPI and/or the editor(s) disclaim responsibility for any injury to people or property resulting from any ideas, methods, instructions or products referred to in the content. |
© 2026 by the authors. Licensee MDPI, Basel, Switzerland. This article is an open access article distributed under the terms and conditions of the Creative Commons Attribution (CC BY) license.