Abstract
The intensifying Urban Heat Island (UHI) effect exacerbates urban heat stress. While vegetation is a key mitigation strategy, the quantitative effects of its spatial configuration are not fully understood. This study employed ENVI-met simulations to systematically evaluate how three design parameters—tree spacing (8–18 m), canopy structure (single/multi-layer, sparse/dense), and horizontal layout (enclosed, semi-enclosed, linear)—regulate summer microclimate in urban parks. Results demonstrated that reduced spacing and denser canopies significantly enhanced cooling and humidification. The multi-layer dense canopy and an enclosed “mouth-shaped” layout yielded the optimal performance, achieving a maximum daytime air temperature reduction and a corresponding humidity increase. Furthermore, layout orientation was identified as a critical modulating factor. Spatial configuration exerted a stronger influence on microclimate outcomes than structural complexity itself. This study provides a predictive, evidence-based framework for optimizing urban green space design. The framework and the derived design principles are directly transferable to other cities in humid subtropical climates, offering generalizable strategies to enhance microclimate regulation and climate resilience globally.
1. Introduction
The Urban Heat Island (UHI) effect has emerged as a pressing environmental challenge posing a significant threat to urban sustainability. Characterized by significantly elevated temperatures in urban centers compared to their rural counterparts, the UHI effect is particularly pronounced during summer months. This phenomenon exacerbates air pollution [1], heightens the frequency and intensity of extreme heat events [2], and drives increased demands for energy resources [3]. The UHI effect severely compromises thermal comfort and public health, disproportionately affecting vulnerable populations during heat waves when elevated temperatures pose critical health risks [4]. Addressing this challenge requires strategies that effectively enhance microclimatic conditions and improve thermal comfort in densely populated areas.
The role of vegetation in mitigating the urban heat island (UHI) effect has been extensively studied, with particular focus on mechanisms such as evapotranspiration and shading [5,6]. These processes have been demonstrated to significantly reduce local temperatures, enhance humidity, and provide additional ecosystem services such as dust retention and noise reduction [7]. Among various strategies to combat the UHI effect, expanding urban green spaces has gained significant attention due to their multifunctional ecological benefits. Research has established that the cooling effectiveness of green spaces operates across scales: from macro-scale attributes such as area, shape, and connectivity [8,9,10,11], down to micro-scale characteristics including plant species, canopy structure, and planting density [12,13,14,15]. At the finer, design-relevant patch scale, studies have progressively identified key parameters: spatial geometry and vegetation configuration significantly influence thermal comfort [14]; specific layout typologies offer microclimatic advantages [14,16]; and canopy-level traits directly regulate radiant heat exchange and transpirational cooling [17,18,19]. At the level of spatial characteristics of plant communities, a substantial body of work has focused on vertical canopy attributes (e.g., single- vs. multi-layered structures), elucidating their role in light interception and transpiration [13]. Similarly, the effect of planting density (tree spacing) on microclimate has been quantified, with studies indicating its strong correlation with cooling intensity [18]. However, research on the horizontal spatial configuration of plant communities (e.g., enclosed, linear, or semi-enclosed layouts) remains largely case-specific or descriptive. A critical, systematic comparison of how these fundamental design dimensions—horizontal layout versus vertical structure—differentially drive microclimate regulation is conspicuously absent.
The spatial configuration and orientation of plant communities are key determinants of microclimate regulation, primarily by governing solar radiation access and airflow dynamics. Factors such as planting density and canopy structure directly affect shading efficiency and evapotranspiration rates [4,20,21]. Crucially, the horizontal layout (e.g., enclosed, semi-enclosed, or linear) further modifies these effects by altering wind patterns and the trapping of cool, moist air [22,23]. Moreover, the orientation of these layouts is a critical variable, as it dictates the duration and intensity of solar exposure. For example, South- and West-facing configurations tend to accumulate more heat compared to their North- and East-facing counterparts, significantly impacting thermal comfort [24,25]. A comprehensive understanding of these interacting factors is therefore essential for developing targeted design interventions, and related research is still needed in this area.
To address the aforementioned research gap, this study employs ENVI-met simulations, validated with field data from urban parks in Zhejiang, China, a representative humid subtropical monsoon region. Guided by landscape ecology’s pattern–process principle, it systematically quantifies how vegetation spatial patterns—namely horizontal layout, planting density, and vertical canopy structure—regulate key biophysical processes (radiation interception, evapotranspiration, and airflow) to shape summer microclimate outcomes. The work thereby establishes an evidence-based, predictive framework to inform climate-responsive urban green space design. The study is centered around two primary scientific questions: (1) How do key configurational attributes—namely planting density, canopy structure, and horizontal layout (enclosed, semi-enclosed, linear)—regulate local microclimatic variables? To what extent does the orientation of horizontal layouts modify the local microclimate? (2) Does spatial configuration, horizontal layout, dominate over structural complexity in determining microclimatic outcomes? By quantitatively analyzing the regulatory mechanism of vegetation spatial configuration on microclimate, this study provides an evidence-based and transferable design framework for optimizing urban green infrastructure worldwide, thereby mitigating UHI impacts, enhancing thermal comfort, and informing sustainable planning.
2. Materials and Methods
2.1. Study Area
Zhuji City, situated in the northern-central region of Zhejiang Province (East Longitude 119°53′–120°32′, North Latitude 29°21′–29°59′), has a subtropical monsoon climate, characterized by distinct seasonal variations. The region experiences moderate temperatures, abundant sunshine, and high levels of rainfall and humidity. The rainy and warm seasons coincide. Average annual temperature ranges from 15 °C to 18 °C, annual rainfall is 980 to 2000 mm, and average annual sunshine duration is 1710 to 2100 h.
Eight sampling points were selected within Citizen Park for field measurements. The park is centrally located, surrounded by high-rise commercial buildings, and experiences high pedestrian volume, and thus represents a typical urban green space. These points, labeled A1-CK to A8, include A1-CK, a control point with no vegetation cover, while the remaining seven are situated in plant communities with distinct layout characteristics. The geographical location of the study area and the distribution of sampling sites are shown in Figure 1. The vegetation conditions at each of the sampling points and the Sky View Factor (SVF) are shown in Figure 2.
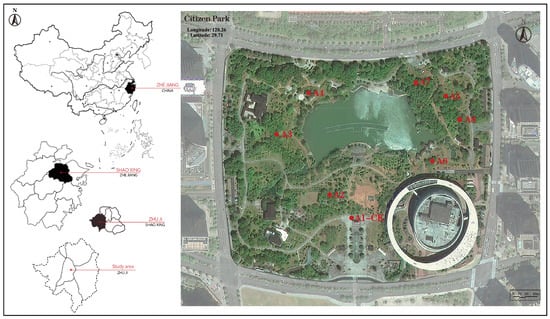
Figure 1.
Geographical location of the study area and distribution of sampling sites.
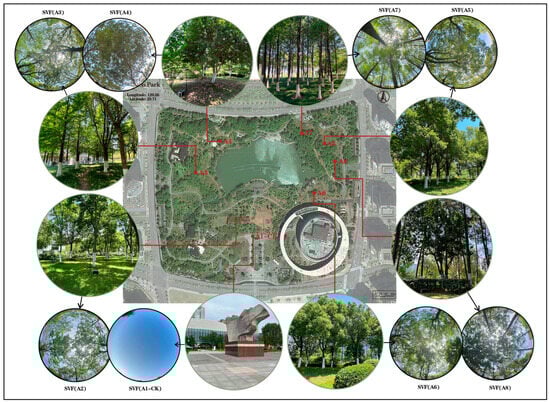
Figure 2.
The vegetation status at various sampling points and the Sky View Factor (SVF).
2.2. Field Microclimate Data Collection
The 15-day study between June and August 2024 was timed to capture the peak growing season and the highest urban heat stress. The selected period featured clear, stable, hot-humid weather, which maximizes solar radiation and tree evaporative cooling, thereby allowing evaluation of their peak cooling performance [26]. Employing stable weather conditions is a common methodology to reduce confounding effects from variable weather [27]. We measured temperature and relative humidity (LWS-2 model, Greenbo Instrument Co., Ltd., Hangzhou, Zhejiang, China), air movement (LBJ-30 model, Greenbo Instrument Co., Ltd., Hangzhou, Zhejiang, China), and light intensity (LBJ-22 model, Greenbo Instrument Co., Ltd., Hangzhou, Zhejiang, China). At each sampling point, data were recorded continuously over a 24 h period, from 08:00 to 08:00 the following day, at a 10 min interval. All parameters were measured at a uniform height of 1.5 m above the ground. The field measurement setup is illustrated in Figure 3, and Table 1 details the specifications of the instruments used.
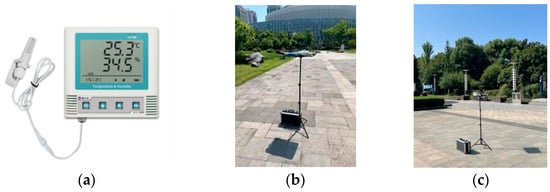
Figure 3.
The meteorological observation instruments and the process of field measurements. (a) Temperature and humidity measuring instrument; (b) anemometer; (c) light intensity measuring instrument.

Table 1.
Measurement parameters and instrument information.
2.3. ENVI-Met Simulation Validation and Accuracy Assessment
ENVI-met (version 5.6.1), a comprehensive tool for simulating dynamic changes in site climate factors, integrates principles from physics and ecology, including thermodynamics, fluid dynamics, and meteorology. It evaluates the influence of various factors, such as soil, paving materials, building structures, and vegetation, on the microclimate [28,29,30,31]. While the accuracy and applicability of ENVI-met numerical simulations have been validated in numerous studies [14,15], their performance can vary depending on local conditions and specific model inputs [23]. Therefore, a site-specific validation was performed to ensure the model’s reliability for the context of this study.
Microclimate simulations were conducted for seven vegetated sites (A2–A8) in Citizen Park. The ENVI-met simulation process consists of three key stages: model configuration, input of environmental parameters, and output of results [32,33,34,35]. The simulated values for air temperature (AT) and relative humidity (RH) were then compared with measured data to evaluate the feasibility and accuracy of ENVI-met for plant communities in this specific subtropical environment. The overall numerical simulation framework and methodology of the paper are depicted in Figure 4.
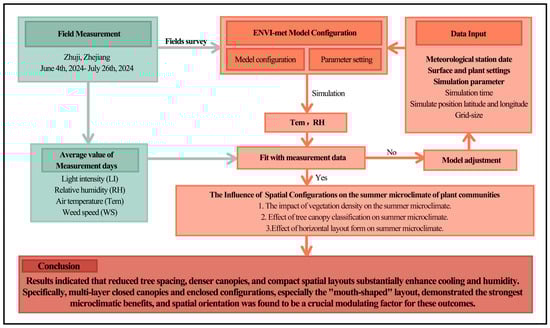
Figure 4.
Study methodology.
2.4. The ENVI-Met Simulation Setup
2.4.1. Vegetation Density
To assess the effect of planting density, we simulated six scenarios within a 100 m × 100 m domain. The horizontal configuration was a row-column arrangement (grid layout). The vertical structure consisted of a tree-grass composite. The tree spacing was the tested variable, with values of 18 m, 16 m, 14 m, 12 m, 10 m, and 8 m. The examined tree spacing gradient was derived from extensive field surveys of urban parks, representing a realistic range of planting densities. Spacing is defined as the trunk-to-trunk distance. This empirically observed continuum was discretized at 2 m intervals to permit systematic analysis of how incremental variation in planting density—from relatively closed to open canopies—affects microclimate regulation. The following parameters were held constant: tree height (9 m), canopy base height (2 m), and canopy spread (6.5 m). Trees were modeled with a spherical crown shape and a Leaf Area Index (LAI) of 1. The 3D model of plant communities with different plant spacing (8–18 m) is shown in Table 2 and Figure 5.
Table 2.
The simulation setup for assessing the impact of varying vegetation densities on the microclimatic conditions within plant communities.
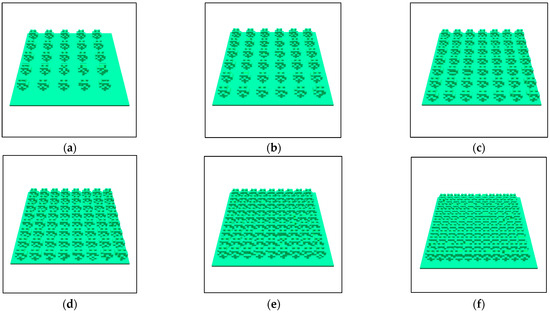
Figure 5.
Three-Dimensional model of plant communities with different plant spacing (8–18 m). (a) Plant spacing of 18 m. (b) Plant spacing of 16 m. (c) Plant spacing of 14 m. (d) Plant spacing of 12 m. (e) Plant spacing of 10 m. (f) Plant spacing of 8 m.
2.4.2. Canopy Characteristics
To analyze canopy characteristics, four scenarios were simulated in a 100 m × 100 m domain using a plant layout of a naturalistic distribution. The four simulated canopy types were as follows:
- Single-layer sparse canopy: Trees with a canopy base height of 5 m and 30% tree cover.
- Single-layer closed canopy: Trees with a canopy base height of 5 m and 70% tree cover.
- Multi-layer sparse canopy: A mix of trees with canopy base heights from 1 m to 6 m, achieving 30% total tree cover.
- Multi-layer closed canopy: A mix of trees with canopy base heights from 1 m to 6 m, achieving 70% total tree cover.
The classification of canopy types into single-layer/multi-layer and sparse/dense categories is grounded in established ecological principles concerning vertical structure and canopy coverage, which are key determinants of microclimate regulation. The distinction between single-layer and multi-layer canopies addresses vertical structural complexity. Multi-layered vegetation typically possesses a greater total leaf area and utilizes vertical space more efficiently, which enhances its potential for transpirational cooling and shading compared to single-layered structures [36,37]. The sparse vs. dense dichotomy directly relates to canopy coverage or closure. Empirical models confirm that higher tree cover is a primary factor leading to more significant air temperature reduction [38,39]. Our four-type matrix (single-layer sparse, single-layer dense, multi-layer sparse, multi-layer dense) thus operationalizes these two critical, independent structural axes into a functional framework for systematic comparison of their cooling and humidifying efficacy.
All trees in these scenarios had a canopy width of 6 m, a cylindrical crown shape, and an LAI of 1.
2.4.3. Horizontal Layout Form
To evaluate the microclimatic effects of different horizontal layouts, a series of scenarios was modeled within a 100 m × 100 m domain featuring a tree-grass vertical structure. The simulated layouts included the following [25]:
- Enclosed layout: A fully enclosed, four-sided (“mouth-shaped”) form.
- Semi-enclosed layouts:
- -
- U-shaped, tested with openings oriented to the North, South, East, and West.
- -
- L-shaped, tested with openings oriented to the Southeast, Northeast, Northwest, and Southwest.
- Linear layouts: Parallel lines of trees oriented along both North–South and East–West axes.
- Dispersed layouts: Both a naturalistic (scattered) and a formal (grid) arrangement. Figure 6 presents the 3D models of these horizontal layouts.
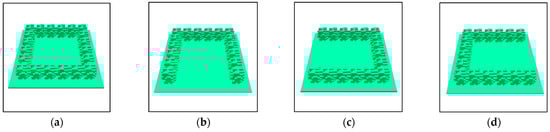
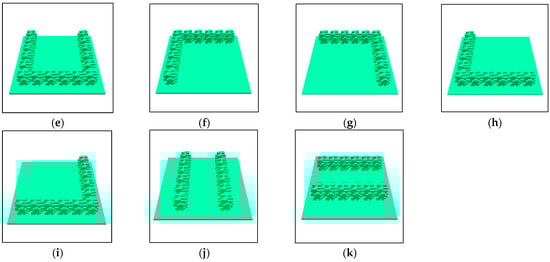 Figure 6. Three-Dimensional model representations of plant communities with different horizontal layout forms: (a) 3D model of “mouth-shaped” plant landscape space; (b) 3D model of the “U-shaped” plant landscape space (South-facing); (c) 3D model of the “U-shaped” plant landscape space (West-facing); (d) 3D model of the “U-shaped” plant landscape space (East-facing); (e) 3D model of the “U-shaped” plant landscape space (North-facing); (f) 3D model of the “L-shaped” plant landscape space (Southeast); (g) 3D model of the “L-shaped” plant landscape space (Southwest); (h) 3D model of the “L-shaped” plant landscape space (Northeast); (i) 3D model of the “L-shaped” plant landscape space (Northwest); (j) Parallel line type 3D model drawing (North–South); (k) Parallel line type 3D model drawing (East–West).
3. Results
3.1. The Feasibility of ENVI-Met Was Validated Based on the Empirically Measured Microclimate Data
Before using the ENVI-met model for the simulation, its accuracy and applicability were verified. The calibration process adjusted key parameters—albedo, thermal conductivity, and vegetation physiology—to reduce discrepancies between the observed and simulated results. Figure 6 shows the linear regression results between measured and simulated values for summer air temperature and relative humidity. There is a strong correlation between the measured and simulated microclimate parameters (R2-air temperature = 0.931; R2-relative humidity = 0.922), highlighting the robustness of ENVI-met in accurately modeling the microclimates of plant communities, particularly in East China, exemplified by Zhejiang Province. Figure 7 shows the correlation values between the values predicted by the simulation models and the values measured by the field campaigns for summer.
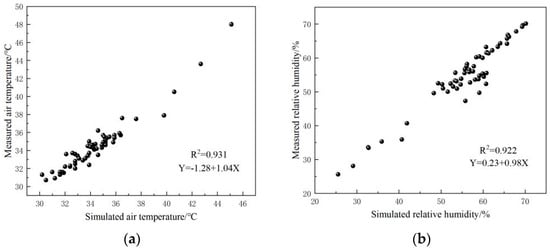
Figure 7.
The correlation values between the values predicted by simulation models and measured by the field campaigns for the summer. (a) The air temperature values. (b) The relative humidity values.
3.2. The Impact of Plant Community Spatial Configuration on Summer Microclimate Based on ENVI-Met Simulations
3.2.1. The Impact of Vegetation Density on the Summer Microclimate
The effects of different tree spacing on microclimate parameters at a 1.4 m height are illustrated. The results show that at 12:00 p.m., reducing tree spacing significantly enhances the microclimatic regulation effects of the plant community within an 8–18 m range. In particular, the temperature showed a gradually decreasing trend as the tree spacing became smaller, while the humidity showed a gradually increasing trend as the tree spacing became compact (Figure 8 and Figure 9, Table 3).
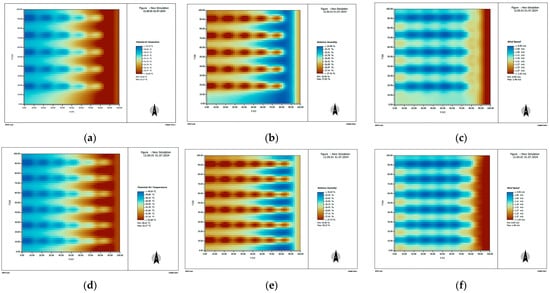
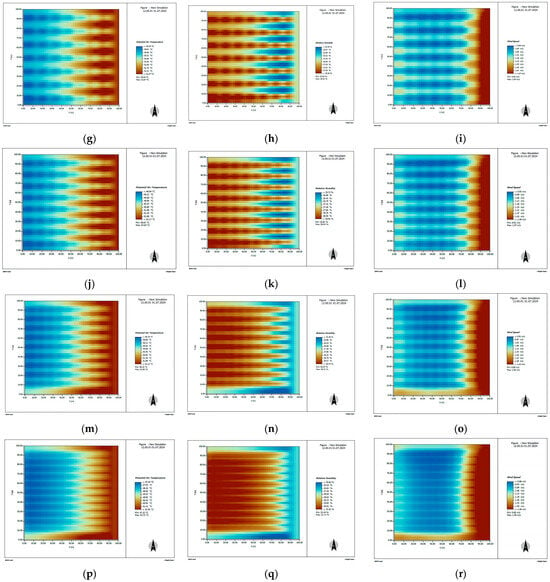
Figure 8.
Distribution of air temperature, humidity, and wind speed in plant communities with different vegetation density. (a) The air temperature at 1.4 m height was 51.42 °C at 12:00 p.m. with a tree spacing of 18 m (spatial average). (b) The humidity at 1.4 m height was 26.24% at 12:00 p.m. with a tree spacing of 18 m (spatial average). (c) The wind speed at 1.4 m height was 1.140 m/s at 12:00 p.m. with a tree spacing of 18 m (spatial average). (d) The air temperature at 1.4 m height was 51.16 °C at 12:00 p.m. with a tree spacing of 16 m (spatial average). (e) The humidity at 1.4 m height was 26.65% at 12:00 p.m. with a tree spacing of 16 m (spatial average). (f) The wind speed at 1.4 m height was 1.145 m/s at 12:00 p.m. with a tree spacing of 16 m (spatial average). (g) The air temperature at 1.4 m height was 50.85 °C at 12:00 p.m. with a tree spacing of 14 m (spatial average). (h) The humidity at 1.4 m height was 27.17% at 12:00 p.m. with a tree spacing of 14 m (spatial average). (i) The wind speed at 1.4 m height was 1.146 m/s at 12:00 p.m. with a tree spacing of 14 m (spatial average). (j) The air temperature at 1.4 m height was 50.49 °C at 12:00 p.m. with a tree spacing of 12 m (spatial average). (k) The humidity at 1.4 m height was 27.75% at 12:00 p.m. with a tree spacing of 12 m (spatial average). (l) The wind speed at 1.4 m height was 1.141 m/s at 12:00 p.m. with a tree spacing of 12 m (spatial average). (m) The air temperature at 1.4 m height was 50.15 °C at 12:00 p.m. with a tree spacing of 10 m (spatial average). (n) The humidity at 1.4 m height was 28.29% at 12:00 p.m. with a tree spacing of 10 m (spatial average). (o) The wind speed at 1.4 m height was 1.122 m/s at 12:00 p.m. with a tree spacing of 10 m (spatial average). (p) The air temperature at 1.4 m height was 49.47 °C at 12:00 p.m. with a tree spacing of 8 m (spatial average). (q) The humidity at 1.4 m height was 29.40% at 12:00 p.m. with a tree spacing of 8 m (spatial average). (r) The wind speed at 1.4 m height was 1.110 m/s at 12:00 p.m. with a tree spacing of 8 m (spatial average).
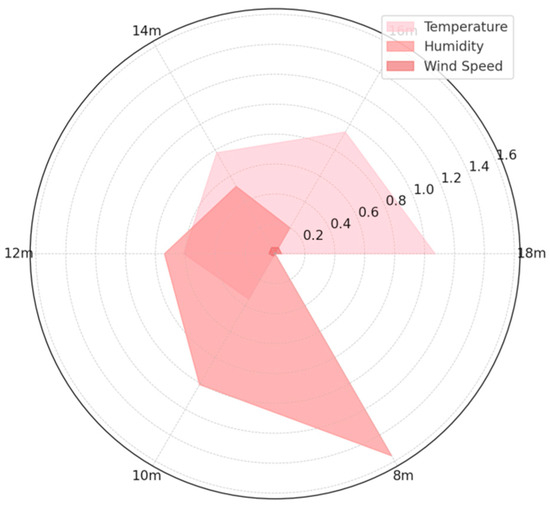
Figure 9.
Radar map of microclimate regulation effects at different tree spacing.
Table 3.
Microclimate regulation of plant communities at a height of 1.4 m at 12:00.
Specifically, from 7:00 a.m. to 10:00 p.m., for every 2 m decrease in tree spacing, the daily average air temperature beneath the canopy decreases by 0.13 °C, 0.16 °C, 0.17 °C, 0.26 °C, and 0.35 °C, respectively, showing a progressively stronger cooling effect (Figure 10, Table 4). This indicates that higher planting densities augment the trees’ shading and transpiration functions, thereby exerting a powerful cooling influence. Concurrently, as tree spacing diminishes, the daily average relative humidity beneath the canopy rises, suggesting that denser planting enhances humidity regulation. For each 2 m reduction in tree spacing, the daily average humidity increases 0.20%, 0.32%, 0.22%, 0.27%, and 0.55%, respectively. Regarding wind speed, the impact of tree spacing on airflow is striking. The findings reveal that as tree spacing is reduced from 18 m to 14 m, wind speed gradually increases. However, when spacing is further reduced to 8 m, wind speed begins to decline, peaking at a tree spacing of 14 m. This pattern illustrates that moderate-density tree spacing optimizes airflow pathways. Specifically, wide tree spacing results in insufficient canopy cover, diminishing wind speed regulation, while close spacing hampers airflow due to overly dense vegetation. Thus, a tree spacing of 14 m appears optimal for balancing airflow and other microclimate benefits.
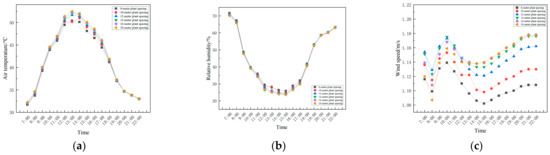
Figure 10.
Effects of different planting densities at a height of 1.4 m on the microclimate of plant communities from 7:00 a.m. to 10:00 p.m. (a) The changes in air temperature from 7:00 a.m. to 10:00 p.m. (b) The changes in humidity from 7:00 a.m. to 10:00 p.m. (c) The changes in wind speed from 7:00 a.m. to 10:00 p.m.
Table 4.
Microclimate regulation of plant communities at a height of 1.4 m from 7:00 a.m. to 10:00 p.m.
3.2.2. Effect of Tree Canopy Classification on Summer Microclimate
The microclimatic impact of different tree canopy classifications is detailed in Table 5 and Table 6 and illustrated in Figure 11, Figure 12 and Figure 13.
Table 5.
The microclimate regulation of plant communities at 1.4 m height under different tree canopy classifications at 12:00 p.m.
Table 6.
The microclimate regulation of plant communities at 1.4 m height under different tree canopy classifications from 7:00 a.m. to 10:00 p.m.
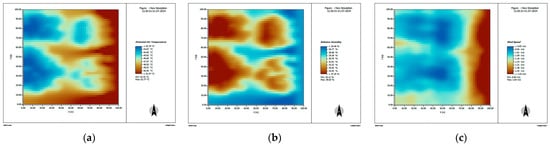
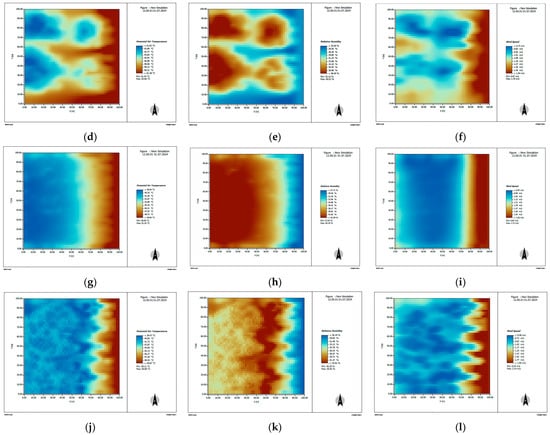
Figure 11.
Distribution of air temperature, humidity, and wind speed in plant communities with different tree canopy classifications. (a) The air temperature at 1.4 m height was 47.47 °C at 12:00 p.m. with a single-layer sparse tree canopy (spatial average). (b) The humidity at 1.4 m height was 31.86% at 12:00 p.m. with a single-layer sparse tree canopy (spatial average). (c) The wind speed at 1.4 m height was 1.142 m/s at 12:00 p.m. with a single-layer sparse tree canopy (spatial average). (d) The air temperature at 1.4 m height was 47.08 °C at 12:00 p.m. with a multi-layer sparse tree canopy (spatial average). (e) The humidity at 1.4 m height was 32.35% at 12:00 p.m. with a multi-layer sparse tree canopy (spatial average). (f) The wind speed at 1.4 m height was 1.132 m/s at 12:00 p.m. with a multi-layer sparse tree canopy (spatial average). (g) The air temperature at 1.4 m height was 43.21 °C at 12:00 p.m. with a single-layer closed tree canopy (spatial average). (h) The humidity at 1.4 m height was 39.28% at 12:00 p.m. with a single-layer closed tree canopy (spatial average). (i) The wind speed at 1.4 m height was 1.118 m/s at 12:00 p.m. with a single-layer closed tree canopy (spatial average). (j) The air temperature at 1.4 m height was 42.57 °C at 12:00 p.m. with a multi-layer closed tree canopy (spatial average). (k) The humidity at 1.4 m height was 37.63% at 12:00 p.m. with a multi-layer closed tree canopy (spatial average). (l) The wind speed at 1.4 m height was 0.995 m/s at 12:00 p.m. with a multi-layer closed tree canopy (spatial average).
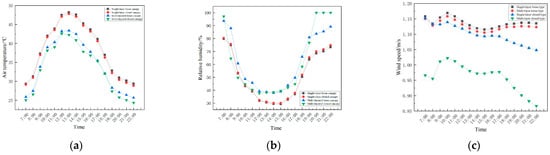
Figure 12.
Effects of different tree canopy classifications at a height of 1.4 m on the microclimate of plant communities from 7:00 a.m. to 10:00 p.m. (a) The changes in air temperature from 7:00 a.m. to 10:00 p.m. (b) The changes in humidity from 7:00 a.m. to 10:00 p.m. (c) The changes in wind speed from 7:00 a.m. to 10:00 p.m.
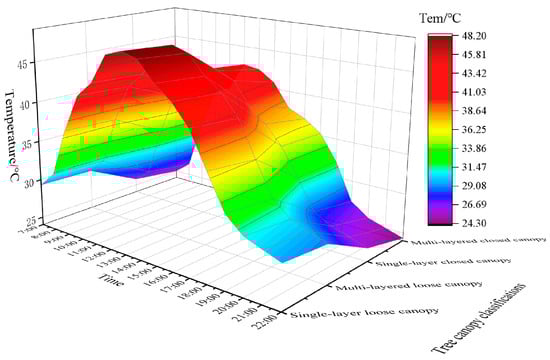
Figure 13.
The 3D surface plot illustrates the effects of different tree canopy classifications at 1.4 m on the temperature variation in plant communities from 7:00 a.m. to 10:00 p.m.
The results show significant differences in the microclimate regulation capabilities of different canopy types. The multi-layer closed canopy, which has dense cover and stratified shading, produced the most pronounced cooling effect (average daily air temperature of 33.23 °C) and humidity increase (average daily relative humidity of 60.74%). By contrast, the single-layer loose canopy demonstrated a markedly weaker microclimatic regulation, with an under-canopy air temperature of 38.58 °C and relative humidity of 50.42%. A multivariate regression analysis confirmed the dominant role of canopy cover in regulating temperature and humidity. The coefficient of determination (R2) for canopy cover was 0.973 (p < 0.05), indicating a strong, statistically significant impact on microclimate regulation, while the coefficient for canopy structure was 0.024 (p > 0.05), showing minimal influence. This highlights the paramount importance of canopy cover in microclimate regulation, while the vertical structure plays a subordinate role.
While the theoretical advantage of multi-layered canopy structures lies in their ability to block greater amounts of solar radiation [22], the empirical analysis in this study reveals that the influence of canopy structure on temperature and humidity regulation is less pronounced than that of canopy coverage. This finding contrasts with previous studies, which assert that vertical canopy stratification plays a pivotal role in cooling effects, exceeding the temperature reduction attributed to leaf area index and canopy coverage [13]. Several factors may account for this divergence. Firstly, the dense planting configurations in the ENVI-met models employed here limited the full expression of vertical stratification. Secondly, single-layer canopies, though less vertically complex, can have concentrated shading and a high leaf area index, leading to substantial temperature and humidity regulation. Finally, given that microclimate regulation is a multifactorial process, the influence of canopy structure warrants further investigation to elucidate its mechanisms.
Furthermore, the impact of canopy structure on wind speed is pronounced, with the single-layer, sparse canopy yielding the highest wind velocity (1.137 m/s), while the multi-layer, closed canopy exhibits the lowest (0.960 m/s). This underscores how denser, multi-tiered configurations effectively obstruct airflow, thereby diminishing wind speed.
In summary, multi-layered closed canopies are most effective for optimizing summer microclimates. Conversely, the structure of single-layered sparse canopies has less influence on the radiation balance or airflow, limiting their overall microclimate regulation capacity.
3.2.3. Effect of Horizontal Layout Form on Summer Microclimate
The simulated microclimate regulation of different horizontal layouts is presented in Figure 14 and Table 7, Table 8, Table 9 and Table 10. The analysis shows that the “mouth-shaped” layout is the most effective, exhibiting the lowest average air temperature (41.96 °C), the highest relative humidity (43.21%), and a high wind speed (1.550 m/s). This is likely due to the enclosed boundary shape of the “mouth,” which not only amplifies the shading and transpiration effects of the vegetation but also optimizes airflow pathways. In contrast, the U-shaped, L-shaped, and parallel-line configurations show weaker climatic regulation. The U-shaped and L-shaped layouts, due to their open orientations and dispersed design, allow greater air circulation, thereby diluting humidity, while the parallel-line layout, with its extended form, increases wind friction, resulting in the lowest wind speed (1.454 m/s).
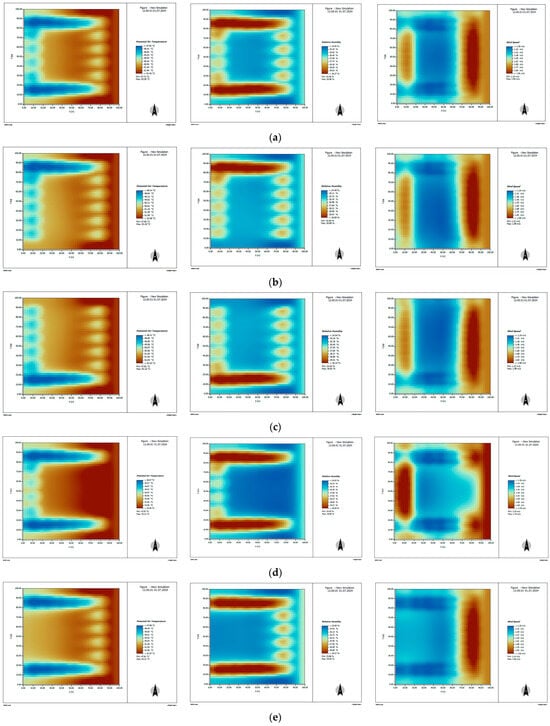
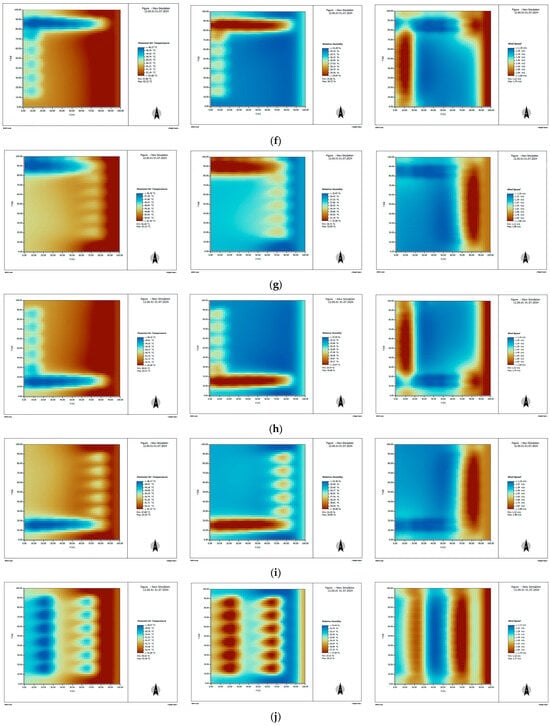
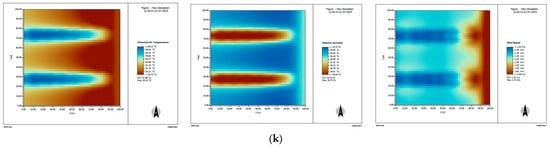
Figure 14.
Distribution of air temperature, humidity, and wind speed in plant communities with different horizontal layout forms. (a) The air temperature, humidity, and wind speed at 1.4 m height were 50.76 °C, 26.95%, and 1.545 m/s at 12:00 p.m. with the “mouth-shaped” plant communities, respectively (spatial average). (b) The air temperature, humidity, and wind speed at 1.4 m height were 51.06 °C, 26.49%, and 1.525 m/s at 12:00 p.m. with the “U-shaped, South-facing” plant communities, respectively (spatial average). (c) The air temperature, humidity, and wind speed at 1.4 m height were 51.05 °C, 26.49%, and 1.526 m/s at 12:00 p.m. with the “U-shaped, North-facing” plant communities, respectively (spatial average). (d) The air temperature, humidity, and wind speed at 1.4 m height were 51.18 °C, 26.41%, and 1.415 m/s at 12:00 p.m. with the “U-shaped, East-facing” plant communities, respectively (spatial average). (e) The air temperature, humidity, and wind speed at 1.4 m height were 50.96 °C, 26.01%, and 1.505 m/s at 12:00 p.m. with the “U-shaped, West-facing” plant communities, respectively (spatial average). (f) The air temperature, humidity, and wind speed at 1.4 m height were 51.59 °C, 25.81%, and 1.431 m/s at 12:00 p.m. with the “L-shaped, Southeast-facing” plant communities, respectively (spatial average). (g) The air temperature, humidity, and wind speed at 1.4 m height were 49.89 °C, 28.11%, and 1.480 m/s at 12:00 p.m. with the “L-shaped, Southwest-facing” plant communities, respectively (spatial average). (h) The air temperature, humidity, and wind speed at 1.4 m height were 51.58 °C, 25.82%, and 1.427 m/s at 12:00 p.m. with the “L-shaped, Northeast-facing” plant communities, respectively (spatial average). (i) The air temperature, humidity, and wind speed at 1.4 m height were 51.28 °C, 26.24%, and 1.479 m/s at 12:00 p.m. with the “L-shaped, Northwest-facing” plant communities, respectively (spatial average). (j) The air temperature, humidity, and wind speed at 1.4 m height were 51.42 °C, 26.05%, and 1.471 m/s at 12:00 p.m. with the “North–South oriented parallel line” plant communities, respectively (spatial average). (k) The air temperature, humidity, and wind speed at 1.4 m height were 51.39 °C, 26.18%, and 1.422 m/s at 12:00 p.m. with the “East–West oriented parallel line” plant communities, respectively (spatial average).
Table 7.
The microclimate regulation of plant communities at 1.4 m height under different horizontal layout forms from 7:00 a.m. to 10:00 p.m.
Table 8.
Microclimate regulation of U-shaped plant communities with different orientations at 1.4 m height under different horizontal layouts from 7:00 a.m. to 10:00 p.m.
Table 9.
Microclimatic regulation of L-shaped plant communities with varying orientations under different horizontal layouts at 1.4 m height from 7:00 a.m. to 10:00 p.m.
Table 10.
Microclimatic regulation of parallel-line oriented plant communities with varying orientations under different horizontal layouts at 1.4 m height from 7:00 a.m. to 10:00 p.m.
The observed cooling effects in compact layouts, such as the “mouth-shaped” configuration, align with findings from Masmoudi and Mazouz (2004), who highlighted the importance of spatial geometry in reducing surface temperatures and improving thermal comfort [11]. Similarly, the results on vegetation combinations resonate with Nie et al. (2024), where specific green forms, like grass and shrubs, demonstrated superior cooling and humidifying effects in urban microclimates [15].
For U-shaped layouts, the effect of orientation is detailed in Table 8. Simulation results reveal that the influence of orientation on the average air temperature is minimal, with a variation of just 0.11 °C. Notably, the East-facing U-shaped configuration exhibits the highest temperature, underscoring the relationship between direct solar exposure and heat accumulation. Previous studies have affirmed that spatial orientation significantly modulates local temperatures by regulating solar radiation ingress [23,24]. In contrast, the South- and North-facing orientations demonstrate identical temperature profiles, reflecting similar exposure to solar radiation. However, relative humidity is more sensitive to orientation, with the North-facing U-shaped space exhibiting the highest humidity levels, which highlights the role of shading in reducing evaporation. This observation corroborates Oke’s seminal urban climate studies [32]. Therefore, the northward-facing design offers a more favorable microclimate for maintaining elevated humidity levels. Furthermore, wind speed is notably influenced by spatial orientation, with both the South- and North-facing U-shaped spaces experiencing heightened wind speeds, suggesting that these orientations are advantageous for harnessing natural airflow and optimizing ventilation pathways. Müller et al. concluded that increasing wind speed in summer could reduce PET up to 15 °C [33]. Research underscores the role of wind in heat and moisture exchange, with optimal wind speed enhancements significantly elevating thermal comfort [32,33,34]. Additionally, wind is integral in mitigating the urban heat island effect, serving as a natural mechanism for cooling [38].
For L-shaped layouts, the effect of orientation is shown in Table 9. In terms of air temperature, the Southwest-oriented L-shaped design has the lowest average temperature (42.09 °C). This is mainly due to the effective shading provided by vegetation during the late morning, which significantly mitigates solar radiation accumulation. Conversely, the Southeast and Northeast-facing designs recorded higher temperatures (42.38 °C), largely due to prolonged direct sunlight exposure during the morning. With regard to humidity, the Northwest-facing L-shaped configuration had the highest humidity level (42.96%). This outcome highlights a significant shading effect that minimizes water evaporation. Conversely, the Southeast and Northeast orientations exhibited the lowest humidity levels (42.76%), as intense morning sunlight accelerated evaporation. In terms of wind speed, the Northwest-facing L-shaped landscape achieved the highest wind speed (1.486 m/s), closely followed by the Southwest-facing design (1.481 m/s). These orientations effectively leverage natural wind flow patterns, optimizing air circulation. On the other hand, the Southeast and Northeast-facing layouts exhibited the lowest wind speeds (1.442 m/s and 1.438 m/s, respectively). In conclusion, the Southwest-oriented L-shaped design excels in temperature reduction, while the Northwest-oriented layout proves most advantageous in enhancing both humidity and wind speed.
In parallel-line layouts, the effect of orientation is detailed in Table 10. The simulation results for the two orientations show that the average air temperatures are remarkably similar, recorded at 42.24 °C (North–South) and 42.29 °C (East–West). This indicates that the temperature regulation capacity of the parallel-line layout remains largely unaffected by orientation. Similarly, the relative humidity values between the North–South (42.91%) and East–West (42.93%) orientations exhibit negligible variation, suggesting that both configurations achieve similar humidity regulation. Notably, wind speed is slightly higher in the North–South aligned layout (1.478 m/s) compared to its East–West counterpart (1.430 m/s), implying a marginal advantage in wind enhancement in the former. This difference is likely due to the orientation’s influence on airflow dynamics. The North–South configuration facilitates better wind flow (wind direction distribution for parallel-line spaces is depicted in Figure 15). Higher wind speed is instrumental in optimizing the body’s heat dissipation, particularly in extreme heat, by facilitating convective cooling, thereby reducing surface temperature and improving thermal comfort. Variations in wind direction, by modulating the distribution of wind velocity and temperature–humidity gradients, can alter the local microclimate, thereby influencing human thermal sensation. The interplay of wind direction and speed is crucial for alleviating the urban heat island effect and augmenting the outdoor thermal experience [40,41]. In conclusion, while both parallel-line configurations exhibit comparable impacts on air temperature and relative humidity, the North–South orientation is slightly better for regulating wind speed.
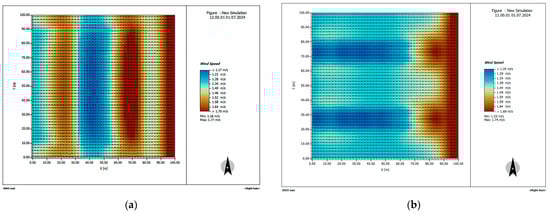
Figure 15.
Wind direction distribution map of different parallel-line oriented plant communities at 1.4 m height. (a) North–South; (b) East–West orientations.
In addition, this study investigated the influence of different spatial arrangements of plant communities on microclimatic regulation. Two planting configurations, each with equivalent canopy coverage, were compared: a regular grid layout and a more naturalistic arrangement. These arrangements are shown in Figure 16 and Figure 17, with results in Table 11. The results demonstrate that, with identical vegetation cover, the overall wind speed at a height of 1.4 m is consistently lower in the regularly spaced community compared to the naturally arranged layout. Since 1.4 m is typically situated beneath the canopy, additional wind speed and directional data were collected at a height of 7 m to assess wind speed trends and canopy configuration. The findings reveal that at 7 m, the wind speed in the regularly arranged plant community remains significantly lower than that in the naturally structured layout (Figure 18).
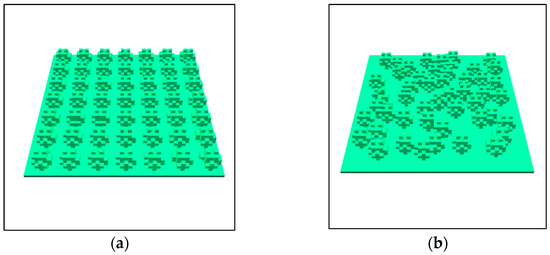
Figure 16.
Three-Dimensional models of plant communities with different spatial configurations/arrangement patterns. (a) Regular layout. (b) Natural layout.
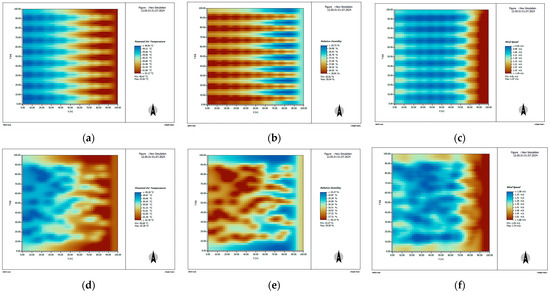
Figure 17.
Distribution of air temperature, humidity, and wind speed in plant communities with different spatial configurations/arrangement patterns. (a) The air temperature at 1.4 m height was 50.85 °C at 12:00 p.m. in the “Regular” plant communities (spatial average). (b) The humidity at 1.4 m height was 27.17% at 12:00 p.m. in the “Regular” plant communities (spatial average). (c) The wind speed at 1.4 m height was 1.146 m/s at 12:00 p.m. in the “Regular” plant communities (spatial average). (d) The air temperature at 1.4 m height was 51.16 °C at 12:00 p.m. in the “Natural” plant communities (spatial average). (e) The humidity at 1.4 m height was 26.54% at 12:00 p.m. in the “Natural” plant communities (spatial average). (f) The wind speed at 1.4 m height was 1.335 m/s at 12:00 p.m. in the “Natural” plant communities (spatial average).
Table 11.
Microclimate regulation at 1.4 m height in plant communities with different spatial configurations/arrangement patterns from 7:00 a.m. to 10:00 p.m.
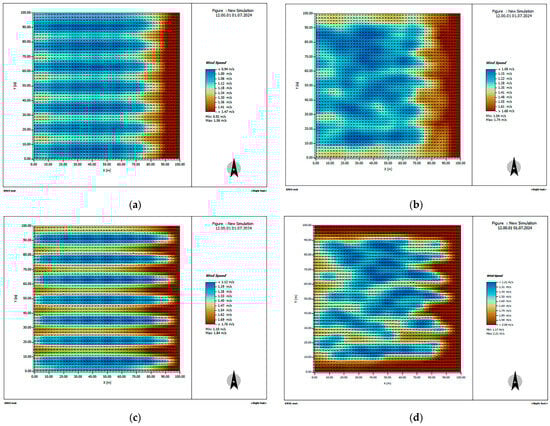
Figure 18.
Wind direction distribution map of different spatial configurations/arrangement patterns at different heights. (a) Wind direction distribution map of plant communities with different spatial configurations/arrangement patterns at 1.4 m (regular layout). (b) Wind direction distribution map of plant communities with different spatial configurations/arrangement patterns at 1.4 m (natural layout). (c) Wind direction distribution map of plant communities with different spatial configurations/arrangement patterns at 7 m (regular layout). (d) Wind direction distribution map of plant communities with different spatial configurations/arrangement patterns at 7 m (natural layout).
Naturally arranged plant communities, with their irregular distribution, create complex air circulation. The irregular gaps between the plants create varied ventilation pathways. This configuration is advantageous in low-wind conditions, as it promotes air redistribution. The uneven distribution of trees and shrubs in a natural layout induces localized turbulence as air flows through these areas, thereby promoting air dispersion. This turbulence reduces air stagnation and improves the overall ventilation performance. In contrast, regularly spaced plant communities tend to establish more defined airflow paths, yet these paths can also increase the resistance to air movement. The uniform canopy distribution restricts the free flow of air between plant gaps, especially under low-wind or calm conditions, which can reduce ventilation efficacy. Therefore, the natural layout is more effective at promoting air movement.
In conclusion, strategically designing the horizontal layout of plant communities is a critical method for regulating the urban microclimate. Proper spatial arrangement can optimize airflow, temperature, and humidity, helping to mitigate the urban heat island effect and improve thermal comfort.
4. Discussion and Implications
4.1. Discussion
The Urban Heat Island effect presents a critical challenge to urban sustainability. Extensive research has advanced our understanding of UHI mechanisms and identified key mitigation strategies [1,2,3]. Building on this foundation, our study contributes by integrating three pivotal design parameters—tree spacing, canopy structure, and spatial geometry—within a unified analytical framework. The results not only reinforce the decisive role of optimized vegetation configuration in microclimate regulation [14] but also deliver a refined, quantitatively grounded foundation for the design of climate-resilient urban environments.
4.1.1. Microclimate Regulation: The Role of Tree Spacing
A central argument of this section is that the microclimatic effect of tree spacing is governed by a nonlinear trade-off between shading efficiency and aerodynamic drag. This finding challenges prevailing planting guidelines that often prioritize single-objective optimization, such as maximizing shade coverage, without accounting for the ventilation penalties incurred at high densities.
Our data reveal a clear optimum: spacing between 8 and 10 m enhances cooling and humidification, but further reduction suppresses wind speed, diminishing net thermal benefit. This identified “optimal range” is narrower than the recommendations typical of arid-region studies, where wider spacing is advised to reduce water competition [42]. Conversely, it aligns closely with observations in other humid subtropical climates, where the benefits of dense shading and transpiration often outweigh ventilation needs [39,43]. Importantly, our work extends these insights by showing that even within favorable humid climates, the cooling effect on synthetic comfort indices like PET can be limited if ventilation is excessively impeded [31], underscoring that thermal comfort integrates factors beyond temperature and humidity alone.
The nonlinear wind-speed response—increasing from 18 m to 14 m then decreasing sharply at 8 m—offers a mechanistic explanation for this trade-off. The initial increase likely stems from flow channeling between trunks, which enhances near-surface ventilation. However, below the threshold, the canopy acts as a continuous, high-drag porous medium, drastically increasing aerodynamic roughness and suppressing airflow [19,44]. This aerodynamic transition highlights a critical, and often overlooked, design conflict: pursuing maximum cooling through ultra-dense planting may inadvertently degrade local air quality and hinder the dispersion of pollutants or pathogens—a concern raised in urban-ventilation and public-health literature [45,46]. Resolving this conflict requires interdisciplinary design approaches that balance thermal, air-quality, and health objectives.
Therefore, tree spacing should be treated not as a fixed “optimal value” but as a calibratable lever that balances thermal regulation, ventilation, and latent ecological-health trade-offs. This perspective naturally leads to the next question: how can spatial layout and configuration further modulate these relationships?
4.1.2. Tree Canopy Classification and Its Impact on Microclimate
This section posits that canopy coverage, rather than vertical structural complexity, is the paramount structural determinant of microclimate regulation. Our finding directly challenges a common design presumption that increasing vertical layering is a reliably effective strategy for enhancing cooling performance.
The dominance of canopy coverage is strongly supported by our data (R2 = 0.973 vs. 0.024 for vertical structure) and corroborates a growing cross-typological consensus. Studies have identified specific canopy coverage thresholds for optimizing thermal comfort in residential quarters [47], and orthogonal experiments in parks consistently rank canopy coverage as the most influential factor on PET [48]. Our study critically extends this consensus by providing a direct, controlled comparison between coverage and vertical stratification. While prior park research identified factors like canopy diameter (CD) as secondary to canopy coverage [48], it did not isolate the effect of adding discrete understory layers. Our results demonstrate that such multi-layering offers negligible microclimatic benefit under moderate coverage (LAI ≈ 1), suggesting diminishing returns for cooling-focused investments in complex vertical structures within many managed urban parks.
A nuanced analysis reconciles an apparent contradiction with research on pocket parks, which highlights the importance of the vertical dimension—specifically, the substantial green volume of a primary canopy layer [49]. This contrasts with but does not conflict with our findings. Their work emphasizes the cooling efficacy of investing in the height and volume of a dominant canopy, a form of structural investment within a single layer. Our variable “multi-layer” specifically tested the addition of subordinate strata. Both studies converge on a critical principle: the primary allocation of biomass into a well-developed, shading canopy is essential. Our contribution is to specify that subdividing this biomass into multiple distinct vertical strata may not enhance cooling if total light interception and airflow regulation are not substantially improved. This raises a critical design question: should resources be directed toward growing taller trees with larger crowns, or toward planting understory shrubs?
Therefore, for projects where cooling is the primary objective, the evidence-based design hierarchy is clear: first, maximize horizontal canopy coverage, and then, if investing in structure, prioritize developing a substantial primary canopy layer over implementing complex multi-layering. This refined understanding of structural effectiveness sets the stage for examining how horizontal layout, the subject of the next section, interacts with these vertical design priorities.
4.1.3. Effects of Horizontal Layout and Spatial Configuration of Plant Communities on Microclimate
This section argues that the fully enclosed “mouth-shaped” layout creates a self-reinforcing cool-humid pocket, offering superior microclimate regulation in hot-humid climates, but its efficacy is contingent on orientation and local wind regimes—a finding that challenges static, context-independent typological design.
Our data confirm the “mouth-shaped” layout’s optimal performance (lowest temperature, highest humidity, favorable wind speed), arising from its synergistic radiative and aerodynamic enclosure [50]. This finding deepens the understanding of the “courtyard effect.” Research on courtyards shows that integrated, uniform plant layouts optimize multi-parameter comfort [14]; our study quantifies how spatial enclosure itself at a larger scale is a primary driver for creating such buffered zones. Conversely, our results diverge from and complement insights from urban-canyon studies. While canyon geometry critically alters wind and sun exposure [51], our work in open parks shows that elongated linear layouts induce significant drag, suppressing wind speed akin to deep canyons, highlighting that unfavorable aerodynamic effects can emerge even in open settings.
A critical analysis reveals that no layout is intrinsically optimal. Cross-city comparisons starkly illustrate that vegetation can worsen comfort in already-humid climates [52], directly challenging the universal recommendation of any single layout form. Therefore, our endorsement of the “mouth-shaped” layout is strictly conditional on a climate where latent cooling is highly valuable. In constrained contexts like street canyons, where full enclosure is impractical, research demonstrates that strategic tree placement within a fixed geometry (e.g., 2 m spacing in canyons) becomes a more effective strategy for targeted cooling and comfort improvement, especially for vulnerable groups [52]. This presents a design paradox: the optimal strategy shifts from configuring the macro-layout in open spaces to manipulating micro-placement within constrained geometries.
Consequently, microclimate-responsive design must adopt a nested, scale-aware framework. At the park or plaza scale, achieving enclosure (e.g., “mouth-shaped”) is a powerful strategy. At the street-canyon scale, aspect ratio and precise tree placement take precedence. This hierarchy necessitates moving beyond prescriptive typologies to performance-based calibration, where the chosen layout is fine-tuned by the next critical variable: orientation, which modulates its solar exposure and wind-capture potential.
4.1.4. Microclimate Regulation of Orientation and Wind Flow in U- and L-Shaped Configurations
This section establishes orientation as a pivotal and active design variable that critically modulates the microclimatic performance of semi-enclosed layouts, challenging the common practice of divorcing layout design from its specific solar and wind context.
Our data provide empirical validation for model-driven principles: East-facing exposures induce higher temperatures due to morning sun, while North-facing orientations retain humidity through shading, aligning with solar-radiation models [53]. More significantly, we demonstrate that orientation is not a fixed site constraint but an optimizable parameter. This principle is well-established in building-scale multi-objective optimization balancing daylight and energy use [54]; our work extends its applicability to the outdoor public-space domain, proving that orientation can be strategically selected to maximize cooling, humidity retention, or wind capture for layouts like U-shaped and L-shaped configurations.
A critical analysis reveals a major implementation gap. Despite its proven importance, the integration of site-specific solar and wind-rose analysis into binding planning regulations remains inadequate, often relegated to advisory status. This directly undermines the potential efficacy of even the most thoughtfully selected layouts. Our findings unequivocally show that the performance of an optimal “mouth-shaped” enclosure is contingent upon its alignment with prevailing summer breezes to function as an “air-catchment” system; misorientation can nullify its benefits. This highlights a systemic flaw in current practice that prioritizes form over climatic performance.
Therefore, we advocate for a fundamental paradigm shift from applying fixed typologies to implementing a predictive, climate-responsive design workflow. This workflow must (1) mandate site-specific climate data analysis (solar paths, wind roses) as a prerequisite, (2) utilize environmental simulation tools (e.g., ENVI-met) not merely for verification but for generative design and performance-based optimization of layout and orientation, and (3) embed quantitative microclimate targets within broader multi-criteria decision frameworks [55,56,57]. By quantifying orientation’s modulating effect, our study supplies the essential empirical parameters to inform this next generation of climate-intelligent design standards and optimization algorithms, moving solar and wind analysis from the periphery to the core of performance-based planning.
4.2. Implications
4.2.1. Theoretical Implications
This study makes distinct theoretical contributions by advancing landscape ecology’s pattern–process theory into the domain of designed urban ecosystems. First, it operationalizes and quantifies the theory at the plant–community scale, transforming the abstract relationship between “spatial pattern” and “ecological process” into predictive, quantitative relationships between specific design parameters (horizontal layout, tree spacing, vertical structure) and measurable microclimatic outcomes (temperature, humidity, wind). This moves the theory from a descriptive framework to a generative tool for climate-responsive design.
Second, our findings refine a key theoretical assumption concerning structural complexity. While the theory posits that complex spatial patterns influence processes, it does not rank pattern dimensions. Our results demonstrate that horizontal configuration (layout geometry and density) exerts an overwhelmingly stronger influence on microclimatic processes than vertical canopy stratification under common urban conditions. This establishes a hierarchy of influence within spatial patterns, a significant nuance for applying the theory to optimize environmental performance where resources are constrained.
Finally, the study extends the theory’s scope by integrating aerodynamic and thermodynamic mechanisms explicitly. It clarifies that the “process” in vegetated spaces is not merely shading and transpiration but a coupled system involving radiative exchange, latent heat flux, and airflow modulation, with orientation acting as a critical modulator. This enriched mechanistic understanding strengthens the theory’s capacity to explain and predict outcomes in complex-built environments.
4.2.2. Policy and Practical Implications
The findings translate into actionable recommendations for urban planners, landscape architects, and policymakers:
Incorporate Performance-Based Metrics into Design Guidelines: Revise municipal landscaping codes for hot-humid climates to include quantitative microclimate performance targets. For example, define a recommended tree spacing range (e.g., 8–12 m) to balance cooling and ventilation.
Adopt Climate-Responsive Layout Templates: Formalize and promote the use of evidence-based spatial templates in public project briefs. Enclosed layouts (e.g., “mouth-shaped”) should be prioritized for plazas and parks where heat mitigation is critical, while semi-enclosed or linear layouts should be recommended for sites requiring enhanced air exchange.
Mandate Site-Specific Climate Analysis in Planning Approvals: Make solar path and wind-rose analysis a compulsory component of the environmental assessment for major developments. Require proponents to demonstrate through simulation that proposed green space layouts are oriented to maximize summer shading and align with prevailing breezes for natural ventilation.
Implement a Tiered Design-Review Workflow: Establish a two-stage review process for large-scale projects: first, assess the macro-layout against climate-responsive typologies; second, evaluate the micro-configuration (tree placement, species selection) using validated simulation tools (e.g., ENVI-met) to verify performance targets are met before approval.
Develop Integrated Decision-Support Tools: Support the creation of publicly accessible digital planning tools that integrate local climate data with our quantified parameters. These tools could allow designers to interactively test layout, spacing, and orientation options against predicted microclimate outcomes, fostering informed, performance-driven design from the project outset.
5. Conclusions and Limitations
5.1. Conclusions
This study systematically evaluates the microclimatic effects of key design parameters for urban plant communities. The findings provide a comparative hierarchy of effectiveness:
- (1)
- Regarding tree spacing and canopy coverage: A reduction in tree spacing combined with high canopy coverage consistently yielded the strongest cooling and humidifying effects across all layout types. This demonstrates that maximizing shade density is the foundational strategy for microclimate regulation.
- (2)
- Regarding canopy structural complexity: A pivotal finding is that increasing canopy coverage (horizontal density) had an overwhelmingly greater impact on microclimate than increasing vertical structural complexity (from single-layer to multi-layer). This suggests that achieving dense canopy closure should be prioritized over pursuing intricate multi-layered structures when the primary goal is cooling.
- (3)
- Regarding horizontal spatial configuration: Among the tested layouts, the fully enclosed “mouth-shaped” configuration proved optimal for accumulating cool, moist air and providing the most significant thermal improvement. Semi-enclosed and linear layouts, while less effective at peak cooling, offered better ventilation and a more balanced modulation of temperature, humidity, and wind speed.
- (4)
- Regarding layout orientation: Orientation served as a critical modulating factor. North-facing and East-facing orientations consistently enhanced the cooling performance of all layouts by reducing afternoon solar exposure, whereas South-facing and West-facing orientations attenuated it.
In summary, for urban heat mitigation, the evidence-based design priority is to, first, maximize canopy cover through reduced tree spacing, second, employ enclosed layouts where feasible, and third, optimize orientation to minimize heat gain. This hierarchy provides a clear, actionable framework for planners to optimize green space design for climate adaptation.
For urban planning and policy, these results translate into clear priorities: (1) revising design standards to mandate high canopy coverage and optimized tree spacing, (2) promoting enclosed layouts (e.g., “mouth-shaped”) in heat-vulnerable areas, and (3) integrating orientation analysis to harness natural ventilation. Implementing these evidence-based guidelines can directly enhance the climate resilience of urban green infrastructure [41,42]. This study advances landscape ecology’s pattern–process theory toward a predictive and quantifiable direction at the urban design scale.
5.2. Limitations and Future Research
While this study provides quantitative insights into the effects of spatial configuration, several limitations should be acknowledged, which also point to valuable directions for future work [34,35].
First, the simulation scenarios, though systematic, were based on idealized plant community models with simplified crown shapes and fixed leaf area indices (LAI). Future research could incorporate more realistic tree morphologies, species-specific traits (e.g., varying LAI, stomatal conductance), and seasonal phenological changes to enhance model accuracy and biological relevance [37].
Second, the study primarily focused on the hydrodynamic regulation of air temperature and humidity. Other critical aspects of human thermal comfort, such as mean radiant temperature, which is heavily influenced by surface materials and longwave radiation exchange, were not fully captured. Integrating radiant energy balance into future assessments would provide a more holistic view of thermal comfort.
Third, the research was conducted under specific, stable summer weather conditions to isolate configuration effects. The performance of these optimized layouts under diverse meteorological conditions (e.g., windy, cloudy, or transitional seasons) remains to be tested. Investigating their resilience and effectiveness across a broader climatic spectrum is an essential next step.
Finally, the economic and practical feasibility of implementing the proposed high-density or specific layout designs in varied urban contexts requires further interdisciplinary study, involving landscape architecture, urban planning, and cost–benefit analysis.
Addressing these limitations in future work will help translate the established theoretical framework into robust, context-adaptive design guidelines for urban green infrastructure.
Author Contributions
Conceptualization: Q.D. and X.Z.; methodology: J.Z. and L.Z.; software: L.Z. and J.Z.; validation: Q.D., X.Z., and Q.W.; formal analysis: C.X.; investigation: Y.H.; resources: X.C.; data curation: C.X.; writing—original draft preparation: L.Z. and J.Z.; writing—review and editing: Q.D. and X.Z.; visualization: Q.D.; supervision: Q.D. and X.Z.; project administration: X.Z. All authors have read and agreed to the published version of the manuscript.
Funding
This research was funded by the Public Welfare Fund of Zhejiang Province (LGN22C160006), as well as the Talent Program of Zhejiang, Zhejiang Agriculture and Forestry University, and Jiyang College (RQ2020B04/RQ1911B05/RC2023B07).
Data Availability Statement
All meteorological data collection activities have been reported to and authorized by the Shaoxing Meteorological Bureau. The datasets are not publicly available due to regional regulations that govern data sharing and access. If necessary, you can contact the authors via email.
Acknowledgments
Many thanks to all student helpers and participants in the survey, especially the Shaoxing Meteorological Bureau.
Conflicts of Interest
The authors declare no conflicts of interest.
References
- Sun, S.; Cao, P.; Chan, K.; Chan, K.P.; Tsang, H.; Wong, C.M.; Thach, T.Q. Temperature as a modifier of the effects of fine particulate matter on acute mortality in Hong Kong. Environ. Pollut. 2015, 205, 357–364. [Google Scholar] [CrossRef]
- Nasrallah, H.A.; Nieplova, E.; Ramadan, E. Warm season extreme temperature events in Kuwait. J. Arid Environ. 2004, 56, 357–371. [Google Scholar] [CrossRef]
- Santamouris, M.; Cartalis, C.; Synnefa, A.; Kolokotsa, D. On the impact of urban heat island and global warming on the power demand and electricity consumption of buildings—A review. Energy Build. 2015, 98, 119–124. [Google Scholar] [CrossRef]
- Kong, F.; Yin, H.; James, P.; Hutyra, L.R.; He, H.S. Effects of spatial pattern of greenspace on urban cooling in a large metropolitan area of eastern China. Landsc. Urban Plan. 2014, 128, 35–47. [Google Scholar] [CrossRef]
- Konarska, J.; Uddling, J.; Holmer, B.; Lutz, M.; Lindberg, F.; Pleijel, H.; Thorsson, S. Transpiration of urban trees and its cooling effect in a high latitude city. Int. J. Biometeorol. 2015, 60, 159–172. [Google Scholar] [CrossRef] [PubMed]
- Rahman, M.A.; Moser, A.; Roetzer, T.; Pauleit, S. Comparing the transpirational and shading effects of two contrasting urban tree species. Urban Ecosyst. 2019, 22, 683–697. [Google Scholar] [CrossRef]
- Li, X.; Zhou, W.; Ouyang, Z. Relationship between land surface temperature and spatial pattern of greenspace: What are the effects of spatial resolution? Landsc. Urban Plan. 2013, 114, 1–8. [Google Scholar] [CrossRef]
- Wang, X.; Dallimer, M.; Scott, C.E.; Shi, W.; Gao, J. Tree species richness and diversity predicts the magnitude of urban heat island mitigation effects of greenspaces. Sci. Total Environ. 2021, 770, 145211. [Google Scholar] [CrossRef]
- Chan, S.Y.; Chau, C.K. On the study of the effects of microclimate and park and surrounding building configuration on thermal comfort in urban parks. Sustain. Cities Soc. 2020, 64, 102512. [Google Scholar] [CrossRef]
- Skelhorn, C.; Lindley, S.; Levermore, G. The impact of vegetation types on air and surface temperatures in a temperate city: A fine scale assessment in Manchester, UK. Landsc. Urban Plan. 2014, 121, 129–140. [Google Scholar] [CrossRef]
- Masmoudi, S.; Mazouz, S. Relation of geometry, vegetation and thermal comfort around buildings in urban settings, the case of hot arid regions. Energy Build. 2004, 36, 710–719. [Google Scholar] [CrossRef]
- Wu, Y.; Patuano, A.; Mashhoodi, B.; Lenzholzer, S.; Acred, A.; Zertuche, L.N. How small green spaces cool urban neighbourhoods: Optimising distribution, size and shape. Landsc. Urban Plan. 2025, 253, 105224. [Google Scholar] [CrossRef]
- Wang, X.; Rahman, M.A.; Mokros, M.; Rötzer, T.; Pattnaik, N.; Pang, Y.; Song, K. The influence of vertical canopy structure on the cooling and humidifying urban microclimate during hot summer days. Landsc. Urban Plan. 2023, 238, 104841. [Google Scholar] [CrossRef]
- Zheng, G.; Xu, H.; Liu, F.; Dong, J. Impact of plant layout on microclimate of summer courtyard space based on orthogonal experimental design. Sustainability 2024, 16, 4425. [Google Scholar] [CrossRef]
- Nie, X.; Lin, J.; Ma, J.; Cao, B.; Li, Y.; Lu, Y. The Cooling Effect of Plant Configuration on Urban Parks Green Space in Temperate Continental Climate Zones. Appl. Spat. Anal. Policy 2024, 17, 1463–1483. [Google Scholar] [CrossRef]
- Azcarate, I.; Acero, J.Á.; Garmendia, L.; Rojí, E. Tree layout methodology for shading pedestrian zones: Thermal comfort study in Bilbao (Northern Iberian Peninsula). Sustain. Cities Soc. 2021, 72, 102996. [Google Scholar] [CrossRef]
- Sheng, Q.; Ji, Y.; Jia, C.; Jiang, L.; Li, C.; Huang, Z.; Ma, C.; Zhang, X.; Chen, H.; Wang, T.; et al. Differential effects of cooling and humidification in urban green spaces and thresholds of vegetation community structure parameters: A case study of the Yangtze River Delta region. Cities 2025, 159, 105765. [Google Scholar] [CrossRef]
- Qin, Z.; Li, Z.; Cheng, F.; Chen, J.; Liang, B. Influence of canopy structural characteristics on cooling and humidifying effects of Populus tomentosa community on calm sunny summer days. Landsc. Urban Plan. 2014, 127, 75–82. [Google Scholar] [CrossRef]
- Maurer, K.D.; Hardiman, B.S.; Vogel, C.S.; Bohrer, G. Canopy-structure effects on surface roughness parameters: Observations in a Great Lakes mixed-deciduous forest. Agric. For. Meteorol. 2013, 177, 24–34. [Google Scholar] [CrossRef]
- Ali-Toudert, F.; Mayer, H. Numerical study on the effects of aspect ratio and orientation of an urban street canyon on outdoor thermal comfort in hot and dry climate. Build. Environ. 2006, 2, 41. [Google Scholar] [CrossRef]
- Zhu, J.; Feng, J.; Lu, J.; Chen, Y.; Li, W.; Lian, P.; Zhao, X. A review of the influence of courtyard geometry and orientation on microclimate. Build. Environ. 2023, 5, 236. [Google Scholar] [CrossRef]
- Yang, Y.; Lan, H. A review of the application of numerical simulation tools in urban microclimate research: Taking ENVI-met software as an example. In Proceedings of the 15th International Conference on Green Building and Building Energy Efficiency and New Technologies and Products Expo, Shenzhen, China, 4 March 2019. (In Chinese). [Google Scholar]
- Fang, X.; Wang, P.; Qiao, D. Study on the ventilation design elements of the Shunde Qinghui Garden layout based on ENVI-met simulation. Urban Archit. 2018, 33, 8. (In Chinese) [Google Scholar] [CrossRef]
- Phung, D.; Guo, Y.; Thai, P.; Rutherford, S.; Wang, X.; Nguyen, M.; Do, C.M.; Nguyen, N.H.; Alam, N.; Chu, C. The effects of high temperature on cardiovascular admissions in the most populous tropical city in Vietnam. Environ. Pollut. 2016, 208, 33–39. [Google Scholar] [CrossRef] [PubMed]
- Hwang, R.L.; Lin, T.P.; Matzarakis, A. Seasonal effect of urban street shading on long-term outdoor thermal comfort. Build. Environ. 2011, 46, 863–870. [Google Scholar] [CrossRef]
- Tsoka, S.; Leduc, T.; Rodler, A. Journal Pre-proof Assessing the effects of urban street trees on building cooling energy needs: The role of foliage density and planting pattern. Sustain. Cities Soc. 2021, 65, 102633. [Google Scholar] [CrossRef]
- Fabbri, K.; Canuti, G.; Ugolini, A. A methodology to evaluate outdoor microclimate of the archaeological site and vegetation role: A case study of the Roman Villa in Russi (Italy). Sustain. Cities Soc. 2017, 35, 107–133. [Google Scholar] [CrossRef]
- Liu, Z.; Cheng, W.; Jim, C.; Morakinyo, T.E.; Shi, Y.; Ng, E. Heat mitigation benefits of urban green and blue infrastructures: A systematic review of modeling techniques, validation and scenario simulation in ENVI-met V4. Build. Environ. 2021, 200, 107939. [Google Scholar] [CrossRef]
- Lin, T.P. Thermal perception, adaptation and attendance in a public square in hot and humid regions. Build. Environ. 2009, 44, 2017–2026. [Google Scholar] [CrossRef]
- Xiao, X.; Dong, L.; Yan, H.; Yang, N.; Xiong, Y. The influence of the spatial characteristics of urban green space on the urban heat island effect in Suzhou Industrial Park. Sustain. Cities Soc. 2018, 40, 428–439. [Google Scholar] [CrossRef]
- Jang, S.; Jung, J. Urban form and green space structure as drivers of urban heat mitigation. Sustain. Cities Soc. 2025, 130, 106597. [Google Scholar] [CrossRef]
- Oke, T.R.; Crowther, J.M.; Mcnaughton, K.G. The micrometeorology of the urban forest. Philos. Trans. R. Soc. B Biol. Sci. 1989, 324, 335–349. [Google Scholar] [CrossRef]
- Mueller, N.; Kuttler, W.; Barlag, A.B. Counteracting urban climate change: Adaptation measures and their effect on thermal comfort. Theor. Appl. Climatol. 2014, 115, 243–257. [Google Scholar] [CrossRef]
- H’Ng, Y.; Ikegaya, N.; Zaki, S.A.; Hagishima, A.; Mohammad, A.F. Wind-tunnel estimation of mean and turbulent wind speeds within canopy layer for urban campus. Urban Clim. 2022, 41, 101064. [Google Scholar] [CrossRef]
- Daranee, J.; Manat, S. A comparative study of cooling performance and thermal comfort under street market shades and tree canopies in tropical savanna climate. Sustainability 2022, 14, 4653. [Google Scholar] [CrossRef]
- Shashua-Bar, L.; Hoffman, M. Vegetation as a climatic component in the design of an urban stree. Energy Build. 2000, 313, 221–235. [Google Scholar] [CrossRef]
- Shashua-Bar, L.; Tsiros, I.X.; Hoffman, M.E. A modeling study for evaluating passive cooling scenarios in urban streets with trees. Case study: Athens, Greece. Build. Environ. 2010, 45, 2798–2807. [Google Scholar] [CrossRef]
- Taleghani, M. Outdoor thermal comfort by different heat mitigation strategies—A review. Renew. Sustain. Energy Rev. 2017, 81, 2011–2018. [Google Scholar] [CrossRef]
- Liu, H.; Lim, J.Y.; Thet, B.W.H.; Lai, P.Y.; Koh, W.S. Evaluating the impact of tree morphologies and planting densities on outdoor thermal comfort in tropical residential precincts in Singapore. Build. Environ. 2022, 221, 12. [Google Scholar] [CrossRef]
- Hadianpour, M.; Mahdavinejad, M.; Bemanian, M.; Haghshenas, M.; Kordjamshidi, M. Effects of windward and leeward wind directions on outdoor thermal and wind sensation in Tehran. Build. Environ. 2019, 150, 164–180. [Google Scholar] [CrossRef]
- Du, H.; Zhou, F.; Cai, W.; Cai, Y.; Xu, Y. Thermal and Humidity Effect of Urban Green Spaces with Different Shapes: A Case Study of Shanghai, China. Int. J. Environ. Res. Public Health 2024, 18, 5941. [Google Scholar] [CrossRef]
- Zhao, Q.; David, S.; Elizabeth, W. Impact of tree locations and arrangements on outdoor microclimates and human thermal comfort in an urban residential environment. Urban For. Urban Green. 2018, 32, 81–91. [Google Scholar] [CrossRef]
- Xiao, Y.; Huang, Y.; Pan, X. Optimizing Thermal Comfort in Urban Squares of Hot-Humid Regions: A Case Study Considering Tree Growth, Species, and Planting Intervals. Atmosphere 2025, 16, 63. [Google Scholar] [CrossRef]
- Hu, D.; Xing, L.; Huang, S.; Deng, L.; Xu, Y. Parameterization of aerodynamic roughness of China’s land surface vegetation from remote sensing data. J. Appl. Remote Sens. 2014, 8, 083528. [Google Scholar] [CrossRef]
- Xing, Y.; Brimblecombe, P. Role of vegetation in deposition and dispersion of air pollution in urban parks. Atmos. Environ. 2019, 201, 73–83. [Google Scholar] [CrossRef]
- Diener, A.; Mudu, P. How can vegetation protect us from air pollution? A critical review on green spaces’ mitigation abilities for air-borne particles from a public health perspective-with implications for urban planning. Sci. Total Environ. 2021, 796, 148605. [Google Scholar] [CrossRef] [PubMed]
- Li, Y.; Lin, D.; Zhang, Y.; Song, Z.; Sha, X.; Zhou, S.; Chen, C.; Yu, Z. Quantifying tree canopy coverage threshold of typical residential quarters considering human thermal comfort and heat dynamics under extreme heat. Build. Environ. 2023, 233, 110100. [Google Scholar] [CrossRef]
- Xue, S.; Chao, X.; Wang, K.; Wang, J.; Xu, J.; Liu, M.; Ma, Y. Impact of canopy coverage and morphological characteristics of trees in urban park on summer thermal comfort based on orthogonal experiment design: A case study of lvyin park in Zhengzhou, China. Forests 2023, 14, 2098. [Google Scholar] [CrossRef]
- Zhou, S.; Yu, Z.; Ma, W.; Yao, X.; Xiong, J.; Ma, W.; Xiang, S.; Yuan, Q.; Hao, Y.; Xu, D.; et al. Vertical canopy structure dominates cooling and thermal comfort of urban pocket parks during hot summer days. Landsc. Urban Plan. 2025, 254, 12. [Google Scholar] [CrossRef]
- Sodoudi, S.; Zhang, H.; Chi, X.; Müller, F.; Li, H. The influence of spatial configuration of green areas on microclimate and thermal comfort. Urban For. Urban Green. 2018, 34, S16188667–S17303722. [Google Scholar] [CrossRef]
- Lopez-Cabeza, V.P.; Loor-Vera, M.J.; Diz-Mellado, E.; Rivera-Gomez, C.; Galan-Marin, C. Decoding outdoor thermal comfort: The role of location in urban canyon microclimate. Sustain. Energy Technol. Assess. 2024, 72, 104095. [Google Scholar] [CrossRef]
- Park, K.; Jun, C.; Baik, J.; Kim, H.J. Urban Canyon Design with Aspect Ratio and Street Tree Placement for Enhanced Thermal Comfort: A Comprehensive Thermal Comfort Assessment Accounting for Gender and Age in Seoul, Republic of Korea. Buildings 2024, 14, 2517. [Google Scholar] [CrossRef]
- Tomasi, M.; Nikolopoulou, M.; Giridharan, R.; Löve, M. A design workflow for effective solar shading of pedestrian paths. Build. Environ. 2024, 261, 111718. [Google Scholar] [CrossRef]
- Yao, S.; Li, M.; Yuan, J.; Huo, Q.; Zhao, S.; Wu, Y. Optimization design of layout dimension for residential buildings weighing up daylighting, thermal comfort, and indoor air quality with a low-carbon decision-making. J. Build. Eng. 2024, 98, 111328. [Google Scholar] [CrossRef]
- Lin, S.; Du, J.; Fan, J. Spatio-Temporal Evolution of Surface Urban Heat Island Distribution in Mountainous Urban Areas Based on Local Climate Zones: A Case Study of Tongren, China. Sustainability 2025, 17, 8744. [Google Scholar] [CrossRef]
- Zhang, L.; Zhan, Q.; Lan, Y. Effects of the tree distribution and species on outdoor environment conditions in a hot summer and cold winter zone: A case study in Wuhan residential quarters. Build. Environ. 2018, 130, 27–39. [Google Scholar] [CrossRef]
- Chen, X.; Han, M.; He, J.; Ma, H.; Han, M.; Liu, Y.; Wu, X. Integrated effect of aspect ratio and tree spacing on pedestrian thermal comfort of street canyon. Int. J. Biometeorol. 2025, 68, 2115–2131. [Google Scholar] [CrossRef] [PubMed]
Disclaimer/Publisher’s Note: The statements, opinions and data contained in all publications are solely those of the individual author(s) and contributor(s) and not of MDPI and/or the editor(s). MDPI and/or the editor(s) disclaim responsibility for any injury to people or property resulting from any ideas, methods, instructions or products referred to in the content. |
© 2026 by the authors. Licensee MDPI, Basel, Switzerland. This article is an open access article distributed under the terms and conditions of the Creative Commons Attribution (CC BY) license.