Article

Functional Traits Associated with Drought Tolerance Exhibit Low Variability in 21 Provenances of a Montane Tree Species—Eucalyptus delegatensis

1
School of Agriculture, Food and Ecosystem Sciences, The University of Melbourne, 500 Yarra Boulevard, Richmond, VIC 3121, Australia
2
Greening Australia, 349 Collins Street, Melbourne, VIC 3000, Australia
*
Authors to whom correspondence should be addressed.
Forests 2025, 16(6), 898; https://doi.org/10.3390/f16060898
Submission received: 19 March 2025 / Revised: 23 May 2025 / Accepted: 23 May 2025 / Published: 27 May 2025

Abstract

:
Elevated temperatures and extended drought periods are driving significant changes in the structure and function of forest ecosystems. High-elevation alpine ash forests (Eucalyptus delegatensis R.T. Baker) in Australia are an example of forests that are already impacted by climate change. These obligate seeder forests can shift to non-forest ecosystems following extreme drought and altered fire regimes, raising concern about their adaptation to a rapidly changing environment and long-term forest persistence. Plant functional traits play a major role in determining adaptive mechanisms to environmental conditions. While alpine ash forests are vulnerable to climate change, it is unclear if different provenances have adapted to the climatic conditions in which they grow. We therefore studied the variation in expression of functional traits related to drought tolerance in 21 provenances of alpine ash distributed across an environmental gradient. We investigated if functional traits varied between the provenances and were related to climate of origin in order to identify provenances that may be better adapted to drought. We measured the following traits in a common garden experiment under well-watered conditions: stomatal density, specific leaf area, minimum stomatal conductance and osmotic potential at full turgor. There was very little variation in trait expression between the 21 provenances for all functional traits related to drought tolerance. All provenances had medium-range stomatal density (170–300 stomata mm2) and specific leaf area (SLA, 50–70 cm2 g−1), a very low minimum stomatal conductance (2–4 mmol m2 s−1) and a high osmotic potential at full turgor (−0.6–0.7 MPa). There was no statistically significant correlation of trait expression with the climate of origin. Thus, there is very little evidence for genetically controlled differences in trait expression of drought tolerance traits in this species. It is likely that the high elevation and high rainfall environment of the species’ ecological niche has not been subjected to frequent and extensive drought periods that would elicit an evolutionary pressure selecting for drought-tolerant traits. We could not identify provenances that would have different drought-tolerant functional trait responses than others, potentially conferring an adaptive advantage under climate change. This has implications for using climate-adjusted provenancing to improve resilience in alpine ash forests predicted to experience more frequent and severe droughts in the future.

1. Introduction

There is growing evidence suggesting that current climatic changes are adversely impacting forest ecosystems [1]. Periods of drought are predicted to increase in incidence and severity, which can significantly reduce species’ survival, distribution and productivity [2]. For instance, extreme drought and heat stress have caused widespread tree mortality in most bioregions in the past two decades [3,4,5,6].
The capacity of plant species to adapt to changing climatic conditions has been crucial for ecosystem persistence and countering biodiversity loss [7]. As climate change alters the environment, plant functional traits that determine their adaptive capacity may underpin their survival [8]. Several studies have demonstrated that different functional traits define the drought resistance capacity of the plant. For example, Bartlett et al. (2012) observed a strong correlation between leaf water potential at the turgor loss point and water availability within and across the biomes [9]. Here, the turgor loss point refers to the point at which the leaf cells become flaccid as they dry out. During dry seasons or drought conditions, lowering and maintaining cell turgor facilitates water uptake, increasing the hydraulic safety and drought tolerance capacity of plants [10]. Similarly, plant specific leaf area has been adjusted to adapt to a dry environment [11]. Modulating leaf stomatal density to regulate fluxes of CO2 uptake and water loss in response to the surrounding environment is another key morphological characteristic of the plants related to drought resilience [12]. Equally, minimum leaf stomatal conductance determines the rate of water loss when stomata are closed [13].
Functional traits related to drought resistance often differ in plant species from arid environments compared to species from wet and/or cold environments [14,15,16,17,18]. Functional traits can also vary within a given species across environmental gradients encompassing a species’ geographic range [16,19], indicating an adaptive response of the species to different environmental conditions. Variation between species has been extensively studied in the past, yet recent research indicates that approximately 40% of the functional trait variation also occurs within species [20]. Conversely, some studies have observed little or no variation in the expression of functional traits for different populations within a species [21,22,23].
The significance of functional trait variations and their plasticity in tree species is becoming increasingly recognised. Understanding the adaptive capacity within tree species populations can provide important information for planned adaptation of vulnerable forests [24], particularly in the context of selecting provenances to include in restoration/revegetation efforts. However, compared to studies on interspecific variations, only a few studies have investigated intraspecific variations in phenotypic plasticity and drought resistance capacity among populations [10,25,26,27]. Studies conducted on climate-related plasticity among populations have included only a limited number of provenances, which restricts a comprehensive understanding of how the various populations adapt to changing environments [25]. In addition, it is less well-known how the functional traits relate to climate variables within various populations of a single species [28,29].
Over 800 species of Eucalyptus occur across a significant portion of the Australian landscape [30]. Many of these species are predicted to face climatic conditions in the future that exceed the ranges they are experiencing in their current natural habitats [31,32]. Alpine ash (Eucalyptus delegatensis) is a species under significant threat from climate change [33,34]. It is a fire-sensitive, bradysporous obligate seeder species—regeneration from seed after fire is the primary mode of regeneration—and it typically reaches reproductive maturity after 15 to 20 years [35]. Alpine ash is restricted to southeast Australia, occurring at elevations ranging from 900 m to 1450 m [33]. It has been identified as being highly vulnerable in its regeneration phase to drought [36] and warming winters [37] and frequent, severe and broad-scale fire regimes driven by increased aridity under climate change [33,35,36,38,39]. These bushfires have impacted a substantial proportion of alpine ash forests in the region [35].
Alpine ash occurs across an elevational gradient, suggesting their populations may exhibit a range of trait expressions reflecting localised climate variation. Despite the susceptibility of alpine ash to climate change, the intraspecific variation in the functional trait expression of provenances along a climatic gradient is little known. This lack of knowledge creates uncertainties about which populations may be suited to withstand exacerbated future drought conditions. With rapid anthropogenic climate change and expected detrimental impacts on the alpine ash distribution, there is a growing concern about the species’ long-term survival [40].
This study aimed to investigate the variability of drought-adaptive functional traits across different provenances of alpine ash along a climatic gradient. We addressed the following research questions:
  • Is there variability in the expression of functional traits among provenances of alpine ash sourced across a climatic gradient?
  • Do the morphological and physiological traits correlate with each other?
  • Is there any relationship between the expression of functional traits and climate of origin?
Based on trends observed in other species, we hypothesised that: (i) alpine ash provenances will exhibit variability in their functional traits across a climatic gradient, (ii) morpho-physiological traits would be significantly correlated to each other, and (iii), there would be a significant correlation between functional trait expressions and climate of origin.

2. Materials and Methods
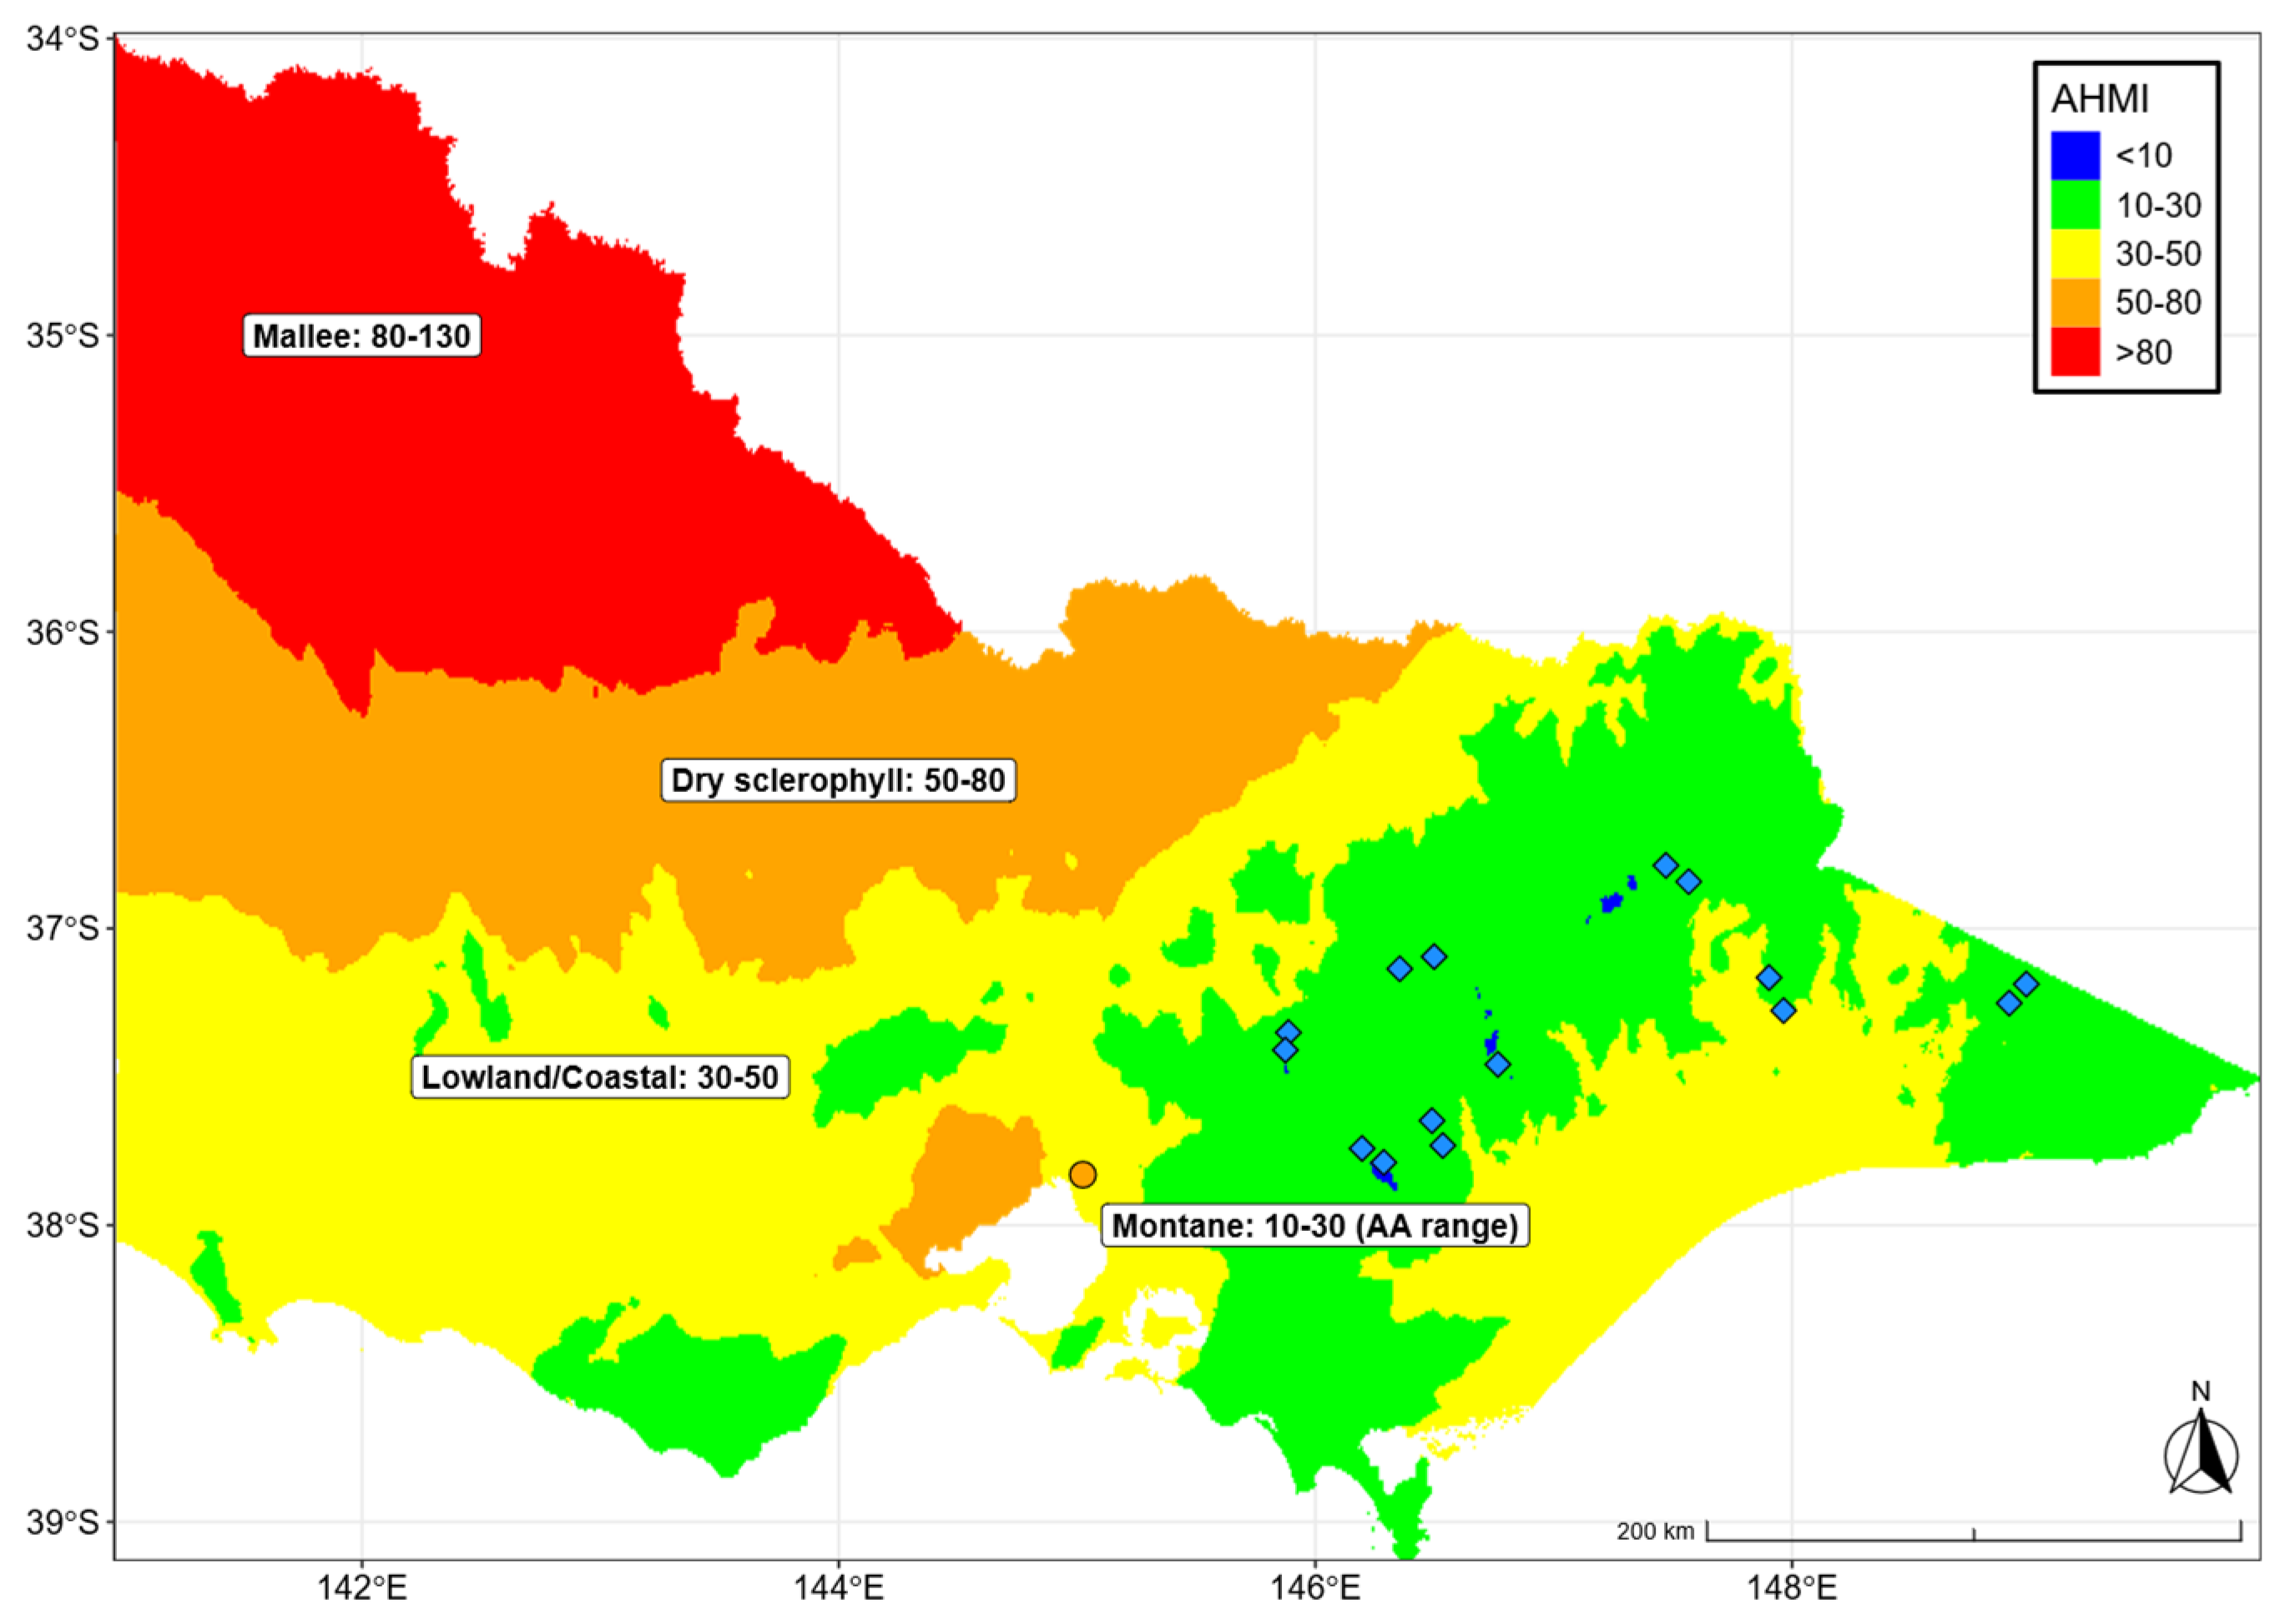
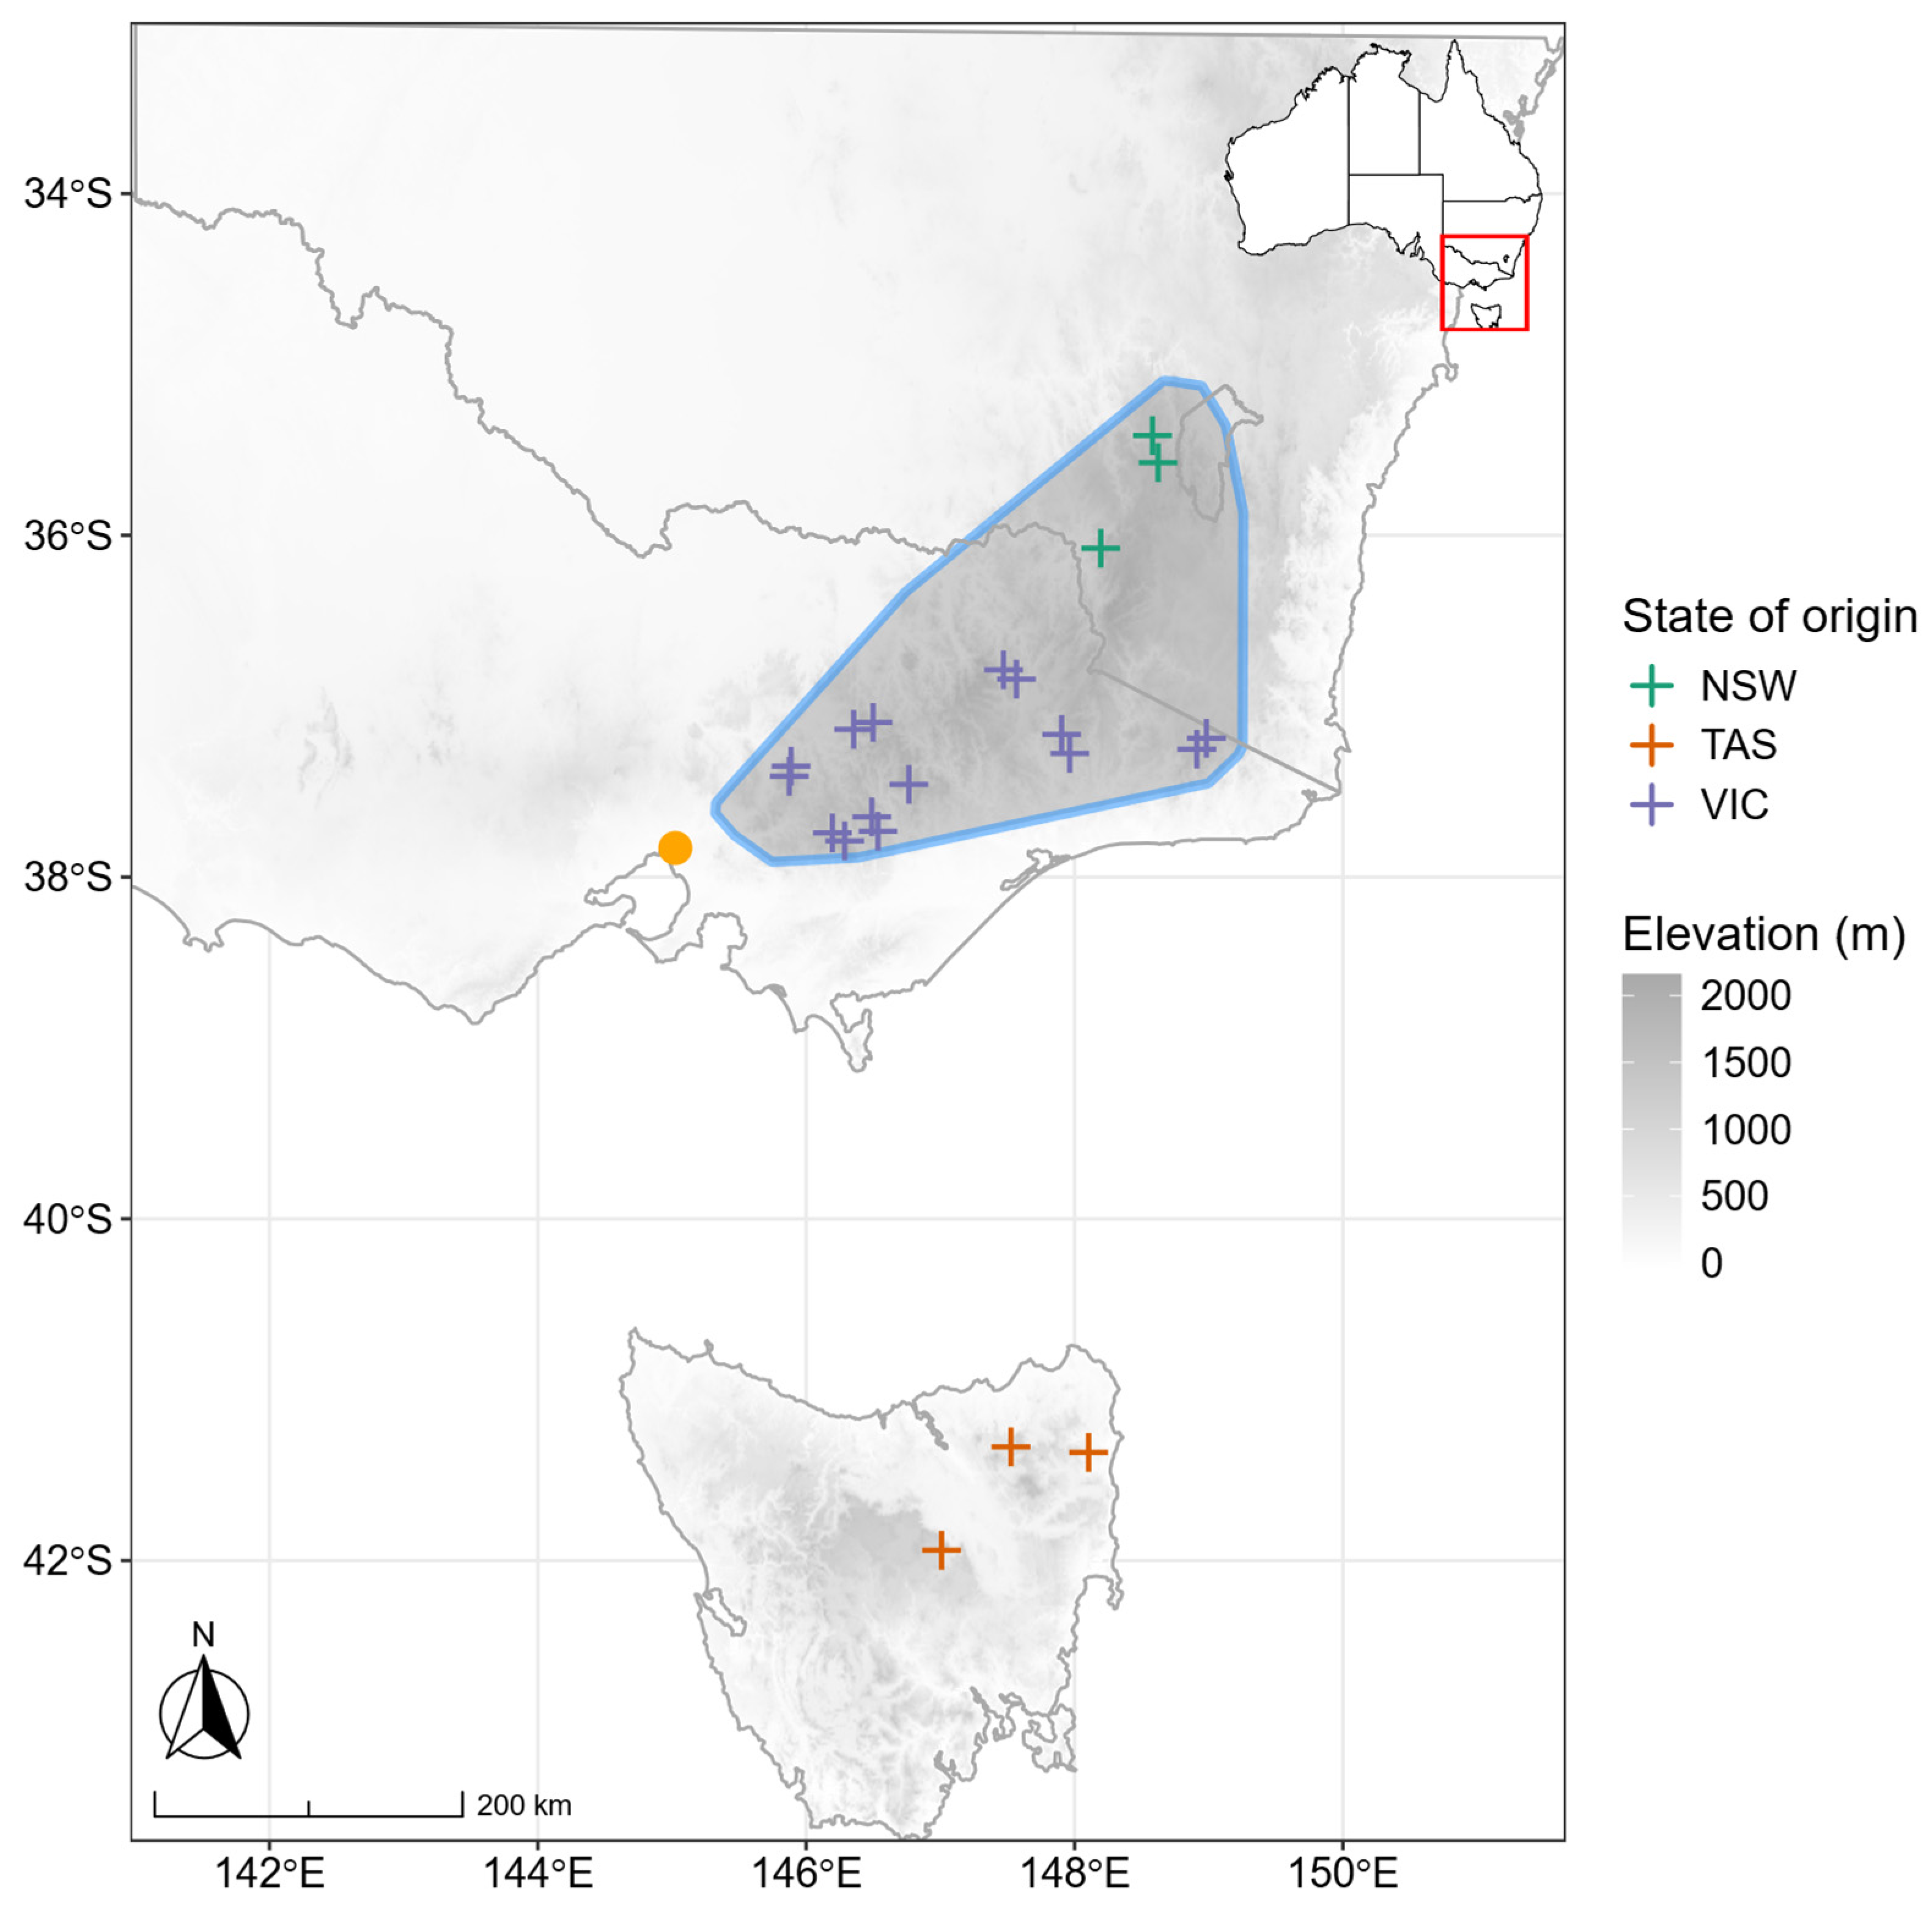
2.1. Study Site

The study was conducted at a common garden provenance trial site located at the Burnley Campus of the University of Melbourne, Victoria, Australia (−37.829, 145.024, Figure 1). A common garden is a traditional experimental approach where populations sourced from various locations of a species are planted together in the same environment to observe the differences in the functional traits among provenances [41]. Such experiments are used to test and differentiate the adaptive capacity of populations from different environments [42]. The mean annual rainfall and mean annual temperature of the site are 648 mm and 15 °C, respectively [43].

2.2. Plant Material

Seeds were collected from 21 provenances across the geographic distribution of alpine ash in southeastern Australia (Figure 1). Among them, 15 provenances were from the state of Victoria (VIC), three from Tasmania (TAS) and three from New South Wales (NSW; Appendix A, Table A1). Seeds were germinated at a nursery and planted in the common garden in November 2022 when the seedlings were six months of age. After planting, plants were irrigated every second day for half an hour from late spring to early autumn (May–October) with approximately 2 litres of water per plant. By the time the leaf samples were collected for this study, the plants were about two years old, corresponding to 1.5 years after planting.

2.3. Climatic and Topographic Variables Investigated

The four climatic variables used in this study to investigate climatic adaptation were mean annual temperature (MAT), mean annual precipitation (MAP), elevation and the annual heat moisture index (AHMI). Climate data were sourced from WorldClim [44]. AHMI was subsequently calculated from MAT and MAP (AHMI = [MAT + 10]/[MAP/1000]), which is a measure of the climatic aridity of each provenance location [45,46]. AHMI was chosen for this study because it integrates the interactive impacts of temperature and precipitation, distinguishes warm-dry from cool-wet areas of the landscape, and, therefore, better quantifies the effects of local climates on plant communities. We further considered elevation, which was sourced from the Shuttle Radar Topography Mission data [47]. All variables were extracted for the location of provenance origin (Appendix A, Table A1).

2.4. Planting Design

Alpine ash seedlings were planted in three replicate plots that each had a uniform spacing of 2.5 m between each plant. The plots were rectangular, measured 35 m × 25 m, and had a total of 165 plants per plot. A specific planting pattern with a matrix of three rows and three columns forming a 3 x 3 grid was created so that the provenances did not neighbour themselves but neighbour the same set of other provenances in a consistent manner (Appendix A, Figure A1).

2.5. Morphological Trait Measurements

2.5.1. Specific Leaf Area (SLA)

From each provenance, five trees were sampled for the measurement of specific leaf area (SLA, n = 105), and five to twenty leaves per tree were collected, depending on leaf quality. We selected fully expanded and hardened leaves. Leaves were scanned digitally, and the area of scanned leaves was subsequently measured using the image analysis software ‘’ImageJ” v1.54i [48]. Leaf dry weights were recorded after the samples had been oven-dried at 80 °C for 48 h (until they reached a constant weight). All measurements were averaged to give a single value per sample tree.

2.5.2. Stomatal Density (SD)

For the measurement of stomatal density (SD), nail polish imprints were taken in the middle of the abaxial (lower) surface of leaves, avoiding major veins and edges, which were then observed by light microscope [49]. This part of the leaf region was used because it represents the average value SD across the entire leaf and provides a good proxy for the leaf as a whole [50]. Transparent nail polish was used for the impressions, and imprints were mounted on the microscope slide. The camera field view of the microscope was approximately 0.074825 mm2 under a 400× magnification. This specific area of the camera view allows for accurate counting of stomata within a defined space, ensuring consistency across all measurements. Thus, to calculate the density, the total number of stomata that fell within the field view was counted and divided by the area of the field view. Three images were taken from each nail polish peel, one peel was taken from each leaf, and two leaves were sampled from each tree. This process was repeated across five trees per provenance (n = 210). Measurements were averaged to give a single value for each sample tree.

2.6. Physiological Trait Measurements

2.6.1. Osmotic Potential at Full Turgor (π(100))

Osmotic potential at full turgor of leaves was measured by osmometry of expressed sap [51]. Five trees from each provenance were measured (n = 105), and three leaves were taken from each tree. Collected leaves were rehydrated for at least one hour to compare individuals at full hydration, also known as full turgor (π(100)). The water potential of each leaf was assessed using a pressure chamber following hydration. A leaf was considered to be at full turgor if the water potential reached greater than −0.1 MPa. Leaf material was then extracted with a cork borer, avoiding the mid-veins, and then placed into a 0.6 mL micro-tube and immediately stored in a freezer. The plant material was kept frozen for a day, thawed and sap extracted by centrifugation. The osmolality of expressed sap was determined using a freezing point osmometer (Osmomat 030, Gonotec, Berlin, Germany) that was calibrated using solutions provided by the manufacturer.

2.6.2. Minimum Stomatal Conductance (gmin)

Minimum stomatal conductance (gmin) was measured by the bench drying method [52,53], with minor modifications. Fully expanded, sun-exposed leaves without visible damage were collected early in the morning. We measured one leaf per tree and five trees per provenance (n = 105). Measurements were conducted for five days, with 21 leaves from 21 provenances measured for each day. Collected leaves were kept in zip-lock bags with a moist tissue paper and then transported to the lab within one hour. Leaves were labelled and then rehydrated with distilled water for one hour before starting the procedure. After fully rehydrating the leaves, petioles were cut and sealed with melted candle wax to prevent moisture loss. The prepared leaves were placed on a drying rack with weather station sensors positioned next to the rack to record climate conditions (temperature, relative humidity and atmospheric pressure). The leaves were weighed at 30 min intervals over a period of 5 h and 30 min, resulting in a total of 12 data points for each leaf sample. At the end of the measurement, leaves were scanned, and the leaf area was calculated using ImageJ software. The recorded data—weighing times, values of leaf mass (g), leaf area (cm2), temperature (°C), relative humidity (%) and atmospheric pressure (kPa)—were entered into a spreadsheet. Saturated vapour pressure (VPsat in kPa) and mole fraction vapour pressure deficit (mfVPD in mol x mol−1) were calculated based on the temperature and relative humidity values. gmin was computed using the last four data points. Since gmin can be sensitive to fluctuations in temperature and relative humidity [54], particularly under extreme conditions, care was taken to ensure stable environmental conditions throughout the measurement.

2.7. Statistical Analyses

All statistical analyses were performed in R, version 4.3.3 [55]. We used linear models to test for significant relationships between traits and climate of origin, as well as inter-trait relationships. One-way analysis of variance (ANOVA) was used to test for differences between the provenances in their morphological and physiological traits and to determine trait variance within the provenances. To further explore which provenance expressions may drive significant differences, we computed Tukey Honest Significant Difference (HSD) tests for pairwise comparisons. Significant relationships were identified using p-values (threshold of p < 0.05). We used r-squared and variable estimates to assess the strength and direction of these significant relationships. Intraspecific variation within provenances was calculated using the quartile coefficient of variation as it is a more robust metric for calculating the coefficient of variation for traits [56].

3. Results

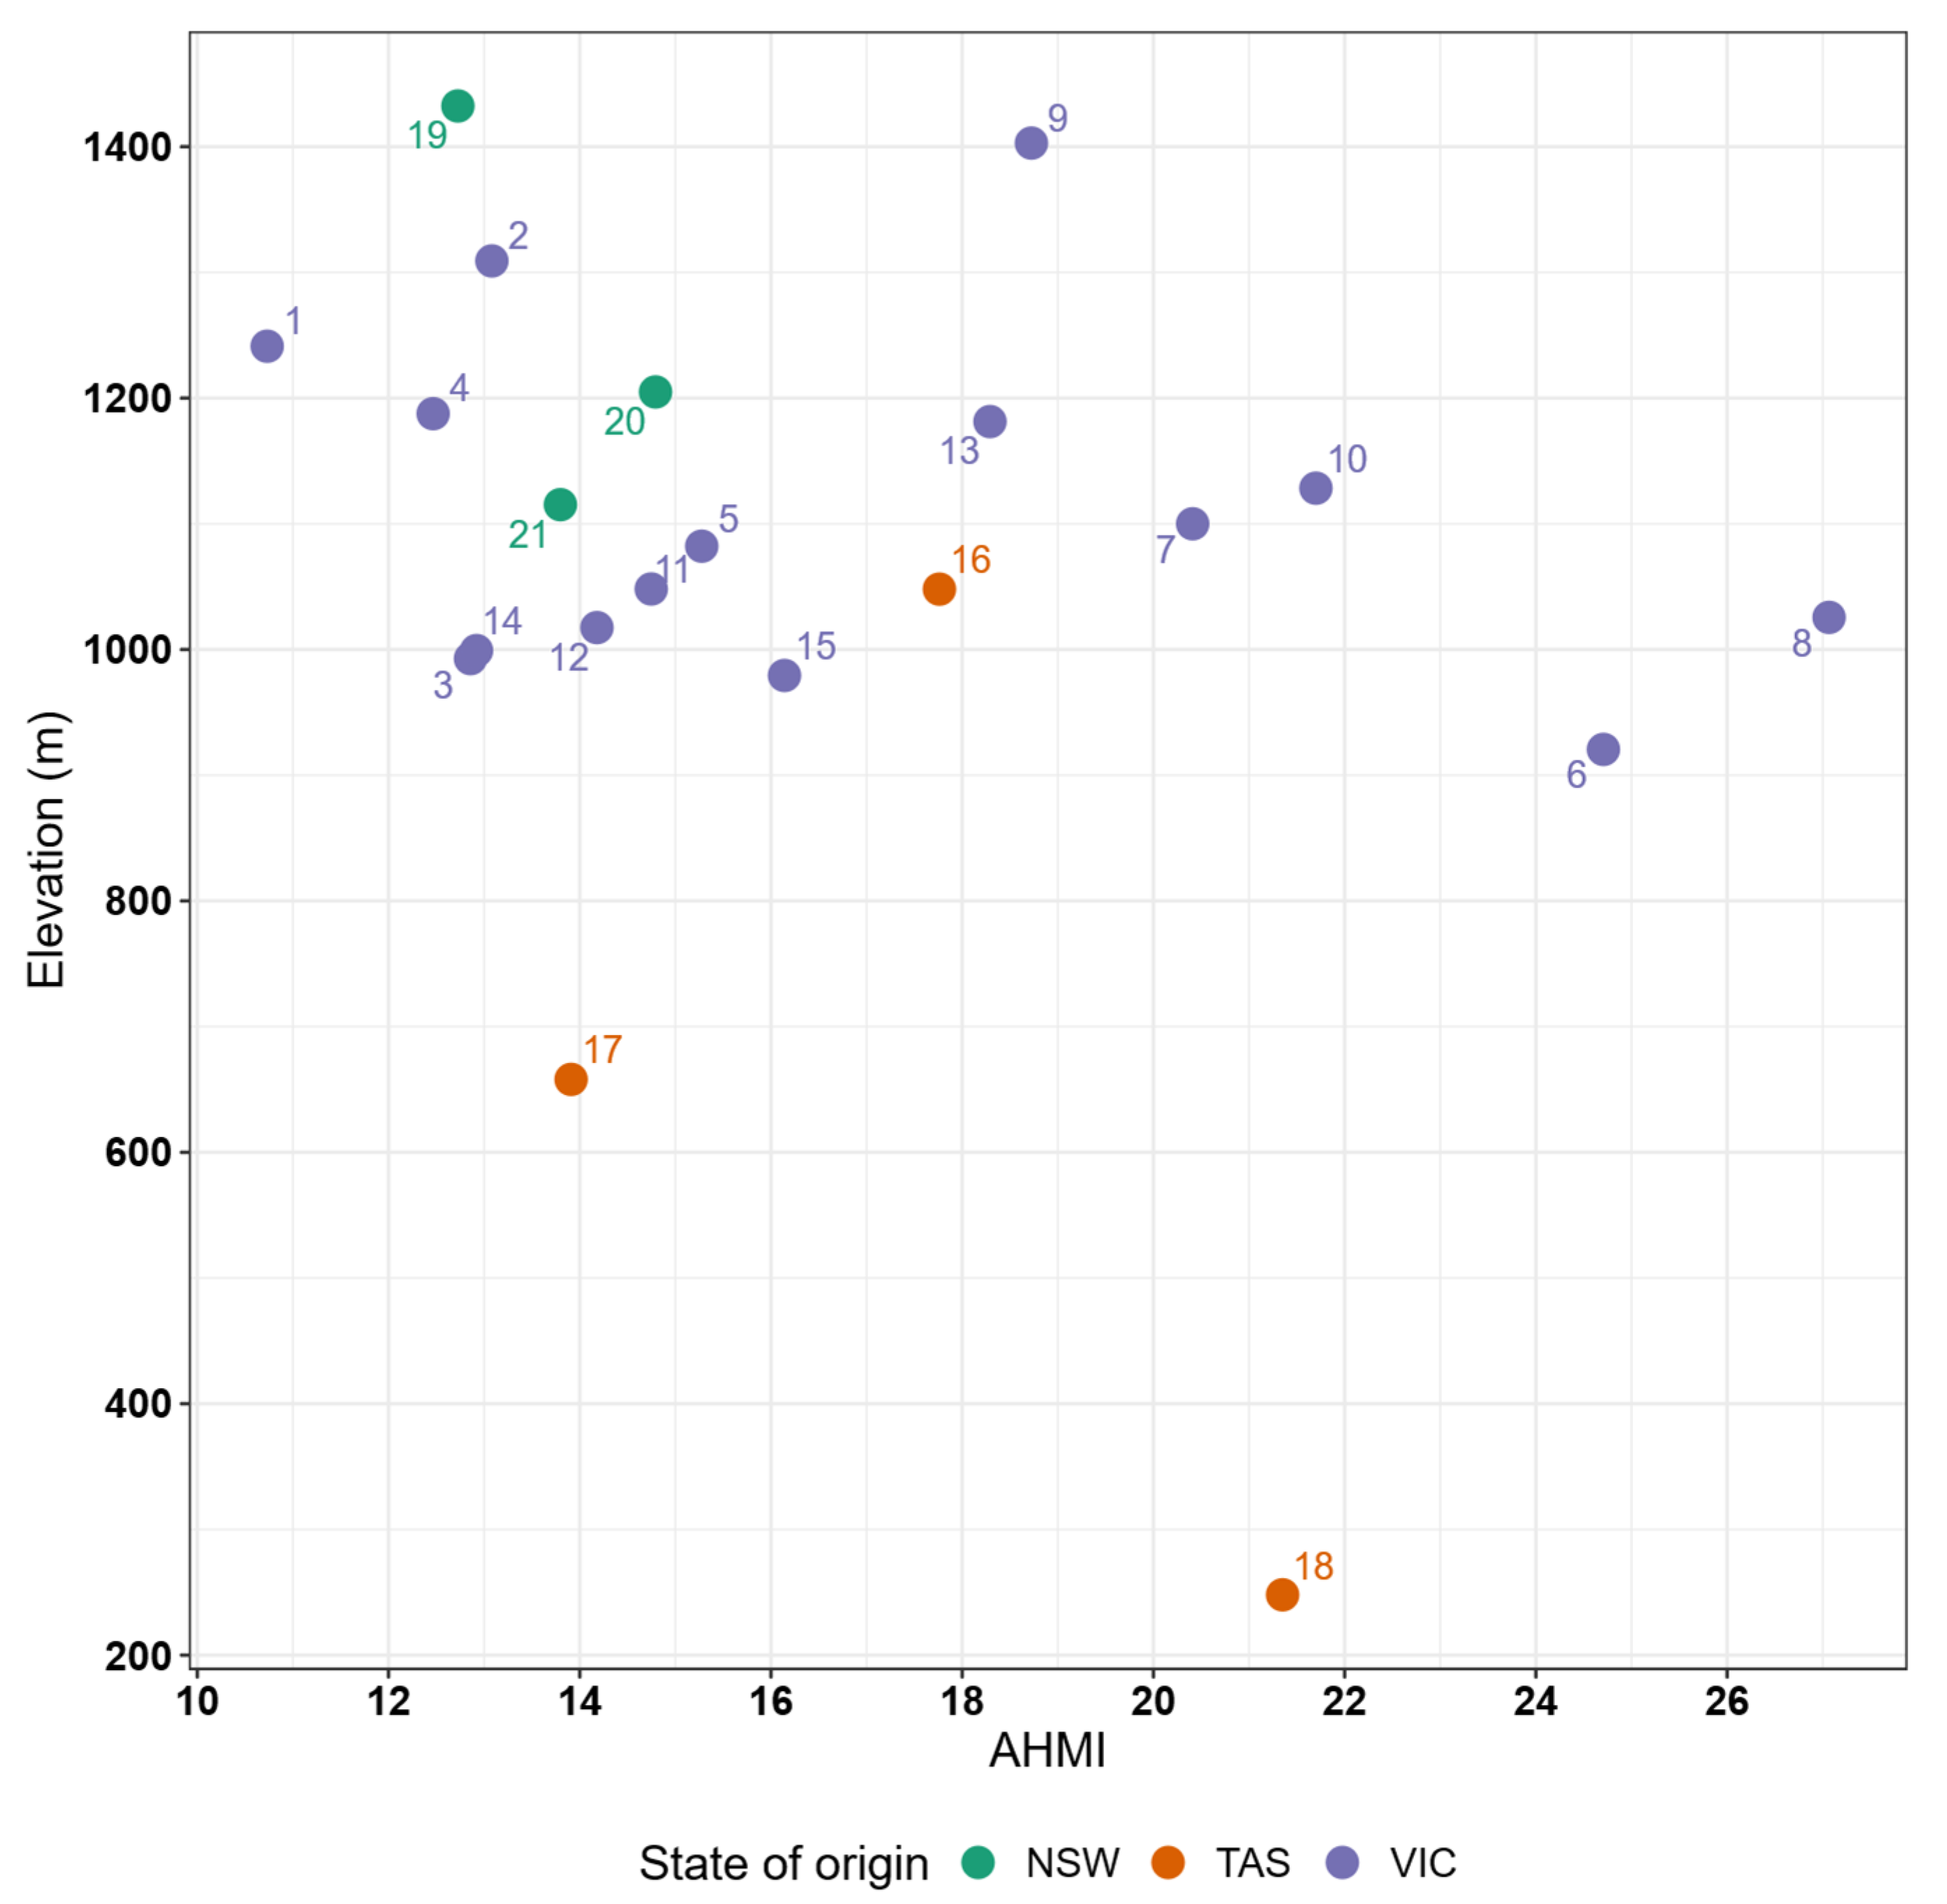
3.1. Climate of Origin

The distribution of the 21 alpine ash provenance source locations (climate of origin) along an aridity gradient occurred across a relatively narrow range (AHMI values between 10–30), with most provenances originating from areas with AHMI between 12 and 18, indicative of cool and wet conditions in mountainous areas (Figure 2). Provenance origin mean annual temperature ranged from 6.6–11.8 °C and annual precipitation from 813–1847 mm (Appendix A, Figure A2).

3.2. Variation in Morpho-Physiological Traits

There was no statistically significant trait variation among the provenances (p = 0.91) for any of the four traits (Figure 3). The gmin values varied between 2–4 mmol m2 s−1 and the greatest variation within a provenance was detected in provenance 8 (origin Victoria, variance 3.01) and the lowest in provenance 3 (origin Victoria, variance 0.04). Similarly, there was some variation in π100 rates within the provenances; however, differences across the provenances were not statistically significant (p = 0.81). The highest π100 value was observed in provenance 4 (−0.52 MPa) and the lowest in provenance 9 (−0.72, both originating from Victoria). For SD, we observed the highest variation in provenance 13 and least in provenance 10 (both originating from Victoria). We did not find statistically significant differences among the provenances (p = 0.59) in SD. Likewise, there were no significant differences among the provenances (p = 0.07) in SLA. Provenance 10 had the lowest SLA (41.0 cm2 g−1), and the highest SLA was observed in provenance 18 (origin Tasmania, 84.8 cm2 g−1).

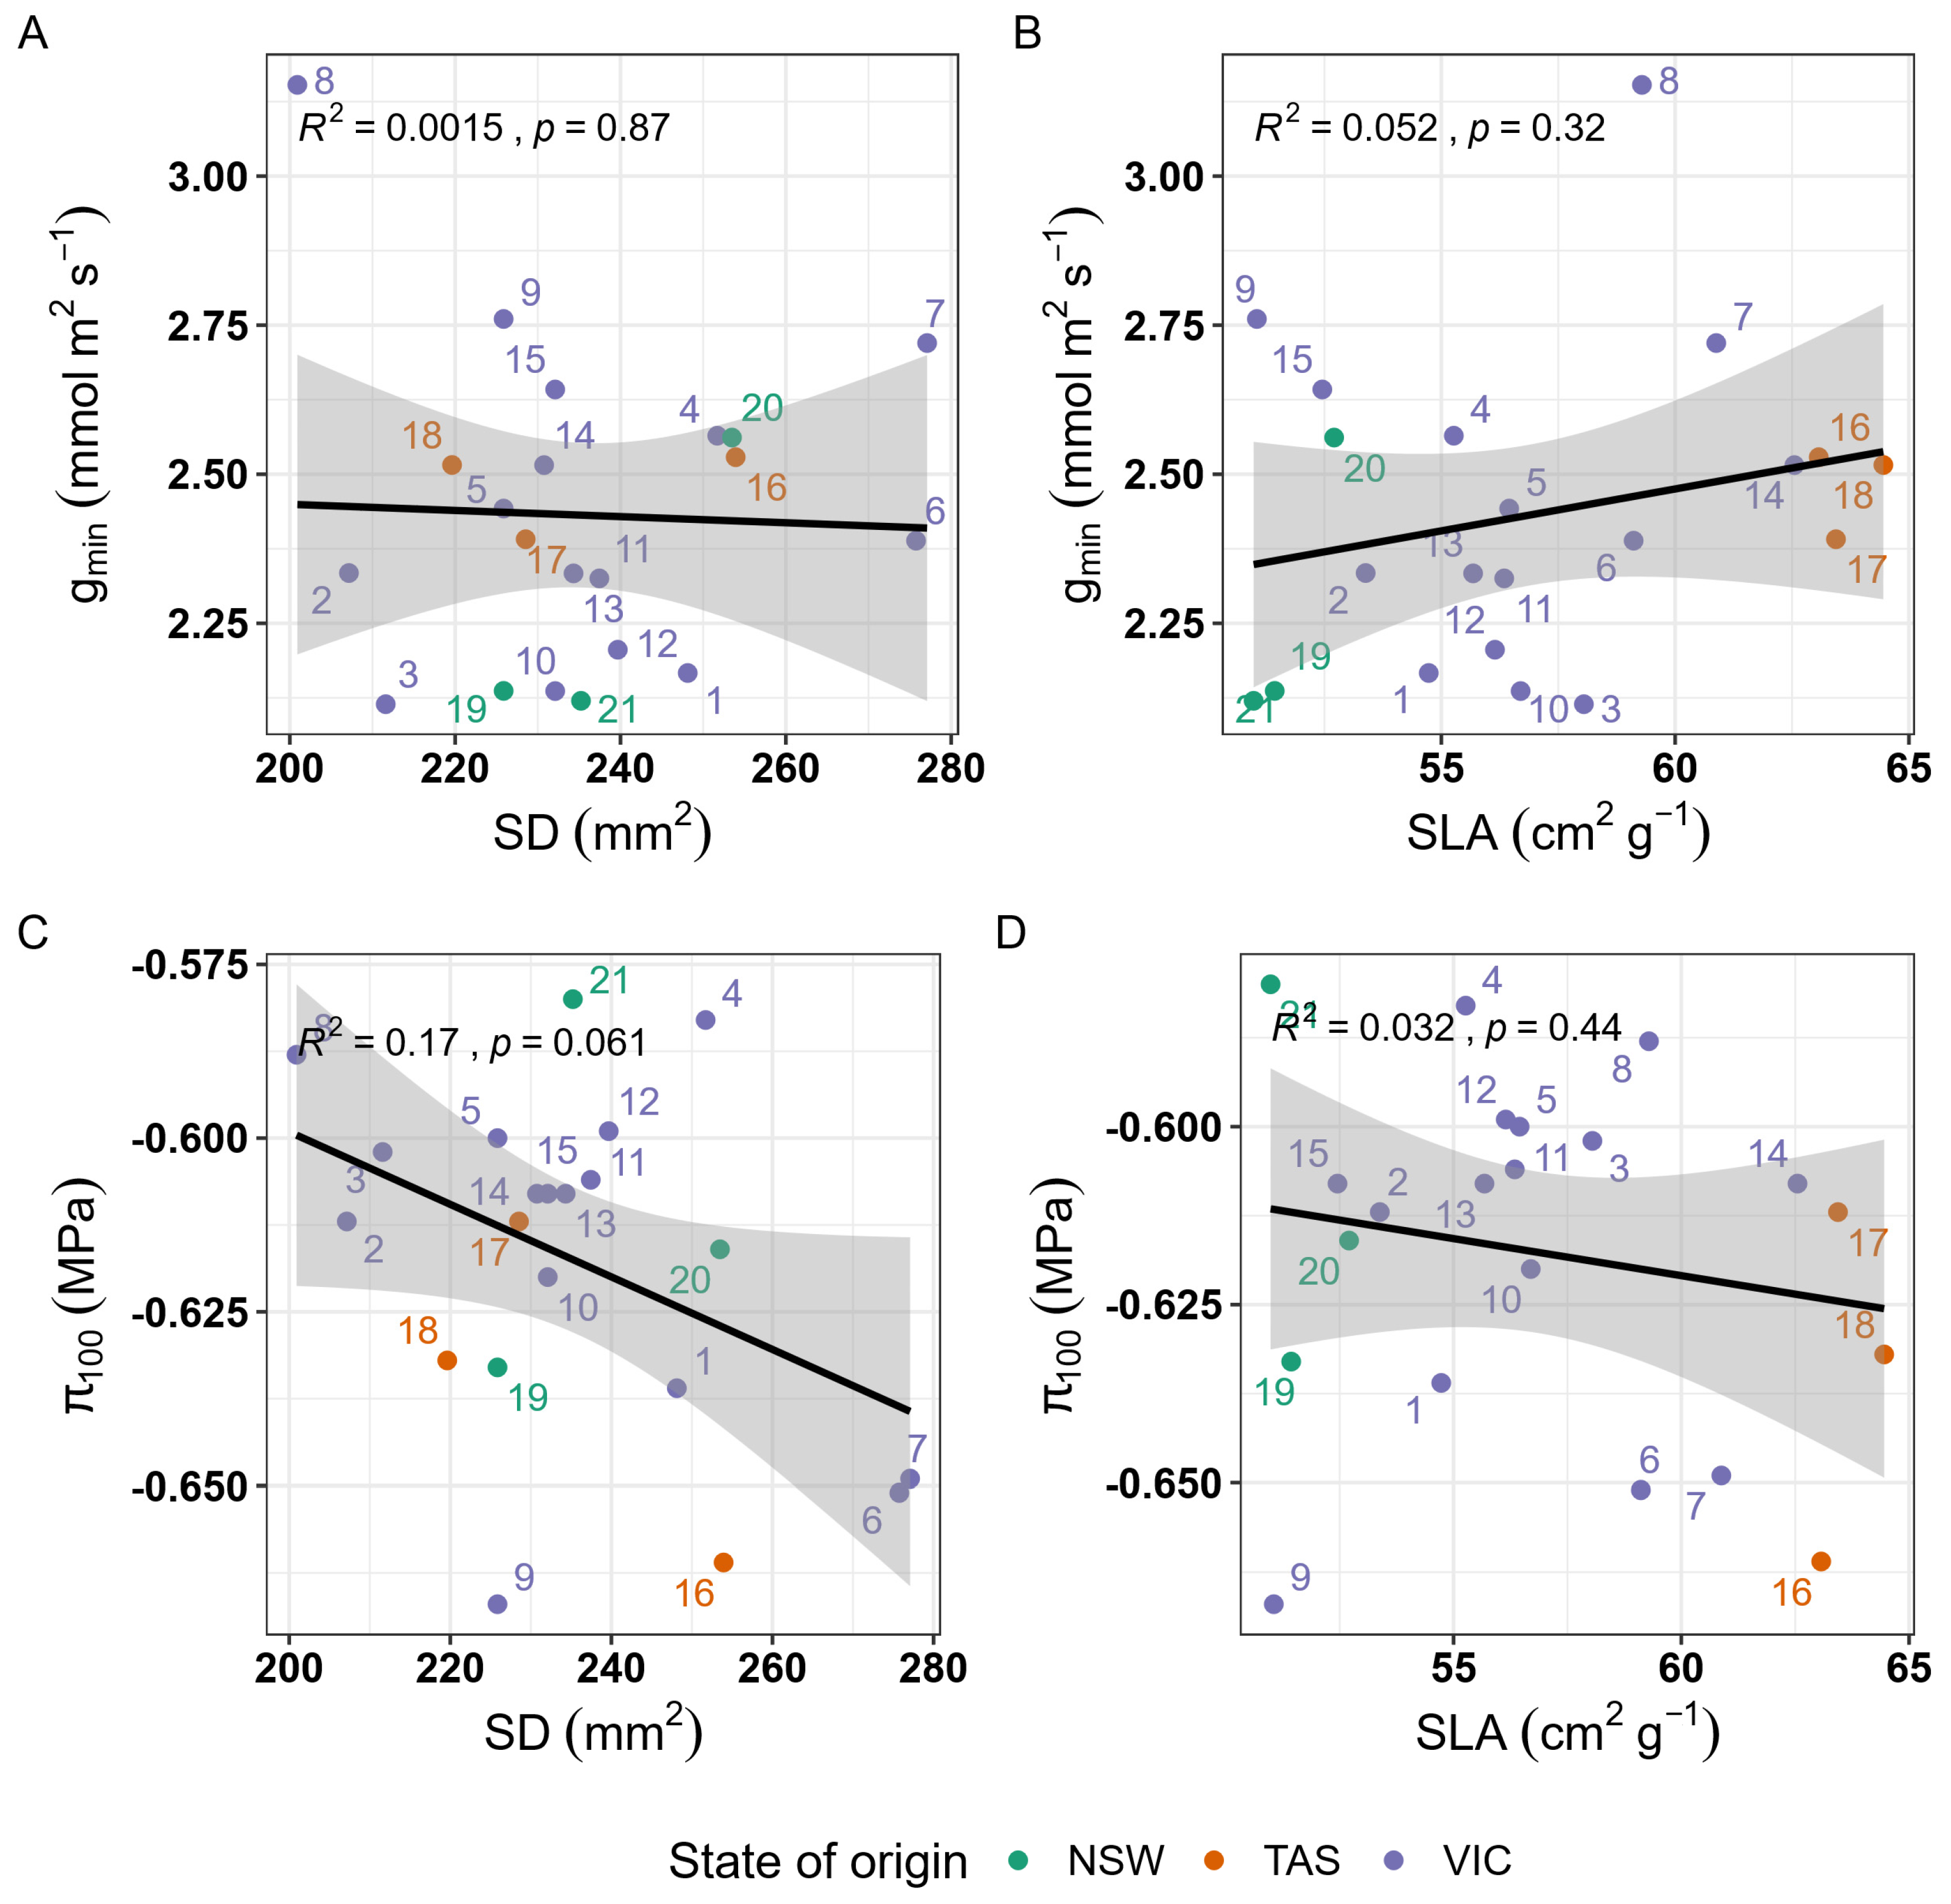
3.3. Correlation Among Morpho-Physiological Traits

We did not determine significant relationships between morphological and physiological traits (Figure 4). While there was some variation observed between osmotic potential and SD (Figure 4C), the relationship was not statistically significant.

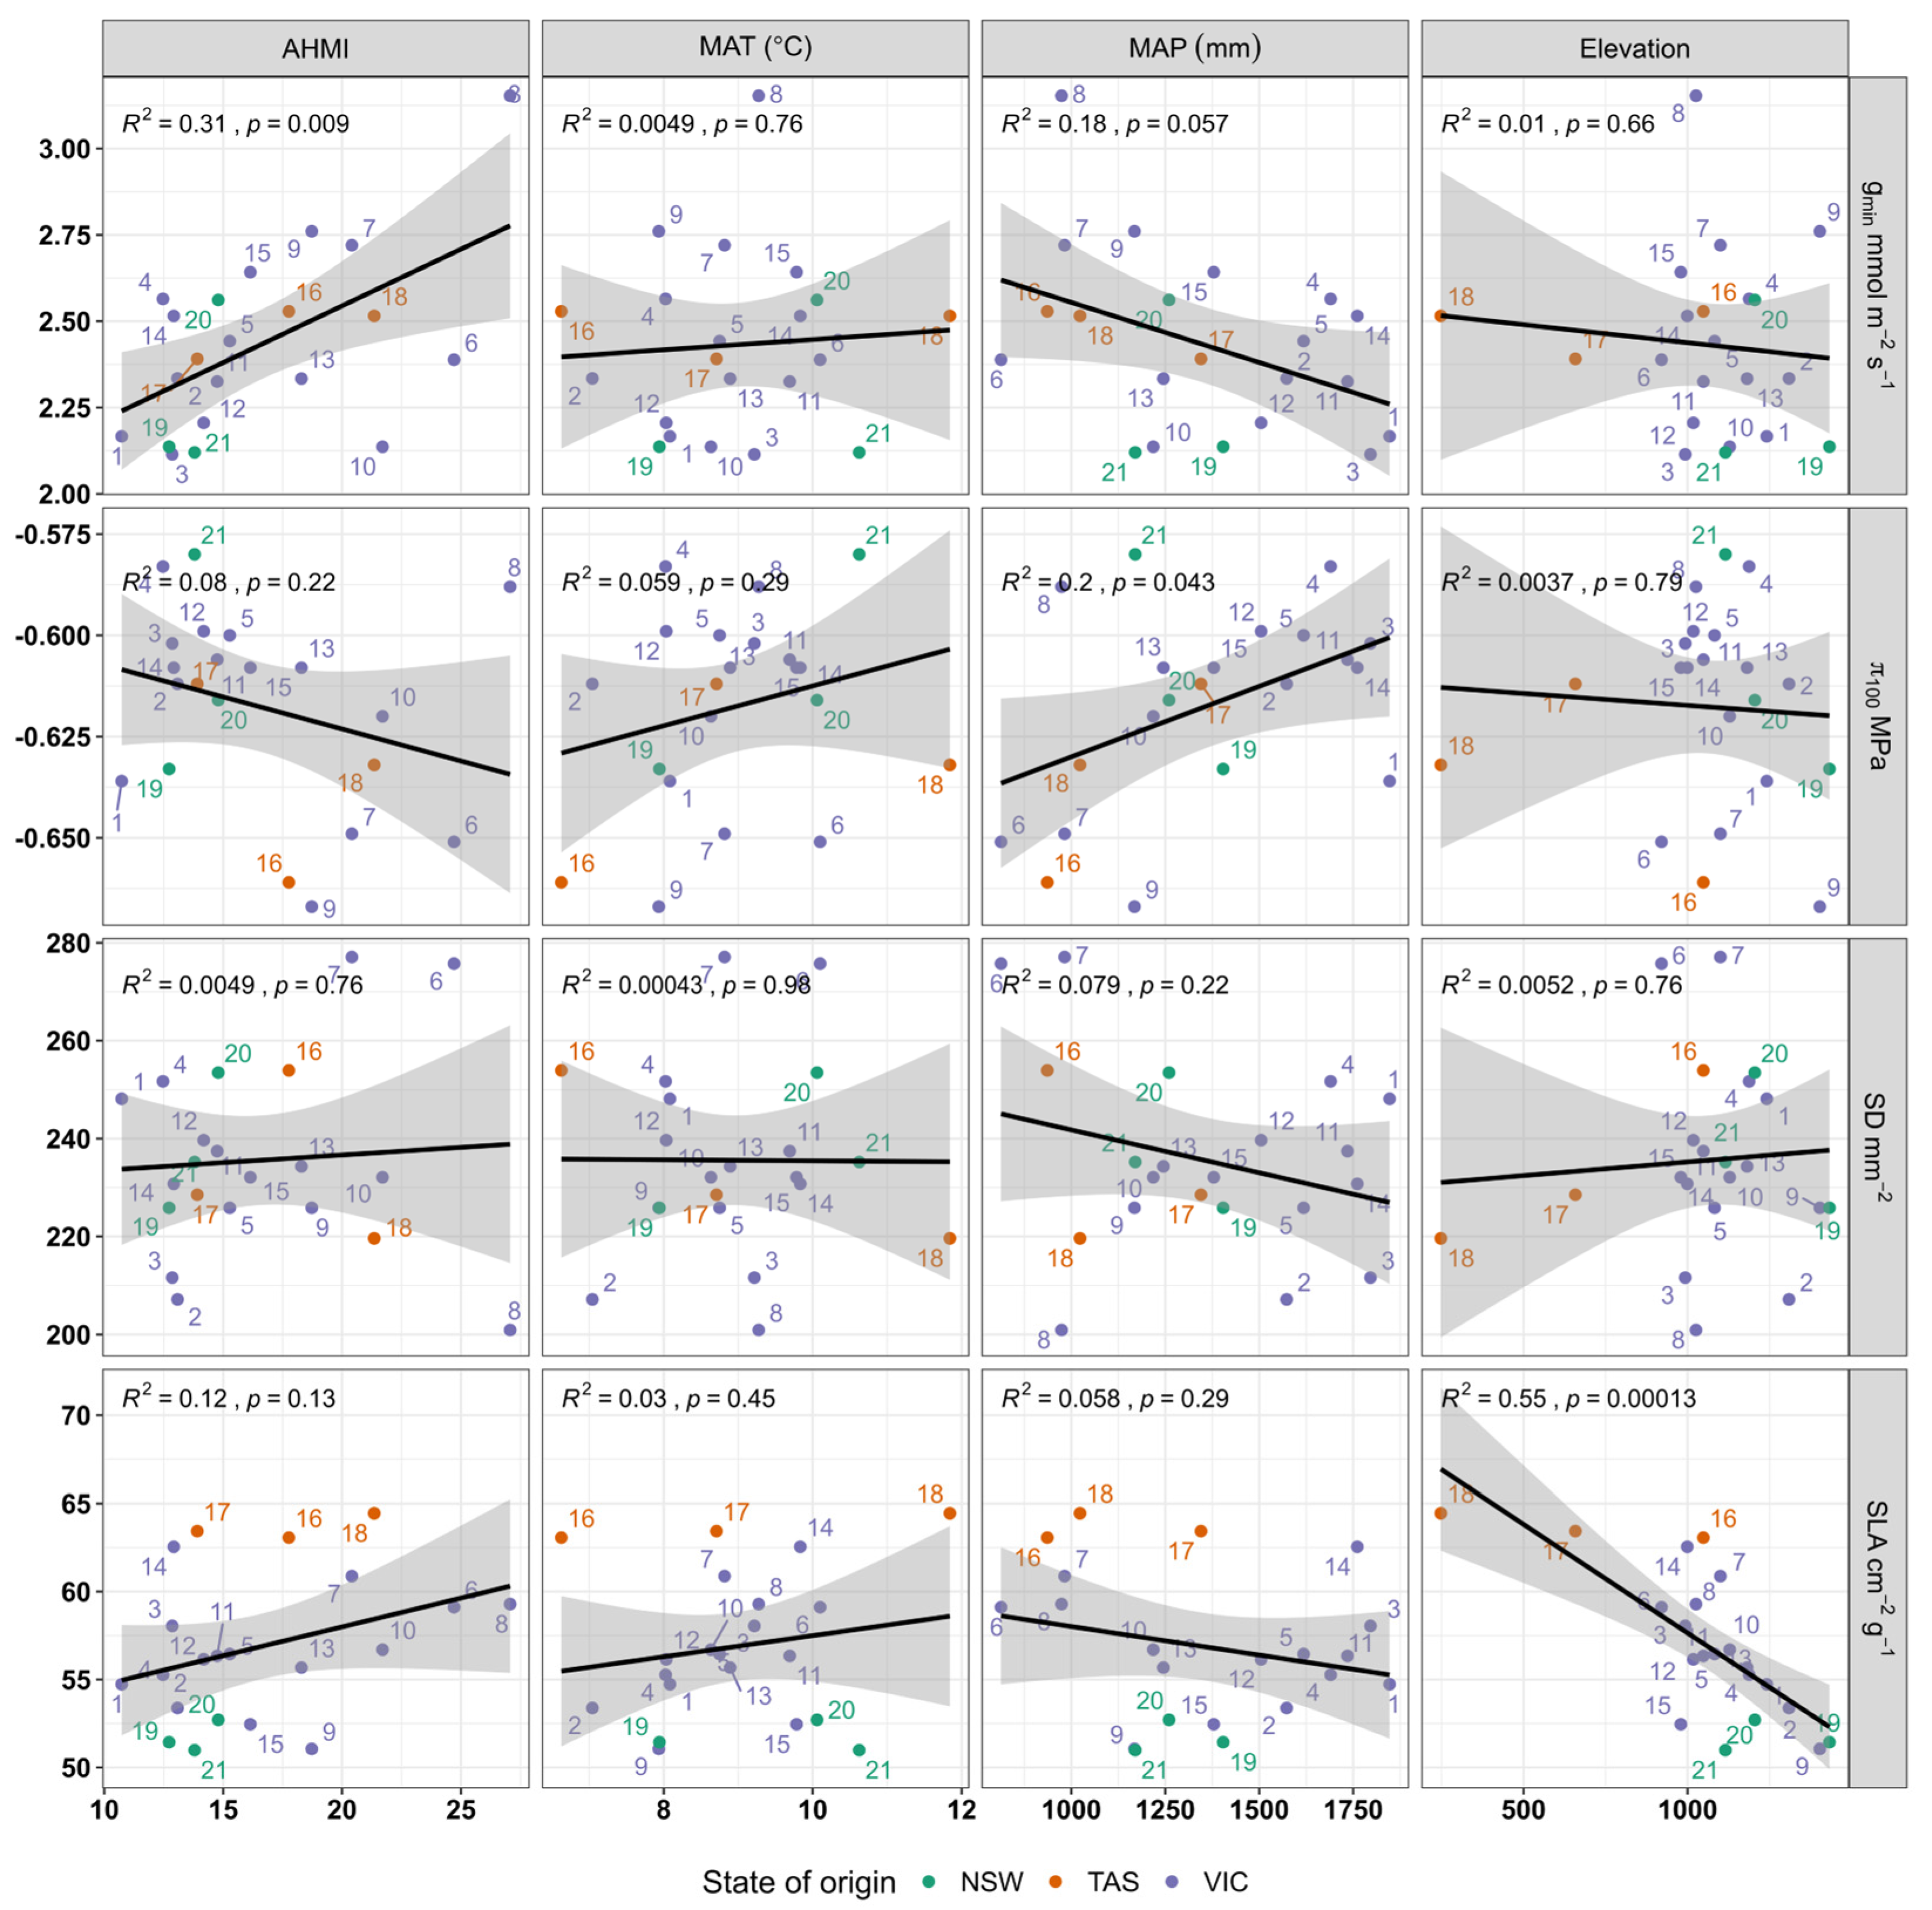
3.4. Relationship Between Traits and Climate of Origin

Most relationships between climatic variables (AHMI, MAP, MAT) and elevation and morpho-physiological traits were not significant (Table 1). AHMI had a significant positive relationship with gmin (Figure 5). There was a significant relationship between MAP and π100, where π100 increased with increasing precipitation. The other morphological traits did not show any significant relationship with MAP. There was a highly significant relationship between elevation and SLA, with lower SLA at higher elevation (Figure 5).

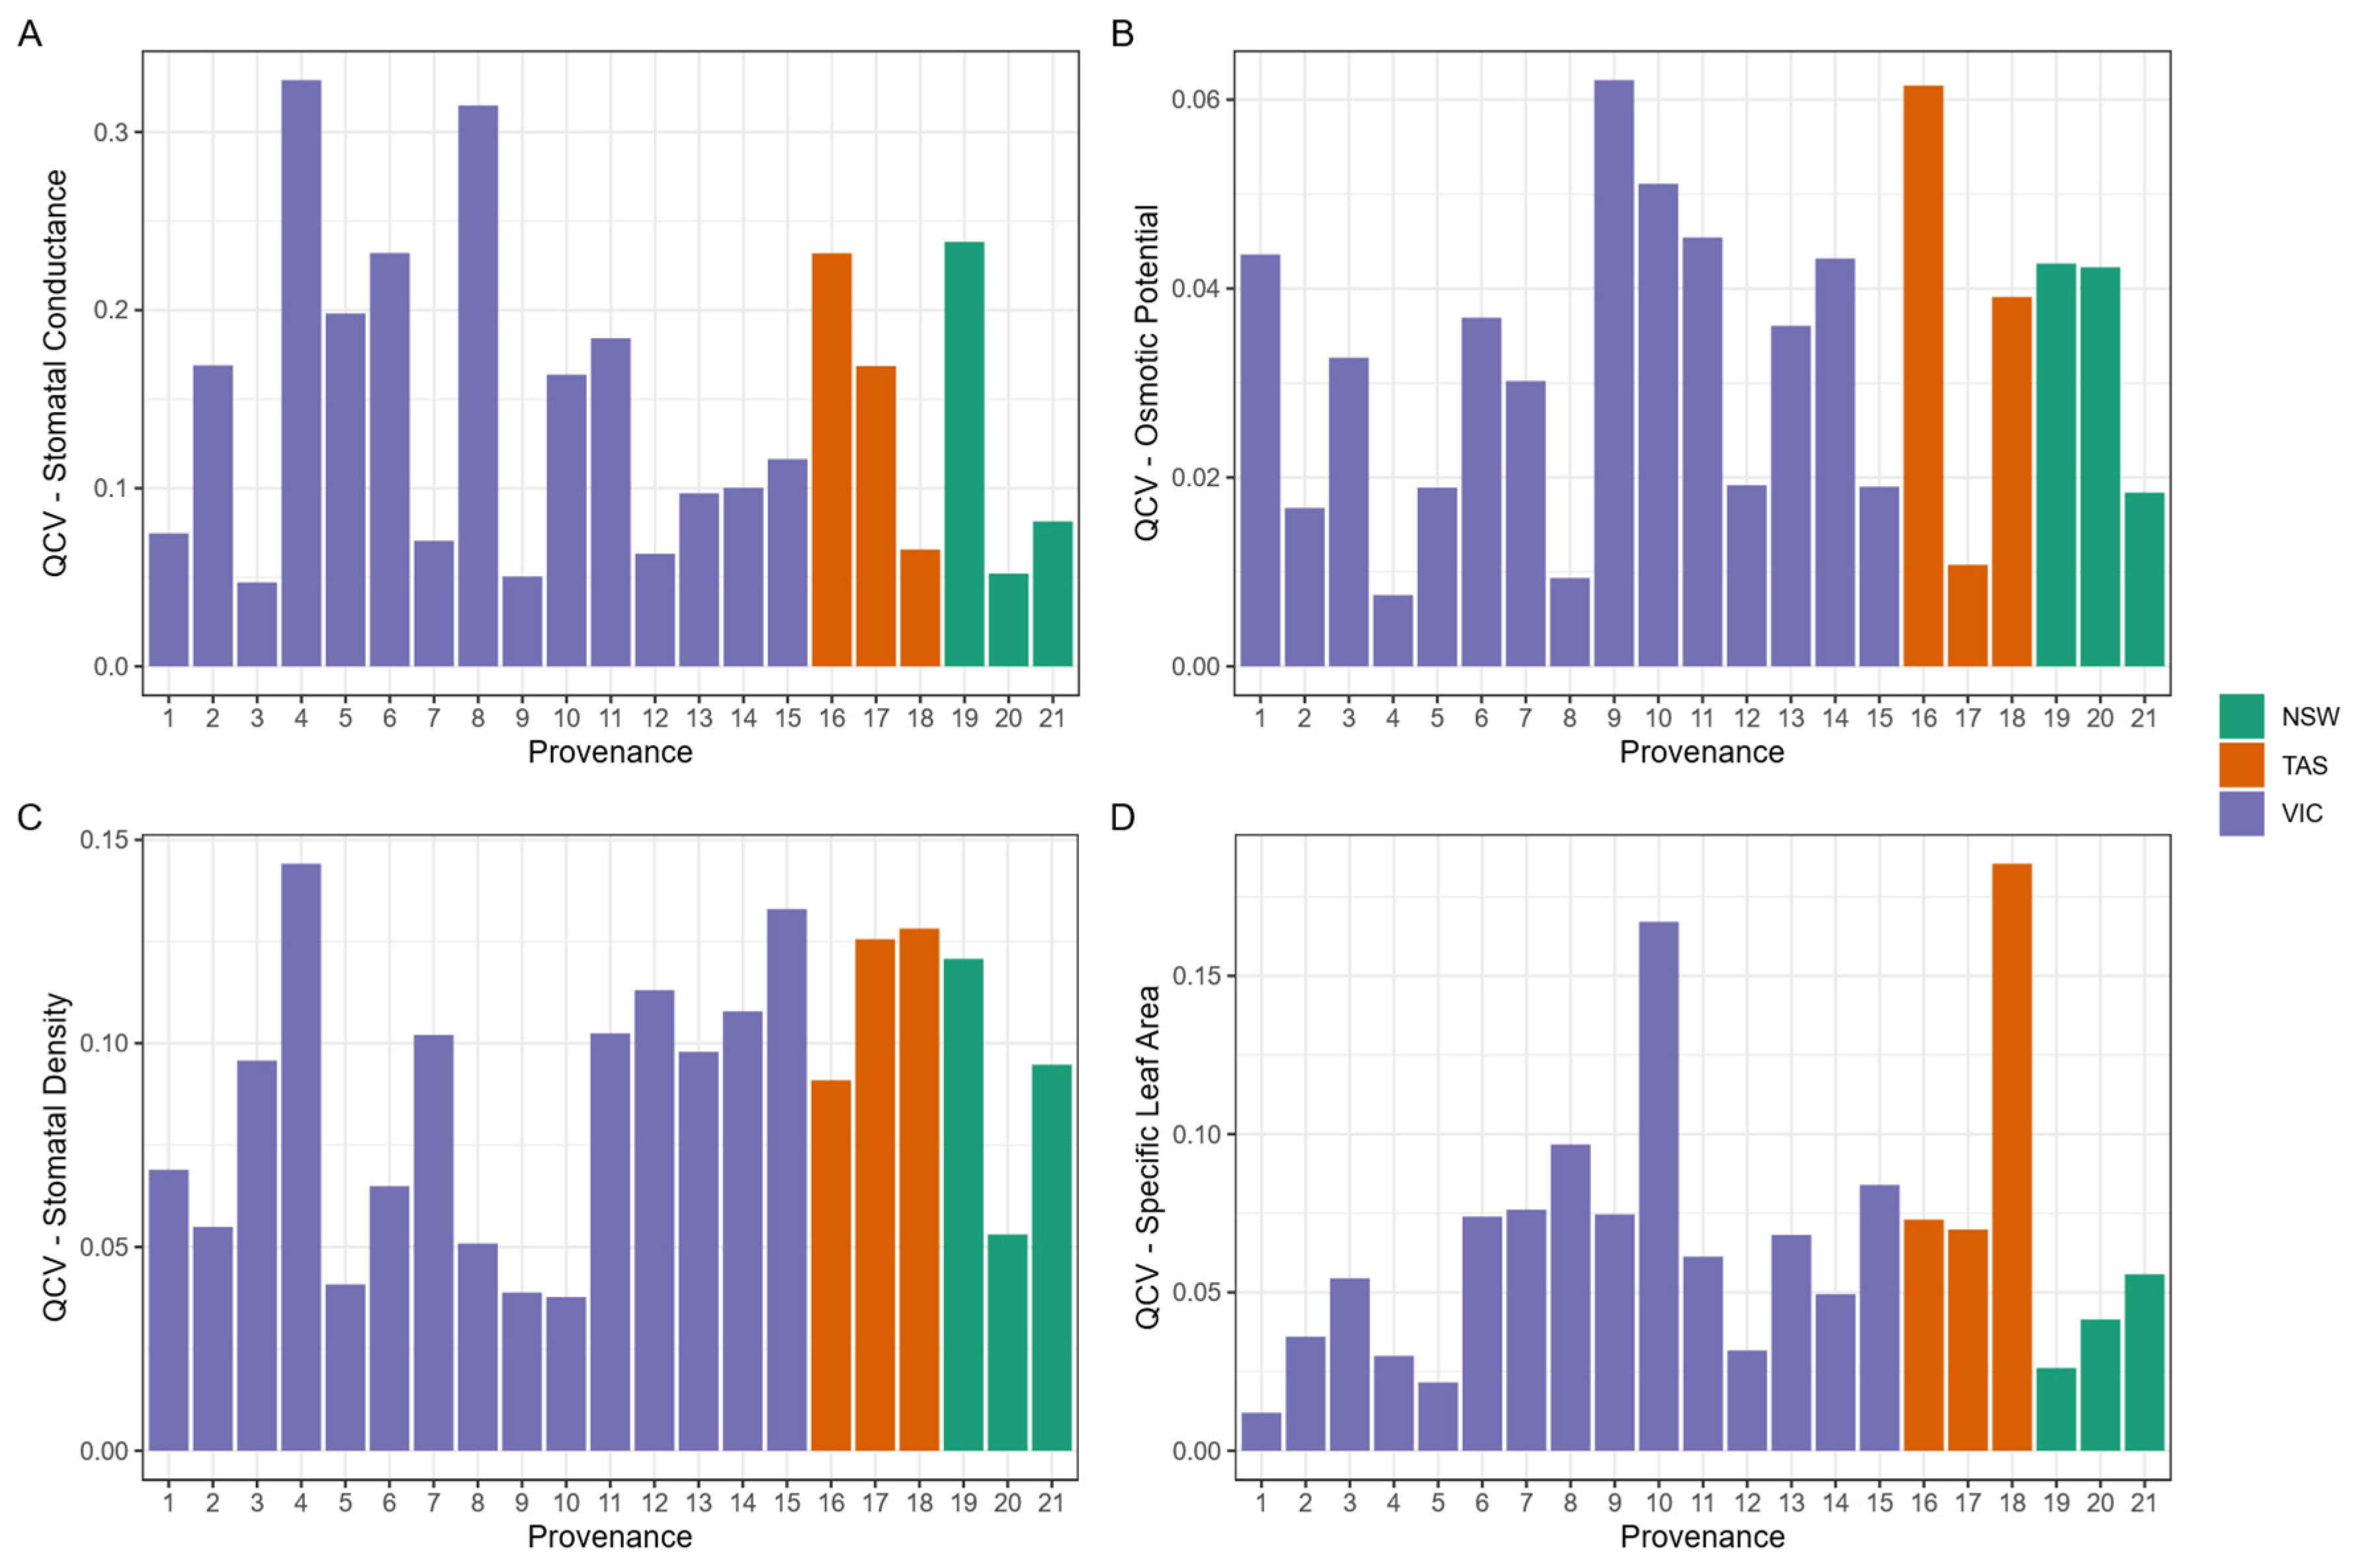
3.5. Intraspecific Trait Variation

The variation in trait expression within provenances varied (see Figure 6) between provenances and between traits. The variation of π100 was low, ranging from 0.7 to ~6.2%; for SLA, it ranged from 1.2 to 18.5%; for SD, it ranged from 3.8 to 13.4%; and for gmin, it ranged from 4.7 to 32.9%. There were significant relationships between the quartile coefficient of variation (QCV) and climate factors for three of the traits: SLA, SD and gmin (see Figure 7). For SLA, a multivariate model with AHMI (p < 0.003) and mean temperature of the coldest quarter (p < 0.027) explained 55% of the variation in QCV. Both climate variables were positively related to QCV, with the model providing moderate to strong evidence that provenances from more arid sites with warmer winters had higher variation in SLA. There was a significant and negative relationship between QCV and mean temperature of the driest quarter for gmin (p < 0.032; adjusted-r2: 18%), providing moderate evidence that provenances from warmer sites typically had lower variation in gmin. There was weak evidence (p = 0.068; adjusted-r2: 12%) for a positive relationship between QCV of stomatal density and minimum temperature of the coldest month, indicating that sites with colder winters have lower stomatal density. There were no significant relationships between climate of origin and osmotic potential of full turgor (π100).

4. Discussion

We did not confirm the hypotheses of this study. There was very little variation in the expression of functional traits across the provenances; there was no trait correlation between morpho-physiological functional traits; only rainfall-related climate of origin influenced functional trait expression of gmin and π100; and elevation of origin had an influence on SLA.

4.1. Variability of Functional Traits Across the Climate Gradient

We observed very little variation in trait expression among the 21 different provenances for any of the traits. Minimum stomatal conductance ranged from 2–4 mmol m2 s−1, which is at the lower range of reported values for gmin [57]. This indicates that E. delegatensis has very ‘tight’ leaves that lose very little moisture when stomata are closed. Stomatal density ranged from 170–300 stomata mm−1, which is mid-range stomatal density compared to other tree species globally [58]. Specific leaf area ranged from 50–70 cm2 g−1, which is mid-range SLA in Australian trees [59] but lower than the SLA values reported for eucalypts from high elevation and high rainfall areas in Victoria [60]. We note that our plants were grown at very low altitude in the common garden (50 m), which could have influenced the SLA compared to the study by Givnish et al. [60], which sampled trees in the field. The osmotic potential of full turgor was very high, with values between −0.6 and 0.7 MPa. This would equate to a water potential at turgor loss (TLP) of −0.9–1.0 MPa when applying a generic conversion factor [61]. These values are higher than turgor loss points reported for other eucalypts in Victoria [62] and high values are usually associated with species that exhibit lower drought tolerance [9].
The low observed correlation between the traits is likely due to the measured traits within provenances responding differently to the environmental conditions of the common garden. When traits within a population diverge in their responses to the environment, then correlations between traits among populations are likely to weaken or disappear [63]. Intraspecific trait variation is the most likely explanation for the decoupling of traits that are typically correlated with each other when compared across populations and species [63].
We found varying relationships between functional traits and climatic/topographic variables. Aridity at climate of origin has a positive influence on gmin, and MAP had a positive influence on π100. However, it is important to note that the overall variation of gmin and π100 was very small and likely of no consequence to the drought tolerance of the population. There was a small decrease in π100 with decreasing rainfall, but this would not lead to greater or substantially different drought tolerance of a population. The same is true for gmin, which was very low in all populations. There was a significant negative relationship between SLA and elevation of origin. This has been reported before and can largely be explained by the altitude-related temperature gradient [64]. However, in our study, MAT was not related to SLA; it is possible that, in addition to temperature, higher levels of solar irradiation and wind exposure may affect leaf size and SLA [63,65].

4.2. Why Was the Variation of Functional Traits So Small Among Provenances?

The variation of functional traits across environmental gradients has been reported before and is especially prevalent in eucalypts. Eucalypts in more arid environments are shorter, have smaller leaves and smaller SLA [60,66]; they have smaller xylem vessels and greater wood density [16], often have lower turgor loss points [62,67] and a lower vulnerability of xylem vessels to embolism [68]. However, almost all studies that observed these differences investigated eucalypt species from very contrasting environments, often ranging from very arid woodlands to wet forests. The variability of the climate in the distribution of E. delegatensis is much smaller as it grows mainly at high altitudes (usually elevation > 1000 m), with high rainfall (900–1800 mm) and low temperatures (MAP 6–12 °C; Appendix A, Table A1). The aridity in the natural environment of E. delegatensis is also very low, with AHMI values between 10 and 20, whereas most other eucalypts occur in much more arid environments (AHMI values 20–100; Appendix A, Figure A3). Thus, E. delegatensis is occupying a climatic environment that is very uniform and that is also not prone to prolonged periods of very hot and dry conditions.
The very low gmin values demonstrate that E. delegatensis has very tight leaves and loses very little water when stomata are closed. The very high values of osmotic potential at full turgor, on the other hand, indicate that this is a species that is not well adapted to chronic or extensive drought [69]. It is therefore likely that E. delegatensis will respond to periods of drought by transient adjustments such as stomatal closure or maybe even small adjustments of leaf area. Stems of tall trees, such as E. delegatensis, can store large amounts of water that can provide 10%–50% of daily transpiration [70], which would provide a water buffer in dry periods. These reversible physiological responses to water deficit are likely sufficient to survive short heat waves and periods of low rainfall. It is therefore likely that the climatic conditions in the natural environment of E. delegatensis have not led to evolutionary pressures that would have selected for leaf functional traits that are associated with greater drought tolerance.

4.3. Genetic vs. Environmental Influences of Trait Expression

It is important to note that we studied the expression of functional traits in a common garden experiment under non-stressed conditions. This means that all provenances were exposed to the same environmental conditions. It is therefore expected that trait expression was mainly controlled by plant genetics, as there would be very little (or similar) environmental influence on trait expression. This will be different in studies that investigate plants along environmental gradients in situ. In these studies, and there are many examples [7,10,16,60,71,72,73], the trait expression will be influenced by plant genetics and environmental influences that trigger trait plasticity. This was highlighted in a recent study where ten eucalypt species were studied in multiple common gardens along a climatic gradient [74]. Most traits were adaptive across species within gardens, indicating fixed genetic differences, and adaptive within species across gardens, indicating plasticity. For the E. delegatensis provenances assessed in this study, it appears that phenotypic coordination was strong within the studied environment. This means that it is entirely possible that E. delegatensis may express differences in functional trait expression if we study them across an environmental gradient in the natural environment. It is possible that all four functional traits could exhibit trait plasticity and adjust to local conditions. Yet the environmental conditions in the natural environment, with high elevation, low MAT and high MAP, are not very drought prone. Thus, it is likely that any adjustments would be transient, and drought avoidance responses outlined above are more likely than plasticity-mediated drought tolerance. The functional traits of E. delegatensis are typical of a less drought-tolerant species: high π100, low gmin, large leaves, tall trees and hydraulic architecture with large xylem vessels enabling efficient water transport—and hydraulic traits in eucalypts appear to be largely genotypic in origin rather than environmentally plastic [16]. Thus, it is unlikely that a eucalypt could become drought-tolerant by means of trait plasticity alone. However, future experiments could explore the drought tolerance of the species in stress experiments to further explore plastic trait responses.

4.4. Intraspecific Trait Variation

Intraspecific trait expression varied between provenances for all traits. This variation is unlikely due to ontogeny effects, as the trees were of the same age, nor due to the influence of within-site variation in environmental factors, such as soil properties, as the trees were sampled across the same gradient of soil properties [63]. The relationship between intraspecific trait variation and climate of origin variables provides evidence of genetic control over three of the traits measured [75]—SLA, gmin and SD—which may have shaped trait expression [76]. The greater variation in SLA expression for provenances from warmer and drier climates of origin suggests that these environments could be more variable in their climate, which may have selected for increased plasticity in SLA to enable trees to take advantage of ephemeral pulses of resources to maximise growth [76]. This increase in variation in SLA was counterbalanced by a decrease in the variation of gmin at warmer and drier sites which indicates that E. delegatensis growing at these sites may be more tightly adapted to their climate of origin, enabling them to reduce water loss at these warmer and drier sites. Our results add novel aspects to the expression of functional traits and climate of origin within a species. There is plenty of evidence that traits vary across species along environmental gradients (see references above). However, trait variation within species that is genetically controlled and not influenced by environmental plasticity appears to be much less common. In E. camaldulensis, the most widely distributed eucalypt in Australia, there was no relationship between turgor loss point or SLA and the climate of origin in nine provenances in a glasshouse study [77]. The same was true for subspecies of Dodonaea viscosa Jacq., a polymorphic shrub species in Australia that occurs in vastly different environments [27]. A different response was recorded in Eucalyptus obliqua L’Her., a eucalypt with a greater environmental distribution than E. delegatensis in SE Australia [10]. Several functional traits (TLP, SLA, xylem vulnerability) decreased with lower MAP in the field, and some also changed with summer drought. However, when the provenances were grown in the glasshouse under identical conditions, TLP, SLA or Huber value were identical among provenances, whereas xylem vulnerability and leaf size still decreased with lower rainfall at origin. This means that some functional traits were under significant genetic control in populations along climatic gradients, whereas others are not. It is important to note that some traits are also much more inherently plastic. For example, the osmotic potential at full turgor (and by extension TLP) is mainly influenced by the concentration of solutes in the leaves, and these will fluctuate between seasons or with stress exposure. Similarly, SLA can change during the season, and HV will change rapidly with leaf loss, a common drought response of many trees. Thus, we need to consider experimental design and influences of genetics and the environment when studying trait variation.

4.5. Management Implications

In the face of fast-paced changes in climatic conditions, restoration (or rather ‘renovation’ sensu Prober) actions must ensure that the trees that are planted today can persist and adapt into an uncertain future. This necessitates transitioning from the status quo of including only locally sourced seeds to inclusion of ‘climate analogues’: strategic seed sourcing from provenances along the species’ distribution that will confer greater adaptive potential to a changing climate [78]. Based on our results, selecting E. delegatensis provenances on the basis of their leaf-mediated drought tolerance will not be necessary. In our study, all 21 provenances of E. delegatensis that originate from an environmental gradient did not show significant differences in the expression of drought tolerance related functional leaf traits. Overall, the trait expression observed in this study indicates that E. delegatensis may be tightly adapted to its environment [79].
Statistical relationships with climate of origin and elevation provide evidence that some traits may be under genetic control. The variability in trait expression within provenances and the influence of climate of origin on intraspecific trait variation could indicate that plasticity may have been selected for across the species range. An exception to this is osmotic potential of full turgor, which had no relationship with climate of origin and very low values of variation, indicating the presence of “constant plasticity” across provenances [80]. This constancy of trait expression is a concern because it can reduce the strength of natural selection and therefore influence local adaptation to a changing climate [79,80]. The results do not indicate that certain provenances would be superior to others in terms of drought tolerance, as they all had very similar trait expressions. This suggests that adopting a more flexible approach to seed sourcing that focuses on cost-effective strategies and practicality rather than adherence to specific provenances could be better. This approach would substantially improve the efficient use of available resources in restoration projects.

5. Conclusions

The selection of provenances that have better adaptation and phenotypic plasticity to adverse climatic conditions, particularly drought, has been an important aspect of forest restoration and management [81]. However, we detected little interspecific variation in drought functional traits among 21 alpine ash provenances collected from an environmental gradient. In addition, the relationship between the morpho-physiological traits was insignificant. While there were some significant relationships between trait expression and climate of origin, the trait variation was very limited among provenances and would be unlikely to have any significant biological consequence for the drought tolerance of a provenance. This lack of variation could be attributed to the species being tightly adapted to its narrow distribution range, which has a narrow range of climatic conditions. The variability of trait expression was related to climate of origin, suggesting that some provenances may be inherently more plastic for some traits; however, the functionality of this plasticity requires further testing. The highly variable climatic conditions experienced by the species across its range may have exerted selection pressure on other traits that promote regeneration, growth and/or frost tolerance over drought adaptation strategies between the provenances to enable the species to dominate large areas on the montane landscapes of southeastern Australia. This means that there is likely no ‘superior’ provenance to be selected based on drought-adapted traits. The influence of provenance on other key traits related to regeneration, growth and reproduction requires investigation to determine the importance of genetics, plasticity and ontogeny on trait expression in these key processes.

Author Contributions

A.G., B.W., E.C.P., C.R.N. and S.K.A. conceptualized the research; B.W., E.C.P., C.R.N. and S.K.A. designed the common garden experiment and supported planting and site maintenance; A.G. carried out field and laboratory work; A.G. analyzed the data with support by B.W. and S.K.A.; A.G. drafted the manuscript; B.W., E.C.P., C.R.N. and S.K.A. revised the manuscript and supported the writing process; B.W. and S.K.A. finalized the submitted version of the manuscript for publication with support from A.G. All authors have read and agreed to the published version of the manuscript.

Funding

Funding for this research was generously provided by Greening Australia Ltd. and the Minderoo Foundation for the project Minderoo Climate Future Plots 25-8333.

Data Availability Statement

Datasets used in this research are publicly available on github via https://github.com/BennyWag/ashtraits.

Acknowledgments

We thank Melinda Pickup (Greening Australia Ltd.) for project facilitation and support and Rebecca Du (The University of Melbourne) for laboratory training and support.

Conflicts of Interest

Author Elizabeth C. Pryde was employed by the company Greening Australia Ltd. The remaining authors declare that the research was conducted in the absence of any commercial or financial relationships that could be construed as a potential conflict of interest.

Appendix A

Appendix A.1. Figures

Figure A1. The selected planting design that forms a 3 × 3 grid to avoid neighbouring the same set of provenances.
Forests 16 00898 g0a1
Figure A2. Elevation and climate (mean annual temperature (A) and mean annual precipitation (B)) of seed source location (climate of origin) for the 21 Eucalyptus delegatensis provenances studied.
Forests 16 00898 g0a2
Figure A3. HMI range of Eucalyptus delegatensis (Eucalyptus delegatensis range, location of origin of Victorian Eucalyptus delegatensis provenance shown as blue diamonds) compared with other ecotones and their AHMI ranges in Victoria. The location of the common garden experimental site in Melbourne is shown as an orange point.
Forests 16 00898 g0a3

Appendix A.2. Tables

Table A1. Locations and climatic conditions of 21 provenances of Eucalyptus delegatensis (Alpine ash) across their geographic distribution in southeast Australia (Australian Alps bioregion).
ProvenanceStatex-Coordinatey-CoordinateAHMIElevation (m)MAT (°C)MAP (mm)
1VIC146.287−37.78910.7311241.2508.0831847
2VIC146.766−37.45813.0811309.0807.0421573
3VIC146.196−37.74112.857992.7479.2171796
4VIC146.489−37.64812.4671187.5948.0251690
5VIC146.535−37.73115.2761082.1568.7501618
6VIC148.983−37.18724.706920.50010.100813
7VIC148.911−37.25220.4101099.9878.817982
8VIC147.964−37.27727.0661025.5359.275974
9VIC147.903−37.16518.7241402.8557.9331168
10VIC147.566−36.84221.7001128.3328.6331218
11VIC145.887−37.35114.7481048.1379.6921735
12VIC146.498−37.09514.1801017.4198.0331505
13VIC147.446−36.79318.2911181.3038.8921245
14VIC145.874−37.41012.921999.1279.8331761
15VIC146.354−37.13616.141979.3379.7831379
16TAS147.009−41.94017.7621048.0006.625936
17TAS147.526−41.33413.910658.0008.7081345
18TAS148.104−41.36721.351248.00011.8421023
19NSW148.623−35.57412.7261432.3597.9421404
20NSW148.581−35.41614.7931204.88710.0581260
21NSW148.195−36.07613.7981115.21110.6251170

References

  1. Anderegg, W.R.L.; Kane, J.M.; Anderegg, L.D.L. Consequences of widespread tree mortality triggered by drought and temperature stress. Nat. Clim. Change 2012, 3, 30–36. [Google Scholar] [CrossRef]
  2. Engelbrecht, B.M.; Comita, L.S.; Condit, R.; Kursar, T.A.; Tyree, M.T.; Turner, B.L.; Hubbell, S.P. Drought sensitivity shapes species distribution patterns in tropical forests. Nature 2007, 447, 80–82. [Google Scholar] [CrossRef] [PubMed]
  3. Allen, C.D.; Macalady, A.K.; Chenchouni, H.; Bachelet, D.; McDowell, N.; Vennetier, M.; Kitzberger, T.; Rigling, A.; Breshears, D.D.; Hogg, E.H.; et al. A global overview of drought and heat-induced tree mortality reveals emerging climate change risks for forests. For. Ecol. Manag. 2010, 259, 660–684. [Google Scholar] [CrossRef]
  4. Kurz, W.A.; Dymond, C.C.; Stinson, G.; Rampley, G.J.; Neilson, E.T.; Carroll, A.L.; Ebata, T.; Safranyik, L. Mountain pine beetle and forest carbon feedback to climate change. Nature 2008, 452, 987–990. [Google Scholar] [CrossRef] [PubMed]
  5. van Mantgem, P.J.; Stephenson, N.L.; Byrne, J.C.; Daniels, L.D.; Franklin, J.F.; Fule, P.Z.; Harmon, M.E.; Larson, A.J.; Smith, J.M.; Taylor, A.H.; et al. Widespread increase of tree mortality rates in the western United States. Science 2009, 323, 521–524. [Google Scholar] [CrossRef]
  6. Anderson, N.S.; Fontaine, J.B.; Lewandrowski, W.; Walden, L.; Ruthrof, K.X. Drought and Wildfire Legacies Highlight Vulnerability of a Mediterranean Climate-Type Forest. Austral Ecol. 2025, 50, e70011. [Google Scholar] [CrossRef]
  7. Ahrens, C.W.; Andrew, M.E.; Mazanec, R.A.; Ruthrof, K.X.; Challis, A.; Hardy, G.; Byrne, M.; Tissue, D.T.; Rymer, P.D. Plant functional traits differ in adaptability and are predicted to be differentially affected by climate change. Ecol. Evol. 2020, 10, 232–248. [Google Scholar] [CrossRef]
  8. Heilmeier, H. Functional traits explaining plant responses to past and future climate changes. Flora 2019, 254, 1–11. [Google Scholar] [CrossRef]
  9. Bartlett, M.K.; Scoffoni, C.; Sack, L. The determinants of leaf turgor loss point and prediction of drought tolerance of species and biomes: A global meta-analysis. Ecol. Lett. 2012, 15, 393–405. [Google Scholar] [CrossRef]
  10. Pritzkow, C.; Williamson, V.; Szota, C.; Trouve, R.; Arndt, S.K. Phenotypic plasticity and genetic adaptation of functional traits influences intra-specific variation in hydraulic efficiency and safety. Tree Physiol. 2020, 40, 215–229. [Google Scholar] [CrossRef]
  11. Warren, C.R.; Tausz, M.; Adams, M.A. Does rainfall explain variation in leaf morphology and physiology among populations of red ironbark (Eucalyptus sideroxylon subsp. tricarpa) grown in a common garden? Tree Physiol. 2005, 25, 1369–1378. [Google Scholar] [CrossRef] [PubMed]
  12. Bertolino, L.T.; Caine, R.S.; Gray, J.E. Impact of Stomatal Density and Morphology on Water-Use Efficiency in a Changing World. Front. Plant Sci. 2019, 10, 225. [Google Scholar] [CrossRef]
  13. James, A.T.; Lawn, R.J.; Cooper, M. Genotypic variation for drought stress response traits in soybean. I. Variation in soybean and wild Glycine spp. for epidermal conductance, osmotic potential, and relative water content. Aust. J. Agric. Res. 2008, 59, 656–669. [Google Scholar] [CrossRef]
  14. Choat, B.; Jansen, S.; Brodribb, T.J.; Cochard, H.; Delzon, S.; Bhaskar, R.; Bucci, S.J.; Feild, T.S.; Gleason, S.M.; Hacke, U.G.; et al. Global convergence in the vulnerability of forests to drought. Nature 2012, 491, 752–755. [Google Scholar] [CrossRef]
  15. Li, X.; Blackman, C.J.; Choat, B.; Duursma, R.A.; Rymer, P.D.; Medlyn, B.E.; Tissue, D.T. Tree hydraulic traits are coordinated and strongly linked to climate-of-origin across a rainfall gradient. Plant Cell Environ. 2018, 41, 646–660. [Google Scholar] [CrossRef]
  16. Pfautsch, S.; Harbusch, M.; Wesolowski, A.; Smith, R.; Macfarlane, C.; Tjoelker, M.G.; Reich, P.B.; Adams, M.A. Climate determines vascular traits in the ecologically diverse genus Eucalyptus. Ecol. Lett. 2016, 19, 240–248. [Google Scholar] [CrossRef] [PubMed]
  17. Trueba, S.; Pouteau, R.; Lens, F.; Feild, T.S.; Isnard, S.; Olson, M.E.; Delzon, S. Vulnerability to xylem embolism as a major correlate of the environmental distribution of rain forest species on a tropical island. Plant Cell Environ. 2017, 40, 277–289. [Google Scholar] [CrossRef]
  18. Kibria, M.G.; Tjoelker, M.G.; Marchin, R.M.; Arndt, S.K.; Rymer, P.D. Can species climate niche predict canopy growth, functional traits and phenotypic plasticity in urban trees? Urban For. Urban Green. 2024, 98, 128417. [Google Scholar] [CrossRef]
  19. Warren, C.R.; Dreyer, E.; Tausz, M.; Adams, M.A. Ecotype adaptation and acclimation of leaf traits to rainfall in 29 species of 16-year-old Eucalyptus at two common gardens. Funct. Ecol. 2006, 20, 929–940. [Google Scholar] [CrossRef]
  20. Umana, M.N.; Swenson, N.G. Intraspecific variation in traits and tree growth along an elevational gradient in a subtropical forest. Oecologia 2019, 191, 153–164. [Google Scholar] [CrossRef]
  21. Li, X.; Blackman, C.J.; Choat, B.; Rymer, P.D.; Medlyn, B.E.; Tissue, D.T. Drought tolerance traits do not vary across sites differing in water availability in Banksia serrata (Proteaceae). Funct. Plant Biol. 2019, 46, 624–633. [Google Scholar] [CrossRef] [PubMed]
  22. Lobo, A.; Torres-Ruiz, J.M.; Burlett, R.; Lemaire, C.; Parise, C.; Francioni, C.; Truffaut, L.; Tomaskova, I.; Hansen, J.K.; Kjaer, E.D.; et al. Assessing inter- and intraspecific variability of xylem vulnerability to embolism in oaks. For. Ecol. Manag. 2018, 424, 53–61. [Google Scholar] [CrossRef] [PubMed]
  23. Maherali, H.; DeLucia, E.H. Xylem conductivity and vulnerability to cavitation of ponderosa pine growing in contrasting climates. Tree Physiol. 2000, 20, 859–867. [Google Scholar] [CrossRef] [PubMed]
  24. Doherty, M.D.; Lavorel, S.; Colloff, M.J.; Williams, K.J.; Williams, R.J. Moving from autonomous to planned adaptation in the montane forests of southeastern Australia under changing fire regimes. Austral Ecol. 2017, 42, 309–316. [Google Scholar] [CrossRef]
  25. McLean, E.H.; Prober, S.M.; Stock, W.D.; Steane, D.A.; Potts, B.M.; Vaillancourt, R.E.; Byrne, M. Plasticity of functional traits varies clinally along a rainfall gradient in Eucalyptus tricarpa. Plant Cell Environ. 2014, 37, 1440–1451. [Google Scholar] [CrossRef]
  26. Nicotra, A.B.; Atkin, O.K.; Bonser, S.P.; Davidson, A.M.; Finnegan, E.J.; Mathesius, U.; Poot, P.; Purugganan, M.D.; Richards, C.L.; Valladares, F.; et al. Plant phenotypic plasticity in a changing climate. Trends Plant Sci. 2010, 15, 684–692. [Google Scholar] [CrossRef]
  27. Xu, G.Q.; Farrell, C.; Arndt, S.K. Climate of origin has no influence on drought adaptive traits and the drought responses of a widely distributed polymorphic shrub. Tree Physiol. 2022, 42, 86–98. [Google Scholar] [CrossRef]
  28. Ramirez-Valiente, J.A.; Cavender-Bares, J. Evolutionary trade-offs between drought resistance mechanisms across a precipitation gradient in a seasonally dry tropical oak (Quercus oleoides). Tree Physiol. 2017, 37, 889–901. [Google Scholar] [CrossRef]
  29. Walters, M.B.; Gerlach, J.P. Intraspecific growth and functional leaf trait responses to natural soil resource gradients for conifer species with contrasting leaf habit. Tree Physiol. 2013, 33, 297–310. [Google Scholar] [CrossRef]
  30. Booth, T.H.; Broadhurst, L.M.; Pinkard, E.; Prober, S.M.; Dillon, S.K.; Bush, D.; Pinyopusarerk, K.; Doran, J.C.; Ivkovich, M.; Young, A.G. Native forests and climate change: Lessons from eucalypts. For. Ecol. Manag. 2015, 347, 18–29. [Google Scholar] [CrossRef]
  31. Hughes, L.; Cawsey, E.M.; Westoby, M. Climatic Range Sizes of Eucalyptus Species in Relation to Future Climate Change. Glob. Ecol. Biogeogr. Lett. 1996, 5, 23–29. [Google Scholar] [CrossRef]
  32. Westoby, M.; Andrew, S.C.; Gallagher, R.V.; Schrader, J. Species gain and loss per degree Celsius. Oikos 2024, 2024, e10556. [Google Scholar] [CrossRef]
  33. Bowman, D.M.; Murphy, B.P.; Neyland, D.L.; Williamson, G.J.; Prior, L.D. Abrupt fire regime change may cause landscape-wide loss of mature obligate seeder forests. Glob. Change Biol. 2014, 20, 1008–1015. [Google Scholar] [CrossRef]
  34. McColl-Gausden, S.C.; Bennett, L.T.; Ababei, D.A.; Clarke, H.G.; Penman, T.D. Future fire regimes increase risks to obligate-seeder forests. Divers. Distrib. 2021, 17, 542–558. [Google Scholar] [CrossRef]
  35. Fairman, T.A.; Nitschke, C.R.; Bennett, L.T. Too much, too soon? A review of the effects of increasing wildfire frequency on tree mortality and regeneration in temperate eucalypt forests. Int. J. Wildland Fire 2016, 25, 831–848. [Google Scholar] [CrossRef]
  36. Singh, A.; Baker, P.J.; Kasel, S.; Trouvé, R.; Stewart, S.B.; Nitschke, C.R. The role of climatic variability on Eucalyptus regeneration in southeastern Australia. Glob. Ecol. Conserv. 2021, 32, e01929. [Google Scholar] [CrossRef]
  37. Mok, H.F.; Arndt, S.K.; Nitschke, C.R. Modelling the potential impact of climate variability and change on species regeneration potential in the temperate forests of South-Eastern Australia. Global Change Biol. 2012, 18, 1053–1072. [Google Scholar] [CrossRef]
  38. Tng, D.Y.P.; Williamson, G.J.; Jordan, G.J.; Bowman, D. Giant eucalypts—Globally unique fire-adapted rain-forest trees? New Phytol. 2012, 196, 1001–1014. [Google Scholar] [CrossRef] [PubMed]
  39. Collins, L.; Clarke, H.; Clarke, M.F.; McColl Gausden, S.C.; Nolan, R.H.; Penman, T.; Bradstock, R.; Varner, M. Warmer and drier conditions have increased the potential for large and severe fire seasons across south-eastern Australia. Global Ecol. Biogeogr. 2022, 31, 1933–1948. [Google Scholar] [CrossRef]
  40. Bassett, O.D.; Prior, L.D.; Slijkerman, C.M.; Jamieson, D.; Bowman, D.M.J.S. Aerial sowing stopped the loss of alpine ash (Eucalyptus delegatensis) forests burnt by three short-interval fires in the Alpine National Park, Victoria, Australia. For. Ecol. Manag. 2015, 342, 39–48. [Google Scholar] [CrossRef]
  41. Mátyás, C. Climatic adaptation of trees: Rediscovering provenance tests. Euphytica 1996, 92, 45–54. [Google Scholar] [CrossRef]
  42. de Villemereuil, P.; Gaggiotti, O.E.; Mouterde, M.; Till-Bottraud, I. Common garden experiments in the genomic era: New perspectives and opportunities. Heredity 2016, 116, 249–254. [Google Scholar] [CrossRef] [PubMed]
  43. Stewart, S.B.; Nitschke, C.R. Improving temperature interpolation using MODIS LST and local topography: A comparison of methods in south east Australia. Int. J. Climatol. 2017, 37, 3098–3110. [Google Scholar] [CrossRef]
  44. Fick, S.E.; Hijmans, R.J. WorldClim 2: New 1-km spatial resolution climate surfaces for global land areas. Int. J. Climatol. 2017, 37, 4302–4315. [Google Scholar] [CrossRef]
  45. Paudel, S.K.; Waeber, P.O.; Simard, S.W.; Innes, J.L.; Nitschke, C.R. Multiple factors influence plant richness and diversity in the cold and dry boreal forest of southwest Yukon, Canada. Plant Ecol. 2016, 217, 505–519. [Google Scholar] [CrossRef]
  46. Wang, T.; Hamann, A.; Yanchuk, A.; O’Neill, G.A.; Aitken, S.N. Use of response functions in selecting lodgepole pine populations for future climates. Global Change Biol. 2006, 12, 2404–2416. [Google Scholar] [CrossRef]
  47. Farr, T.G.; Rosen, P.A.; Caro, E.; Crippen, R.; Duren, R.; Hensley, S.; Kobrick, M.; Paller, M.; Rodriguez, E.; Roth, L. The shuttle radar topography mission. Rev. Geophys. 2007, 45, 1–33. [Google Scholar] [CrossRef]
  48. Schneider, C.A.; Rasband, W.S.; Eliceiri, K.W. NIH Image to ImageJ: 25 years of image analysis. Nat. Methods 2012, 9, 671–675. [Google Scholar] [CrossRef]
  49. Camargo, M.A.B.; Marenco, R.A. Density, size and distribution of stomata in 35 rainforest tree species in Central Amazonia. Acta Amaz. 2011, 41, 205–212. [Google Scholar] [CrossRef]
  50. Beaulieu, J.M.; Leitch, I.J.; Patel, S.; Pendharkar, A.; Knight, C.A. Genome size is a strong predictor of cell size and stomatal density in angiosperms. New Phytol. 2008, 179, 975–986. [Google Scholar] [CrossRef]
  51. Callister, A.N.; Arndt, S.K.; Adams, M.A. Comparison of four methods for measuring osmotic potential of tree leaves. Physiol. Plant. 2006, 127, 383–392. [Google Scholar] [CrossRef]
  52. Pearcy, R.W.; Ehleringer, J.R.; Mooney, H.A.; Rundel, P.W. Plant Physiological Ecology: Field Methods and Instrumentation; Springer: Berlin/Heidelberg, Germany, 2012. [Google Scholar]
  53. Sack, L.; Cowan, P.D.; Jaikumar, N.; Holbrook, N.M. The ‘hydrology’ of leaves: Co-ordination of structure and function in temperate woody species. Plant Cell Environ. 2003, 26, 1343–1356. [Google Scholar] [CrossRef]
  54. Schreiber, L.; Skrabs, M.; Hartmann, K.D.; Diamantopoulos, P.; Simanova, E.; Santrucek, J. Effect of humidity on cuticular water permeability of isolated cuticular membranes and leaf disks. Planta 2001, 214, 274–282. [Google Scholar] [CrossRef]
  55. R Core Development Team. R: A Language and Environment for Statistical Computing; R Foundation for Statistical Computing: Vienna, Austria, 2024. [Google Scholar]
  56. Botta-Dukat, Z. Quartile coefficient of variation is more robust than CV for traits calculated as a ratio. Sci. Rep. 2023, 13, 4671. [Google Scholar] [CrossRef] [PubMed]
  57. Duursma, R.A.; Blackman, C.J.; Lopez, R.; Martin-StPaul, N.K.; Cochard, H.; Medlyn, B.E. On the minimum leaf conductance: Its role in models of plant water use, and ecological and environmental controls. New Phytol. 2019, 221, 693–705. [Google Scholar] [CrossRef] [PubMed]
  58. Liu, C.; Sack, L.; Li, Y.; Zhang, J.; Yu, K.; Zhang, Q.; He, N.; Yu, G. Relationships of stomatal morphology to the environment across plant communities. Nat. Commun. 2023, 14, 6629. [Google Scholar] [CrossRef]
  59. Portelli, A.M.; Windecker, S.M.; Pollock, L.J.; Neal, W.C.; Morris, W.K.; Khot, R.; Vesk, P.A.; Williams, D. From mallees to mountain ash, specific leaf area is coordinated with eucalypt tree stature, resprouting, stem construction, and fruit size. Aust. J. Bot. 2023, 71, 506–522. [Google Scholar] [CrossRef]
  60. Givnish, T.J.; Wong, S.C.; Stuart-Williams, H.; Holloway-Phillips, M.; Farquhar, G.D. Determinants of maximum tree height inEucalyptusspecies along a rainfall gradient in Victoria, Australia. Ecology 2014, 95, 2991–3007. [Google Scholar] [CrossRef]
  61. Bartlett, M.K.; Scoffoni, C.; Ardy, R.; Zhang, Y.; Sun, S.; Cao, K.; Sack, L. Rapid determination of comparative drought tolerance traits: Using an osmometer to predict turgor loss point. Methods Ecol. Evol. 2012, 3, 880–888. [Google Scholar] [CrossRef]
  62. Salvi, A.M.; Smith, D.D.; Adams, M.A.; McCulloh, K.A.; Givnish, T.J. Mesophyll photosynthetic sensitivity to leaf water potential in Eucalyptus: A new dimension of plant adaptation to native moisture supply. New Phytol. 2021, 230, 1844–1855. [Google Scholar] [CrossRef]
  63. Laughlin, D.C.; Lusk, C.H.; Bellingham, P.J.; Burslem, D.; Simpson, A.H.; Kramer-Walter, K.R. Intraspecific trait variation can weaken interspecific trait correlations when assessing the whole-plant economic spectrum. Ecol. Evol. 2017, 7, 8936–8949. [Google Scholar] [CrossRef]
  64. Koerner, C.; Bannister, P.; Mark, A.F. Altitudinal variation in stomatal conductance, nitrogen content and leaf anatomy in different plant life forms in New Zealand. Oecologia 1986, 69, 577–588. [Google Scholar] [CrossRef] [PubMed]
  65. Liu, W.; Zheng, L.; Qi, D. Variation in leaf traits at different altitudes reflects the adaptive strategy of plants to environmental changes. Ecol. Evol. 2020, 10, 8166–8175. [Google Scholar] [CrossRef] [PubMed]
  66. Anderegg, L.D.L.; Loy, X.; Markham, I.P.; Elmer, C.M.; Hovenden, M.J.; HilleRisLambers, J.; Mayfield, M.M. Aridity drives coordinated trait shifts but not decreased trait variance across the geographic range of eight Australian trees. New Phytol. 2021, 229, 1375–1387. [Google Scholar] [CrossRef]
  67. Bourne, A.E.; Creek, D.; Peters, J.M.R.; Ellsworth, D.S.; Choat, B. Species climate range influences hydraulic and stomatal traits in Eucalyptus species. Ann. Bot. 2017, 120, 123–133. [Google Scholar] [CrossRef]
  68. Peters, J.M.R.; Lopez, R.; Nolf, M.; Hutley, L.B.; Wardlaw, T.; Cernusak, L.A.; Choat, B. Living on the edge: A continental-scale assessment of forest vulnerability to drought. Glob. Change Biol. 2021, 27, 3620–3641. [Google Scholar] [CrossRef]
  69. Sanders, G.J.; Arndt, S.K. Osmotic Adjustment Under Drought Conditions. In Plant Responses to Drought Stress; Springer: Berlin/Heidelberg, Germany, 2012; pp. 199–229. [Google Scholar]
  70. Matheny, A.M.; Bohrer, G.; Garrity, S.R.; Morin, T.H.; Howard, C.J.; Vogel, C.S. Observations of stem water storage in trees of opposing hydraulic strategies. Ecosphere 2015, 6, 1–13. [Google Scholar] [CrossRef]
  71. Larter, M.; Pfautsch, S.; Domec, J.C.; Trueba, S.; Nagalingum, N.; Delzon, S. Aridity drove the evolution of extreme embolism resistance and the radiation of conifer genus Callitris. New Phytol. 2017, 215, 97–112. [Google Scholar] [CrossRef]
  72. Ellis, T.W.; Hatton, T.J. Relating leaf area index of natural eucalypt vegetation to climate variables in southern Australia. Agric. Water Manag. 2008, 95, 743–747. [Google Scholar] [CrossRef]
  73. Blackman, C.J.; Halliwell, B.; Brodribb, T.J. All together now: A mixed-planting experiment reveals adaptive drought tolerance in seedlings of 10 Eucalyptus species. Plant Physiol. 2024, 197, kiae632. [Google Scholar] [CrossRef]
  74. Smith, D.D.; Adams, M.A.; Salvi, A.M.; Krieg, C.P.; Ane, C.; McCulloh, K.A.; Givnish, T.J. Ecophysiological adaptations shape distributions of closely related trees along a climatic moisture gradient. Nat. Commun. 2023, 14, 7173. [Google Scholar] [CrossRef] [PubMed]
  75. Fontes, C.G.; Pinto-Ledezma, J.; Jacobsen, A.L.; Pratt, R.B.; Cavender-Bares, J. Adaptive variation among oaks in wood anatomical properties is shaped by climate of origin and shows limited plasticity across environments. Funct. Ecol. 2021, 36, 326–340. [Google Scholar] [CrossRef]
  76. Russo, S.E.; Kitajima, K. The Ecophysiology of Leaf Lifespan in Tropical Forests: Adaptive and Plastic Responses to Environmental Heterogeneity. In Tropical Tree Physiology; Tree Physiology; Springer: Berlin/Heidelberg, Germany, 2016; pp. 357–383. [Google Scholar]
  77. Aspinwall, M.J.; Blackman, C.J.; Maier, C.; Tjoelker, M.G.; Rymer, P.D.; Creek, D.; Chieppa, J.; Griffin-Nolan, R.J.; Tissue, D.T. Aridity drives clinal patterns in leaf traits and responsiveness to precipitation in a broadly distributed Australian tree species. Plant Environ. Interact. 2023, 4, 70–85. [Google Scholar] [CrossRef]
  78. Breed, M.F.; Stead, M.G.; Ottewell, K.M.; Gardner, M.G.; Lowe, A.J. Which provenance and where? Seed sourcing strategies for revegetation in a changing environment. Conserv. Genet. 2012, 14, 1–10. [Google Scholar] [CrossRef]
  79. Rice, K.J.; Emery, N.C. Managing microevolution: Restoration in the face of global change. Front. Ecol. Environ. 2003, 1, 469–478. [Google Scholar] [CrossRef]
  80. Lopez, R.; Cano, F.J.; Choat, B.; Cochard, H.; Gil, L. Plasticity in Vulnerability to Cavitation of Pinus canariensis Occurs Only at the Driest End of an Aridity Gradient. Front. Plant Sci. 2016, 7, 769. [Google Scholar] [CrossRef]
  81. Buras, A.; Sass-Klaassen, U.; Verbeek, I.; Copini, P. Provenance selection and site conditions determine growth performance of pedunculate oak. Dendrochronologia 2020, 61, 125705. [Google Scholar] [CrossRef]
Figure 1. Map showing the locations of seed sources for the 21 provenances of alpine ash (crosses), the geographic extent of alpine ash distribution in mainland Australia (blue outline) with elevation, and the location of the common garden experimental site in Melbourne, Victoria, Australia (orange point).
Forests 16 00898 g001
Figure 2. Elevation and average aridity (illustrated via AHMI—annual heat moisture index) of seed source location (climate of origin) for the 21 alpine ash provenances studied.
Forests 16 00898 g002
Figure 3. Morpho-physiological trait variation among the 21 provenances of alpine ash. Physiological traits are (A) gmin (minimum stomatal conductance) and (B) π100, (osmotic potential at full turgor), and morphological traits are (C) SD (stomatal density) and (D) SLA (specific leaf area). Purple box plots indicate provenances from Victoria, orange ones from Tasmania and green ones from New South Wales.
Forests 16 00898 g003
Figure 4. Regressions between morphological and physiological traits. (A) gmin (minimum stomatal conductance) and SD (stomatal density) (B) gmin and SLA (specific leaf area) π100, (osmotic potential at full turgor), and morphological traits are (C) π100 (osmotic potential at full turgor) and SD and (D) π100 and SLA. Shaded grey area around the line shows the 95% confidence interval of the regression model. None of the regressions were statistically significant.
Forests 16 00898 g004
Figure 5. Relationships of morpho-physiological traits with climate (annual heat moisture index (AHMI), mean annual temperature (MAT), mean annual precipitation (MAP)) and topography (elevation above sea level). Shaded grey area around the line shows the 95% confidence interval of the regression model.
Forests 16 00898 g005
Figure 6. Quartile coefficient of variation (QCV) of morpho-physiological traits: (A) minimum stomatal conductance (gmin), (B) osmotic potential of full turgor (π100), (C) stomatal density, and (D) specific leaf area (SLA) for each provenance. Provenances are colour coded by state of origin: New South Wales (NSW), Tasmania (TAS), and Victoria (VIC).
Forests 16 00898 g006
Figure 7. Relationships between the quartile coefficient of variation (QCV) of morpho-physiological traits and climate of origin: (A) specific leaf area (SLA) versus the annual heat moisture index (AHMI), (B) SLA versus the mean temperature of the coldest quarter, (C) minimum stomatal conductance (gmin) vs. the mean temperature of the driest quarter; and, (D) stomatal density versus minimum temperature of the coldest month. There were no significant relationships for osmotic potential of full turgor (π100). Provenances are colour coded by state of origin New South Wales (NSW), Tasmania (TAS), and Victoria (VIC).
Forests 16 00898 g007
Table 1. Summary of results for the relationship between functional trait expressions and climate of origin and elevation. Bold values indicate significant relationships.
Climate Variables (Predictor)TraitsValues
p-ValueEstimate ± S.E.Adjusted R-Squared
AHMIgmin0.0110.67 ± 0.08 0.27
p100 0.220.59 ± 0.020.03
SD0.76230.41 ± 17.49−0.05
SLA0.0751.44 ± 3.560.07
MATgmin0.762.30 ± 0.44−0.05
p1000.290.66 ± 0.040.01
SD0.98236.52 ± 33.25−0.05
SLA0.4551.50 ± 7.07−0.02
MAPgmin0.0562.90 ± 0.240.13
p1000.0430.67 ± 0.020.16
SD0.22259.27 ± 19.040.03
SLA0.3061.26 ± 4.150.01
Elevation (DEM)gmin0.662.54 ± 0.26−0.04
p1000.800.61 ± 0.02−0.05
SD0.76229.70 ± 19.37−0.05
SLA0.000170.01 ± 2.830.5
Significance codes for p-value: 0 ‘***’ 0.001 ‘**’ 0.01 ‘*’ 0.05.
Disclaimer/Publisher’s Note: The statements, opinions and data contained in all publications are solely those of the individual author(s) and contributor(s) and not of MDPI and/or the editor(s). MDPI and/or the editor(s) disclaim responsibility for any injury to people or property resulting from any ideas, methods, instructions or products referred to in the content.

