1. Introduction
Biodiversity encompasses the variety of life forms on Earth, including species diversity, genetic diversity, and ecosystem diversity [
1]. In forest ecosystems, which harbor over 80% of terrestrial biodiversity, biodiversity plays a fundamental role in maintaining ecological stability, supporting nutrient cycling, regulating climate, and providing essential resources for human development [
2]. The structural complexity of forest canopies and soil systems creates multidimensional niches that sustain symbiotic relationships across trophic levels, fostering genetic diversity and ecological interdependence critical to ecosystem resilience [
3]. These interactions not only underpin carbon sequestration and hydrological regulation but also establish habitat heterogeneity essential for species coexistence [
3]. However, the degradation of forest ecosystems threatens these processes, with biodiversity loss representing one of the most irreversible consequences of anthropogenic disturbances [
3]. Monitoring biodiversity trends in forest environments is crucial for understanding ecological dynamics and informing conservation strategies. To this end, a range of methods has been developed, from traditional field surveys such as point counts and manual observations to advanced technologies including infrared camera monitoring [
4], unmanned aerial vehicles (UAVs) [
5], and soundscape-based ecological monitoring [
6].
Among these technologies, soundscape monitoring has emerged as a powerful, non-invasive tool for assessing forest biodiversity and ecosystem health. It captures and analyzes ecological acoustic signals across broad spatial and temporal scales, enabling the study of animal activity, species interactions, and anthropogenic disturbances in dense, often inaccessible forested areas [
7]. Empirical studies have demonstrated that acoustic monitoring and soundscape analysis serve as robust methodologies for tracking forest biodiversity patterns, particularly in structurally complex habitats [
8]. The concept of the soundscape was first introduced by Southworth in 1967 [
9] in the context of urban planning. It has since evolved to include three core acoustic components, biophony (sounds produced by biological organisms), geophony (non-biological natural sounds such as wind and rain), and anthrophony (human-generated noise), all of which interact intricately within forest soundscapes and reflect ecological dynamics at multiple scales [
10].
In forest research and management, soundscape monitoring facilitates not only species detection and behavioral analysis but also supports long-term ecological observation, helps delineate species’ acoustic niches, and evaluates ecosystem disturbances caused by climate change, land use, or human activity [
11]. These capabilities make soundscape monitoring particularly valuable in complex, biodiverse environments such as temperate and tropical forests.
Current approaches to forest soundscape data analysis can be broadly classified into three categories: manual identification, acoustic index-based methods, and machine learning-based techniques. Manual annotation, where experts listen to recordings and analyze spectrograms, remains one of the most accurate classification methods [
12]. For example, Alvarez-Berrios et al. [
13] manually interpreted audio and spectrograms to estimate bird and anuran species richness in Peruvian forest reserves, identifying 56 bird species and nine frog species. However, this method is labor-intensive and unsuitable for large-scale, long-term forest monitoring.
To overcome this limitation, researchers have developed various acoustic indices—such as the Acoustic Complexity Index (ACI), Acoustic Diversity Index (ADI), Acoustic Evenness Index (AEI), Bioacoustic Index (BIO), Acoustic Entropy Index (H), and NDSI—that quantify forest soundscape characteristics based on frequency and amplitude patterns [
14,
15]. These indices are widely used for forest soundscape diversity assessments and landscape-level ecological comparisons. For instance, Hou et al. [
16] applied acoustic power and dissimilarity indices to explore how vegetation type and habitat structure influence forest acoustic profiles. However, these methods typically segment data using 1 kHz frequency bands, making it difficult to distinguish overlapping sound sources, a common issue in dense forest environments with rich species vocalizations and background geophony. With the proliferation of long-term, high-resolution acoustic datasets, artificial intelligence (AI) and deep learning techniques have become essential for automating soundscape classification in forest environments. These methods enable the efficient, scalable identification of vocalizing species and ecological sound patterns. For instance, Sun et al. [
17] applied convolutional neural networks (CNNs) to classify birds, mammals, amphibians, and insects in tropical forests, demonstrating the effectiveness of AI in extracting complex acoustic features from field-recorded forest data. However, most previous CNN-based studies employed single-label classification schemes, which assume that each audio clip contains only one dominant label. This oversimplifies ecological reality, as natural soundscapes often contain multiple, simultaneously occurring sources.
Nevertheless, real-world forest soundscapes are often highly complex, with overlapping sounds from multiple sources occurring simultaneously. For example, cicadas may produce continuous calling throughout the daytime while birds vocalize intermittently within the same period, often co-occurring with environmental sounds such as wind or rainfall. These simultaneous sound events result in overlapping acoustic sources from biophony, geophony, and anthrophony. Traditional single-label classification—where each audio segment is assigned only one label—cannot adequately capture the multi-source reality of natural forest environments [
18,
19]. To address this challenge, multi-label classification models have been introduced as a promising solution, allowing the flexible, simultaneous recognition of multiple acoustic sources within each recording segment [
18].
Recent reviews [
20] have highlighted additional challenges of traditional and early deep learning methods: they often assume isolated, clean audio inputs, lack the capacity to address multi-label or overlapping sources, and depend on centralized computing environments. The study addresses these issues by focusing on multi-label classification for real-world continuous audio data, processed on frame-level spectrograms with high noise and source diversity.
Recent advances have demonstrated the potential of deep learning-based multi-label classification across various domains. For example, Kim et al. [
21] developed the Text-CNN model for natural language processing, while Wei et al. [
22] introduced HCP (hypotheses CNN pooling) to solve multi-label image classification. In a different domain, Lin et al. [
23] applied BERT-based transfer learning to construct a multi-label classification system for social media data during natural disasters. These studies highlight the adaptability and accuracy of multi-label classification in scenarios with complex and interdependent label structures, such as forest soundscapes.
Despite the growing use of multi-label methods in other fields, applications in real-world forest ecoacoustics remain rare. This study represents the first implementation of a deep learning-based multi-label classification model for continuous forest soundscape recordings in Shennongjia and one of the few globally to compare such a model against traditional indices like the NDSI in a protected forest context.
Building upon these developments, this study proposes a deep learning-based multi-label classification framework for the intelligent extraction of acoustic information from long-term soundscape recordings in Shennongjia National Park, a forest-dominated region with rich biodiversity. By extracting biophony, geophony, and anthrophony from raw audio data, and refining model performance through tailored loss functions, this study demonstrates the model’s capacity to handle real-world forest soundscapes. To validate the method’s effectiveness, this study compare its classification outputs with those of the NDSI, exploring the advantages and limitations of both approaches in characterizing acoustic patterns in forest environments.
In summary, the contributions of this study include the following: (1) constructing a real-world, expert-annotated multi-label forest soundscape dataset from a protected area in China; (2) proposing a CNN-based classifier tailored for multi-source acoustic separation; (3) demonstrating that integrating this model with the NDSI enables a macro–micro framework for ecological monitoring.
The findings underscore the potential of AI-driven multi-label classification to improve biodiversity monitoring and soundscape interpretation in forest ecosystems, offering new pathways for scalable and intelligent ecological assessment.
2. Materials and Methods
2.1. Study Region
The study area is located within Shennongjia National Park, situated in the northwestern region of Hubei Province, China. The park spans approximately 3250 km2, with over 85% of its area covered by woodlands and a forest coverage rate of 69.5%. The dominant forest types include temperate broadleaf forests and evergreen–deciduous mixed forests, which provide essential habitats for a wide variety of terrestrial fauna.
Shennongjia features a highly heterogeneous mountainous landscape, with an average elevation of 1700 m and a peak elevation reaching 3105 m. The climate of Shennongjia lies in the transition zone between the northern subtropical and warm temperate regions. Due to the influence of mountainous terrain, the area exhibits pronounced vertical temperature zonation. Annual precipitation ranges from 800 mm to 2500 mm, generally increasing with elevation [
1].
Shennongjia National Park is recognized as one of the 14 key areas of international significance for biodiversity conservation and research and is a critical habitat for numerous nationally protected wildlife species such as the golden snub-nosed monkey (Rhinopithecus hubeiensis Tan & S). The area is also home to a diverse array of vocal fauna, including various bird species, mammals, amphibians, and invertebrates such as cicadas. The diversity and seasonal activity of these vocalizing species make the area particularly suitable for forest soundscape-based biodiversity monitoring.
In addition to its ecological significance, Shennongjia is a designated national scenic area, featuring major attractions such as Shennong Peak and Dajiu Lake. The park operates daily from 7:30 to 17:30, allowing visitors to explore its scenic landscapes via a network of highways that provide access to multiple points of interest. These factors contribute to temporal and spatial variations in anthrophony, particularly in areas with high tourist density, thereby creating a dynamic forest acoustic landscape that includes both natural and anthropogenic sound sources.
2.2. Acoustic Data Acquisition
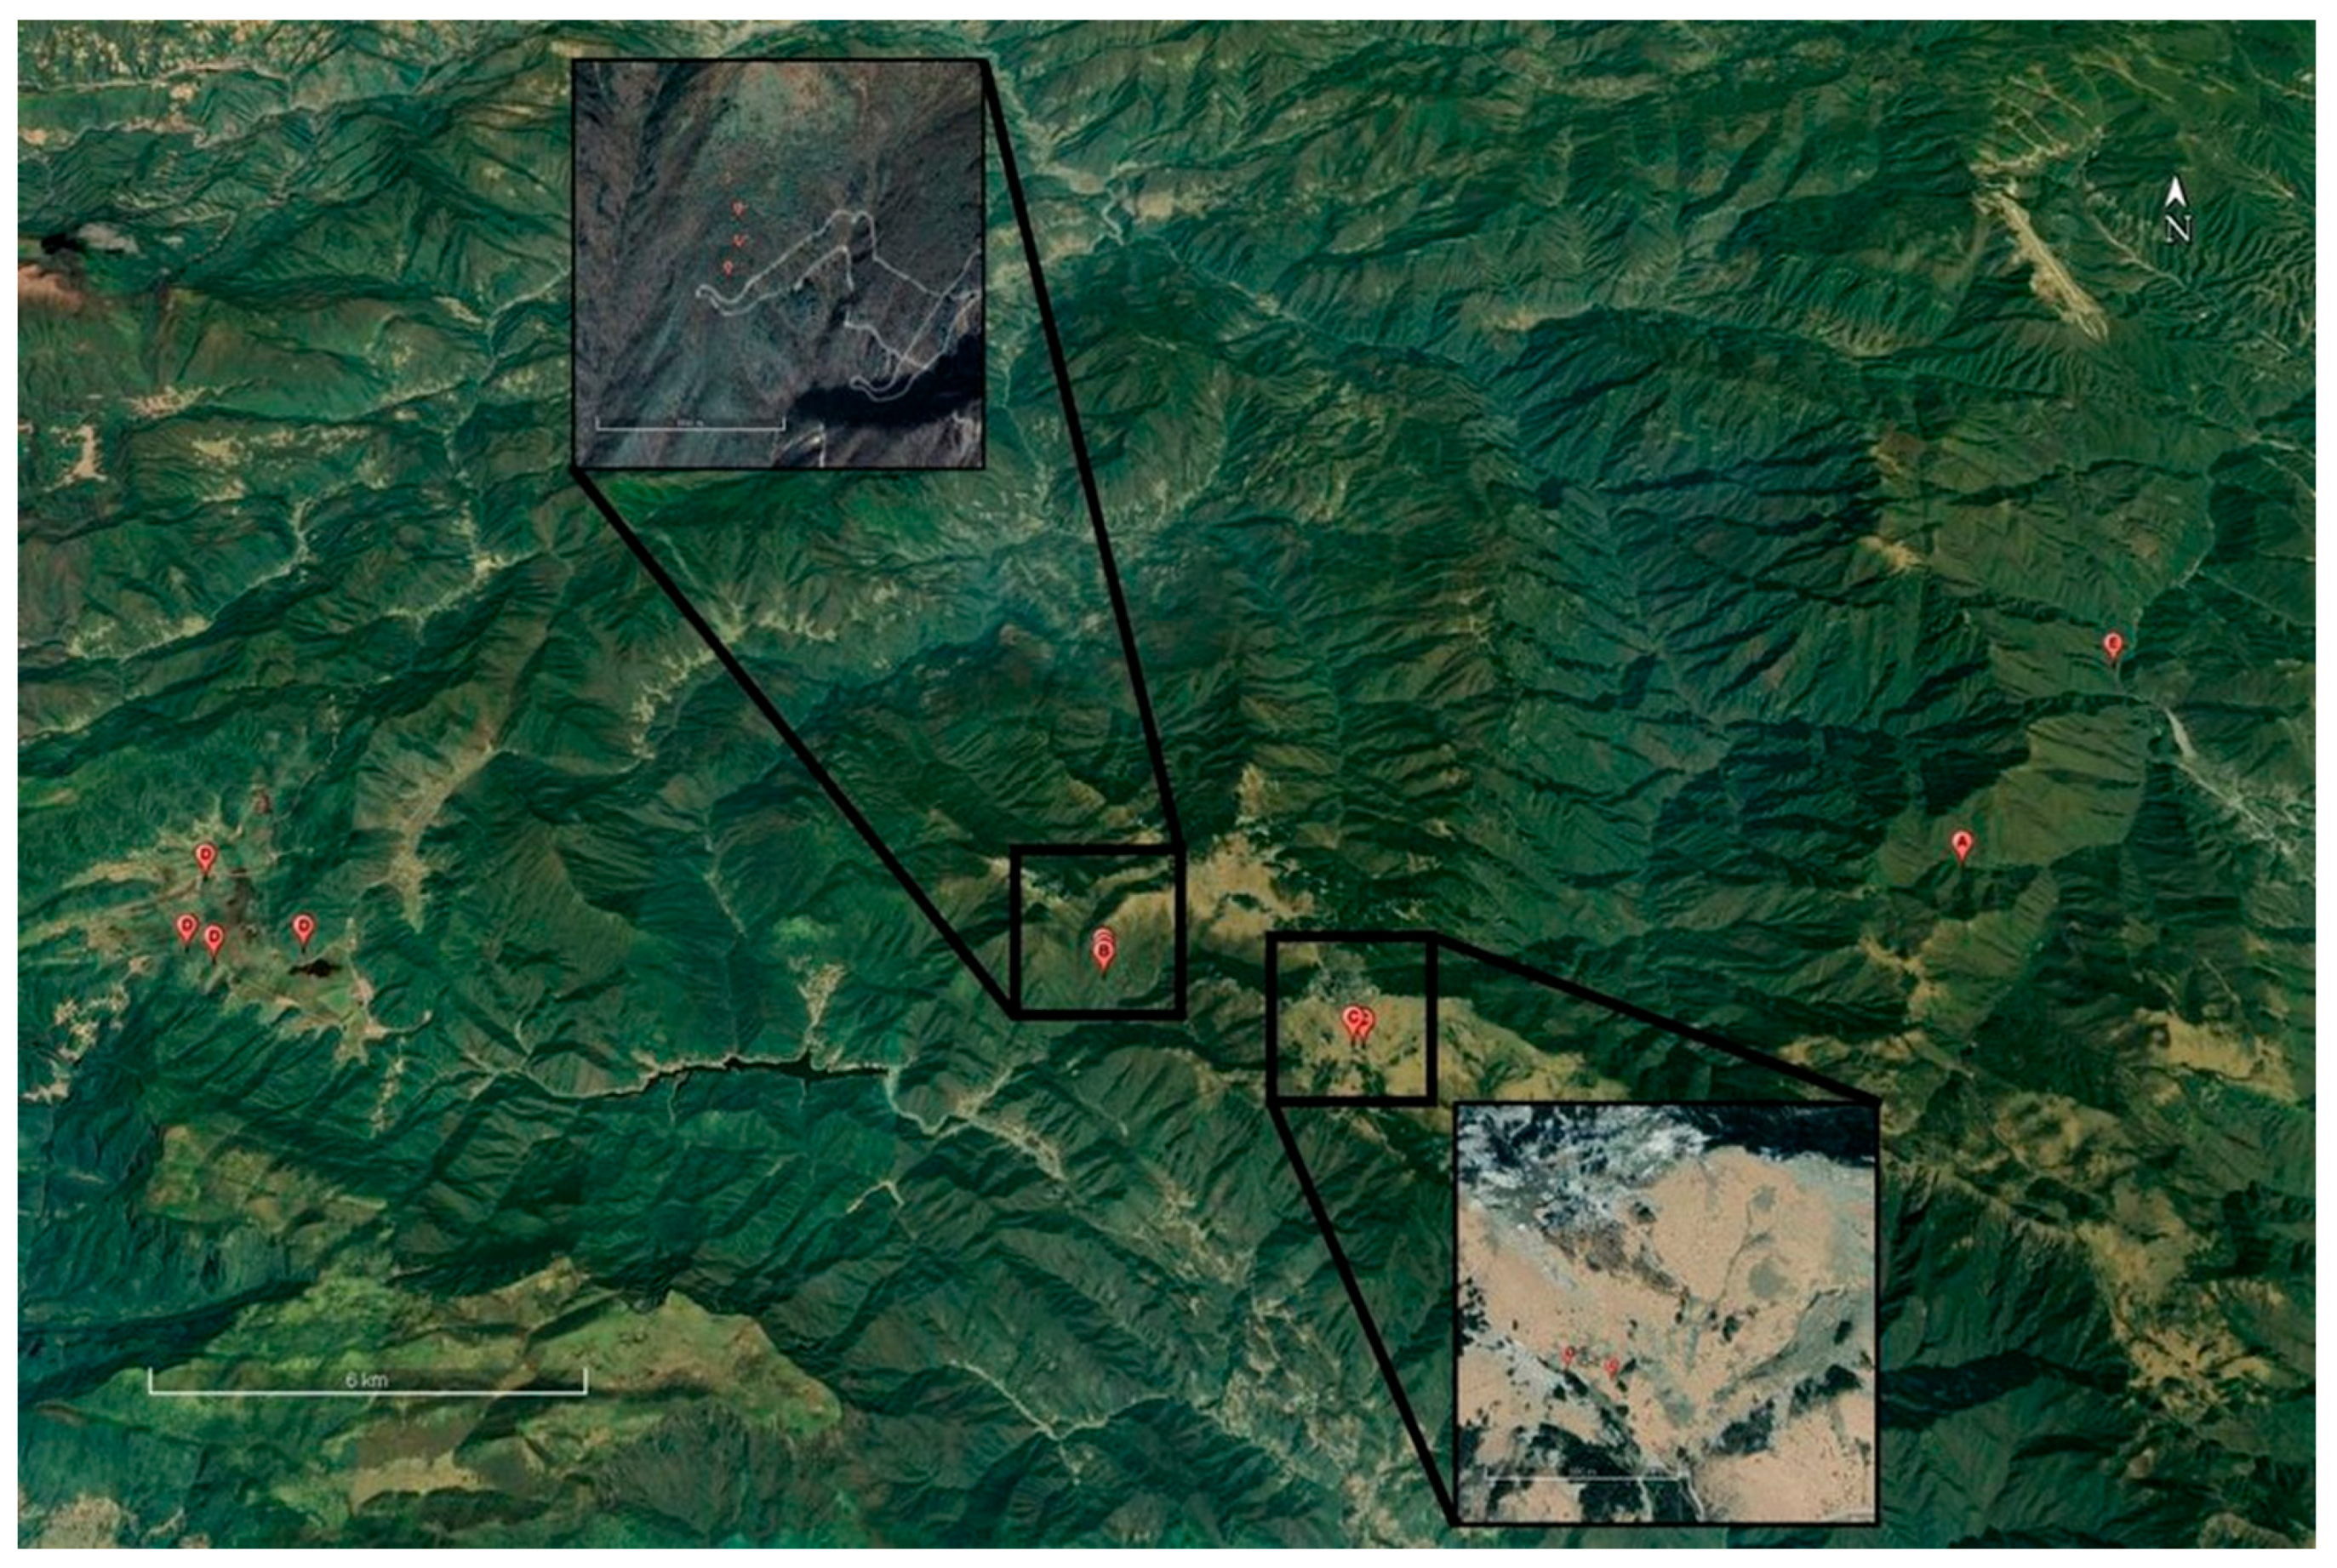
To capture representative acoustic diversity, this study deployed GPS-enabled acoustic recorders with data transmission functionality, which were independently developed by the research team, across five key ecological regions within the park (
Figure 1), covering areas with varying levels of elevation and vegetation. A total of 11 recorders were installed, with 1 to 4 recorders per region depending on terrain accessibility and ecological representativeness. The area of the recorders is delimited by the coordinates 31°27′30.74″ N 109°59′52.98″ E and 31°31′58.58″ N 110°20′13.06″ E. The elevation gradient covered by these sampling points was 1749 m~2704 m (
Table 1).
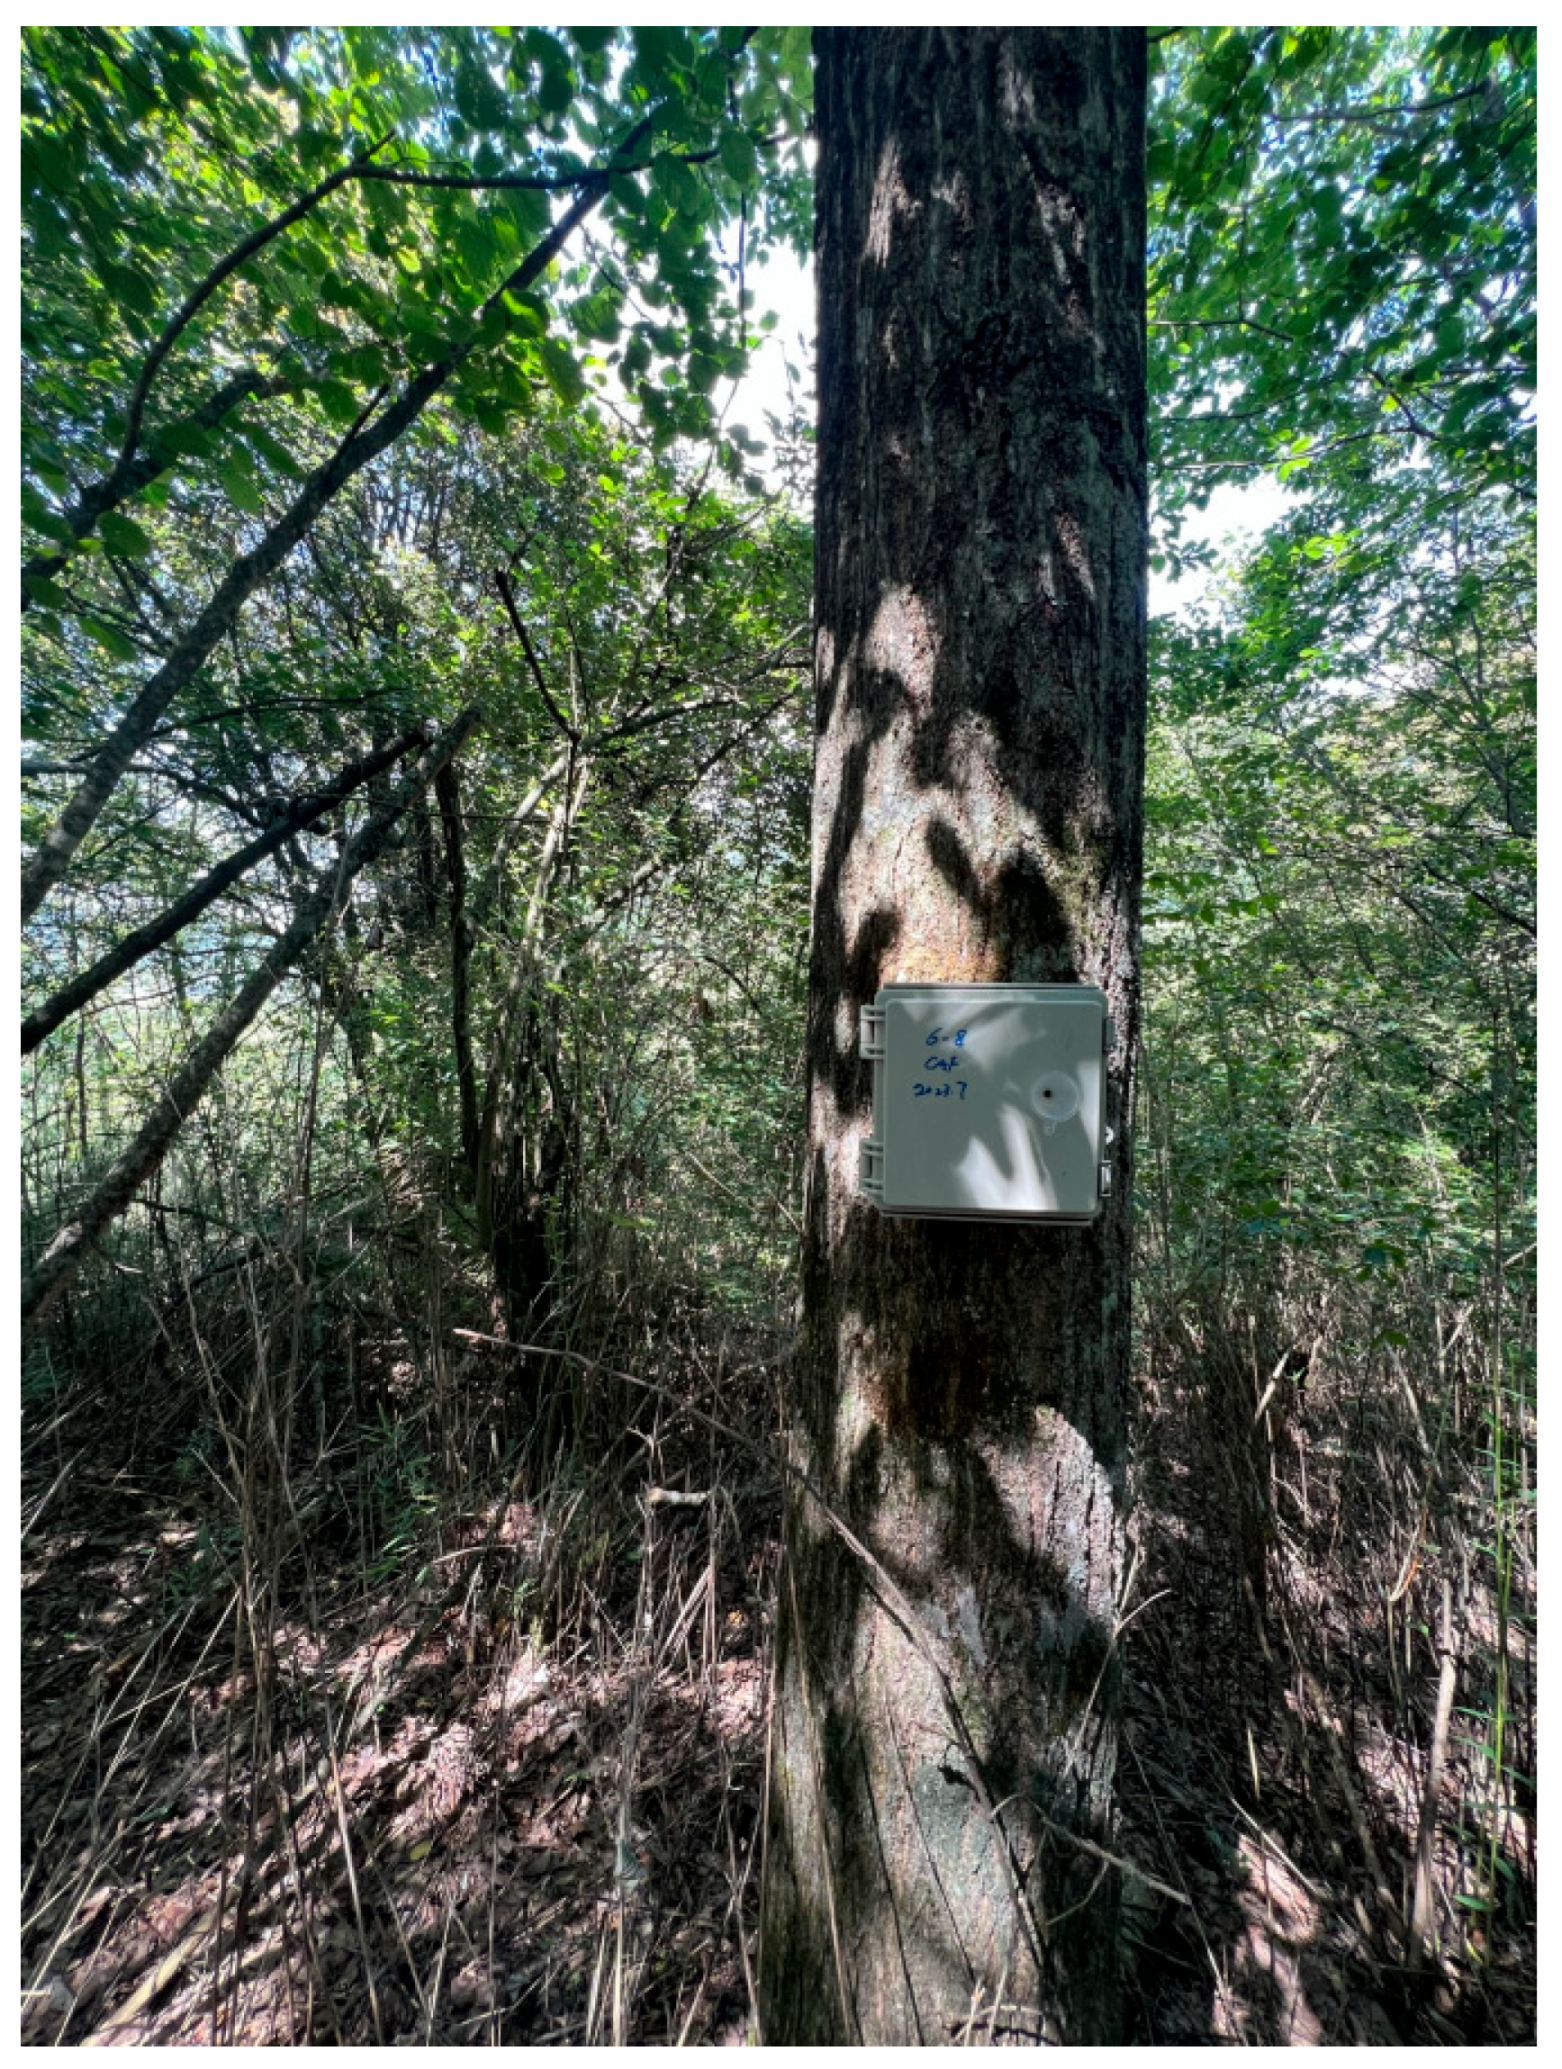
Each recorder was mounted on a tree trunk about 1.5 m above the ground (
Figure 2). This study programmed the recorders to operate continuously for 24 h daily and stored the sound data files once an hour. The audio signals were recorded at a sampling rate of 24 kHz and a resolution of 16 bits in the WAV format. The recording campaign lasted from July 2023 to April 2024, resulting in over 2000 h of field audio data. This dense temporal and spatial sampling design ensured coverage of multiple seasons, daily cycles, and both high-traffic and remote forest zones. The spatial layout of these sampling points ensured the representation of both core forest areas and regions with varying degrees of human activity and forest structure, supporting robust analysis of biophony, geophony, and anthrophony within the forest ecosystem.
2.3. Dataset Construction
In this study, a multi-label soundscape dataset was constructed for Shennongjia based on the collected audio data. This dataset was used to train and evaluate the proposed multi-label classification model.
Given the extensive temporal and spatial coverage of the collected audio data, an initial screening process was necessary. For each sampling location, this study selected high-quality audio segments, prioritizing those recorded during periods of active biological activity. This ensured a more representative and informative dataset for soundscape analysis.
After consulting multiple studies on environmental sound classification and conducting preliminary tests, 5 s segments were selected as the optimal clip duration. This length is sufficient to capture distinguishable acoustic features for labeling, while shorter durations (e.g., 1–3 s) often failed to contain enough information for reliable classification, and longer clips (e.g., 10 s) reduced the number of training samples and introduced label ambiguity due to mixed acoustic events.
All selected audio was segmented into 5 s clips using Python-based preprocessing pipelines and augmented with techniques such as pitch shifting, time stretching, and Gaussian noise injection to improve model robustness.
Subsequently, a total of 639 manually labeled audio samples were generated for supervised learning. All annotations were performed by a single trained researcher to ensure maximum consistency. Each clip was reviewed using both spectrograms and headphones in Adobe Audition 2019. Labels were assigned based on audible signals and spectral features.
The annotated dataset comprises three primary sound categories: biophony, geophony, and anthrophony. Biophony includes sounds produced by birds, mammals, and insects. Geophony consists of natural sounds such as wind and rain. Anthrophony encompasses human speech, vehicle noise, mechanical sounds, and footsteps. Each audio clip was assigned one or more labels, resulting in a multi-label dataset that captures the inherent complexity and diversity of the forest soundscape. To further ensure labeling accuracy and reliability, ambiguous samples were reviewed multiple times by the annotator, and uncertain cases were compared against spectrogram characteristics and publicly available reference audio samples. All annotations were completed under the supervision of an expert in ecoacoustics to ensure consistency with established sound category definitions. This process resulted in the creation of the Shennongjia Multi-Label Soundscape (SNJ-MLS) dataset (
Table 2).
To ensure a diverse and complex dataset, this study intentionally selected samples containing multiple sound labels. The distribution of label occurrences across the dataset is presented in
Table 3. This approach enhances the dataset’s applicability for training multi-label classification models, capturing the intricate acoustic compositions of the Shennongjia soundscape.
In this study, the SNJ-MLS dataset was divided into the training set and the testing set. To train the models, 90% of the dataset was randomly selected as the training set, while the remaining 10% was designated as the first test set TRD (Testing Random Dataset) for performance evaluation.
Furthermore, to validate the generalization capability of the proposed model in real-world field conditions, this study randomly selected approximately one hour of continuous raw audio from unlabeled data. The audio was segmented into 5 s clips, resulting in a set of 120 short audio segments. This dataset, referred to as the second test set TCS (Testing CutSound Dataset), closely reflects the composition of actual environmental soundscapes. It was used to assess the model’s practicality and robustness in scenarios without prior audio preprocessing.
2.4. Multi-Label Classification Model
For multi-label classification, a CNN model was developed specifically designed for multi-label soundscape classification (
Figure 3). This Classifier model consists of two core components: a Convolutional Feature Extraction Module (CM) and a Fully Connected Classification Module (FC), optimized for the time-frequency characteristics of acoustic signals (e.g., Mel spectrograms). The specific model parameters are shown in
Table 4.
The model features the following design improvements:
Hierarchical Feature Extraction: Stacked convolutional layers (Conv2d) and max-pooling layers (MaxPool2d) progressively capture both local and global soundscape features. Batch normalization (BatchNorm2d) and ReLU activation functions are applied after each convolution to accelerate convergence and mitigate gradient vanishing issues.
Adaptive Global Pooling: Instead of conventional fully connected layers, adaptive average pooling (AdaptiveAvgPool2d) compresses high-dimensional features into a fixed size (512 × 1 × 1), reducing parameter complexity and improving robustness to time-frequency variations in soundscape signals.
Multi-Label Classification: The classification module includes three fully connected layers (512 → 256 → 128 → 9) and a Sigmoid activation layer to predict the presence probabilities of nine predefined sound labels. These correspond to three biophonic (birds, mammals, insects), two geophonic (wind, rain), and four anthropophonic (speech, vehicle, mechanical, footsteps) components.
This model provides significant advantages in terms of parameter efficiency and computational cost, making it particularly suitable for analyzing forest soundscapes in national parks, where long-tail distributions and low signal-to-noise ratios are common challenges.
The ResNet model, proposed by Kaiming He, Xiangyu Zhang, Shaoqing Ren, and Jian Sun at Microsoft Research in 2015 [
24], is a deep convolutional neural network architecture based on residual learning. It has been widely applied in image classification, object detection, semantic segmentation, medical imaging analysis, and natural language processing. Its core innovation lies in the introduction of residual blocks and skip connections, which effectively mitigate gradient vanishing and model degradation issues in deep networks, allowing the architecture to scale to thousands of layers.
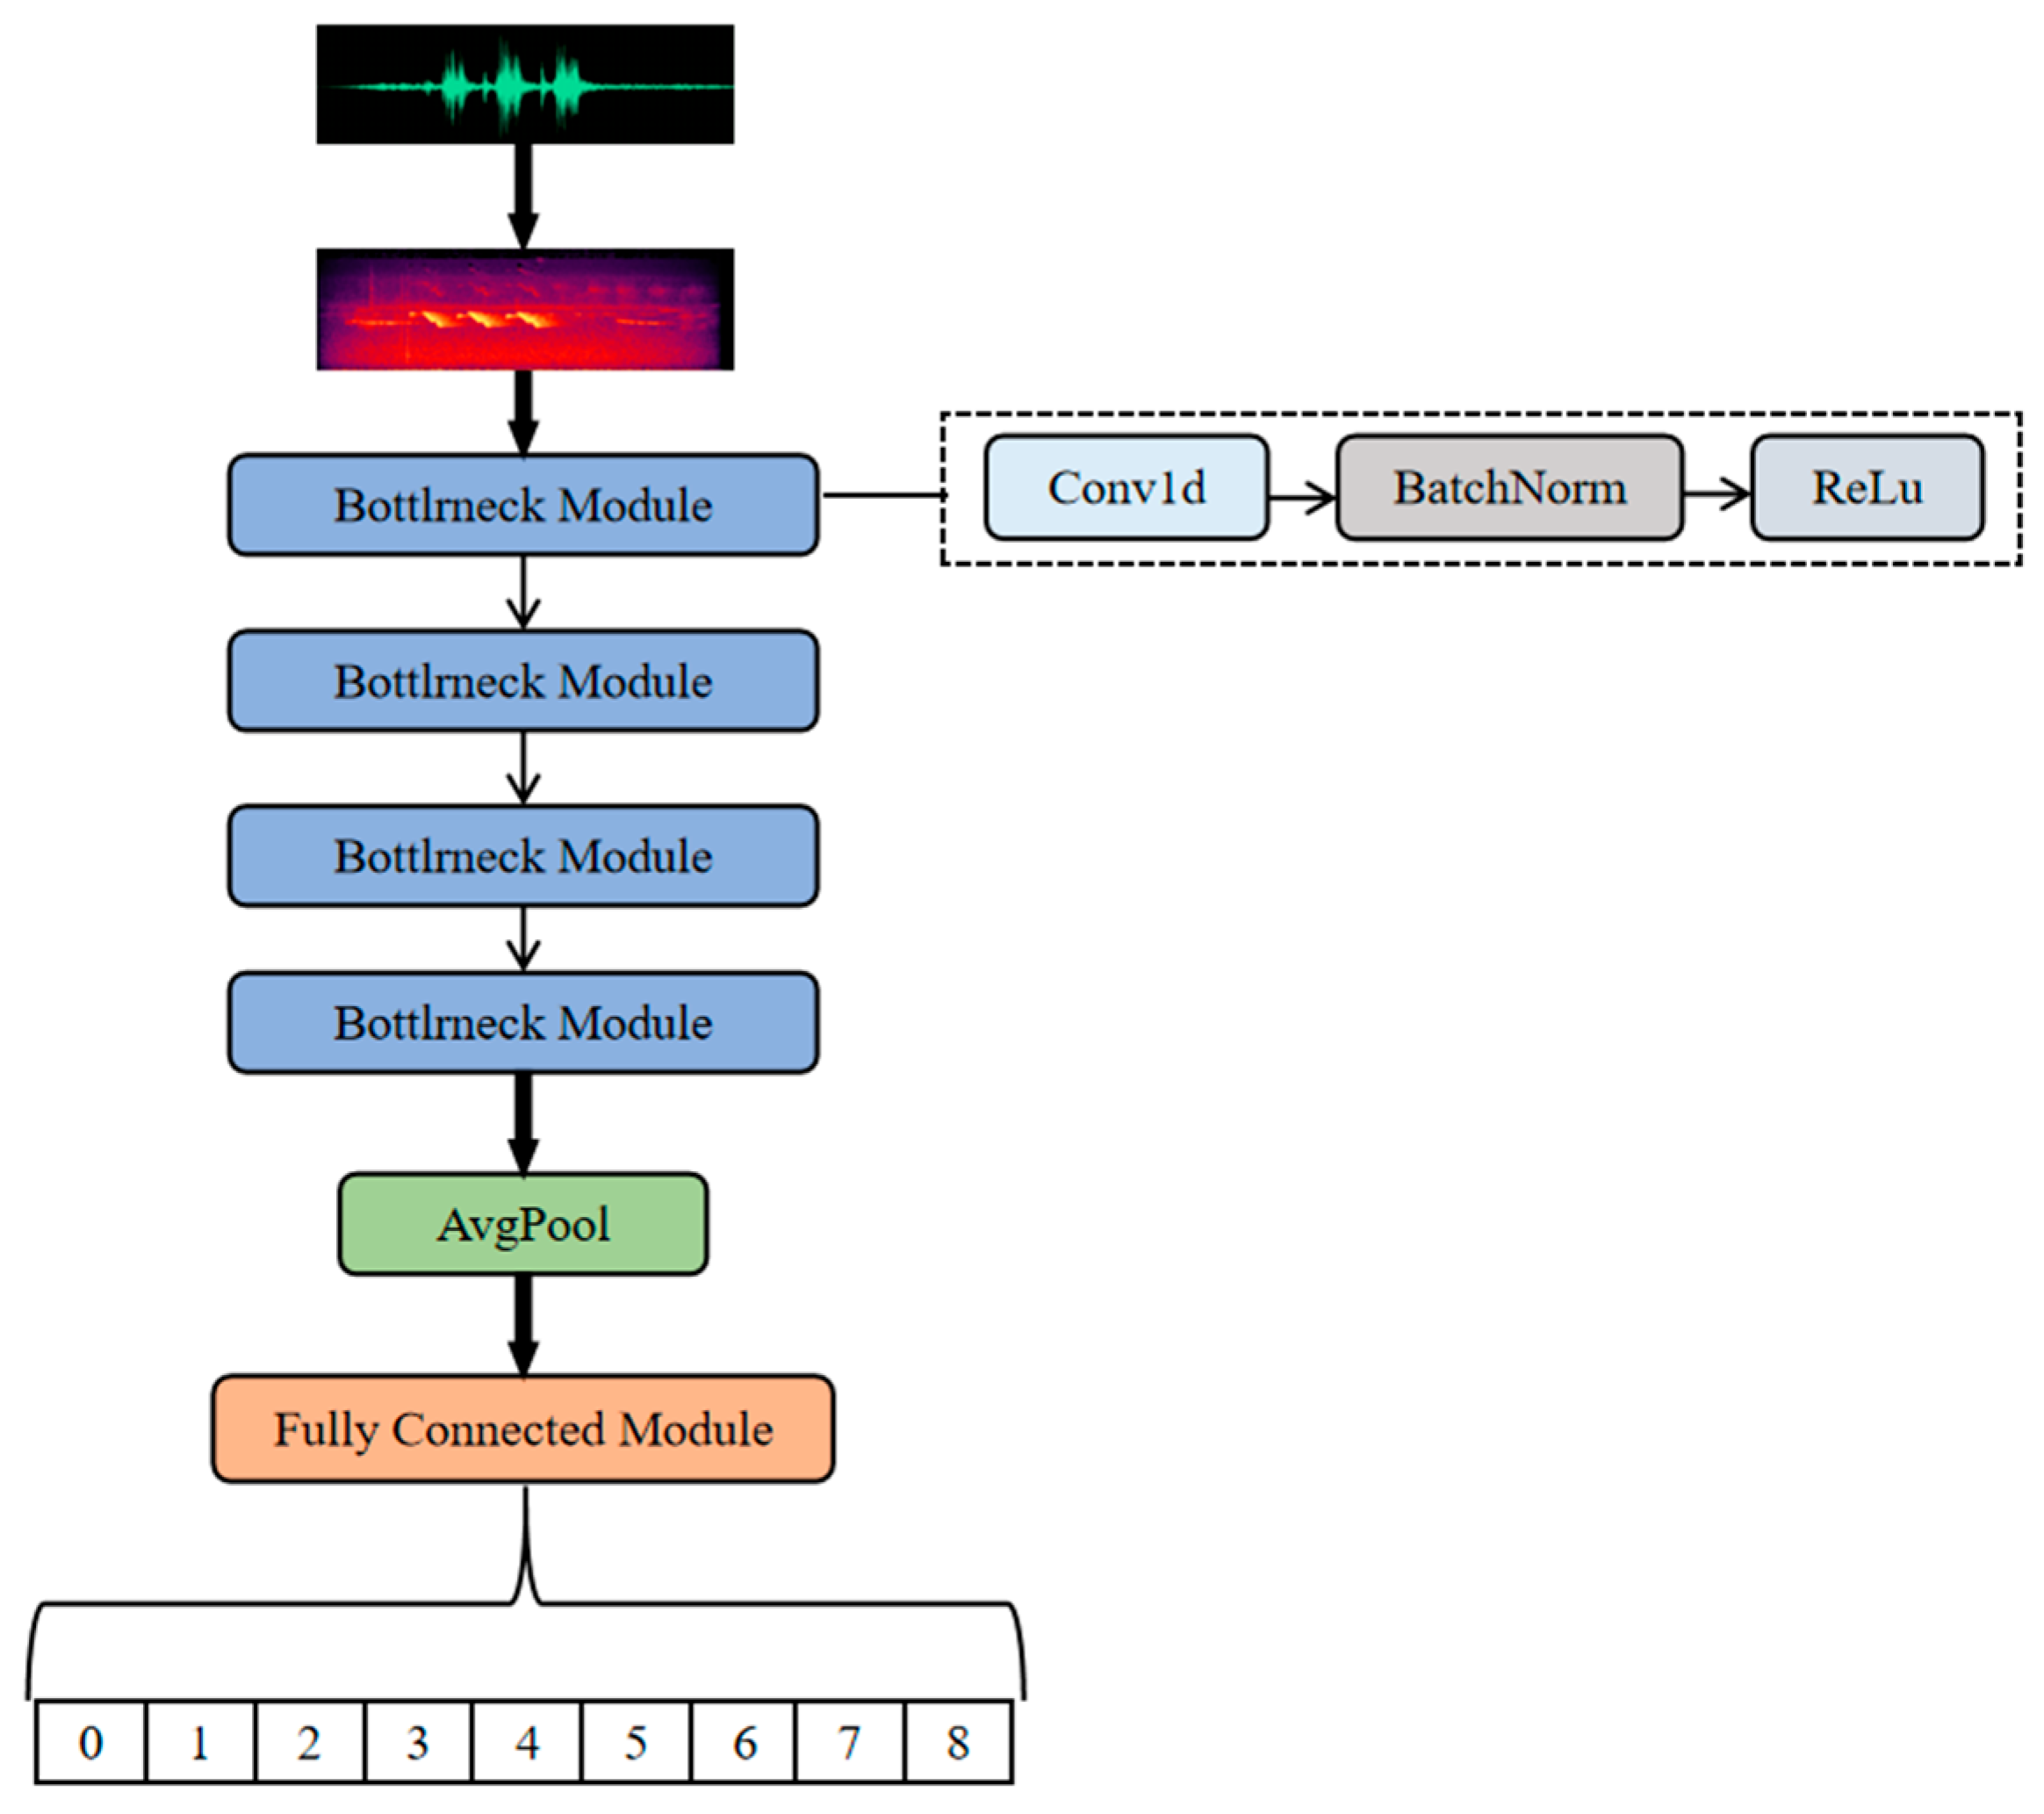
This study used ResNet for comparison with the designed convolutional neural network Classifier. To adapt the acoustic data features and achieve multi-label classification, an improved ResNet-based model (
Figure 4) was constructed. This model adapts acoustic features using residual connections (Bottleneck Blocks) and one-dimensional convolutions (Conv1d), with key enhancements as follows:
Residual Feature Fusion: A three-stage Bottleneck structure (1 × 1 → 3 × 3 → 1 × 1 convolutions) is employed, with shortcut connections alleviating deep network degradation and enhancing feature reuse.
Time-Frequency Feature Adaptation: The input spectrogram is converted into a temporal sequence using the Permute operation. One-dimensional convolutions extract cross-channel time-frequency dependencies, while adaptive pooling (AdaptiveAvgPool1d) compresses feature dimensions.
Classifier Design: The final fully connected (Linear) layer directly maps features to the label space, using a Sigmoid activation function to output multi-label probabilities.
Although the ResNet model offers advantages in theoretical depth, its adaptation to high-dimensional temporal features in soundscape data is limited, as transformations between feature dimensions may introduce information loss.
2.5. NDSI
The NDSI [
25] is a metric used to assess the relative dominance of anthropogenic and biotic sounds within a soundscape. It provides a broad indicator of the balance between human-generated noise and biological acoustic activity. The index ranges from −1 to 1, where higher values indicate a predominance of biological sounds, while lower values suggest a dominance of anthropogenic noise. Previous studies [
16] have demonstrated that the NDSI correlates well with bird diversity in this area of Shennongjia and can reflect local soundscape changes. Therefore, the NDSI was introduced to compare the results of soundscape classification with the multi-label model.
Anthropogenic sounds are usually between 1 and 2 kHz, whereas biotic sounds are more often distributed from 2 to 8 kHz. Based on this criterion, the study defined 1–2 kHz as the anthropogenic sound band and 2–8 kHz as the biotic sound band for the computation of the NDSI. The index is calculated as follows:
where
represents the total estimated power spectral density (PSD) within the largest 1 kHz biophony bin, and
α denotes the total estimated PSD within the anthrophony bin [
21].
3. Results
3.1. Experimental Setup and Evaluation Indicators
3.1.1. Experimental Setup
In this study, the experimental environment and parameter configurations were as follows.
The hardware platform utilized an NVIDIA GPU with CUDA acceleration for model training and inference. The software environment was based on Python 3.12.7, with PyTorch 2.4.1 serving as the core deep learning framework.
During training, a batch size of 32 was used, and the binary cross-entropy loss (BCELoss) function was employed to handle multi-label classification tasks. The Classifier used a threshold of 0.5 to convert predicted probabilities into binary labels. The Adam optimizer was selected due to its efficiency in handling sparse gradients, with an initial learning rate set to 0.001. The model was trained for 50 epochs without the use of dropout layers; instead, regularization was achieved through data augmentation strategies.
To enhance model generalization, the training set was dynamically augmented using the audiomentations library. Specifically, three augmentation techniques were applied with a probability of 0.5 each: AddGaussianNoise (amplitude range 0.001 to 0.015), PitchShift (range −4 to +4 semitones), and TimeStretch (rate range 0.8 to 1.2). These methods simulate natural acoustic variability, such as environmental noise, vocal variation, or temporal distortion in forest recordings. These augmentations were applied only to the training set to preserve the reliability and consistency of evaluation results.
To transform audio signals into model input features, Mel spectrograms were computed for each 5 s audio clip. The transformation used the following fixed parameters: 256 Mel frequency bands, a frame length of 1024 samples, a hop length of 512 samples, FFT size of 1024, and log-scaled amplitude in decibels. All spectrograms were normalized to a [0,1] range to ensure stable convergence during training.
3.1.2. Evaluation Indicator
The overall performance of the model was assessed using macro-averaged precision, recall, and F1-score, which provided a global evaluation by considering all labels collectively. The formulas are as follows [
26]:
where
(True Positives) denotes the number of correctly classified positive samples of the
-th class, and
(False Positives) represents the number of negative samples of the
-th class misclassified as positive [
27].
where
(False Negatives) represents the number of positive samples of the
-th class incorrectly classified as negative [
27].
This metric is particularly robust in scenarios with imbalanced class distributions [
27].
where
(True Negatives) refers to the number of correctly classified negative samples of the
-th class [
27].
For each class i, the following metrics were computed independently:
These metrics provided a detailed understanding of the Classifier’s capability across ecologically meaningful acoustic categories, especially biophonic signals that are critical for biodiversity monitoring.
3.2. Multi-Label Classification Results
To evaluate the performance of the proposed multi-label classification model in identifying diverse acoustic components within forest soundscapes, this study conducted a comparative analysis between the baseline ResNet model and the customized Classifier model. The evaluation was carried out on two distinct test datasets, TRD (63 samples) and TCS (120 samples), as summarized in
Table 5.
Across both datasets, the Classifier model consistently outperformed the ResNet baseline. On the TRD dataset, the Classifier achieved a macro-accuracy of 92.59%, surpassing ResNet by 2.64%. Similarly, the macro-F1-score reached 0.8421, representing a 5.72% improvement over ResNet (0.7849). Notably, the Classifier model maintained high performance on the TCS dataset, which was constructed from continuous raw audio without prior preprocessing, indicating its robustness in real-world forest acoustic environments.
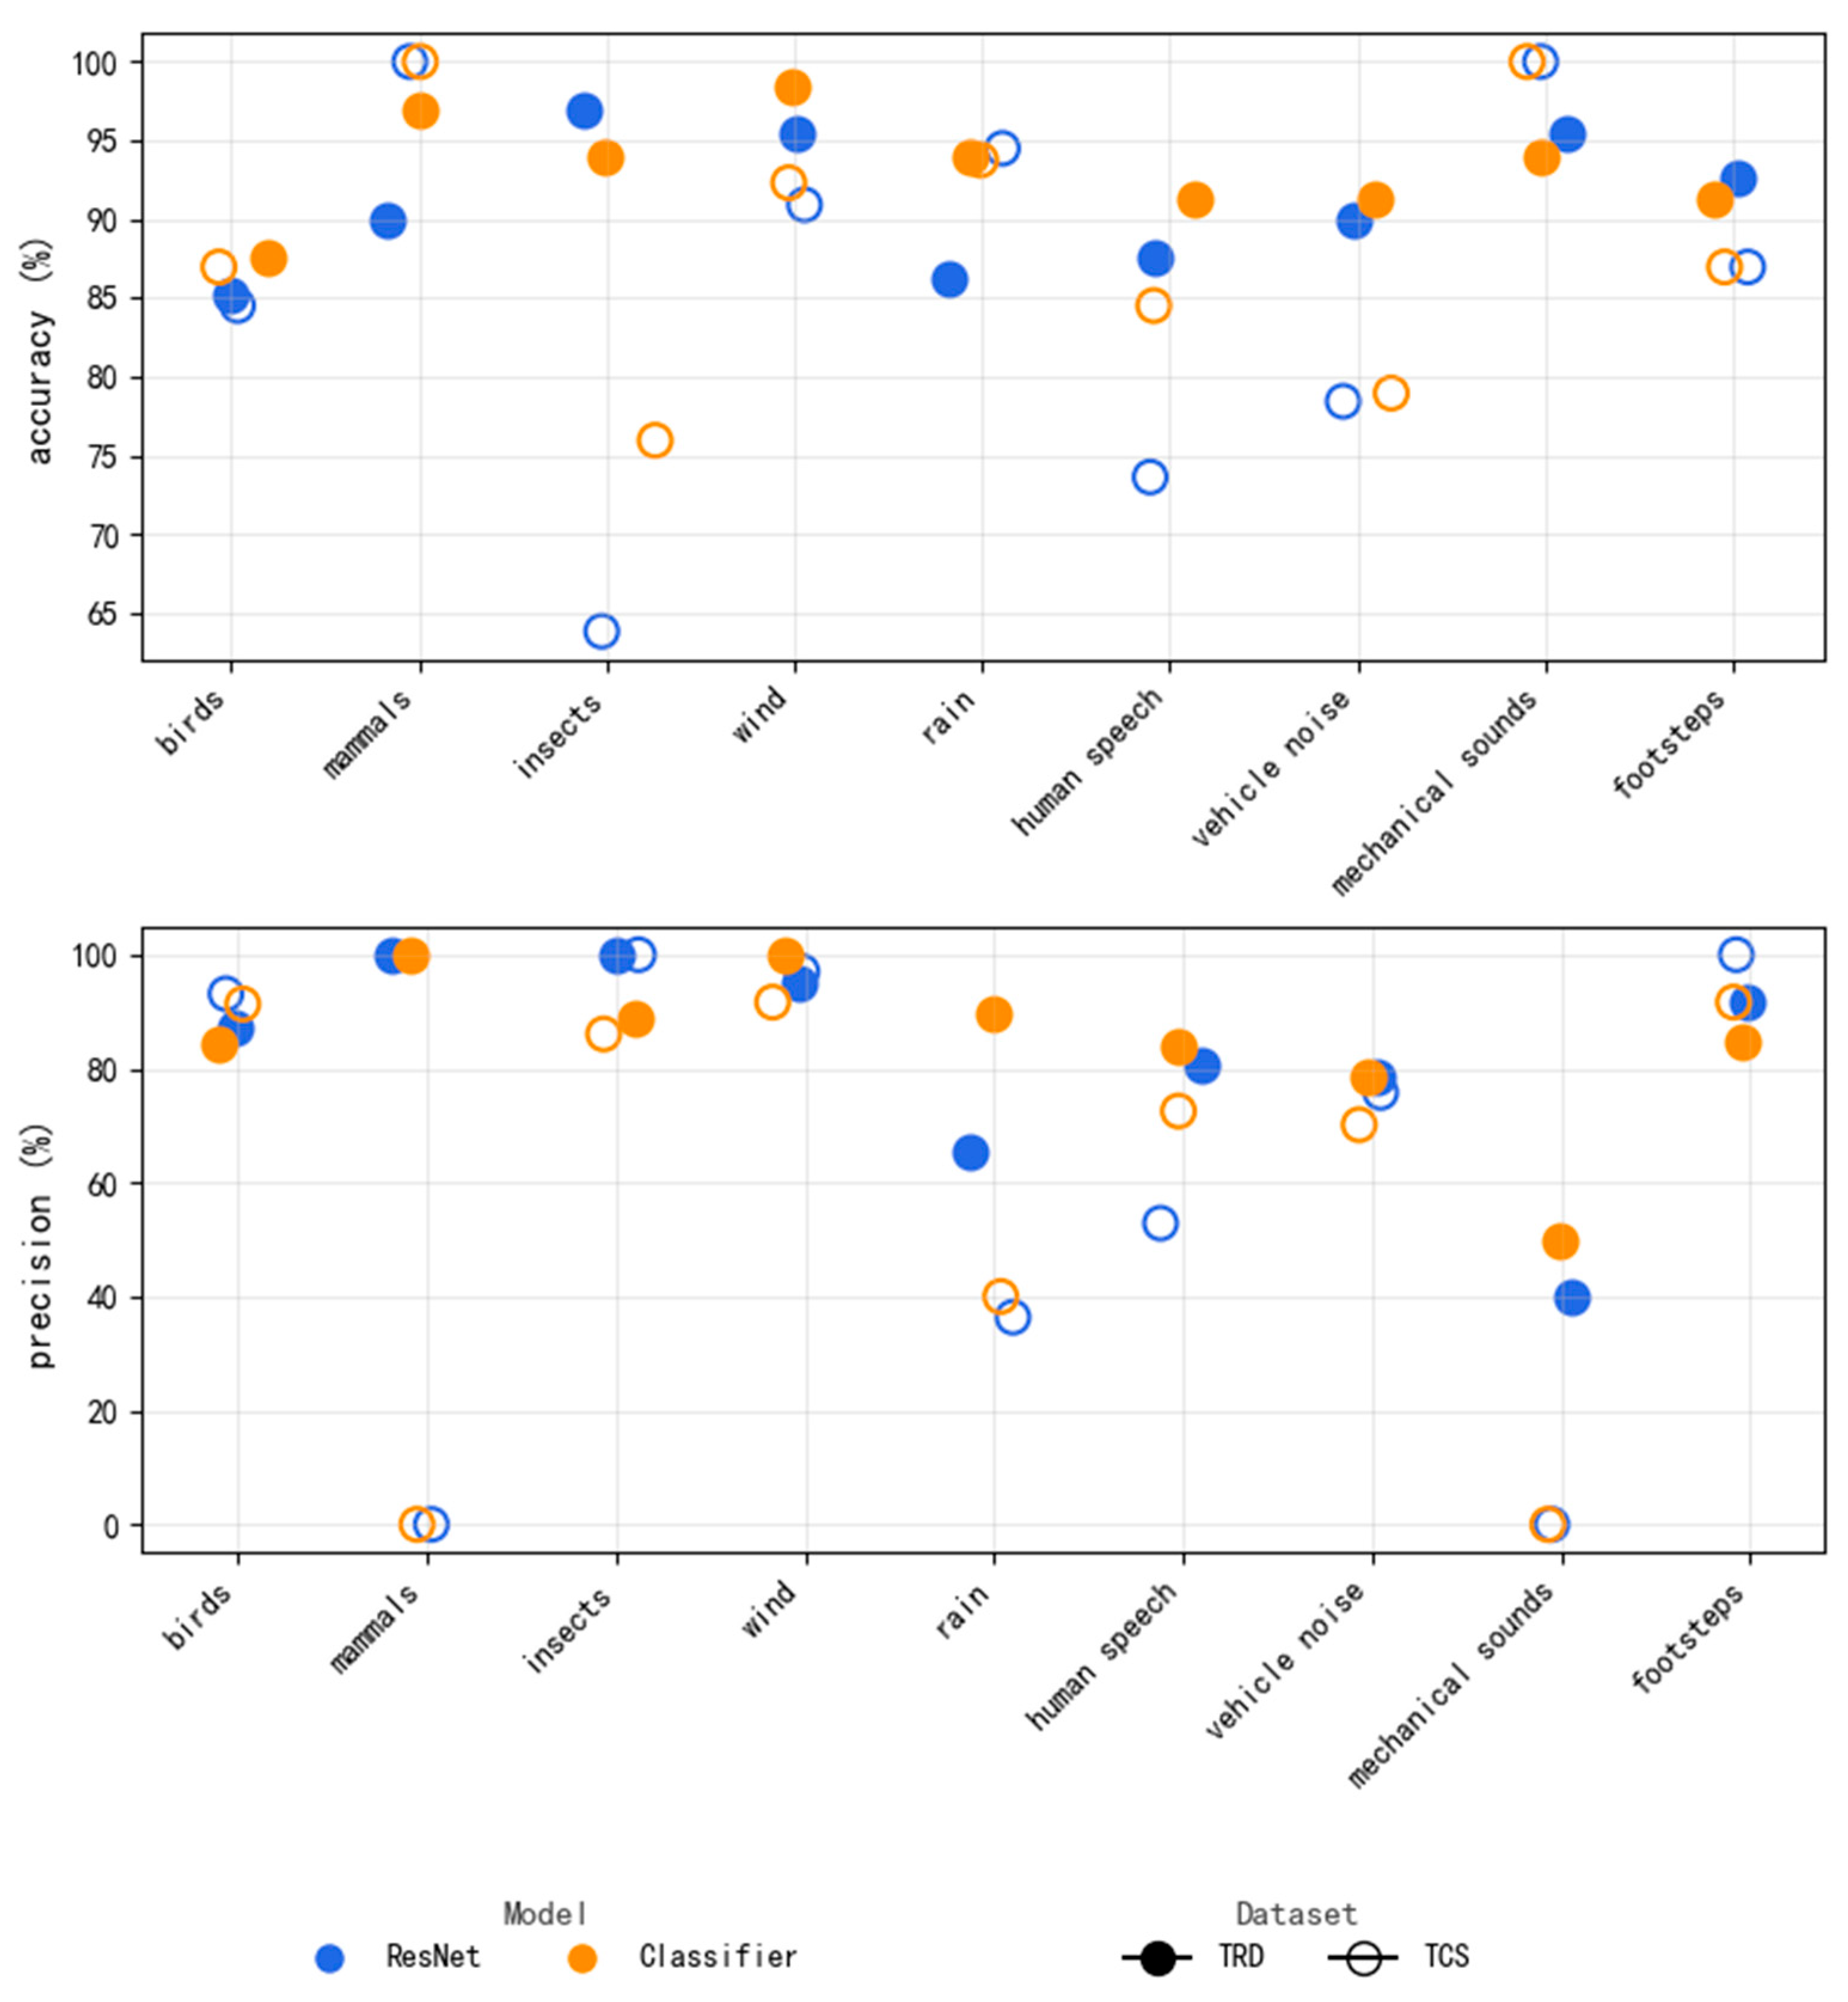
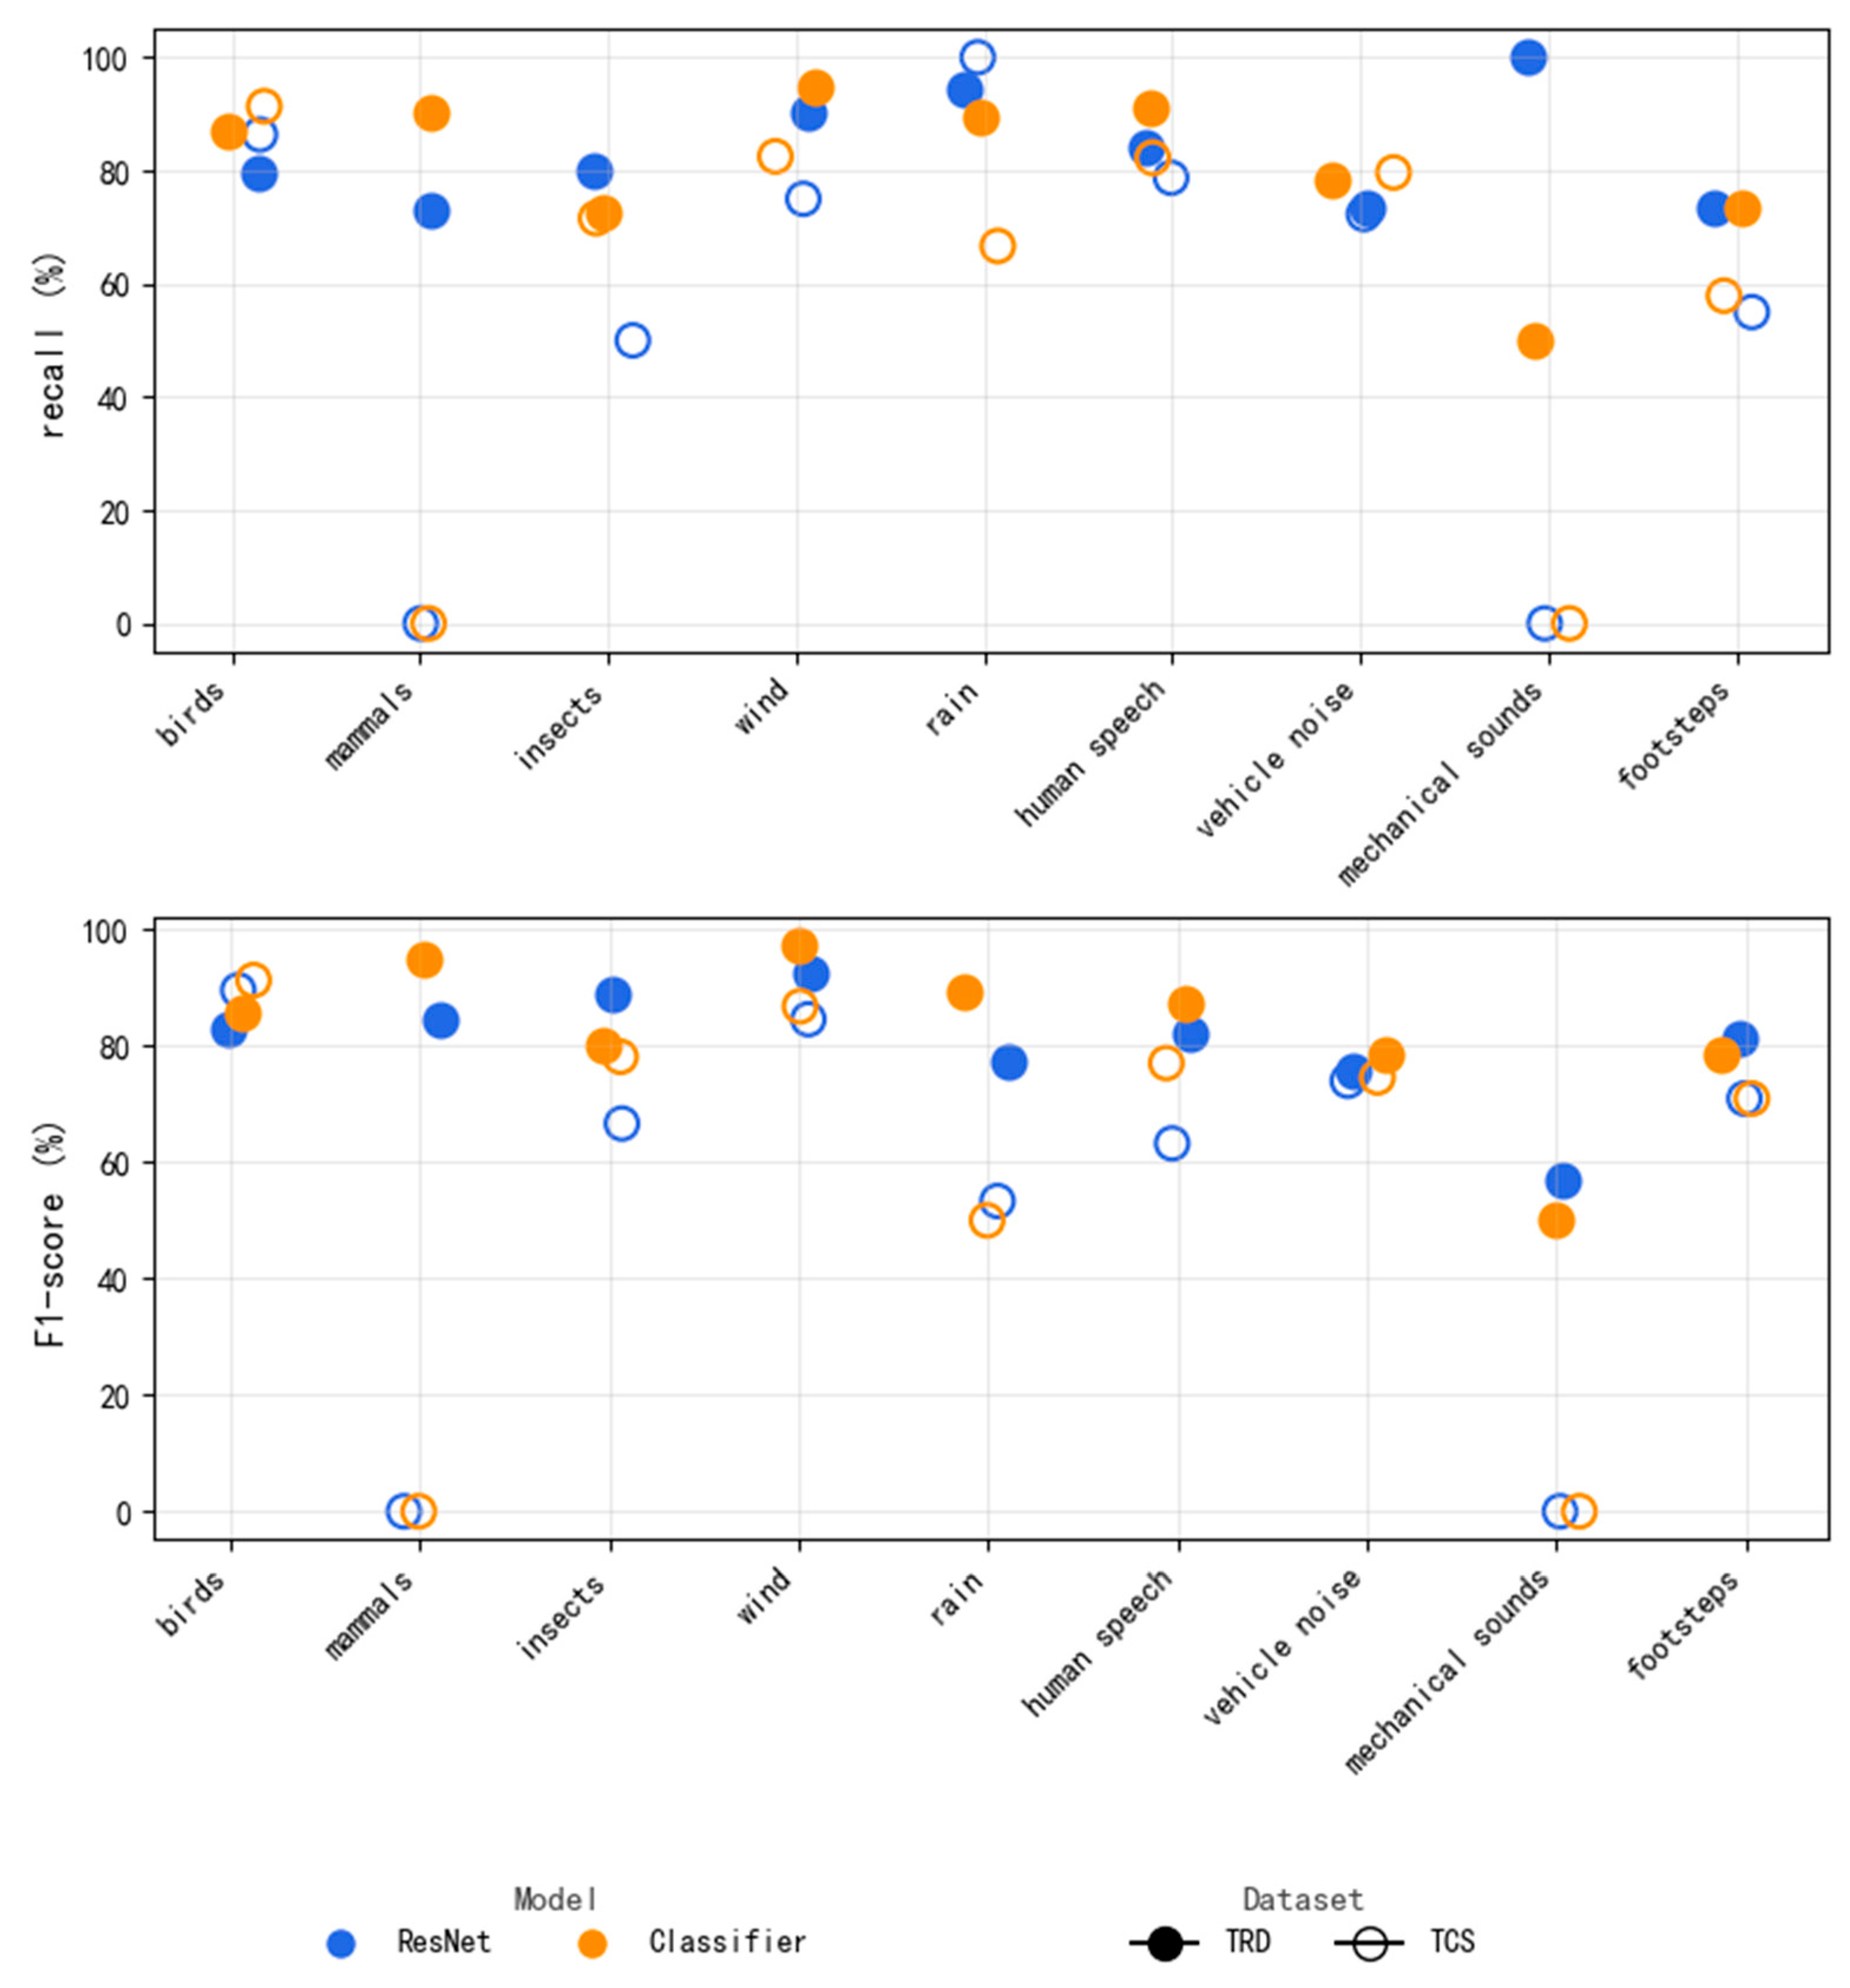
To further validate the model’s adaptability to multi-label classification of forest soundscapes, this study conducted fine-grained comparative experiments across three key application areas: bioacoustics, climate monitoring, and anthropogenic disturbance detection. As is shown in
Figure 5 and
Figure 6, the proposed Classifier model demonstrated significant superiority over the ResNet baseline in all critical acoustic categories.
Bioacoustics Classification: The Classifier model exhibited strong discriminative ability for biologically generated sounds in natural forest environments. For bird sound detection, its accuracy improved by 2.4% over ResNet in noisy background conditions. For insect identification, the recall rate increased by 25% on TCS.
Climate Monitoring: The integration of temporal feature fusion enhanced classification reliability in wind–rain mixed scenarios. The F1-scores for wind and rain categories improved by 2.3% and 11.4%, respectively, compared to ResNet.
Anthropogenic Disturbance Detection: For human-related disturbances, such as footsteps and mechanical noise, Classifier showed enhanced feature discrimination, especially when assisted by spectral enhancement. The recall rate for footsteps increased by 2.8%, and mechanical noise recognition precision improved by 10.0%, indicating strong potential for forest management and human impact monitoring.
In addition, although the model was trained on a predefined label set, its architecture generalizes well to unseen combinations of sound sources, thanks to its frame-level input design and augmentation strategy. Future research may extend this by incorporating open-set recognition mechanisms.
In summary, the proposed Classifier model significantly advances multi-label sound classification for forest soundscapes. Its superior performance across multiple acoustic domains offers a reliable tool for ecological research and forest soundscape monitoring.
3.3. Differential Analysis of Soundscape in Shennongjia National Park
To explore the practical application of the classification model in environmental soundscape composition analysis, the experiment compared its results with those from the NDSI, a widely used acoustic index. This comparative approach allowed for a better understanding of the advantages and limitations of both methods in describing forest acoustic dynamics.
As is shown in
Table 1, Taizi Bealock is located approximately at 31°28′ N, 110°9′ E, with an average elevation of around 2100 m. The area is dominated by broadleaf forests, making it an active habitat for various bird species. A roadway runs nearby, contributing to occasional anthropogenic noise, particularly during daytime hours.
Therefore, this study selected the third monitoring site at Taizi Bealock and analyzed continuous audio data collected over a full week, from 16 July to 22 July 2023. The dataset consists of 168 one-hour-long audio recordings. After applying spectral subtraction for noise reduction, the experiment extracted NDSI values at 10 min intervals, using 2 min segments for each calculation. The resulting weekly NDSI values were visualized in a heatmap (
Figure 7). Most values remained below 0, confirming anthropogenic sounds (1–2 kHz frequency range) as the primary component. The majority of NDSI values fell between −0.6 and −0.2 (blue regions), with only 5.1% of the time exceeding 0, mostly concentrated in brief windows at dawn and dusk. This indicates that biophonic signals (2–8 kHz frequency range) were consistently masked by anthropogenic noise, with only sporadic occurrences.
Examining the dark blue regions in the heatmap, this study observes that the NDSI had the lowest values (−0.6) during midday (11:00–14:00), indicating a peak in anthropogenic noise, coinciding with peak industrial activity and traffic. Conversely, the light blue and red regions suggest that biophonic activity peaked during the dawn period (05:00–06:30), likely linked to morning bird choruses. During the evening and nighttime, the NDSI values gradually recovered to approximately −0.3, potentially reflecting a decrease in human activity, allowing insect calls and other biological sounds to re-emerge. However, the presence of isolated anomalous values suggests potential interference from natural sounds such as wind, which cannot be identified solely through NDSI analysis.
The study concurrently applied the multi-label deep learning model (Classifier) to the same dataset, categorizing sound sources into three major types: biophony, anthrophony, and geophony. The one-hour recordings were segmented into 5 s clips, yielding a total of 24,193 labeled audio segments. The classification results, as summarized in
Table 6 and
Figure 8, indicate that birdsong (54.10%), insect calls (53.74%), and vehicle noise (51.52%) were present in more than half of the analyzed segments, suggesting their dominant role in shaping the local soundscape. The pervasive presence of anthropogenic noise aligns with the NDSI analysis.
Interestingly, the multi-label results suggest that biological sounds were consistently present throughout the day, contradicting the implication from the NDSI that anthropogenic sounds dominated the forest soundscape. Additionally, geophonic sounds such as wind and rain were identified in approximately one-quarter of the audio segments, suggesting frequent weather-related disturbances at the site.
This contrast demonstrates the enhanced granularity of the Classifier, which avoids the broad-band assumption in the NDSI and recognizes overlapping sounds at the event level. For instance, low-SNR biophony masked by rain was still detectable via the model, while the NDSI grouped such activity under anthropophony.
These results reinforce the complementary nature of both methods. While the NDSI excels in trend-based rapid assessments, the proposed AI model delivers source-level resolution, which is vital for ecological interpretation and adaptive forest management.
4. Discussion
This study employed a deep learning-based multi-label classification approach to extract and quantify biophony, geophony, and anthrophony from long-term field recordings characterized by complex forest soundscapes. This method achieved second-level temporal resolution in source recognition and maintained robust performance across diverse forest acoustic conditions. In addition to distinguishing between different types of biophony (e.g., birds and insects), the model effectively quantified the temporal dynamics of geophony (e.g., wind and rain) and anthrophony (e.g., traffic and mechanical noise), providing refined insights into soundscape monitoring.
By integrating deep learning with ecoacoustic monitoring, this study overcomes the limitations of traditional acoustic indices in sound source decomposition. Conventional ecoacoustic studies have primarily relied on manual annotation [
28] or single-feature index-based methods (e.g., NDSI, ACI) [
29], which struggle to accurately differentiate specific sound sources. In contrast, the proposed multi-label classification model maintains high classification accuracy while demonstrating strong generalizability, making it suitable for long-term soundscape monitoring in protected forest areas.
Recent advancements in environmental sound classification continue to expand the scope of acoustic monitoring research. For example, Ranmal, D et al. (2024) [
30] introduced ESC-NAS, a neural architecture search framework designed for the monolabel classification of environmental sound events. Although ESC-NAS achieved strong performance on standard datasets such as ESC-50 and UrbanSound8K, its classification targets primarily include general urban sounds (e.g., sirens, dog barks). In contrast, the proposed model focuses on ecologically meaningful acoustic categories—namely biophony, geophony, and anthrophony—within forest ecosystems. This ecological orientation enables more effective applications in biodiversity monitoring through structured, multi-label outputs.
Furthermore, these results demonstrate that the model retains robustness under low-signal-to-noise-ratio (SNR) conditions, a frequent challenge in forest ecosystems due to overlapping biological and geophysical sounds. Unlike conventional acoustic indices that are highly sensitive to noise interference [
31], the deep learning model adapts to environmental noise variations, preventing distortions in specific acoustic features and enhancing the robustness of ecoacoustic analysis. These findings suggest practical utility in challenging field conditions and underline the model’s capacity for forest biodiversity surveillance. By enabling the scalable and fine-grained monitoring of forest soundscapes, the proposed model can assist in the early detection of anthropogenic disturbances, seasonal shifts in biophony, or loss of key vocal species, thereby supporting evidence-based forest management and wildlife conservation strategies.
The NDSI has been widely used in ecoacoustic research as a rapid assessment tool for the relative proportions of biophony and anthrophony, making it well-suited for large-scale, long-term soundscape monitoring [
25]. However, by comparing the recognition results with those of the soundscape classification model, some limitations of the NDSI were identified.
One of the main limitations is insufficient spatial resolution, which prevents differentiation between specific anthropogenic noise sources. As shown in the comparative experiment, the NDSI occasionally misclassified natural geophysical sounds—such as wind and rainfall—as anthropogenic signals, leading to an overestimation of human disturbance in certain forest areas. In contrast, the multi-label classification approach provided a higher level of analytical resolution. These results indicate that this method effectively detects transient sound source variations and quantifies the role of geophony in shaping the acoustic environment.
Another limitation is the omission of geophony, leading to an incomplete representation of forest soundscape composition. For example, while the NDSI analysis suggested that anthropogenic noise dominated the entire observation period, the multi-label classification model revealed that geophony (wind and rain) masked biophony during specific time windows. This finding suggests that biophony did not disappear entirely but was instead masked by environmental noise, making it difficult for the NDSI to accurately capture it.
A key contribution of this study is the integration of the NDSI and multi-label classification into a complementary macro–micro soundscape monitoring framework. The NDSI offers a broad-scale assessment of soundscape disturbance trends, whereas multi-label classification provides detailed insights into specific sound sources and their temporal variations. The combination of these two approaches enables a more comprehensive characterization of forest acoustic environments and offer a multi-layered decision-support system for forest ecosystem management and conservation planning.
Despite demonstrating the advantages of deep learning in ecoacoustic monitoring, this study has certain limitations. First, the performance of the multi-label classification model depends on high-quality labeled data, which are costly and labor-intensive to produce. In this work, the annotations were conducted by a single trained annotator under expert guidance to ensure consistency. Future research could explore self-supervised learning to reduce dependency on manually annotated datasets.
Second, while the multi-label classification model and NDSI provide valuable macro-level trend analysis, they remain insufficient for precisely interpreting variations in complex soundscapes. Future studies could enhance monitoring capabilities by incorporating multimodal data sources (e.g., meteorological data, infrared camera recordings) to fully explore the relationship between forest ecology and acoustic patterns.
Moreover, although this study did not implement explicit open-set recognition, the current model architecture demonstrated strong generalization to unseen acoustic combinations. For instance, while the training data did not include samples containing the simultaneous occurrence of insect calls, wind, and rain, the model successfully identified this three-way combination in the independent test set. This suggests that the proposed model can effectively recognize novel sound mixtures beyond its training distribution. Further research could incorporate novelty detection methods to extend its applicability to unknown sound types.
Overall, this study proposes a novel framework that combines deep learning-based multi-label classification with acoustic indices to analyze forest soundscapes. This hybrid approach offers a practical and scalable method for long-term soundscape monitoring in national parks and other natural ecosystems. With continuous advancements in artificial intelligence and sensing technologies, intelligent soundscape monitoring is expected to become more precise, automated, and ecologically informative, thereby contributing to biodiversity conservation and adaptive forest management strategies.
5. Conclusions
This study evaluated a deep learning-based multi-label classification model for analyzing forest soundscapes using long-term acoustic data from Shennongjia National Park. The model effectively identified and quantified biophony, geophony, and anthrophony from field recordings and demonstrated strong performance in handling overlapping acoustic sources, which are prevalent in complex forest environments.
In contrast, the NDSI provides a valuable high-level overview of soundscape structure and biotic–anthropic dynamics, but it has limitations in resolving specific sound source types. For example, NDSI may misclassify geophonic events such as wind or rain as anthropogenic noise, leading to potential inaccuracies in biophony assessments.
These findings further suggest that AI-driven classification models are particularly effective in capturing detailed acoustic patterns within complex natural soundscapes. These models reduce the risk of misclassification due to masking effects or low-signal-to-noise-ratio (SNR) conditions, which are common in forest ecosystems. Their robustness under acoustic complexity makes them ideal for long-term deployment in protected forest reserves where sound sources overlap or change dynamically. Nevertheless, the NDSI remains a practical and intuitive tool for rapid acoustic assessments across broad spatial and temporal scales, and its integration with deep learning models creates a more comprehensive and scalable soundscape analysis framework. Together, these tools contribute to more informed evaluations of ecosystem health and support biodiversity conservation initiatives.
This study also highlights several directions for future research. First, the reliance on high-quality manual annotations limits scalability. Future work may involve establishing standardized labeling protocols and auditing mechanisms for consistency in multi-annotator settings, as well as exploring self-supervised or semi-supervised methods to reduce annotation demands. Second, the model was trained on a closed label set, restricting its ability to recognize novel sound events; open-set classification or anomaly detection approaches could extend its applicability. Third, incorporating multimodal environmental data—such as meteorological information or remote sensing—may improve ecological interpretability. Additionally, comparative evaluations using standardized forest soundscape datasets could help benchmark model performance across ecosystems and seasons.
In summary, this study confirms the potential of artificial intelligence in forest soundscape classification and demonstrates that combining deep learning with acoustic indices provides a powerful analytical framework for biodiversity monitoring. As AI technologies and sensing infrastructures continue to evolve, automated soundscape monitoring is expected to become increasingly intelligent, accurate, and ecologically informative, offering critical technical support for long-term conservation and sustainable ecosystem management.


