Article

Parameters of Medium-Size Wood Deliveries Depending on the Season, Moisture Content and Assortment of the Load

by
Grzegorz Trzciński
1,* and
Łukasz Tymendorf
2
1
Department of Forest Utilization, Institute of Forest Sciences, Warsaw University of Life Sciences—SGGW, 159 Nowoursynowska St., 02-776 Warsaw, Poland
2
Independent Researcher, 12-100 Szczytno, Poland
*
Author to whom correspondence should be addressed.
Forests 2025, 16(6), 897; https://doi.org/10.3390/f16060897 (registering DOI)
Submission received: 31 March 2025 / Revised: 22 May 2025 / Accepted: 24 May 2025 / Published: 27 May 2025
(This article belongs to the Section Forest Operations and Engineering)

Abstract

:
In the years 2022 to 2023, the harvesting of medium-sized round wood by the State Forests Service in Poland was estimated at between 22.2 and 23.6 million solid cubic meters per year. This is a significant amount of timber to be transported by road. It is a challenge for both transport companies and round wood buyers. The high variability of wood density depending on the species in combination with its moisture content is a significant issue in logistics operations. This study focuses on the influence of the absolute moisture content on selected parameters of wood deliveries, taking into account the differences in the seasons. The total weight of a transport set (GVW) and empty set (Tare) and the weight of the load (Net) were determined on the basis of weighing the transports on stationary scales at the recipient. The moisture content of each wood load was determined using the dryer-weigher method for sawdust taken from the cutting of several logs from the delivery. This study analyzed a total of 13,602 transports of ten tree species and two wood assortments of pulpwood (S2a) and industrial wood (S2ap) in four seasons in the years 2020–2022. Pine was the dominant species in 5352 deliveries, and spruce was the dominant species in 3161. In terms of seasons, 3983 transports were recorded in the summer, 3650 were recorded in the spring, and 3492 were recorded in the autumn. The lowest number of 2475 was in winter. The mean volume of delivered wood (from 13,602 transports) was 28.18 m3, with a range of results from 19.00 to 51.29 m3 and SD = 2.40. The mean weight of the shipment was 24.95 Mg, with SD = 3.36. The range was from 13.92 Mg to 38.20 Mg. The mean absolute moisture content (AMC) of all wood loads (regardless of species and quality) was 42.91%. The results varied significantly (SD = 6.41). The minimum value was 15.64%, and the maximum value was 66.79%. The absolute moisture content of round wood is related to the season, species and assortment of transported wood. Loads of hardwood have lower average solid cubic meter values than softwood.

1. Introduction

The operation of transporting round wood from the forest to the destination point is critical in the wood supply chain. This process is one of the core activities of forest management, as it has significant impact on supply cost, but also enables research of the most optimal solutions [1,2,3]. Round wood transport is affected by many different factors. The main ones are truck load capacity, ride time and petrol consumption [4,5]. It is assessed that the share of costs of timber transport in the total cost of wood processing is about 17% [6]. Transporting timber is the most expensive process of sourcing the round wood and may constitute 40%–60% of the total cost of its harvesting [7]. Searching for the most optimal logistics solutions to grow competitiveness and reduce these costs is very important [8,9].
A major issue in round wood transport is the correct estimation of the weight of 1 m3 of load, which would allow for the haulers to identify the permissible volume of round wood loads, while using the maximum GVW (gross vehicle weight) and the loading capacity of the transport set, which is the topic of many studies [10,11,12,13,14,15,16].
In Poland, in the years 2022 and 2023, 22.79–24.42 million solid cubic meters (m3) of medium-size wood annually was harvested. This represents approximately 57% of the total harvest of thick round wood [17]. The largest amount of medium-size wood for industrial use (S2) is harvested at the level of 14.47–15.81 million m3 (Table 60 p. 98 [17]) among medium-size wood [17]. This is an important segment in the road transport of wood, which is a challenge for both transport companies and wood consumers. Large variations in wood density depending on the species in combination with its moisture content is a challenge in logistic processes.
Moisture content is the characteristic of wood that determines its basic functional properties [18] and also influences the transport parameters of round wood [19]. The moisture content and density of wood are the basis for setting the loading limits applicable to transport regulations [20,21]. In reality, the high variability of wood assortments from different species and the varying moisture content of the wood do not allow for an unambiguous assessment of the weight of the transported raw material [10,16,20]. As a result, the weight of the transport set is very often exceeded by more than what is permitted by law [7,22,23]. For example, a study carried out in Ireland on deliveries of Sitka spruce (Picea sitchensis L.) pulpwood showed that the overall weight was exceeded in 67% of cases [19].
Knowing the actual weights of transported medium-size wood for industrial uses and trying to relate them to the changing moisture content of the cargo will make it possible to avoid overloading the vehicles while making the most of the capacity of the transport set. The purpose of this research was to confirm or reject the assumption that the weight of transported wood is influenced by its moisture content, which is related to the season, species and wood assortment of the load. This research was conducted on a three-year period, with analysis of more than 13,600 transports, each taking samples to determine the moisture content of the delivery. This knowledge is of considerable practical importance, and the subject has a universal dimension.

2. Materials and Methods

Measurements of parameters defining transports of medium-sized round wood (GVW, load weight, load moisture content, wood species and assortments) were made on the area of a large wood processing company in the northeastern part of Poland. The transport was made by external haulers acting on behalf of the buyer. Wood deliveries were carried out by five- and six-axle transport sets adapter to transport medium-sized wood consisting of a truck with a trailer or semi-trailer [7,23,24].

2.1. Characteristics of Medium-Sized Wood Assortments and Determination of Load Volume

According to Polish Standard PN-91D-95018 [25], medium-size wood is classified as a wood with a top diameter minimum of 5 cm (excluding bark), with a diameter up to 24 cm in the thick end. Quantity can be estimated in stakes or single pieces or in pieces as groups. In the case of the quality and size, medium-size wood is distinguished into four groups [25]. One of the groups is S2. It is stake wood for industrial processing; according to the classification by utilization, this group includes stack assortments: pulpwood, slivers and rollers, which can be used in pulp and paper industry, chipboards and in dry distillation and tan rollers,
Medium-sized round wood in group S2, with regard to performance parameters—quality requirements (slenderness, curvature, damage)—is divided into classes:
  • S2a—one-sided curvature up to 8 cm/1, with length over 1 m up to 10 cm along the entire length and unacceptable soft rot;
  • S2ap—one-sided curvature up to 12 cm/m and soft rot acceptable up to 50% area of the front face [26,27,28].
Deliveries were analyzed for the main coniferous species Scot pine (Pinus sylvestris L.), Spruce (Picea abies L.) and Larch (Larix spp.) and deciduous species Beech (Fagus sylvatica L.), Birch (Betula pendula L.), Oak (Quercus spp.), Lime (Tilia spp.), Alder (Alnus spp.) and Aspen (Populus tremula L.).
The species, wood assortments (S2a, S2ap) and quantity of wood transported in solid cubic meters per m3 were determined on the basis of the delivery documents made by the State Forest. These documents are received by the driver and verified by the timber receiver’s personnel upon receipt of the raw material. The inspection and measurement of the raw material is carried out by the personnel of the wood yard. Receipt of the raw material is performed by checking the transport documents and the conformity of the delivery with the documents issued by the State Forest. The measurement is carried out in accordance with the principles of the Polish Standard PN-D-95000 “Wood Raw Material”, “Measurement, Calculation of Volume and Guiding” [28]. Determination of quality is made in line with the principles given in the Polish Standard PN-91D-95018 “Wood raw material. Medium-sized timber. Common requirements and tests” [25]. From the measurement of wood on the truck, the result was obtained in stacked cubic meters in bark. Conversion to solid cubic meters (m3) without bark was made by using the conversion factors given in Table 1 (according to PN-D-95000) [28].

2.2. Determination of the Moisture Content of the Wood Transports

The absolute moisture content of wood (AMC) was determined using the dryer-weight method. For this purpose, wood yard employees took wood samples in the form of sawdust from the cuttings of randomly selected pieces of the round wood. Material was taken for logs up to 2 m in length from a minimum of 15 logs from each delivery. For wood over 2 m in length, it was taken from 10 pieces of logs. Samples were taken using a chainsaw with a sawdust container attached. Cuts should be made up to half the diameter of the logs, but in the case of thinner material, cuts should be made to the end. The collected sample was mixed in a bucket, and then, a sample of 200 g was taken. The sawdust sample was placed in a labeled container and, after weighing, was placed in the dryer. After 12 h, the dry material was weighed with an accuracy of 0.01 g. In the case of the accuracy of weight measurements, the method of drying the samples and the methodology for calculating absolute moisture content using the dryer-weight method, the provisions of EN 13183-1:2002 [29] were adopted.

2.3. Determination of Load Mass and Density

The weight of the transported round wood (Mg) was determined as the difference between the gross vehicle weight (GVW) of the transport set and the weight of the empty set (T-tare). GVW (Mg) and tare were determined by weighing the transport set on the station scale where the transport set entered with an accuracy of 0.01 Mg. The transport set was weighed directly at the entrance to the plant (GVW) and weighed empty (tare) after unloading.
M g = G V W T Mg
where
GVW—gross vehicle weight (Mg)
T—tare (Mg), weight of empty transport set
The density of the round wood load (specified as mass of 1 m3 of load from weighing the trucks Mg·m−3) was determined for each wood species and wood assortments as the ratio of the mass of the load (Mg) to its volume in solid cubic meter m3. Having the specified weight of the load of wood on the truck (after weighing with load and empty) according to formula 1 and the solid cubic meters of wood from the delivery documents, after verification by the recipient’s employees, the mass of 1 m3 of load from weighing the trucks was calculated.
M 1 m 3 = M g m 3       Mg · m 3
where
Mg—mass of load (Mg)
m3—solid cubic meter (m3)

2.4. Statistical Analyses

The obtained results were analyzed statistically with the use of the STATISTICA 20 package. The overall results were divided into four groups related to the selected seasons. Analyses were also made to compare the moisture content of the load between years for the same seasons and for a given species and wood assortments. The significance of differences in the studied properties between shipments depending on the year season was checked by the Kruskal–Wallis test as well as the Dunn test (significant level was 0.05). The statistical analysis carried out in this way was supposed to confirm or reject the research assumption that the season of the year and tree species of wood delivery affect the weight of the load. An analysis of the relationship between the absolute moisture content (AMC) with the selected tested load parameters was also conducted using the Spearman’s rank order correlation test.

3. Results

In the process of performing the research, material was obtained from 13,602 transports of medium-sized round wood (S2a and S2ap) for four coniferous (9055 deliveries) and six deciduous tree species. The dominant wood species, with 5352 deliveries, was pine, followed by spruce, with 3161 shipments. At a comparable level, 1050–1100 transports were made for the deciduous species birch, lime and alder. According to the seasons, 3983 transports were made in summer, 3650 were made in spring, and 3492 were made in autumn, and the lowest was 2475 in winter (Table 1).
The average quantity of transported round wood (from 13,602 deliveries) was 28.18 m3, with a range of results from 19.00 to 51.29 m3 and SD = 2.40 (Table 2). The average weight of the load was 24.95 Mg, with SD = 3.36 and from a minimum value of 13.92 Mg to 38.20 Mg. The average absolute moisture content (AMC) of all loads of wood (regardless of species and wood assortment) was 42.91%, with a significant discrepancy in results (SD = 6.41), with a minimum value of 15.64% and a maximum value of 66.79%. The calculated mass of 1 m3 of load, as a quotient of load weight and volume, averaged 0.889 Mg·m−3, with a variation of SD = 0.120 and Q1 = 0.809 and Q3 = 0.073 (Table 2).
There are statistically significant differences for all received values of the analyzed parameters depending on the delivery date (p = 0.000, Kruskal–Wallis test) (Figure 1). Intra-group comparisons also showed statistically significant differences, with only a lack of statistically significant differences for solid cubic meter between spring and summer, spring and winter and between summer and winter deliveries (Dunn’s multi-sample rank mean comparison test) (Figure 1a).

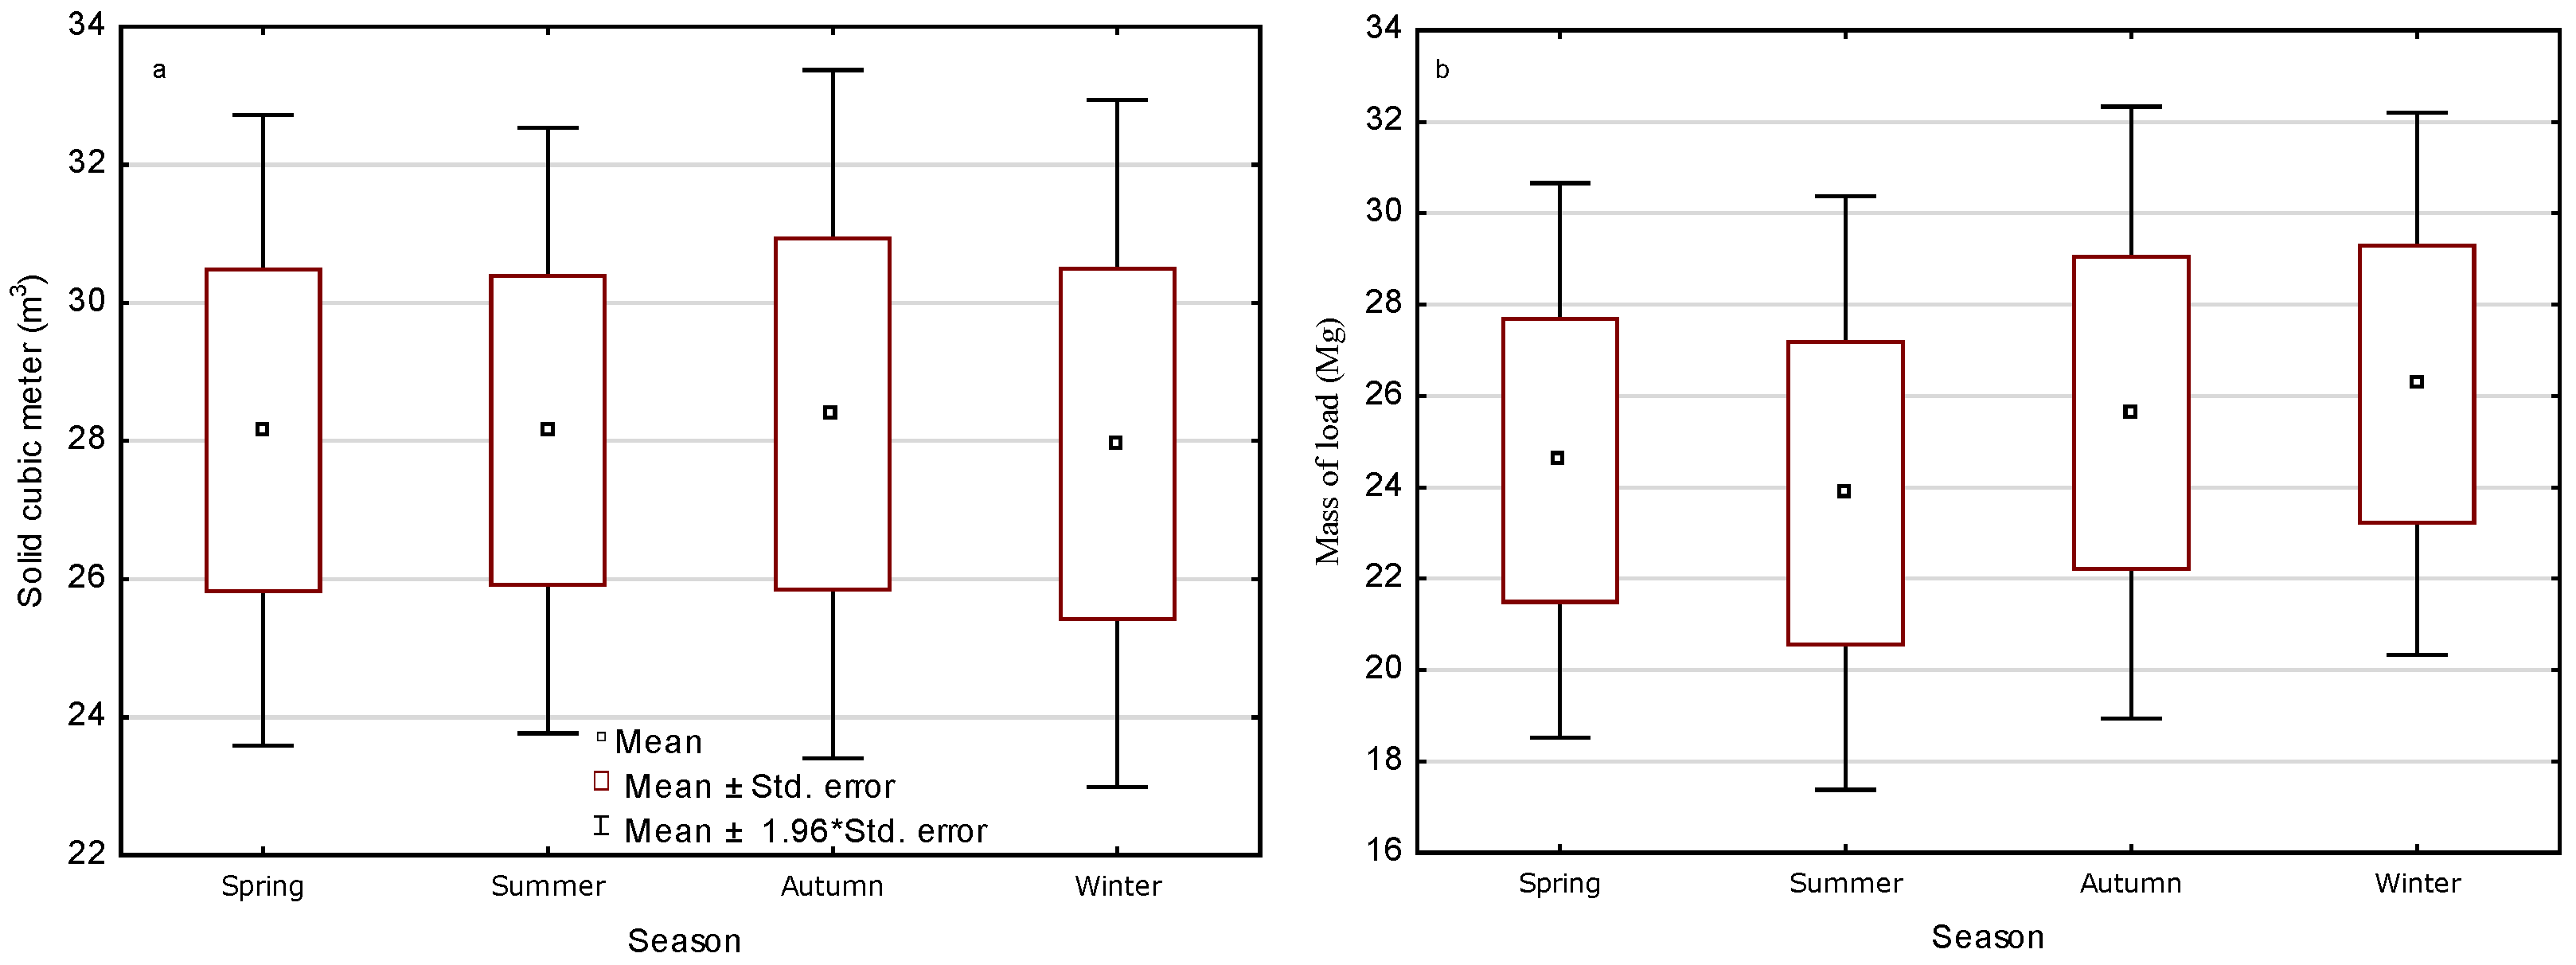
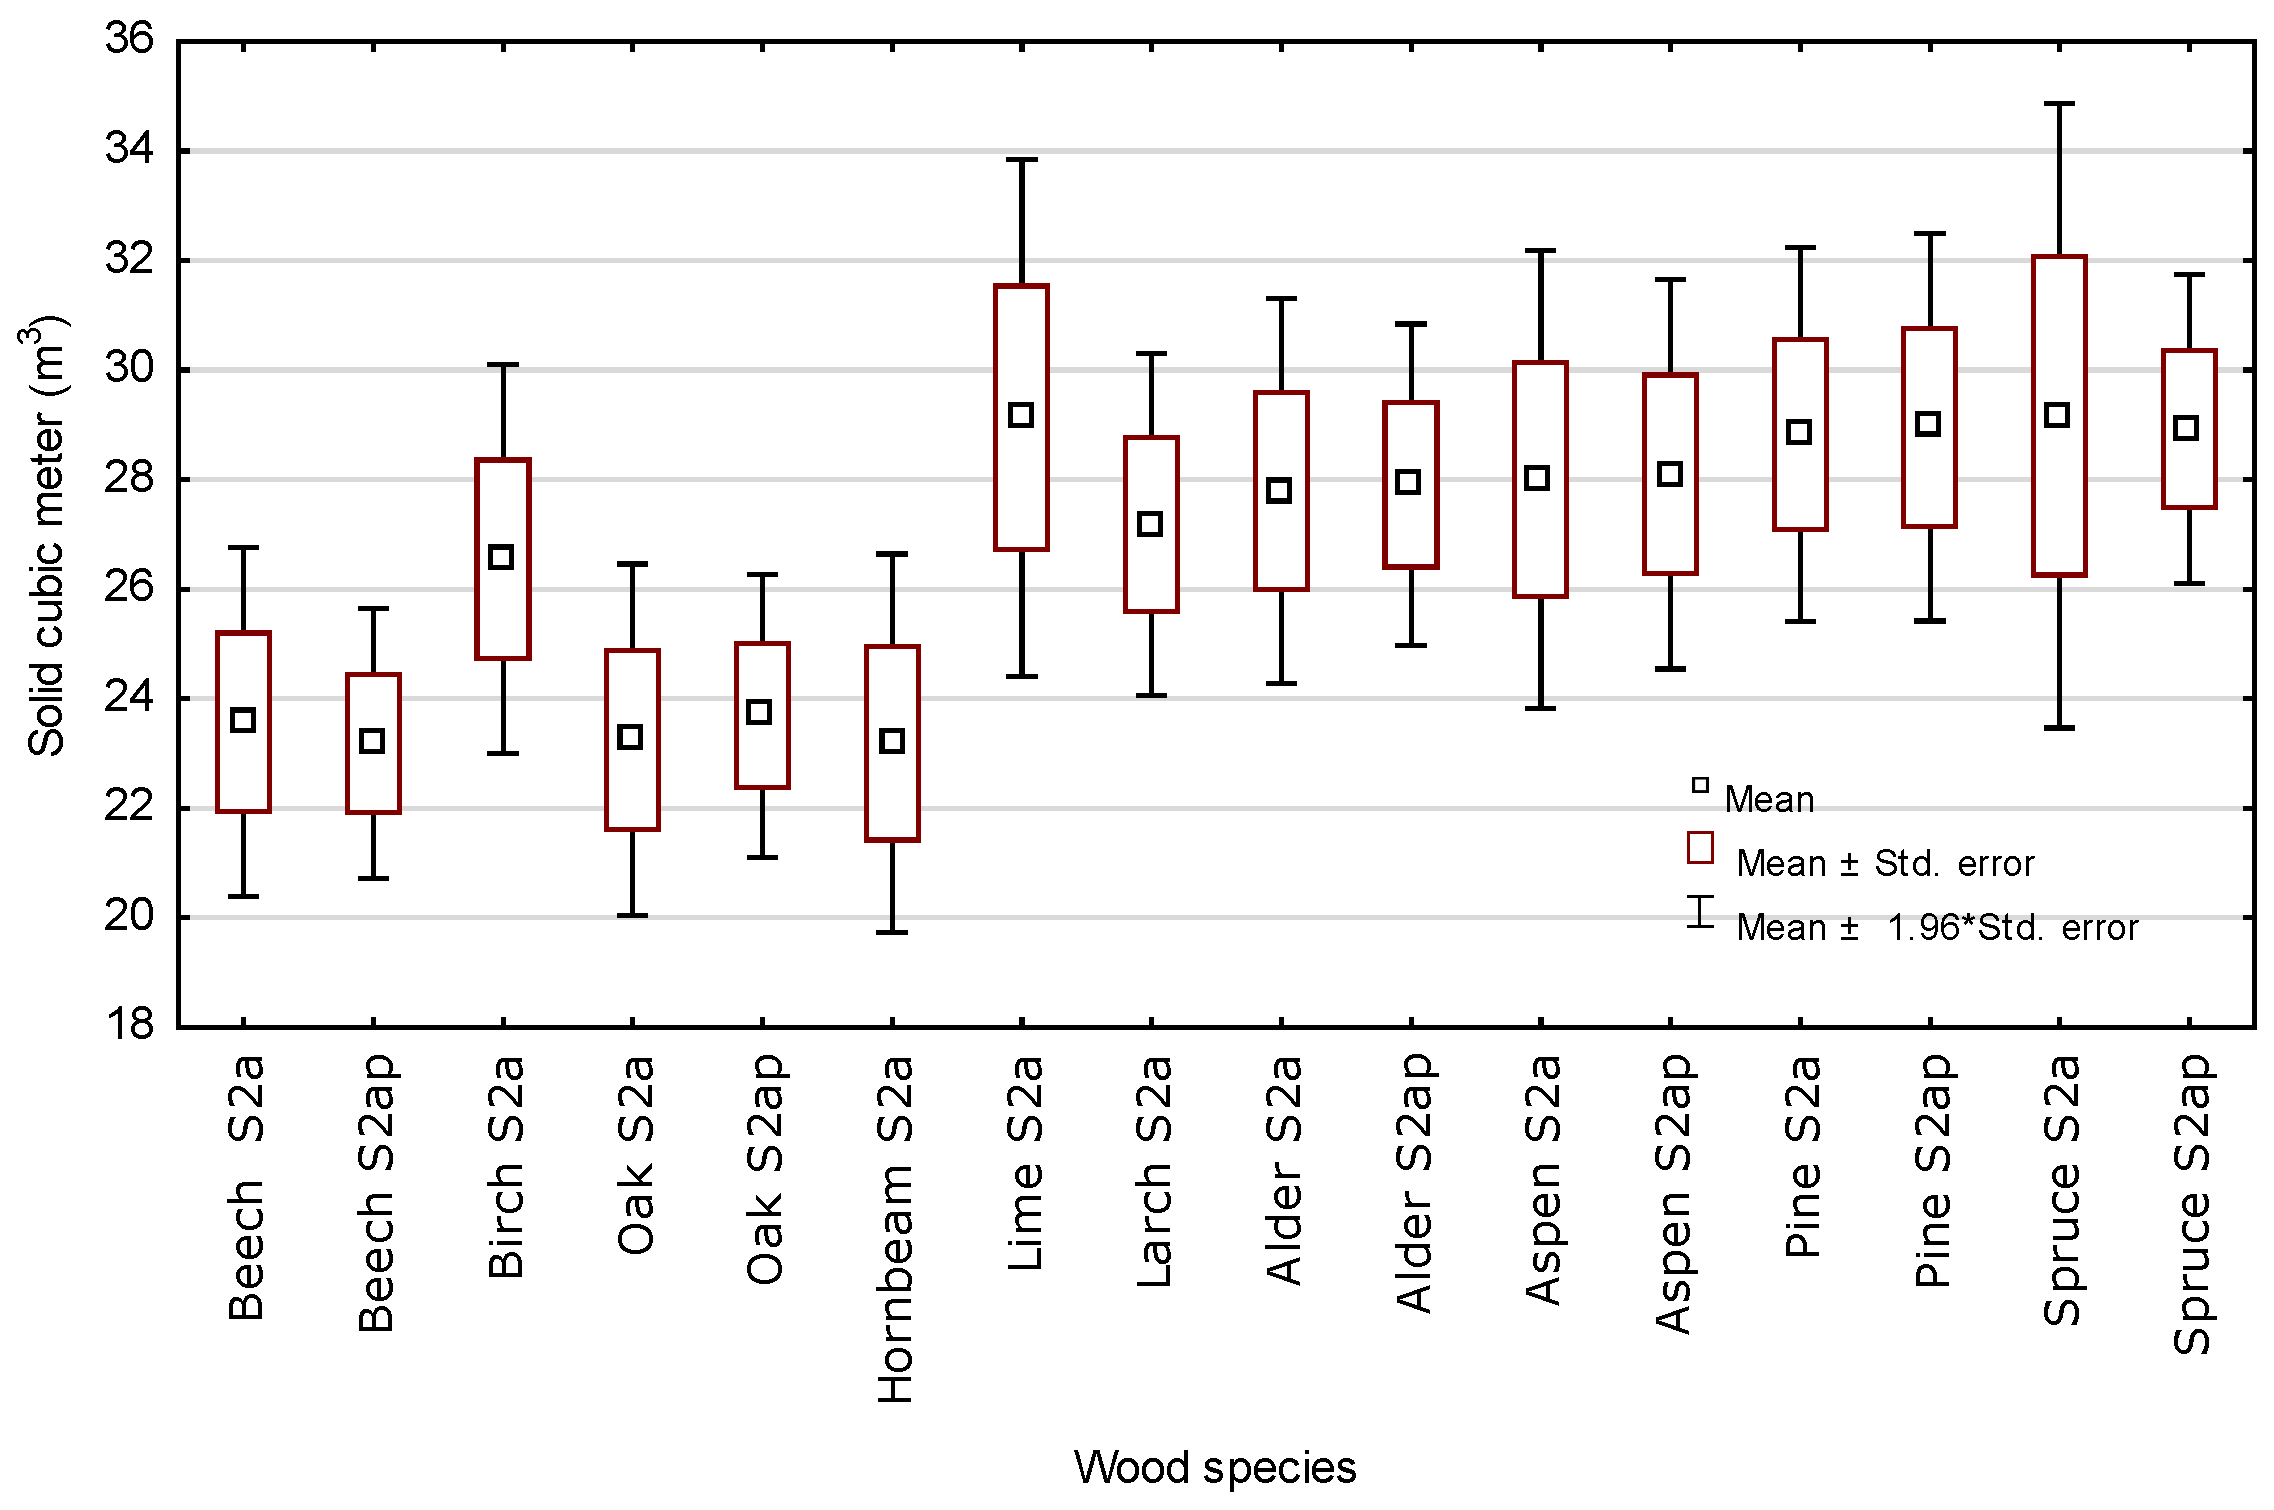
3.1. Volume of Transported Wood in Solid Cubic Meter (m3) Depending on the Species and Assortment of Wood and Season of the Year

The mean volume of transported wood for deciduous species ranges from 23 m3 (Beech, Oak, Hornbeam) to 29 m3 (Lime) and is highly variable, as confirmed by the statistical analyses (Figure 2). The mean values of the solid cubic meter for coniferous species are at a similar level of 29 m3 (Pine, Spruce) and 27 m3 Larch, which does not mean that there are no statistically significant differences.
Comparative analysis with the Kruskal–Wallis test of all solid cubic meter m3 results by species and wood assortment shows statistically significant differences (p = 0.0000), and Dunn’s multi-sample rank mean comparison test indicates similarities (no statistically significant differences) for hardwood deliveries: Beech S2a and S2ap with Oak S2a and S2ap and Hornbeam S2a (Figure 2). Further similarities can be found for Alder (S2a and S2ap) with Aspen (S2a and S2ap). No statistically significant differences in solid cubic meter results among coniferous species are found for Spruce S2a and S2ap with Pine S2ap (Dunn’s test). Several other individual pairs with similar results are also found, e.g., Lime S2a with Pine S2ap and Spruce S2a, Aspen S2ap with Pine S2a, and the results for Larch (S2a and S2ap) differ with all other species (Figure 2).
The average volume of transported round wood for the different periods of the year is at a similar level of around 28 m3, with a significant spread of results for spring and summer 2022 and autumn 2021 and winter 2022 (Figure 3). The smallest values of less than 22 m3 are observed for transports in autumn 2021 and winter 2022. The highest volume of 35 m3 of round wood per transport is observed in autumn 2021. Deliveries of 34 m3 also occurred in 2022. In five periods (e.g., spring 2020 and 2021, summer 2020 and others), the unit volume of transported timber is in the range of 24–32 m3. This does not mean that there is a lack of statistically significant differences between the results. The comparative analysis with the Kruskal–Wallis test of all solid cubic meter (m3) results according to the season of wood delivery indicates statistically significant differences (p = 0.0000), and the Dunn’s test shows similarities (no statistically significant differences) for wood transports realized in spring and winter 2020 and 2021 (no similarity with one or two periods) (Figure 3). The volume values of transported wood from autumn 2020, spring 2022 and summer 2021 differ the most with the other periods, with only 1–3 pairs of similarity (Figure 3).

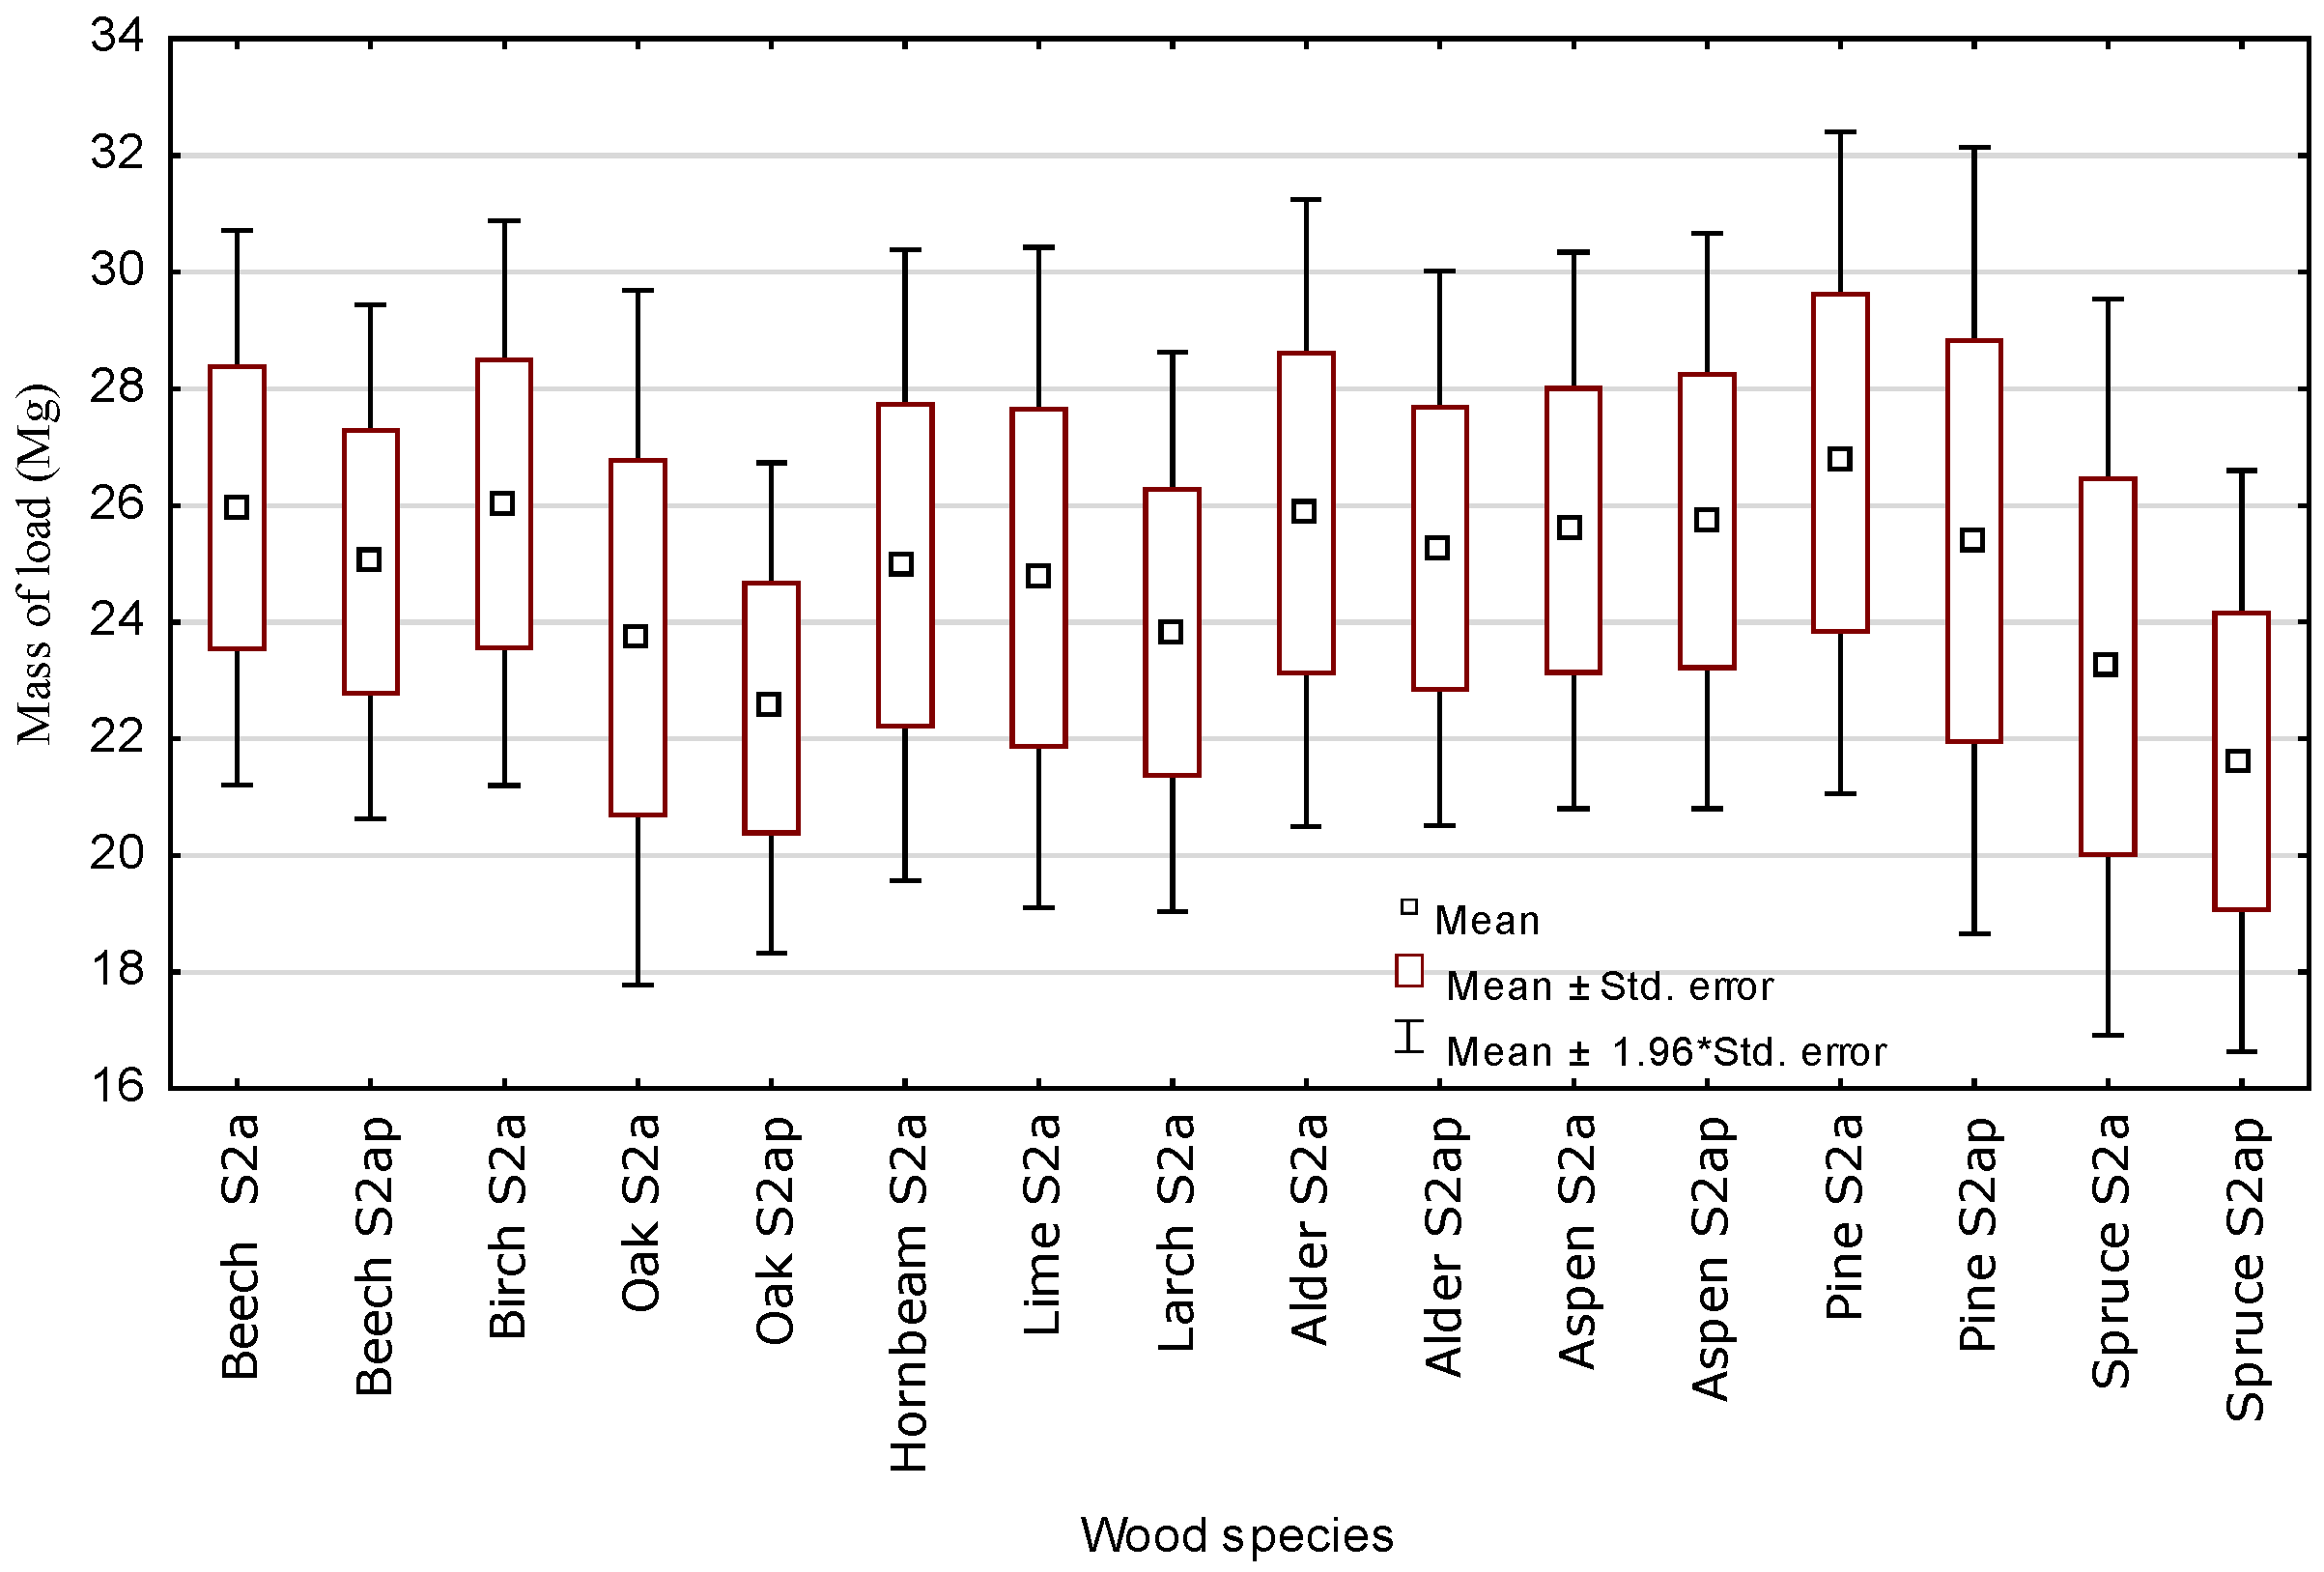
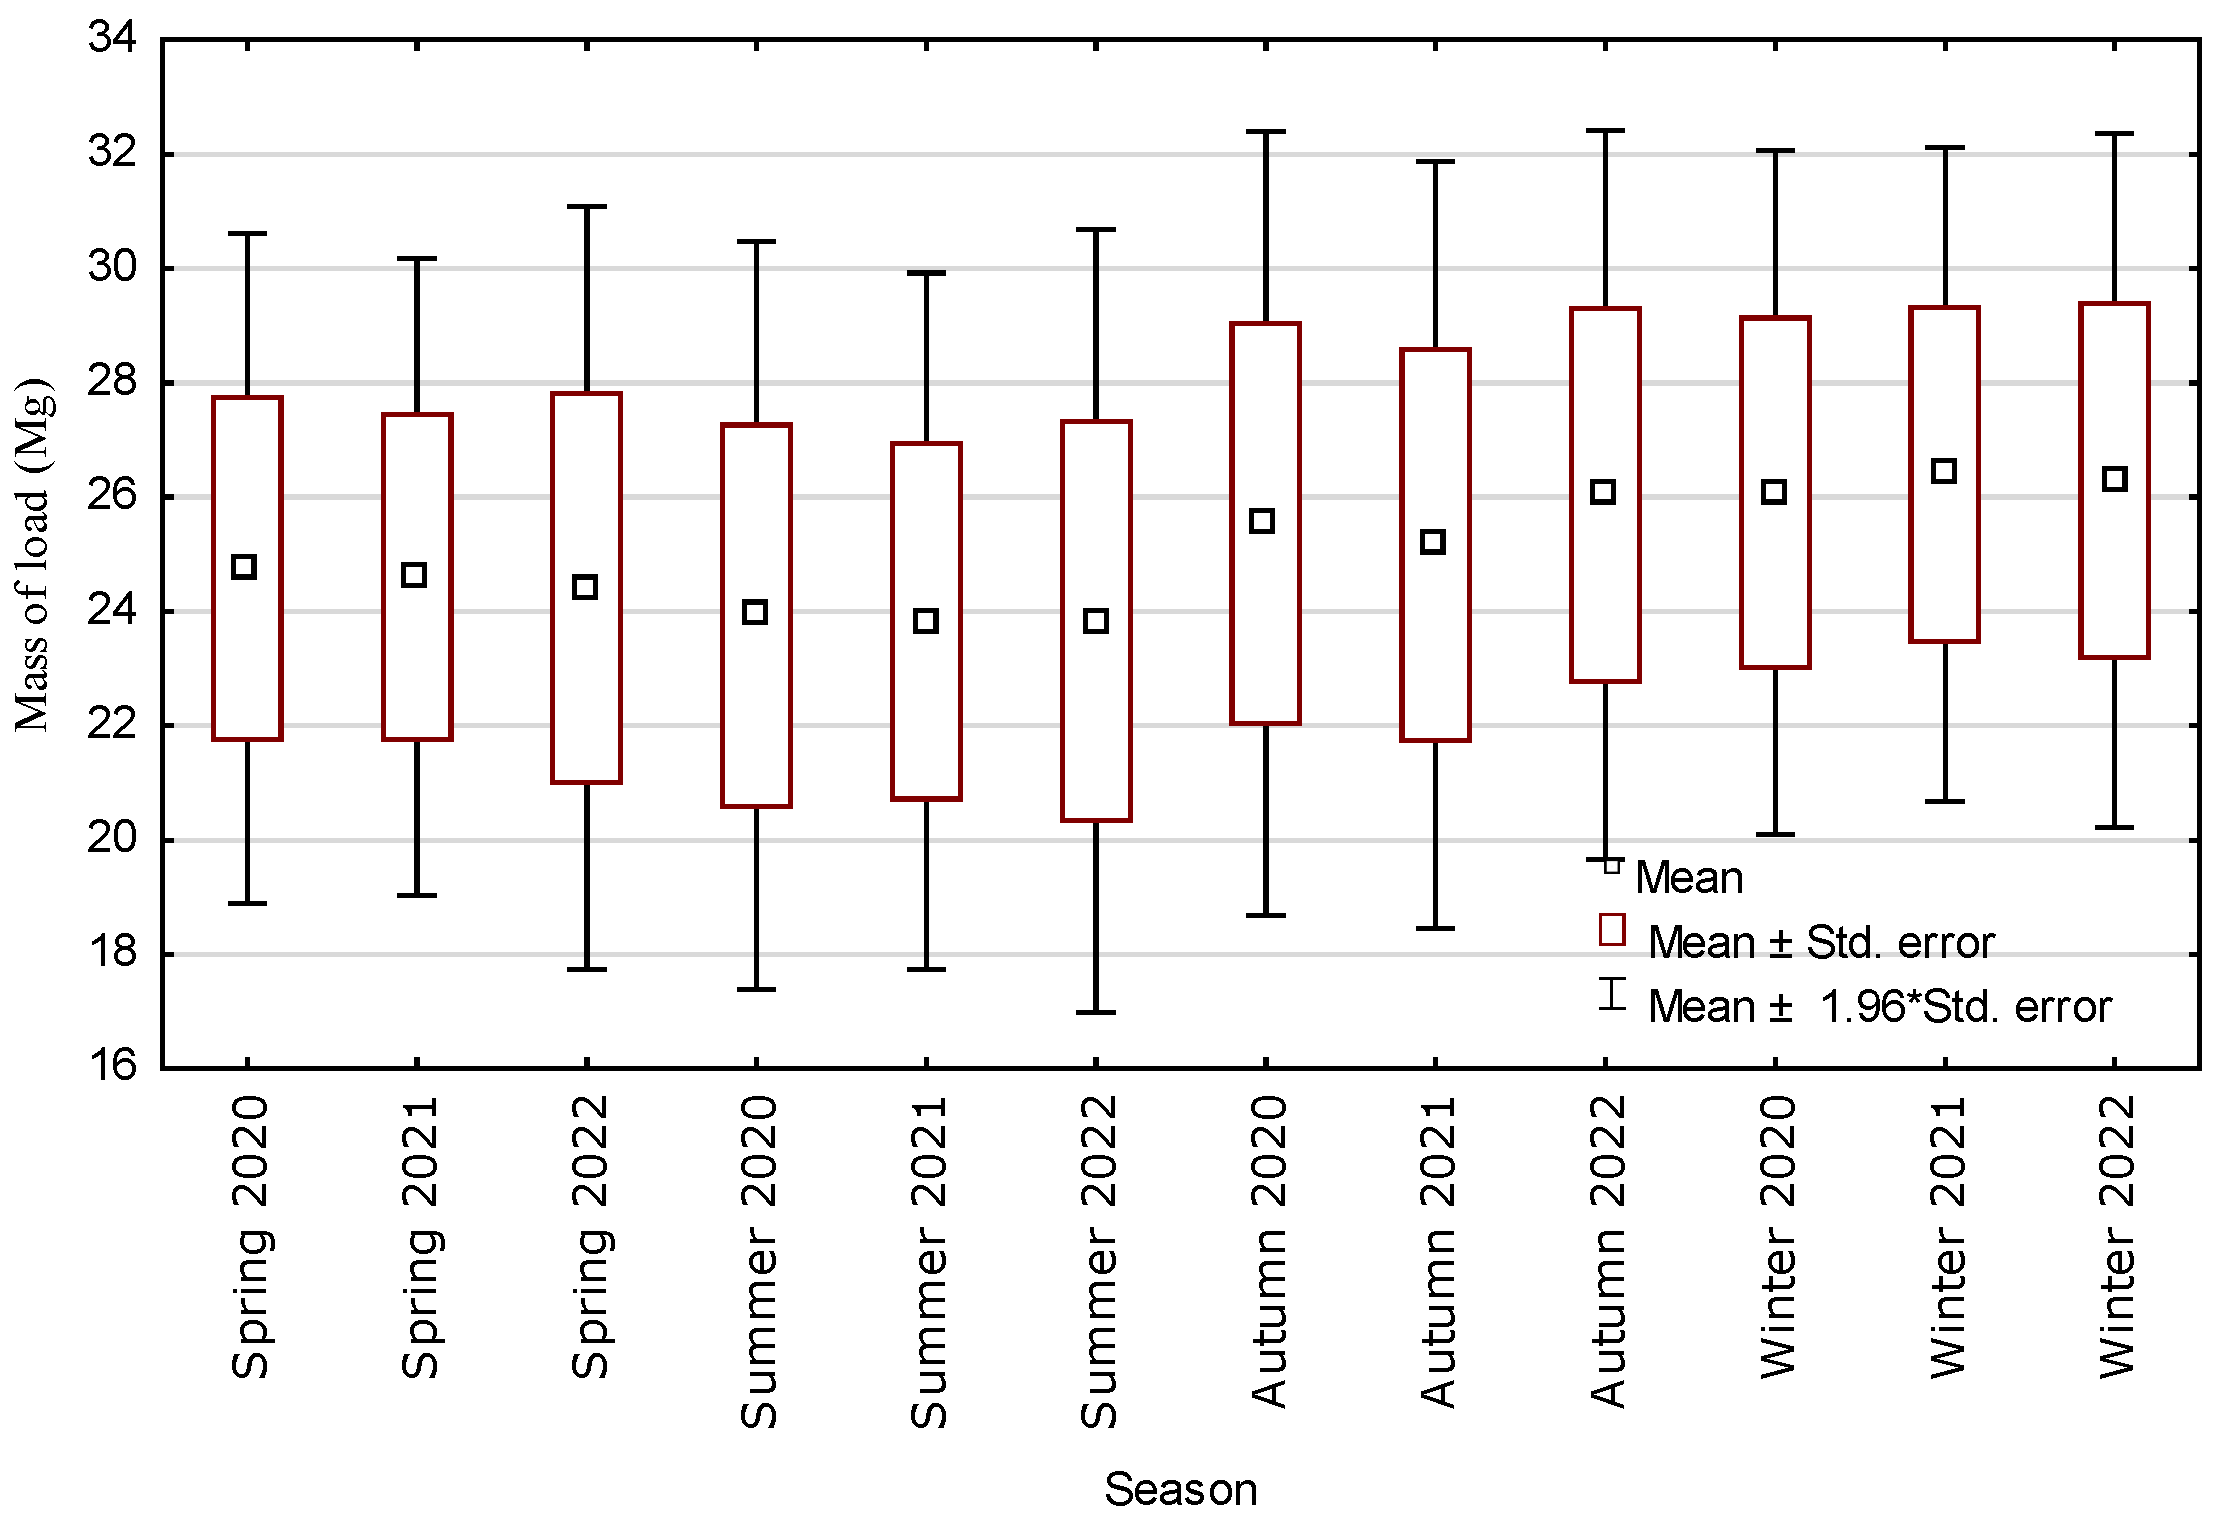
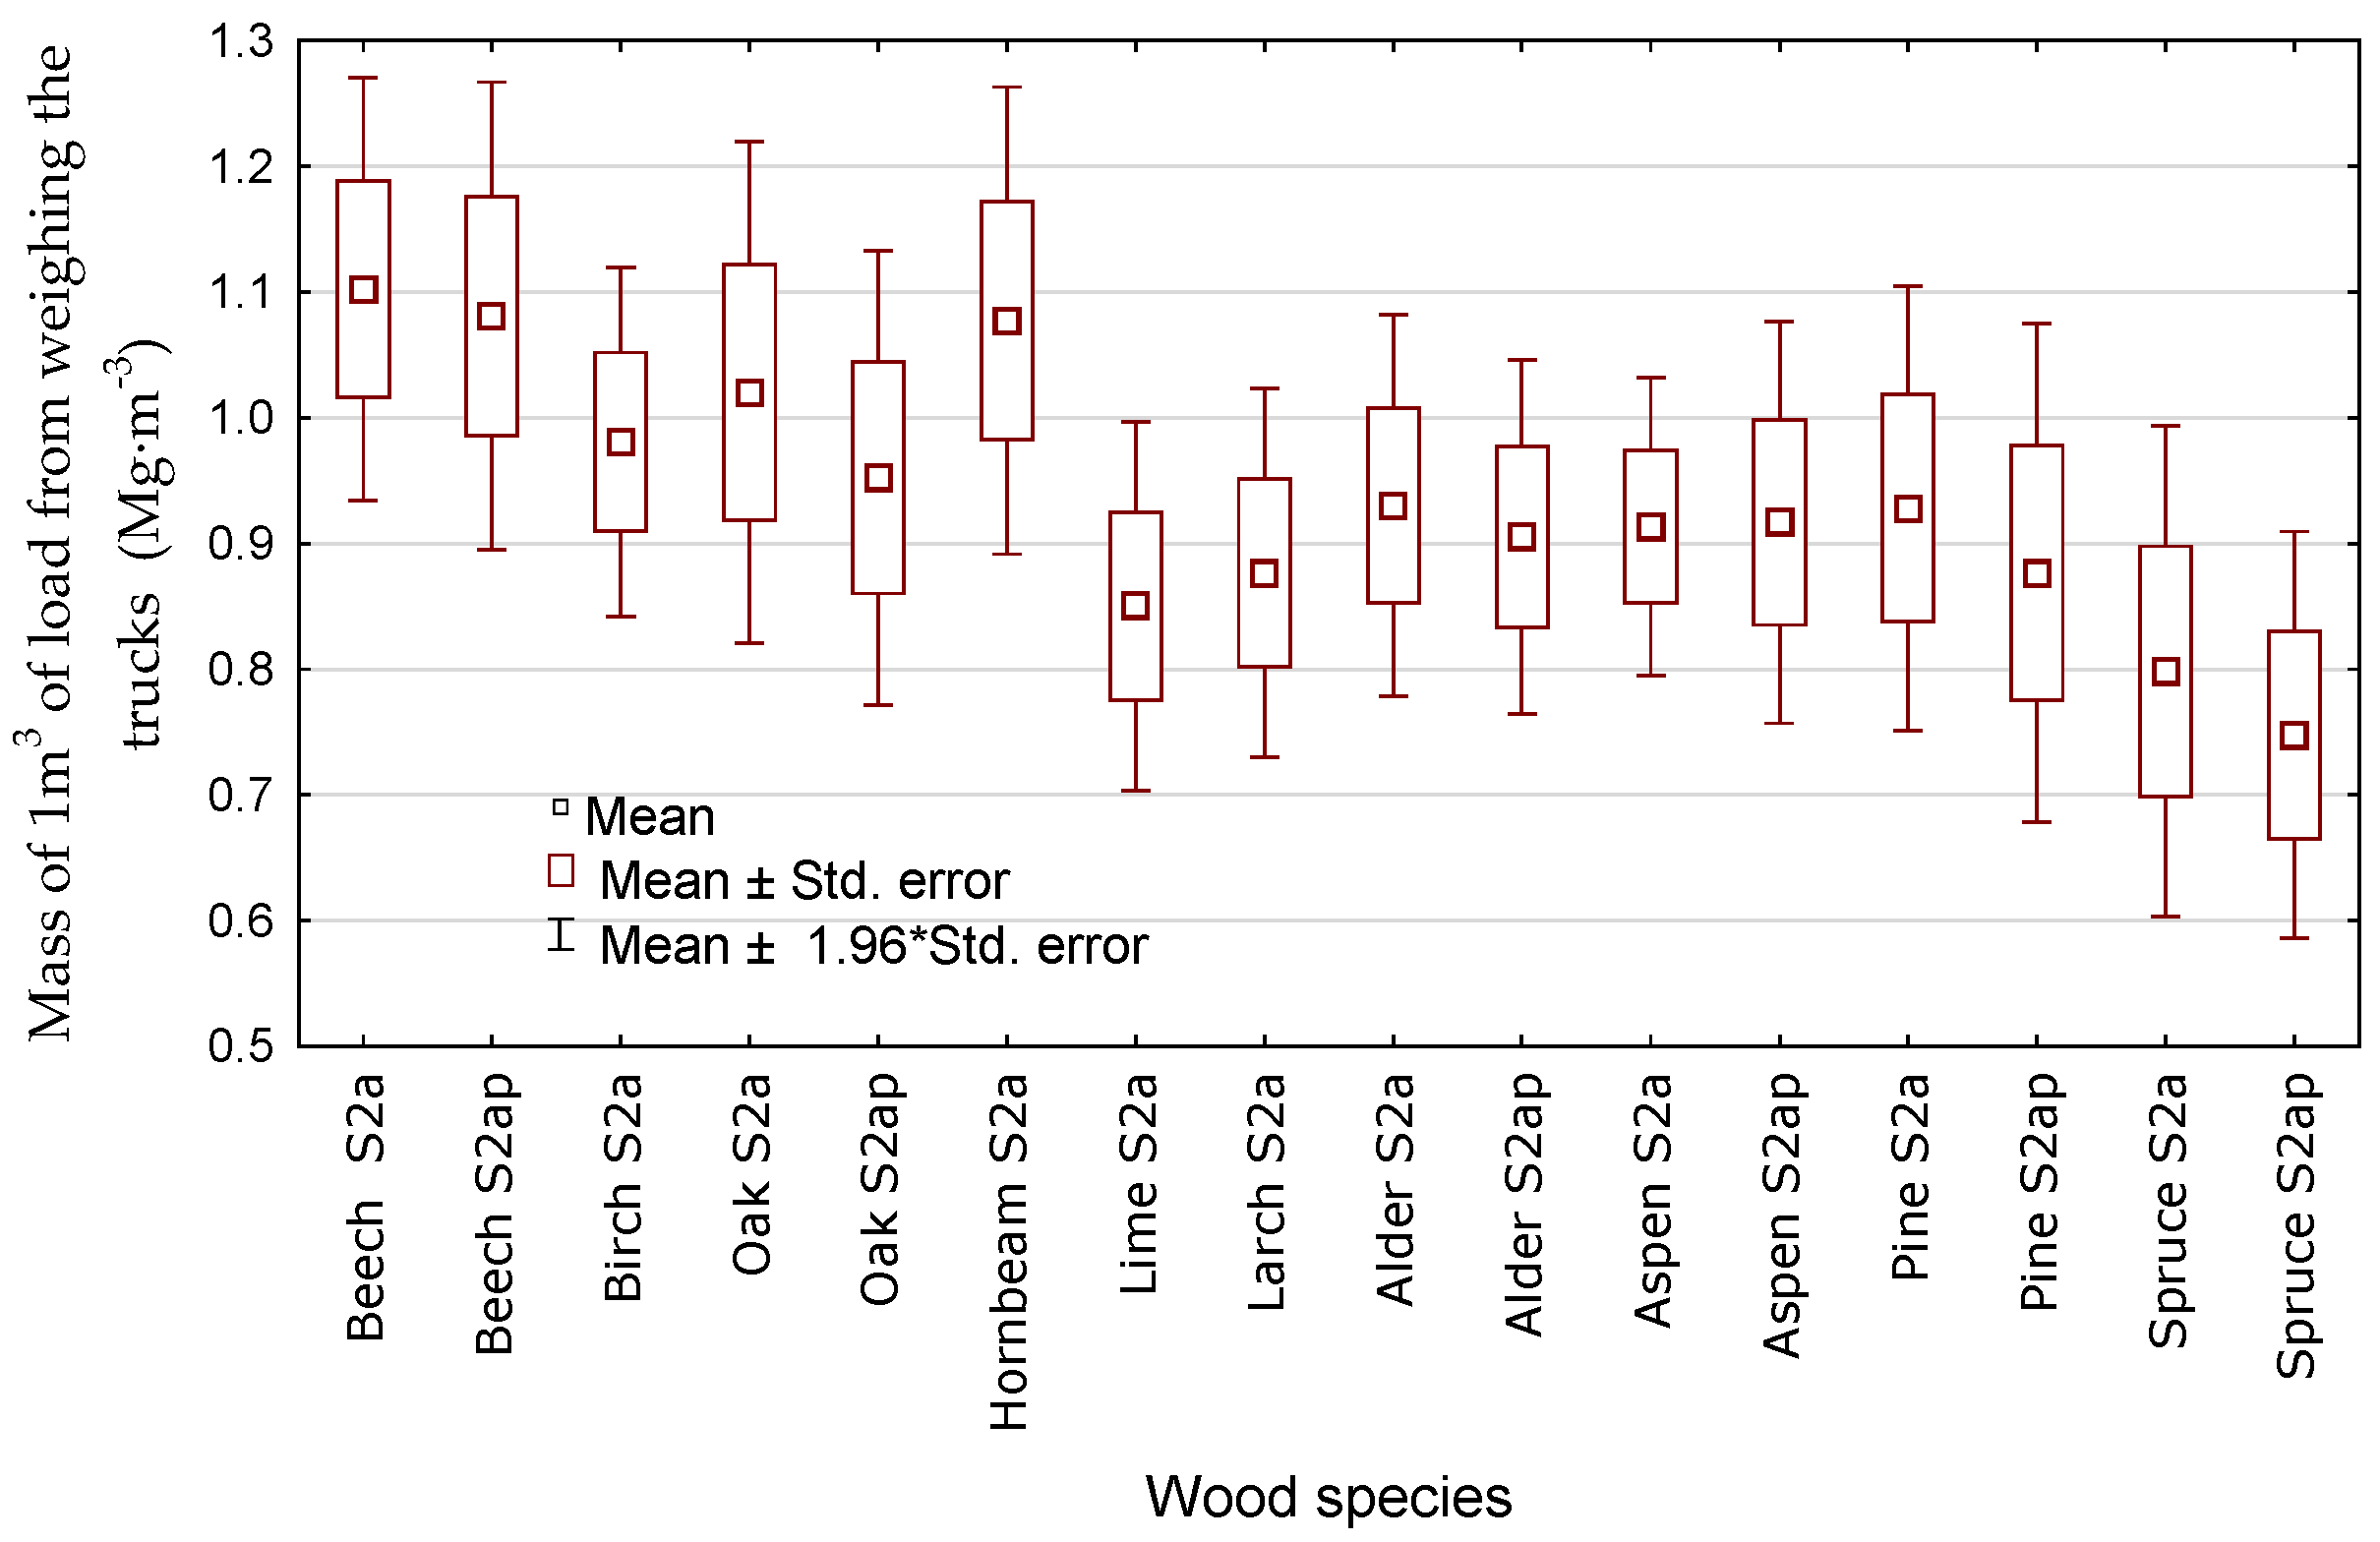
3.2. Load Mass (Mg) Depending on Tree Species, Wood Assortment and Season

The average wood load mass for coniferous species ranges from under 22 Mg (Spruce S2ap) to 27 Mg (Pine S2a) and, for deciduous species, over 22 Mg (Oak S2ap) to 26 Mg (Birch, Beech S2a) (Figure 4). The lowest, 16 Mg of load mass, is observed for S2ap and S2a spruce, while the highest is about 32 Mg for S2ap and S2a pine. For shipments of 7 species (e.g., beech, birch, alder, aspen), cargo weights range from less than 22 Mg to 31 Mg. The weight of wood loads is highly dependent on the species and wood assortments, as confirmed by statistical analysis showing significant differences (Kruskal–Wallis test). Statistical analysis (Dunn’s test) of the load mass values also shows statistically significant differences within the same species depending on the wood assortment (S2a and S2ap) for Oak, Pine and Spruce (Figure 4). For Beech, Alder and Aspen species, assortment has no effect on the load mass of transported wood (Figure 4). The transported wood load mass values for Spruce, Larch, Pine S2a and Oak S2ap differ the most with the values for the other species and assortments (Figure 4).
The average load weight of 24 Mg of transported wood is lowest during the summer periods, and the highest value of 26 Mg is observed during the winter and autumn of 2022 (Figure 5). The smallest load masses of about 17 Mg are obtained for transports carried out in spring 2022 and summer 2020–2021. The largest cargo mass of 32 Mg is found for transports in autumn and winter. In all periods, there is a similar range of results of 11–13 Mg of cargo mass. Load weight is seasonally dependent, as confirmed by statistical analyses (Kruskal–Wallis test). There are no statistically significant differences for load mass between the years (2020–2022) in the same seasons for spring, summer and winter, and the results for autumn 2022 are different from autumn 2020 and 2021.
The average values of mass of 1 m3 of load from weighing the trucks for coniferous species ranges from 0.74 for Spruce S2ap (with a results range of 0.58–0.90 Mg·m−3) to 0.92 for Pine S2a with a range of 0.68–1.07 Mg·m−3. In the case of hardwood deliveries, the highest mean values of mass of 1 m3 of load from weighing the trucks at 1.07–1.10 Mg·m−3 occurs for Hornbeam and Beech, with a result range of 0.89–1.25 Mg·m−3 (Figure 6). The lowest value of 0.85 Mg·m−3 average mass of 1 m3 of load from weighing the trucks for deciduous deliveries is obtained for Lime S2a, with a result range of 0.70–1.00 Mg·m−3. The mass of 1 m3 of load from weighing the trucks is highly dependent on the species and wood assortments, which is confirmed by statistical analysis showing significant differences (Kruskal–Wallis test, p = 0.000).

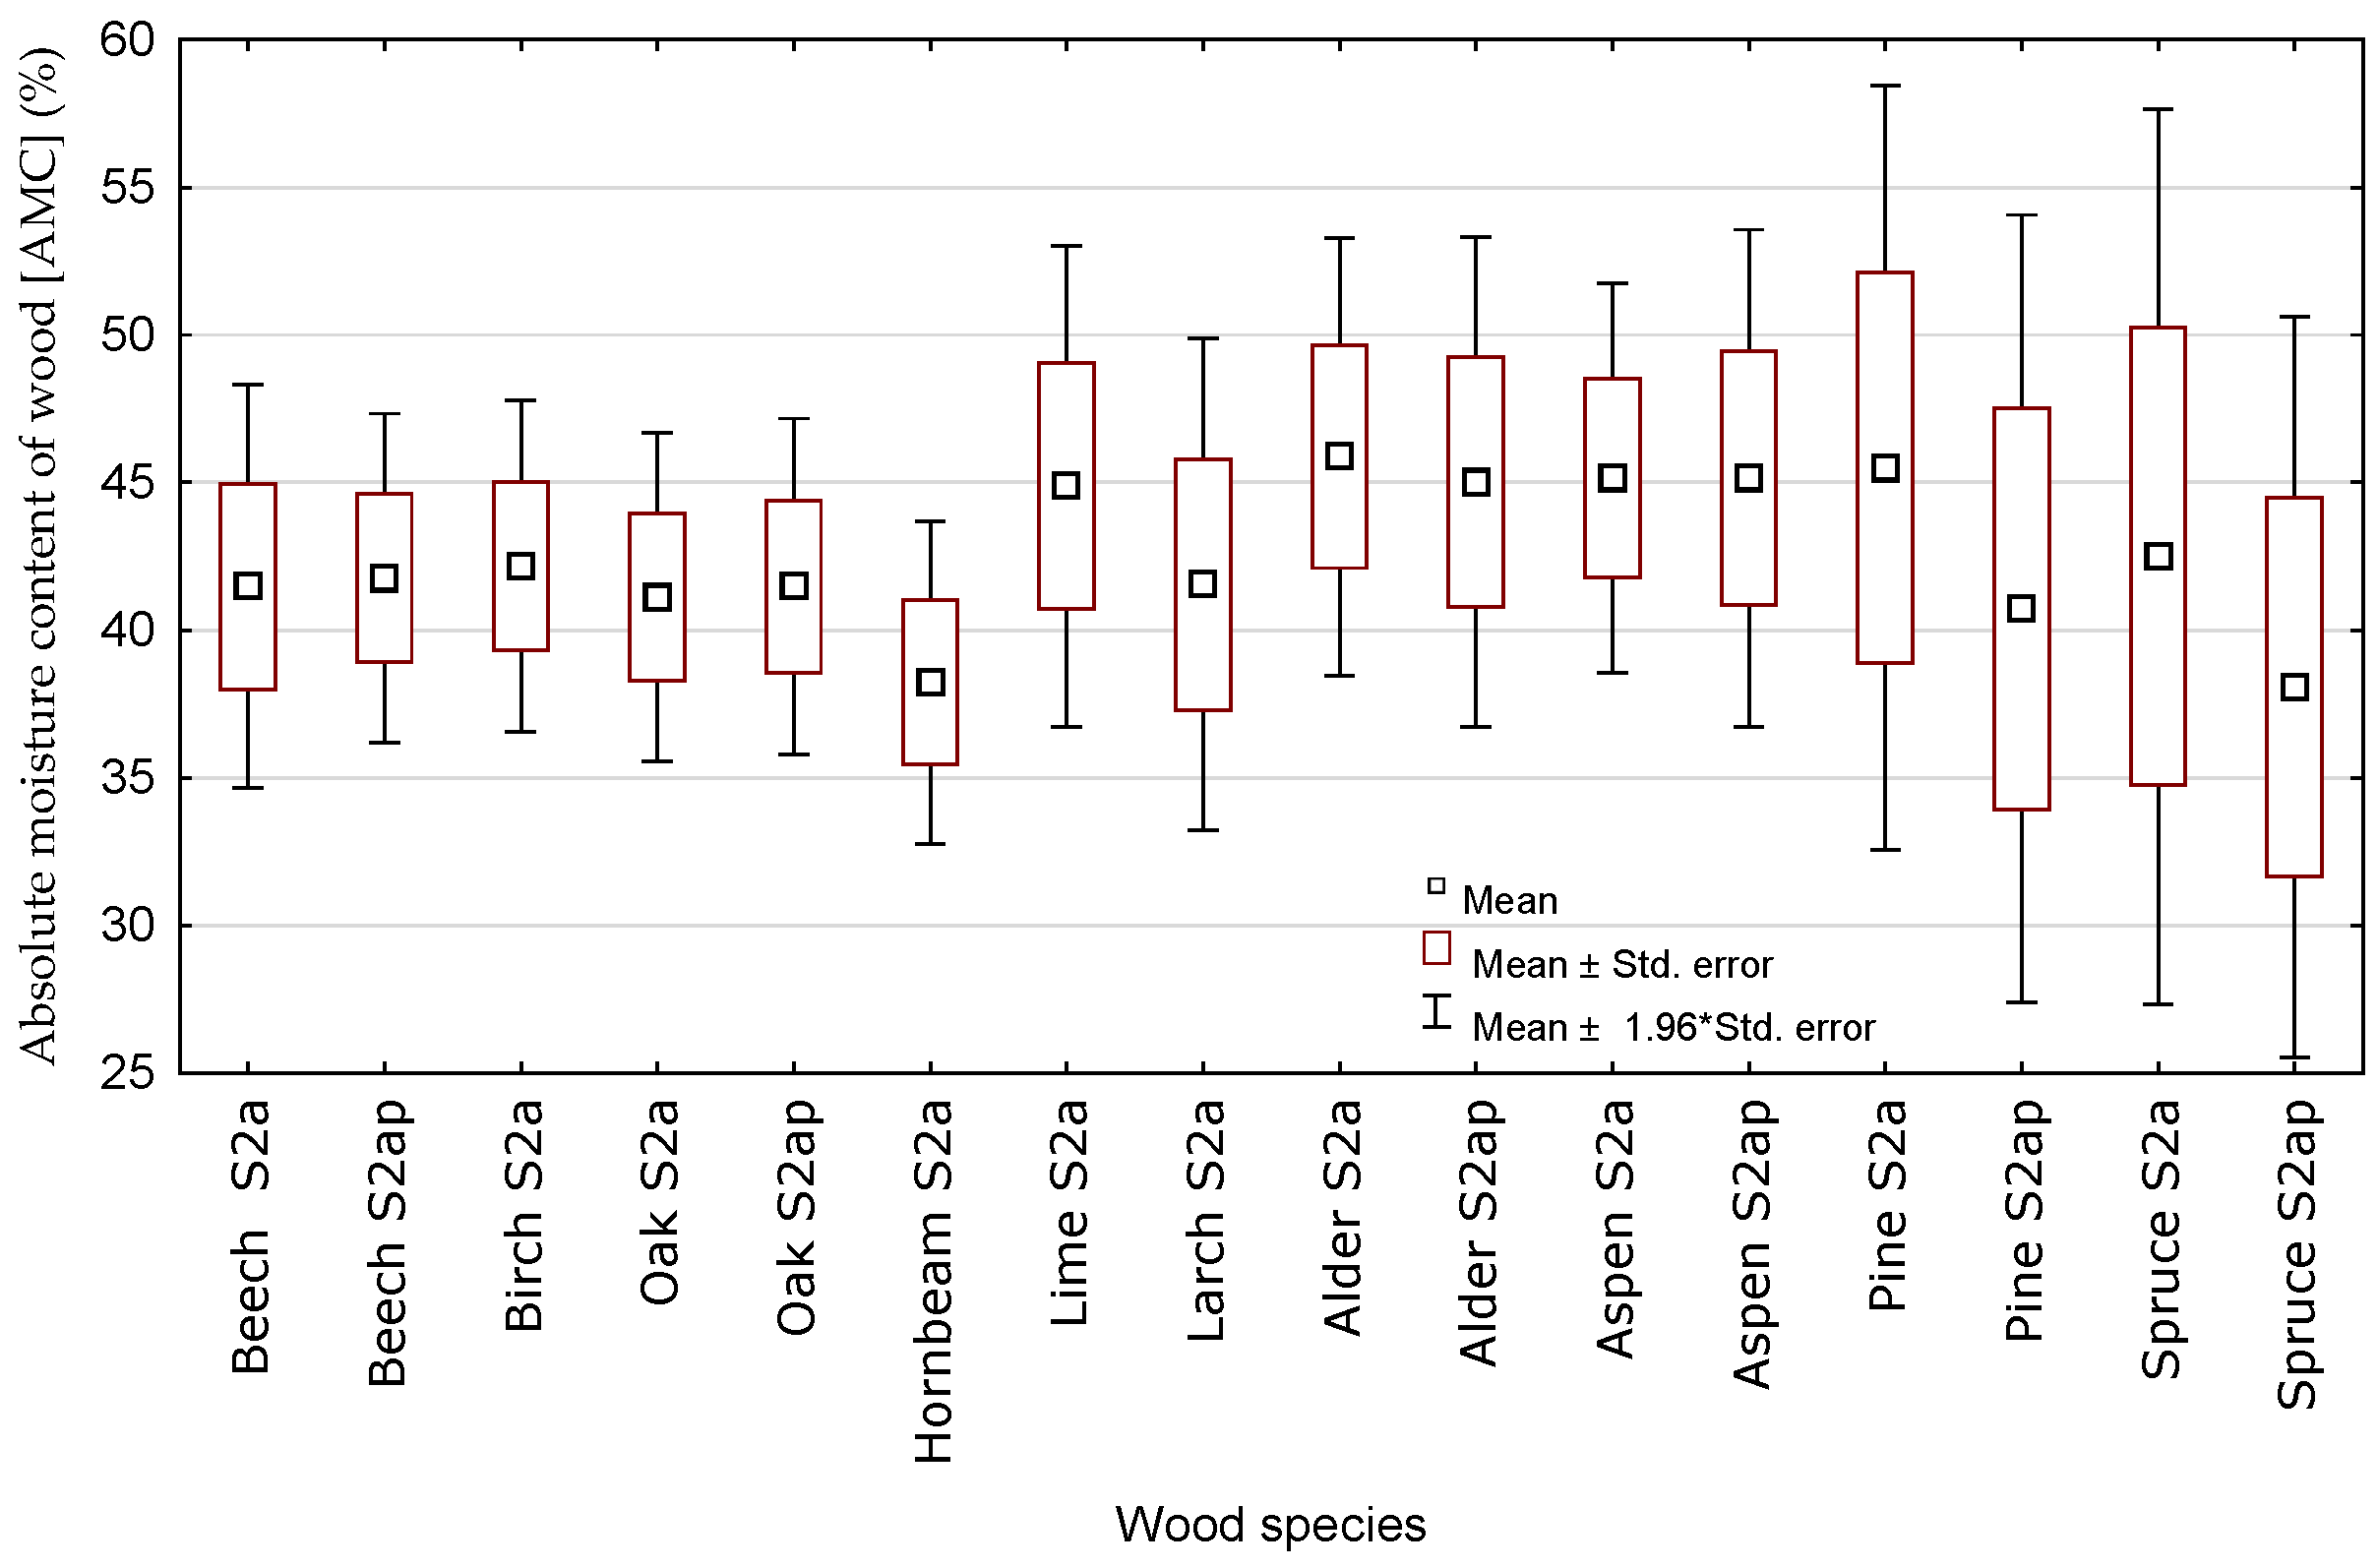
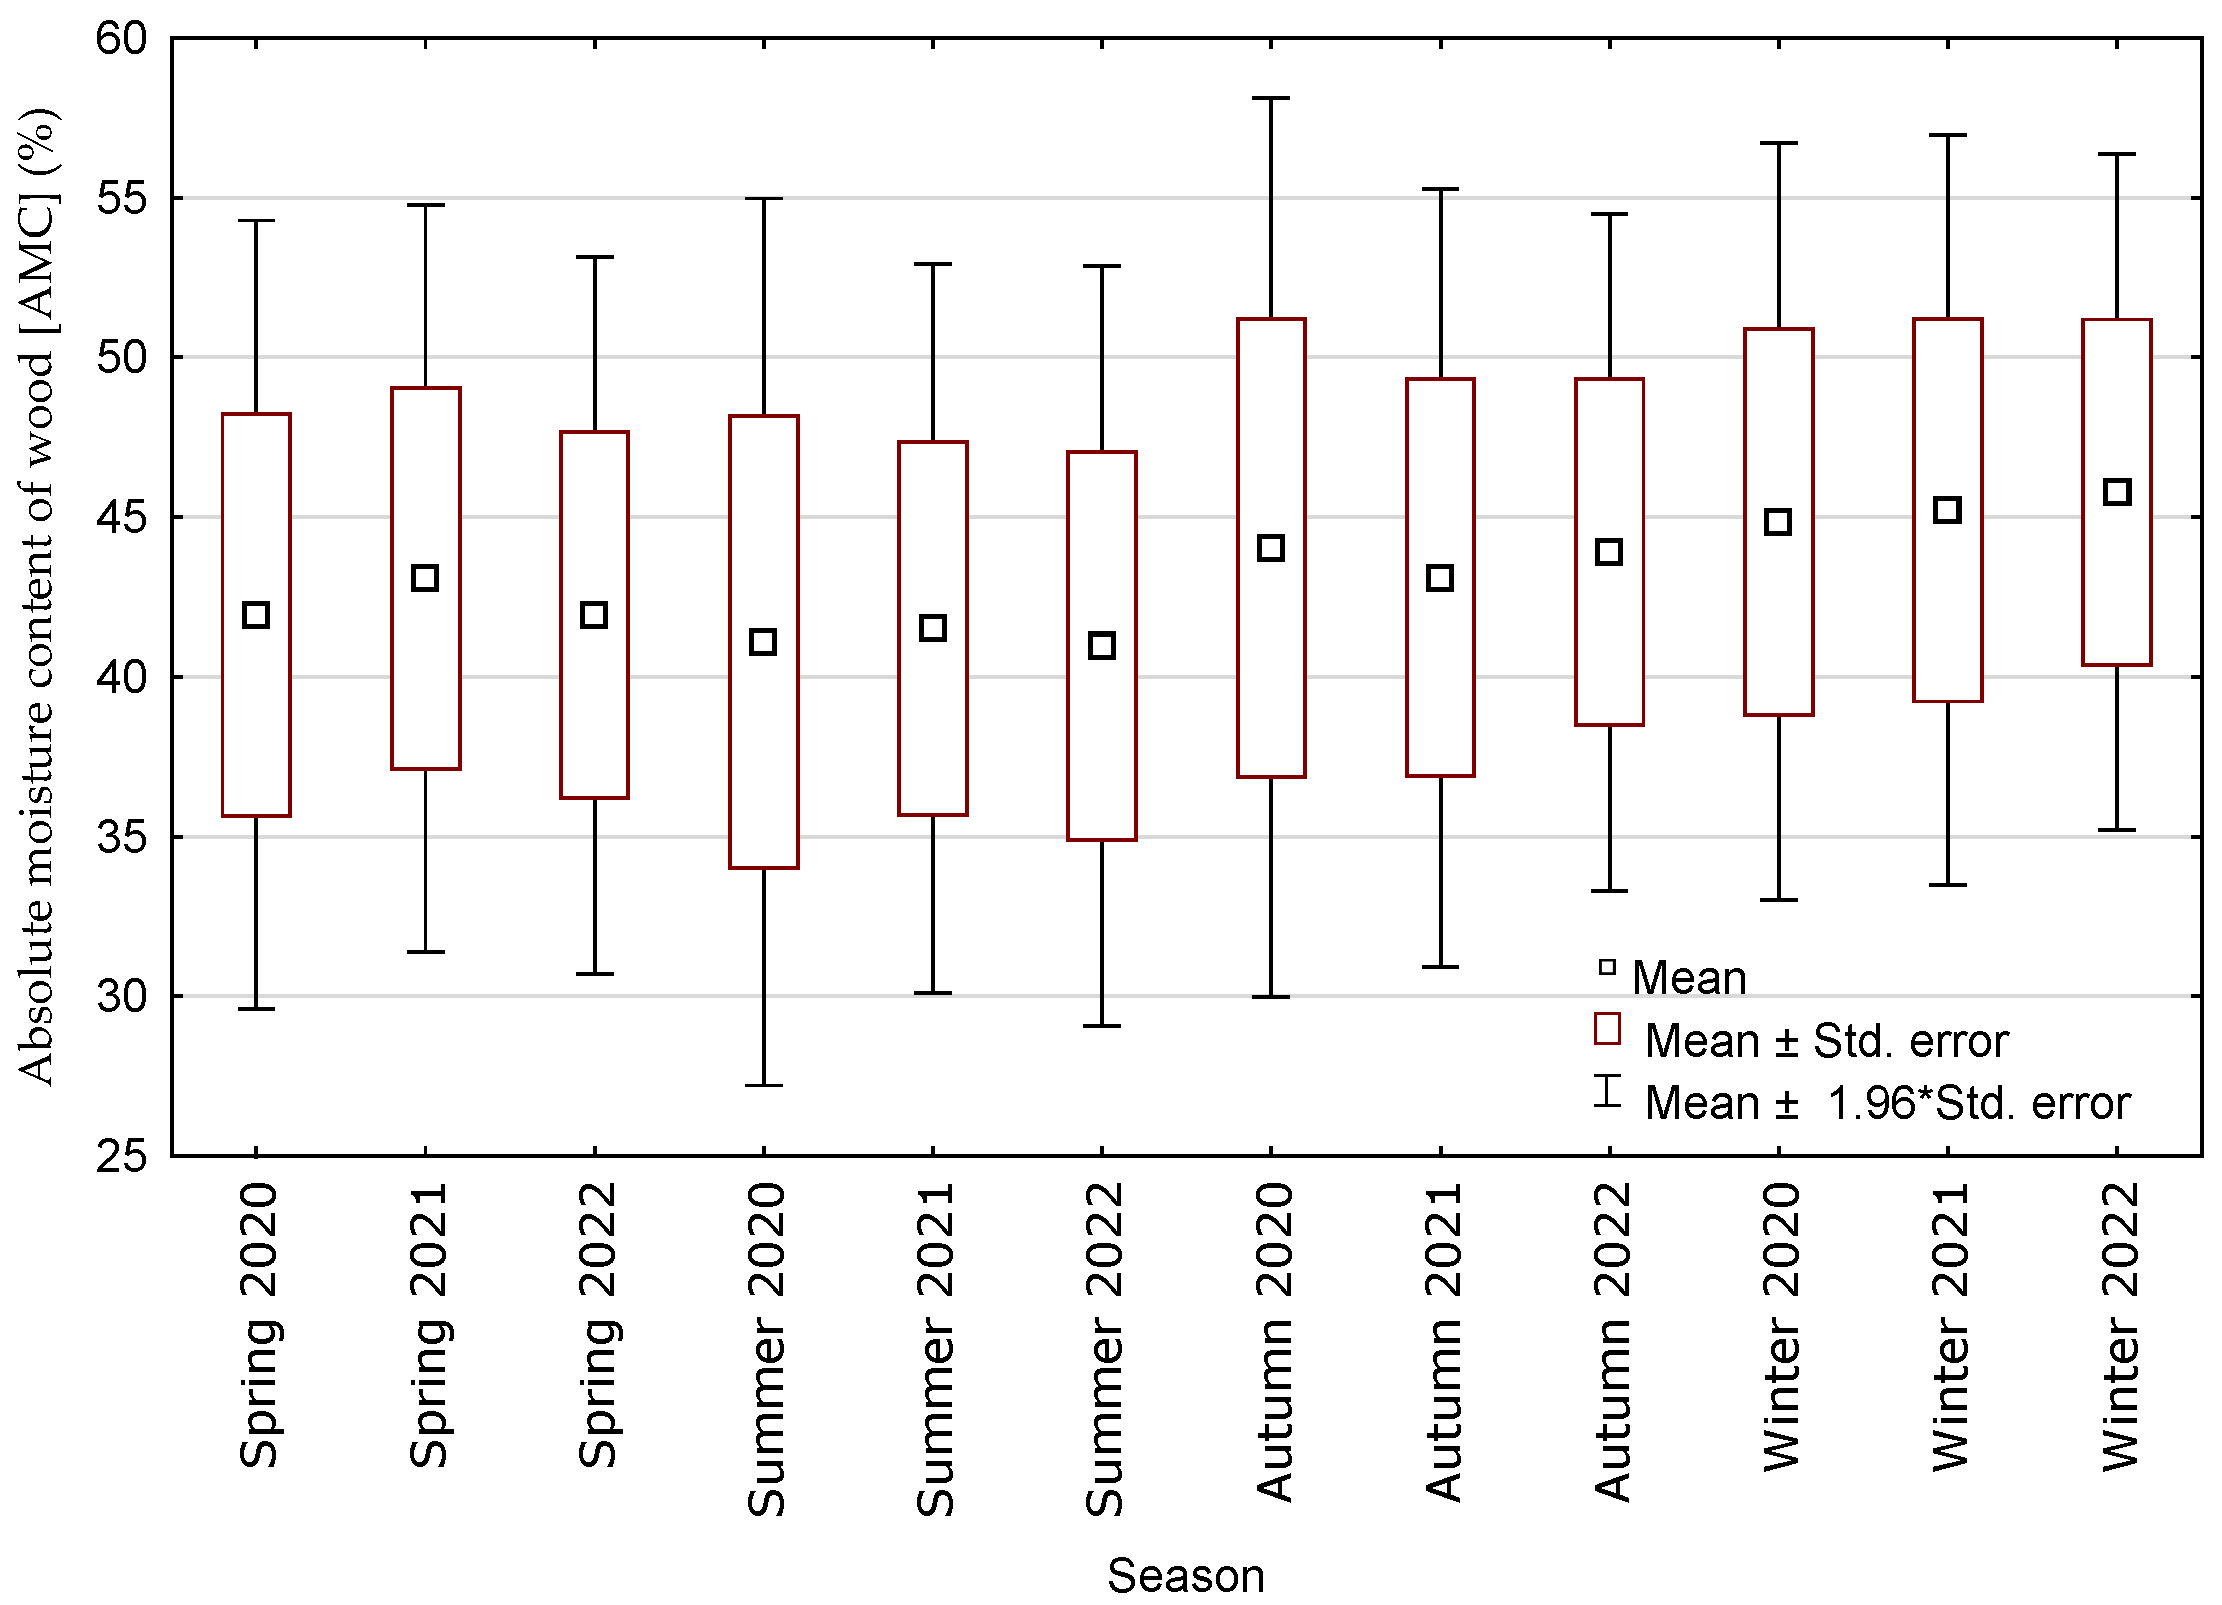
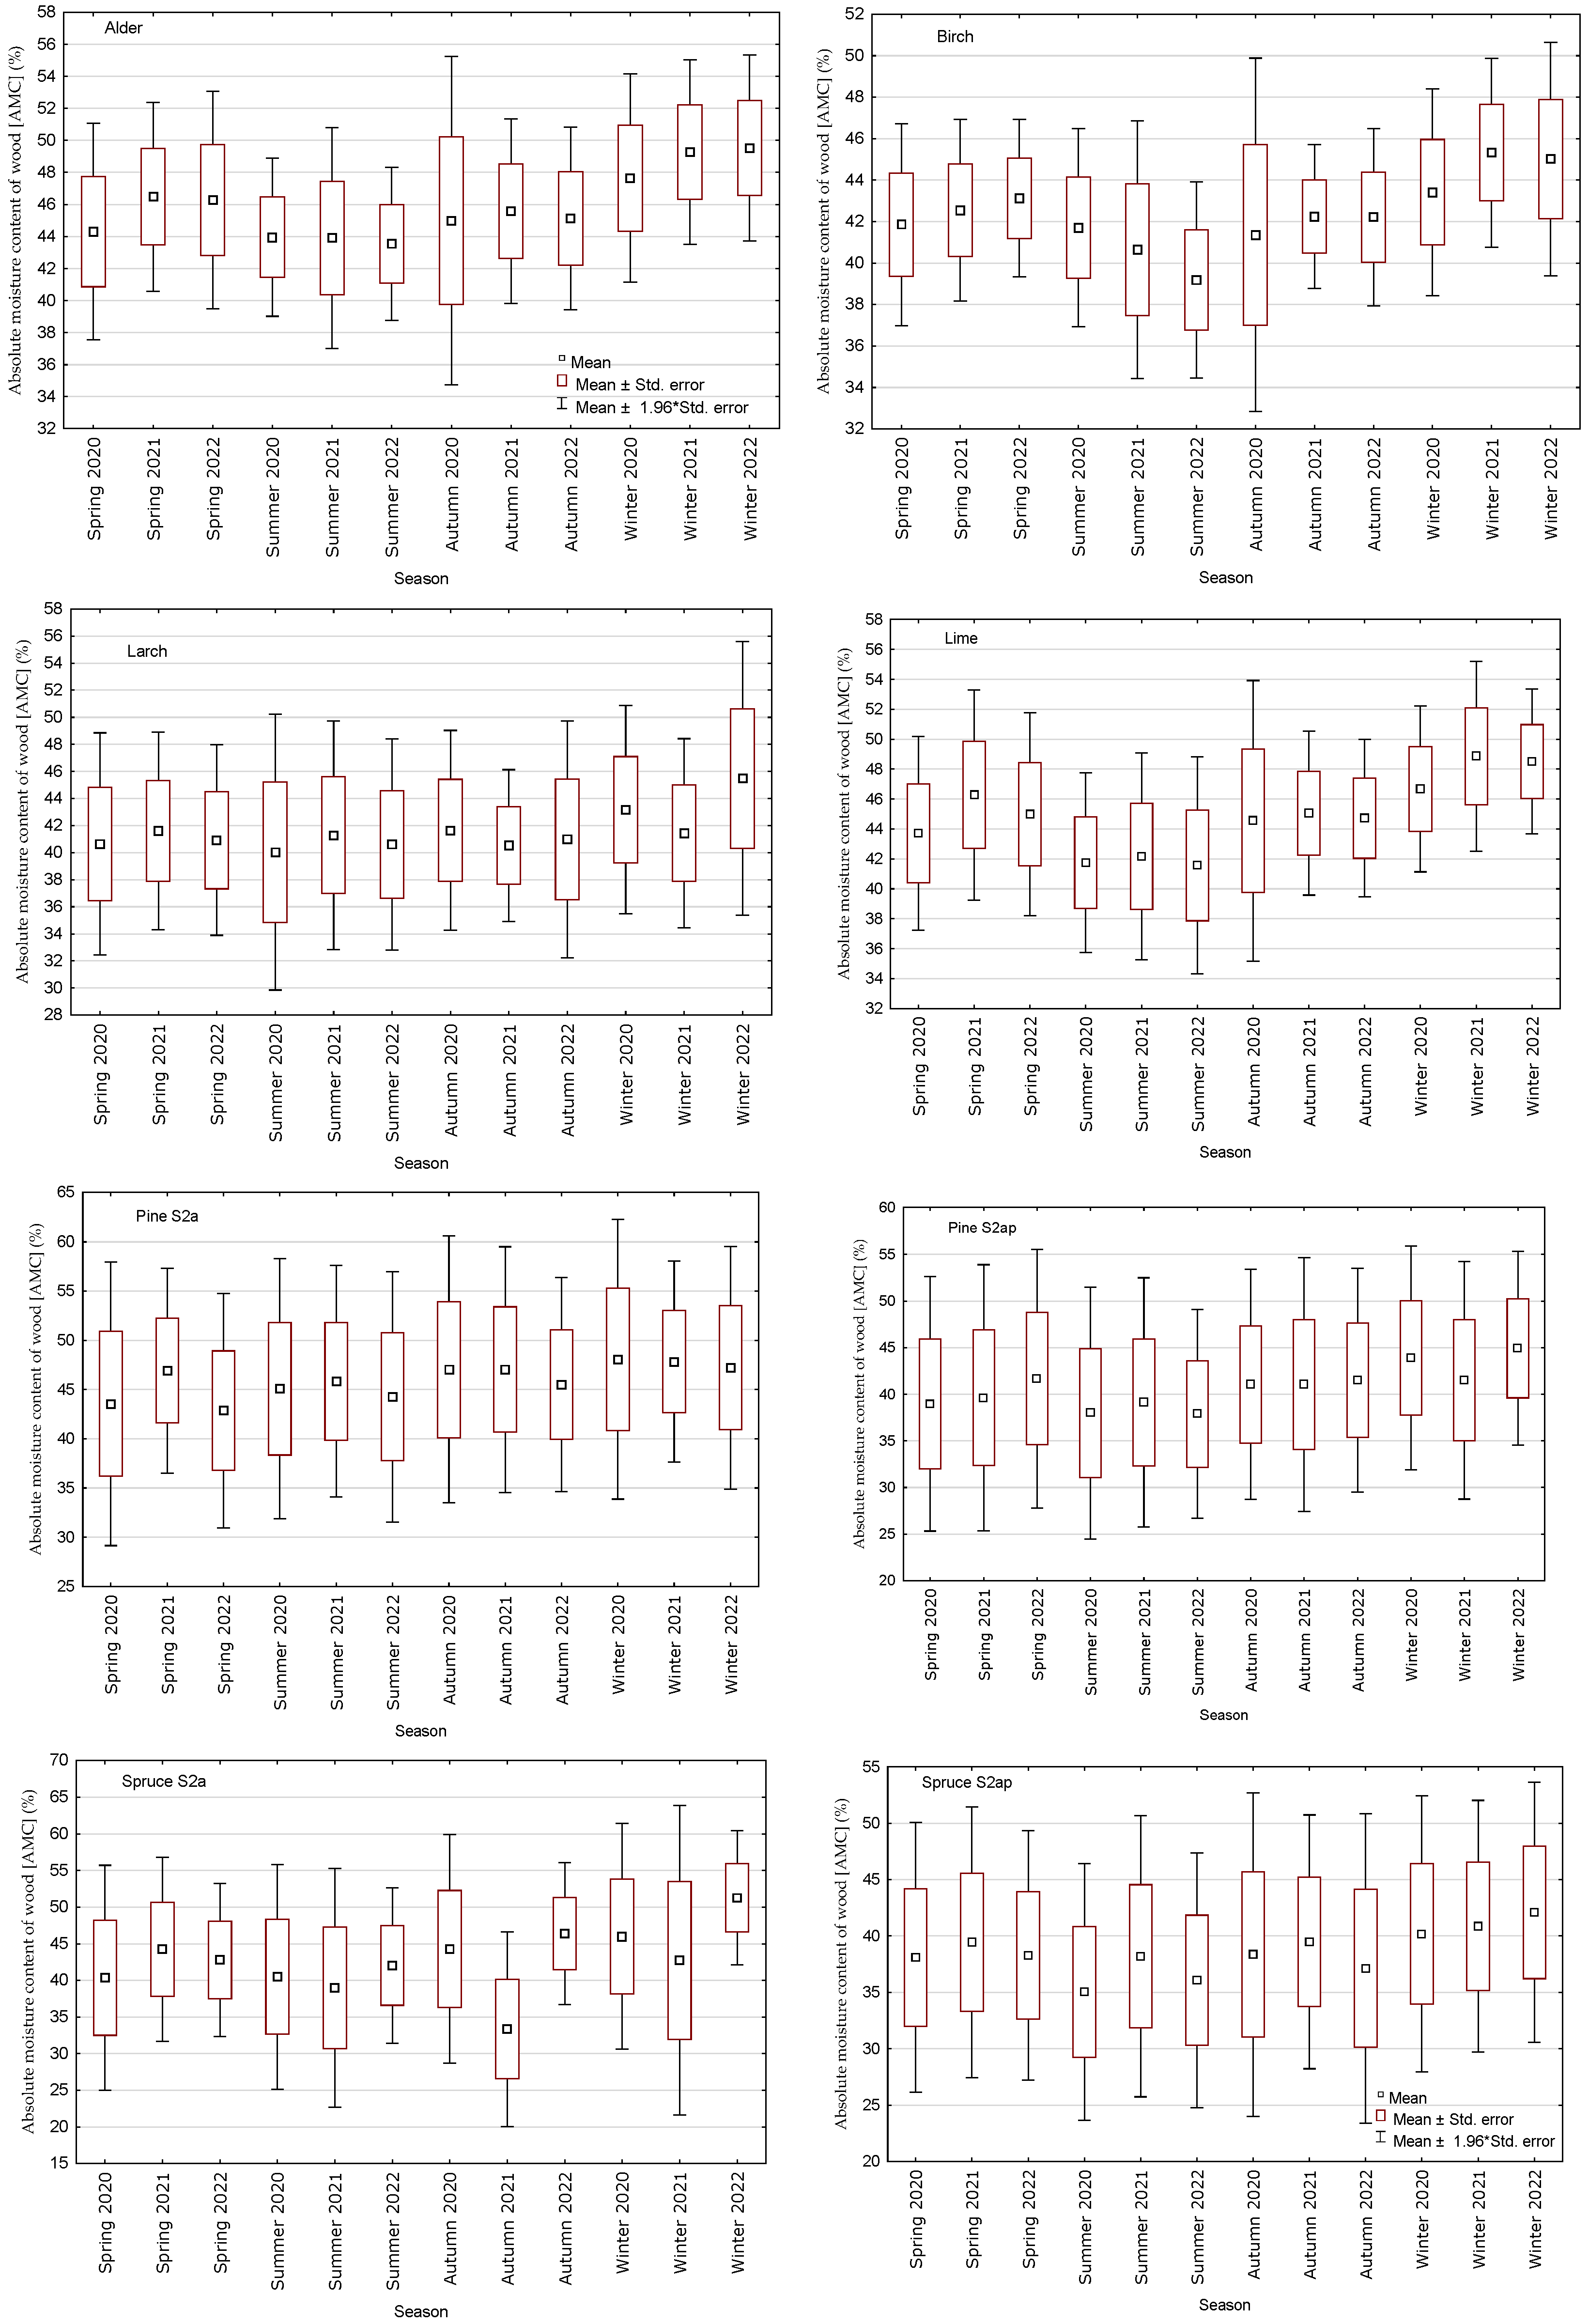
3.3. Absolute Moisture Content of Wood (AMC) Depending on Species, Wood Assortment and Delivery Season

In the mean values of absolute moisture content of wood (AMC), two characteristic groups can be distinguished, with a value of 42% (Beech, Birch, Oak and Larch) and a mean of 45% (Lime, Alder, Aspen), with a similar spread of results as well (Figure 7). Hornbeam and Spruce S2ap wood deliveries have the lowest mean of 38% absolute moisture content of wood. Coniferous wood shipments of spruce and pine are characterized by the smallest AMC values at 25%–27% and the largest at 57%–58%. Most shipments of deciduous species (Beech, Birch, Oak) are characterized by a small spread of AMC results at 35%–47%. In general, it can be concluded that the absolute moisture content of wood is related to the species of wood being transported (Kruskal–Wallis test p = 0.0000). In transports of deciduous species, statistical analysis of Dunn’s multi-sample rank mean comparison test shows no significant differences in absolute moisture content of wood for Beech, Birch, Oak, Alder, Lime and Aspen, where, at the same time, no differences also depend on wood assortments (S2a, S2ap). Statistical analysis (Dunn’s test) also shows no differences in AMC for Larch and Pine S2ap, with Beech, Birch and Oak (Figure 7).
The mean moisture contents of wood loads in the seasons are 40%–45%, with the lowest 40%–41% occurring in summer (Figure 8). In the summer of 2020, the smallest AMCs are observed at 25%, with about 30% for most periods (e.g., spring, summer 2021–2022, autumn 2020). Autumn 2020 and winters have the largest AMC values at 57%–58%. Despite such similar mean values, there are statistically significant differences in the AMC obtained between seasons (Kruskal–Wallis test). AMC values obtained in individual years for the same seasons also differ, and statistical analysis of Dunn’s multi-sample rank mean comparison test shows no significant differences for only a few comparisons, e.g., spring 2022 with 2022, summer 2022 with 2020 and 2021, autumn 2022 with 2021 and 2020, and winter 2021 with 2020 and 2022 (Figure 8).
With such differences in AMC, a detailed analysis was carried out for individual species and assortments, where measurements at a given season of the year showed more than 25 (Table 1) AMC values in relation to season (Figure 9). For shipments of Larch wood, the smallest value of 30% AMC occurred in summer 2020, and the largest value of almost 56% occurred in winter 2022. The spread of AMC results for transported Alder wood ranged from 35% (autumn 2020) to almost 56% (autumn 2020 and winters 2021–2022). A large spread of AMC results from 32% to 50% was observed for loads of Birch wood in autumn 2020. In shipments of Pine and Spruce wood, differences in AMC are observed depending on the wood assortment (S2a or S2ap). For Pine, the smallest value of 25% AMC occurs in spring and summer for S2ap, and for S2a, the smallest AMC is 29% (in spring 2020). In Spruce wood shipments, the smallest AMC of 20% was obtained for S2a in autumn 2021, and the largest of almost 65% was obtained in winter 2021. For Spruce wood shipments of the S2ap assortment, AMC values in different seasons range from 25% (summer, autumn 2020) to 54% (autumn, winter). Comparative analysis using the Kruskal–Wallis test of AMC results for individual species and assortments depending on the season of wood delivery showed statistically significant differences (Figure 9). The smallest differences are found for the Larch species, where only the results from winter 2022 differ from spring 2021, summer 2021 and 2022 and autumn 2022 (Figure 9 Larch). Statistical analysis of Dunn’s multi-sample rank mean comparison test showed no significant differences for AMC between the same seasons in different years for Larch (all), Alder (Autumn, Winter), Birch (Spring, Autumn), Lime (Summer, Autumn, Winter), Pine S2a (Summer, Winter), Pine S2ap (Spring, Summer, Autumn), Spruce S2a (Spring, Summer) and for Spruce S2ap (Spring, Autumn, Winter).
An analysis of the relationship between the absolute moisture content of AMC and selected load parameters was carried out using Spearman’s rank-order correlation test. The obtained statistically significant Spearman’s correlation coefficients between the selected studied characteristics are presented in Table 3. In the analyzed case, AMC moisture content is a factor that significantly influences load mass (Mg). There is also a strong relationship between the solid cubic meter and the species and assortment of the transported wood.

4. Discussion

This study analyzed transports for two wood assortments groups (S2a and S2ap) from 10 tree species (Table 1). This resulted in different numbers of transports for each species and assortments, ranging from 129 for Beech S2ap to 4133 for Pine S2a in different seasons. The result is a large spread of all results (regardless of species, sorting or season) shown in Table 1, with the conclusion that a large number of results are within a similar range of the first and third quartiles (Q1 and Q3). This distribution of results will affect the low standard deviations obtained (within the limits of statistical analysis) (except for the solid cubic meter), where its value is allowed to be six times smaller than the difference between the min and max values [30,31]. The issue of estimating the volume and mass of load of delivered wood in the context of changes in its moisture content and density is a common problem and is of practical importance in the transportation of round wood, which can contribute to underloading or overloading of vehicles [7,10,11,32].
Research conducted has shown a link between the absolute moisture content of wood and the mass of load, which affects the mass of 1 m3 of load from weighing the trucks (Mg·m−3) (Table 3). The correct determination of mass of 1 m3 of load from weighing the trucks (Mg·m−3) is important for selecting the appropriate mass of load in accordance with the permissible total weight (DCM) of the transport set [12,14,21,33,34].
The research conducted and the analysis of the results showed, unequivocally, that the absolute moisture content of wood a weight of load (AMC) depends on the season (Figure 1c) and the species of wood transported (Figure 7). These are not the only factors determining AMC, as there are also differences at the same seasons but in different years (2020–2022) (Figure 8). A more detailed analysis of absolute moisture content of wood a weight of load (AMC) for a particular species also shows differences in results for the same seasons (Figure 9), for example, for Alder (Spring, Summer) or Birch (Summer, Winter) and for Pine S2a differences for Spring, Autumn. This is, of course, consistent with reality and is influenced by several factors presented in other research:
  • Resulting from the natural variability of wood moisture content in living trees, where it is higher during the resting period and lower during the growing season [18,35,36].
  • Resulting from the rate at which wood dries from the time it is harvested to the time it is received at the processing plant, which is dependent on its laydown and weather conditions [37,38].
  • Resulting from different weather conditions in temperate climates in northern Poland, where there is usually high relative humidity of the air in autumn and winter, and lower in spring and summer [39].
Based on the information contained in the description of wood species [40], the standard density of pine fresh wood varies from 0.750 to 0.850 Mg m−3, with an average value of 0.820 Mg m−3. In accordance with Shmulsky and Jones [41], for freshly felled pine, the weight of 1 m3 is assessed on the level 0.750 Mg. The density of the round wood assortments depends on the part of the tree it comes from. The highest density of 0.816 Mg m−3 is specific for the butt-end section. The lowest values are observed in the upper parts of the tree, at 0.707 Mg m−3 [36]. The medium-size wood, for example, pine investigated in this research, came from all parts of the tree. The mean mass of 1 m3 of load (Figure 6) of 0.88–0.99 Mg m−3 (with result range 0.68–1.11) calculated from the quotient of weight and the volume of shipments is overestimated. The error is probably due to the method of determining the volume of the load [26,27]. The bark is not counted in this quantity, and its weight is added to the weight of the round wood shipments. Snow and ice sticking to the logs can affect the measurements results in winter periods.
The differences in the mass of 1 m3 of load from weighing the trucks and AMC in pine and spruce assortments S2a and S2ap can be connected with quality parameters. S2ap as an industrial wood has lower quality parameters in case of blue stain and decay than S2a, which is pulpwood assortment and must be delivered fresh. S2ap can be kept in the forest much longer than S2a and is not a priority for transportation. Longer time remaining in the forest has an effect on reducing moisture content, and in some cases, the bark may have already fallen off. The analysis of the results also indicates that the variation in the weight of the transported volume of pine wood is also affected by the season (Fig. Sc, Table 3), which is confirmed by the studies of Owus-Ababio and Schmitt [22] and Trzcinski et al. [23]. This study also shows that the weight of the load is determined by its moisture content and density, which is confirmed by previous studies [16,20,42,43].

5. Conclusions

Within the framework of this study, the research and analysis of loads of medium-size round wood were carried out depending on the season of delivery, tree species and wood assortment as well as the moisture content of the transported round wood.
Statistical analysis of the results and correlation coefficients showed correlations between the studied parameters, and the weight of the load mainly depends on its moisture content (AMC). The values of the average volume of transported round wood of 23–29 m3 are less for hardwood species than for other deciduous and coniferous. The volume of transported wood depends less on the season and mainly depends on the tree species and assortment of delivered wood.
Absolute moisture content of wood (AMC) and weight of load, where average values were obtained at 33%–49% (for each wood species and season), depend on the season and species of transported wood, with higher average values in winter.
Average round wood load weights range from 22 to 27 Mg and are highly dependent on the tree species and assortments of the transported wood as well as moisture content and the season, with higher average values occurring in the autumn and winter.

Author Contributions

Conceptualization and methodology, G.T.; software, G.T. and Ł.T.; validation, G.T. and Ł.T; formal analysis and data curation, G.T.; writing—original draft preparation, G.T. and Ł.T.; writing—review and editing, G.T. and Ł.T.; visualization, G.T. and Ł.T.; supervision and project administration and funding acquisition, G.T. All authors have read and agreed to the published version of the manuscript.

Funding

This research received no external funding.

Data Availability Statement

Data are contained within the article.

Conflicts of Interest

The authors declare no conflicts of interest.

References

  1. Greulich, F. Transportation networks in forest harvesting: Early development of the theory. In Proceedings of the International Seminar on New Roles of Plantation Forestry Requiring Appropriate Tending and Harvesting Operations, Tokyo, Japan, 29 September–5 October 2002; Yoshimura, T., Ed.; pp. 57–65. Available online: http://faculty.washington.edu/greulich/Documents/IUFRO2002Paper.pdf (accessed on 4 May 2025).
  2. Devlin, G.J.; McDonnell, K.; Ward, S. Timber haulage routing in Ireland: An analysis using GIS and GPS. J. Transp. Geogr. 2008, 16, 63–72. [Google Scholar] [CrossRef]
  3. Devlin, G.J.; McDonnell, K.M. Assessing real time GPS asset tracking for timber haulage. Open Transp. J. 2009, 3, 78–86. [Google Scholar] [CrossRef]
  4. McDonald, T.P.; Haridass, K.; Valenzuela, J. Mileage savings from optimization of coordinated trucking. In Proceedings of the 2010 COFE: 33rd Annual Meeting of the Council on Forest Engineering; Auburn, AL, USA, 6–9 June 2010, Mitchell, D., Gallagher, T., Eds.; Available online: https://research.fs.usda.gov/treesearch/41837 (accessed on 4 May 2025).
  5. Acuna, M.; Mirowski, L.; Ghaffariyan, M.R.; Brown, M. Optimizing transport efficiency and costs in Australian wood chipping operations. Biomass Bioenergy 2012, 46, 291–300. [Google Scholar] [CrossRef]
  6. Ghaffariyan, M.R.; Acuna, M.; Brown, M. Analysing the effect of five operational factors on forest residue supply chain costs: A case study in Western Australia. Biomass Bioenergy 2013, 59, 486–493. [Google Scholar] [CrossRef]
  7. Trzciński, G.; Moskalik, T.; Wojtan, R. Total weight and axle loads of truck units in the transport of timber depending on the timber cargo. Forests 2018, 9, 164. [Google Scholar] [CrossRef]
  8. Shaffer, R.M.; Stuart, W.B. A Checklist for Efficient Log Trucking. Virginia Cooperative Extension. 1998. USA. Available online: https://pdfs.semanticscholar.org/e6f8/f30602317d743b8c035bcdb27df9d99e52db.pdf (accessed on 4 May 2025).
  9. Sosa, A.; Klvac, R.; Coates, E.; Kent, T.; Devlin, G. Improving Log Loading Efficiency for Improved Sustainable Transport within the Irish Forest and Biomass Sectors. Sustainability 2015, 7, 3017–3030. [Google Scholar] [CrossRef]
  10. Hamsley, A.; Greene, W.G.; Siry, J.; Mendell, B. Improving timber trucking performance by reducing variability of log truck weights. South. J. Appl. For. 2007, 31, 12–16. [Google Scholar] [CrossRef]
  11. Brown, M. The Impact of Tare Weight on Transportation Efficiency in Australian Forest Operations. CRC for Forestry, Harvesting and Operations Bulletin 3, December 2008; University of the Sunshine Coast: Queenslan, Australia, 2008; Available online: https://research.usc.edu.au/esploro/outputs/workingPaper/The-impact-of-tare-weight-on/99450382202621 (accessed on 4 May 2025).
  12. Lukason, O.; Ukrainski, K.; Varblane, U. Economic benefit of maximum truck weight regulation change for Estonian forest sektor. Veokite täismassi regulatsiooni muutmise majanduslikud mõjud eesti metsatööstuse sektorile. Est. Discuss. Econ. Policy 2011, 19, 2. [Google Scholar] [CrossRef]
  13. Liimatainen, H.; Pöllänen, M.; Nykänen, L. Impacts of increasing maximum truck weight—Case Finland. Eur. Transp. Res. Rev. 2020, 12, 14. [Google Scholar] [CrossRef]
  14. Palander, T.; Kärhä, K. Potential traffic levels after increasing the maximum vehicle weight in environmentally efficient transportation system: The Case of Finland. J. Sustain. Dev. Energy Water Environ. Syst. 2017, 5, 417–429. [Google Scholar] [CrossRef]
  15. Wilson, S. Permissible Maximum Weights of Lorries in Europe. Available online: https://www.itf-oecd.org/permissible-maximum-weights-lorries-europe (accessed on 4 May 2025).
  16. Tymendorf, Ł.; Trzciński, G. Multi-Factorial Load Analysis of Pine Sawlogs in Transport to Sawmill. Forests 2020, 11, 366. [Google Scholar] [CrossRef]
  17. Statistical Yearbook of Forestry. Statistics Poland. Statistical Office in Białystok, Warsaw. 2024. Available online: https://stat.gov.pl/en/topics/statistical-yearbooks/statistical-yearbooks/statistical-yearbook-of-forestry-2024,12,7.html (accessed on 4 May 2025)(In Polish/English).
  18. Kozakiewicz, P. Fizyka Drewna w Teorii i Zadaniach (Physic of Wood in Theory and Practice), 4th ed.; Changed; SGGW: Warsaw, Poland, 2012; Available online: https://www.researchgate.net/publication/326557330 (accessed on 4 May 2025). (In Polish)
  19. Sosa, A.; Acuna, M.; McDonnell, K.; Devlin, G. Controlling moisture content and truck configurations to model and optimise biomass supply chain logistics in Ireland. Appl. Energy 2015, 137, 338–351. [Google Scholar] [CrossRef]
  20. Koirala, A.; Kizhal, A.R.; Roth, B.E. Perceiving Major Problems in Forest Products Transportation by Trucks and Trailers: A Cross-sectional Survey. Eur. J. Forest Eng. 2017, 3, 23–34. [Google Scholar]
  21. Kozakiewicz, P.; Tymendorf, Ł.; Trzciński, G. Importance of the Moisture Content of Large-Sized Scots Pine (Pinus sylvestris L.) Roundwood in Its Road Transport. Forests 2021, 12, 879. [Google Scholar] [CrossRef]
  22. Owusu−Ababio, S.; Schmitt, R. Analysis of Data on Heavier Truck Weights. Transp. Res. Rec. J. Transp. Res. Board 2015, 2478, 82–92. [Google Scholar] [CrossRef]
  23. Trzciński, G.; Tymendorf, Ł. Axle load on roundwood truck transport unit in relation to load, set type, season and gross vehicle weight. Wood 2020, 65, 210. [Google Scholar] [CrossRef]
  24. Kärhä, K.; Seuri, M.; Mac Donagh, P.; Acuna, M.; Kanzian, C.; Petković, V.; Robert Renato, C.G.; Costa, L.H.; Cruz, R.C.; Krumov, T.; et al. Overview of Global Long-Distance Road Transportation of Industrial Roundwood. Croat. J. For. Eng. 2024, 45, 217–236. [Google Scholar] [CrossRef]
  25. PN-91D-95018; Round Wood. Medium-Sized Wood. Common Requirements and Tests. Polish Standardization Committee: Warsaw, Poland, 2002. (In Polish)
  26. PN-93/D-02002; Round Wood. Classification, Terminology and Symbols. Polish Standardization Committee: Warsaw, Poland, 2002. (In Polish)
  27. General Directorate of the State Forests. Zarządzenie nr 51 Dyrektora Generalnego Lasów Państwowych z dnia 30.09.2019 r. Regulation No. 51 of the General Director of the State Forests of 30.09.2019; General Directorate of the State Forests: Warsaw, Poland, 2019. Available online: http://drewno.zilp.lasy.gov.pl/drewno/Normy/1._podzia_terminologia_i_symbole_-_ujednolicono_wg_zarz_54-2020.pdf (accessed on 4 May 2025). (In Polish)
  28. PN-D-95000; Round Wood. Measurement, Volume Calculation and Hallmarking. Polish Standardization Committee: Warsaw, Poland, 2002. (In Polish)
  29. EN 13183-1:2002; Moisture Content of a Piece of Sawn Timber—Part 1: Determination by Oven Dry Method. Comité Européen de Normalisation (CEN): Brussels, Belgium, 2002. Available online: https://standards.iteh.ai/catalog/standards/cen/ebaf1b83-ed78-4bfe-838f-b02fef750459/en-13183-1-2002 (accessed on 4 May 2025).
  30. Murphy, K.R.; Myors, B. Statistical Power Analysis: A Simple and General Model for Traditional and Modern Hypothesis Tests, 2nd ed.; Lawrence Erlbaum Associates: London, UK, 2004; Available online: https://cdn.preterhuman.net/texts/unsorted2/Stock%20books%20030/K%20R%20Murphy,%20B%20Myors%20-%20Statistical%20Power%20Analysis.pdf (accessed on 2 May 2025).
  31. Dixon, P.M.; Garrett, K.A. Sampling ecological information: Choice of sample size, reconsidered. Ecol. Model. 1993, 68, 67–73. [Google Scholar] [CrossRef]
  32. McDonell, K.M.; Devlin, G.J.; Lyons, J.; Russell, F.; Mortimer, D. Assessment of GPS tracking devices and associated software suitable for real time monitoring of timber haulage trucks. In Annual Report; COFORD: Ireland, UK, 2008; Available online: https://www.coford.ie/media/coford/content/publications/projectreports/annualreports/2008-AR-E.pdf (accessed on 4 May 2025).
  33. Trzciński, G.; Tymendorf, Ł.; Kozakiewicz, P. Parameters of Trucks and Loads in the Transport of Scots Pine Wood Biomass Depending on the Season and Moisture Content of the Load. Forests 2021, 12, 223. [Google Scholar] [CrossRef]
  34. Kühmaier, M.; Erber, G. Research trends in European forest fuel supply chains: A review of the last ten years (2007–2016)—Part two: Comminution, transport & logistics. Croat. J. For. Eng. 2018, 39, 139–152. [Google Scholar]
  35. Millers, M.; Magaznieks, J. Scots Pine (Pinus sylvestris L.) Stem Wood and Bark Moisture and Density Influencing Factors. In Proceedings of the Research for Rural Development, Annual 18th International Scientific Conference Proceedings, Jelgava, Latvia, 16–18 May 2012; Volume 2, pp. 91–96. Available online: https://www2.llu.lv/research_conf/Proceedings/18th_volume2.pdf (accessed on 4 May 2025).
  36. Tomczak, A.; Jelonek, T. Green density of Scots pine (Pinus sylvestris L.) sapwood coming from selected stands north-western Poland. For. Lett. 2014, 107, 5–9. (In Polish) [Google Scholar]
  37. Tomczak, A.; Wesołowski, P.; Jelonek, T.; Jakubowski, M. Weight loss and green density changes of Scots pine pulpwood harvested and stored during the summer. Sylwan 2016, 160, 619–626. (In Polish) [Google Scholar]
  38. Tomczak, K.; Tomczak, A.; Jelonek, T. Effect of Natural Drying Methods on Moisture Content and Mass Change of Scots Pine Roundwood. Forests 2020, 11, 668. [Google Scholar] [CrossRef]
  39. Korzuchowski, K. Klimat Polski. In Climate of Poland, Edition I; Polish Scientific Publishers PWN: Warsaw, Poland, 2011. (In Polish) [Google Scholar]
  40. Wagenführ, R. Holzatlas. In Mit 890 Zum Teil Mehrfarbigen Bildern (Wooden Atlas. With 890 Partly Multicolored Pictures); VEB Fachbuchverlag Leipzig: Leipzig, Germany, 2007. (In German) [Google Scholar]
  41. Shmulsky, R.; Jones, P.D. Forest Products and Wood Science, 6th ed.; Wiley-Blackwell: Chichester, UK; Ames, IA, USA, 2011; ISBN 978-0-8138-2074-3. [Google Scholar]
  42. Erber, G.; Kanzian, C.; Stampfer, K. Modelling natural drying of European beech (Fagus sylvatica L.) logs for energy based on meteorological data. Scand. J. For. Res 2016, 31, 294–301. [Google Scholar] [CrossRef]
  43. Beardsell, M.G. Decreasing the Cost of Hauling Timber through Increased Payload. Ph.D. Thesis, Virginia Polytechnic Institute and State University, Blacksburg, VA, USA, 1986. Available online: https://vtechworks.lib.vt.edu/handle/10919/53617 (accessed on 4 May 2025).
Figure 1. Characteristics of round wood load parameters depending on the delivery date: (a) solid cubic meter (m3), (b) mass of load (Mg), (c) mass of 1 m3 of load from weighing the trucks (Mg·m−3), (d) absolute moisture content of wood (AMC) (%).
Forests 16 00897 g001aForests 16 00897 g001b
Figure 2. Characteristics of solid cubic meter m3 depending on the tree species and assortment of transported wood.
Forests 16 00897 g002
Figure 3. Characteristics of solid cubic meter m3 depending on the season of delivery.
Forests 16 00897 g003
Figure 4. Mass of load (Mg) depending on the species and assortment of transported round wood.
Forests 16 00897 g004
Figure 5. Characteristics of mass of load (Mg) depending on the season of wood delivery.
Forests 16 00897 g005
Figure 6. Mass of 1 m3 of load from weighing the trucks (Mg·m−3) depending on the species and assortment of transported round wood.
Forests 16 00897 g006
Figure 7. Characteristic of absolute moisture content of wood (AMC) (%) depending on tree species and assortments of delivered wood.
Forests 16 00897 g007
Figure 8. Characteristic of absolute moisture content of wood (AMC) (%) depending on season of wood delivery.
Forests 16 00897 g008
Figure 9. Characteristics of the absolute moisture content of wood (AMC) (%) for tree species and wood assortments depending on the season of delivery.
Forests 16 00897 g009
Table 1. Round wood deliveries data collected for analysis.
Year202020212022Total
Season
Wood species
SpringSummerAutumnWinterSpringSummerAutumnWinterSpringSummerAutumnWinter
Beech S2a32202424323301441612211
Beech S2ap6530161451022111126129
Birch S2a2562068920828362926385187301084
Oak S2a0000084038263149156
Oak S2ap000005421048314363260
Hornbeam S2a24166922159221910531188
Lime S2a77871284313711552867679741031057
Larch S2a2336293712988153123296141542
Alder S2a758098311121466312134449639939
Alder S2ap176200171621241591710172
Aspen S2a2515292030421515141103219
Aspen S2ap5121147111623613717132
Pine S2a4386025781882051961751675062945482364133
Pine S2ap11890174951129987113778388831219
Spruce S2a15422021967192322247416053271062
Spruce S2ap843881938124227814014022317963882099
Total1305176515977851118118469783212271034120085813,602
Table 2. Characterization of round wood load parameters.
MeasureMeanSDMinMaxQ1MedianQ3
Mass of load (Mg)24.953.3613.9238.2022.6625.0227.24
Solid cubic meter (m3)28.182.4019.0051.2927.9028.0029.00
Mass of 1 m3 of load from weighing the trucks (M1 m3) (Mg·m−3)0.890.120.491.460.810.900.97
Absolute moisture content of wood (AMC) (%)42.916.4115.6466.7939.5243.3847.06
Notes: SD—standard deviation; Q1—first quartile; Q3—third quartile.
Table 3. Spearman correlation coefficients for the analyzed parameters.
MeasureSolid Cubic Meter (m3)Mass of Load (Mg)Absolute Moisture Content of Wood (%)Wood SpeciesSeason YearMass of 1 m3 of Load (Mg·m−3)
Solid cubic meter (m3)x0.2382-0.4442-−0.3283
Mass of load (Mg)0.2382x0.4894−0.26730.20860.7843
Absolute moisture content of wood (%)-0.4894x−0.15370.19690.4320
Wood species0.4442−0.2673−0.1537x−0.0427−0.5382
Season year-0.20860.1969−0.0427x0.2159
Mass of 1 m3 of load (Mg·m−3)−0.32830.78430.4320−0.53820.2159x
- means no statistically significant correlation.
Disclaimer/Publisher’s Note: The statements, opinions and data contained in all publications are solely those of the individual author(s) and contributor(s) and not of MDPI and/or the editor(s). MDPI and/or the editor(s) disclaim responsibility for any injury to people or property resulting from any ideas, methods, instructions or products referred to in the content.

